Introduction
Hyperglycemia has been shown to cause several of the
pathological consequences of type 1 and type 2 diabetes mellitus
(1). It is well-established that
hyperglycemia results in reactive oxygen species (ROS)
overproduction through increased input of metabolic substrate into
the mitochondria, which deregulates the electron transport system
(1). ROS are produced by various
aerobic metabolism signaling pathways; however, the primary source
of their production is the mitochondria, which produce ROS as a
by-product of the electron transport chain (ETC) during cellular
respiration (2,3). The elevated production of ROS by the
mitochondrial respiratory chain during hyperglycemia has been
suggested as a key initiator of tissue damage in
diabetes-associated microvascular complications, including diabetic
nephropathy (1,4).
Mammalian mitochondria possess their own genome,
which consists of a single, circular double-stranded mitochondrial
DNA (mtDNA) molecule of 16,569 base pairs (5). mtDNA encodes essential components of
complexes of the ETC, including seven nicotinamide adenine
dinucleotide dehydrogenase (ND) subunits (ND1, ND2, ND3, ND4, ND4L,
ND5 and ND6) of NADH dehydrogenase (complex I), the cytochrome
b (CYTB) subunit of the ubiquinol-cytochrome c
oxidoreductase (complex III), three subunits (COI, COII and COIII)
of cytochrome c oxidase (complex IV) and the ATPase 6 and 8
subunits of complex V, as well as ribosomal and transfer RNAs,
which are necessary for protein production within the mitochondria
(6,7).
mtDNA is prone to oxidative damage and several
factors are considered to contribute to the enhanced susceptibility
of mtDNA to this damage (7,8).
mtDNA is located in the matrix, which is in proximity to the
ROS-generating respiratory chain; it lacks an efficient DNA repair
mechanism and protective proteins, including histones (7,8).
Therefore mtDNA, which encodes the majority of respiratory chain
proteins, is continuously subjected to ROS attack. The accumulation
of oxidative damage to mtDNA and mitochondria may induce a
respiratory defect, which increases the leakage of ROS from the
ETC, leading to an increase in the production of ROS in the
mitochondria and the induction of further oxidative damage
(9).
Deficits in the activity of the ETC enzymes and
mitochondria have been reported in several diseases where oxidative
stress is important (9–12), and are associated with altered
expression of mtDNA-encoded genes or mtDNA content with age
(13,14).
Oxidative stress and hyperglycemia-induced
disturbance of various mitochondrial functions have been linked to
diabetes and its complications (15,16).
Furthermore, changes in the activities of mitochondrial complexes
have been associated with renal dysfunction in the kidney of
diabetic rats during the early stages of diabetes (17).
Considering the importance of mitochondria and ETC
complexes in the generation of ROS during hyperglycemia in diabetic
complications, the present study aimed to examine changes in the
expression of mtDNA-encoded genes of respiratory chain complex
enzymes in human renal mesangial cells in response to high
glucose-induced ROS overproduction. The concept that oxidative
stress, primarily driven by mitochondrial superoxide, underlies
diabetic complications means that interventions and therapies that
modify mitochondrial function may aid in the development of new
treatments for diabetes-associated complications.
Materials and methods
Cell culture
Human renal mesangial cells (cat. no. 4200) were
obtained from ScienCell Research Laboratories (Carlsbad, CA, USA),
and maintained in Dulbecco's modified Eagle's medium (DMEM;
Sigma-Aldrich, St. Louis, MO, USA) supplemented with 10 mmol/l
HEPES, 20% fetal bovine serum, 100 U/ml penicillin and 100
µg/ml streptomycin (Sigma-Aldrich) in a humidified
atmosphere containing 5% CO2 at 37°C, as previously
described (18–20). Cells from the third to sixth
passage were grown to confluence. Prior to seeding, the growth was
arrested in serum-free medium for 24 h to favor the selection of
quiescent cells. The cells were then seeded in triplicate at a
density of 1×10⁶ in DMEM media supplemented with either
5 mM glucose (normal glucose) or 25 mM glucose (high glucose). The
cells were incubated for 24 h at 37°C, and were used for the
subsequent ROS assay, and assessment of RNA and protein expression
levels.
Detection of mitochondrial ROS using
confocal microscopy and flow cytometry
The mitochondrial fluorogenic dye, MitoSOX red probe
(Invitrogen; Thermo Fisher Scientific, Inc., Waltham, MA, USA), was
used to assess mitochondrial ROS production in the human renal
mesangial cells using confocal microscopy, as previously described
(18). This probe selectively
targets mitochondria and is readily oxidized by superoxide. The
synchronized quiescent cells were seeded onto glass coverslips and
incubated for 24 h at 37°C in 5 mM glucose (normal glucose) or 25
mM glucose (high glucose). The cells were then loaded with MitoSOX
red (5 mM) for 20 min at 37°C, and washed three times with warm
phosphate-buffered saline (PBS). Images of the cells were captured
using a Zeiss LSM 510 confocal laser microscope (Zeiss AG,
Oberkochen, Germany) at an excitation wavelength of 514 nm and an
emission wavelength of 560 nm.
Zeiss software (version 3.2; Zeiss AG) was used to
calculate the mean fluorescence intensity of the MitoSOX
red/mm2 cell area.
To perform flow cytometric analysis of mitochondrial
ROS, the cells were incubated with either 5 or 25 mM glucose for 24
h at 37°C, washed with warm PBS, and loaded with 5 mM MitoSOX red
for 20 min at 37°C. Following incubation, the cells were washed
again with PBS, collected by centrifugation (500 × g for 5 min at
25°C), and then resuspended in PBS. The cells were analyzed at 514
nm excitation to measure oxidized MitoSOX red, and with a 560 nm
barrier filter using a flow cytometer (FACScan; BD Biosciences,
Franklin Lakes, NJ, USA).
RNA extraction and cDNA preparation
Total RNA (5 mg) was isolated from the human renal
mesangial cells using TRIzol® reagent (Invitrogen;
Thermo Fisher Scientific, Inc.), according to the manufacturer's
protocol. All RNA samples were treated with DNase using a TURBO
DNA-free™ kit (Invitrogen; Thermo Fisher Scientific, Inc.) and were
reverse transcribed to cDNA, as previously described (19,20).
The cDNA samples were stored at −20°C until usage.
Primers and reverse
transciption-polymerase chain reaction (RT-PCR)
Primers for ND2, CYTB, COI and ATPase 6 (Table I), encoded by the mitochondrial
genome were designed using National Center for Biotechnology
Information database (http://www.ncbi.nlm.nih.gov/), in accordance with the
human mtDNA sequence. The housekeeping gene, β-actin, was used as
an internal control (Table I). All
primers were synthesized by Sigma-Aldrich. RT-PCR was performed
using a OneStep RT-PCR kit (Qiagen GmbH, Hilden, Germany). The
reaction mixture (25 µl total volume) contained reverse
transcription buffer (l0 X), dNTP mix (100 mM), forward and reverse
primers (50 ng/µl each), cDNA (10 ng) and heat-stable
Taq DNA polymerase (500 U/µl). The amplification
reactions were performed in 30 cycles using an automated thermal
cycler (2400; PerkinElmer, Inc., Waltham, MA, USA) with the
following thermocycling conditions: Denaturation at 95°C for 5 min,
annealing for 1.5 min and extension at 70°C for 7 min. The
annealing temperature of each primer is presented in Table I.
 | Table IPrimer sequences of mitochondrial ND2,
CYTB, COI, ATPase 6 and nuclear β-actin. |
Table I
Primer sequences of mitochondrial ND2,
CYTB, COI, ATPase 6 and nuclear β-actin.
| Target gene | Primer sequence
(5′-3′) | Size of PCR product
(bp) | Annealing temperature
(°C) |
|---|
| ND2 | Forward,
CACAGAAGCTGCCATCAAGTA
Reverse, CCGGAGAGTATATTGTTGAAGAG | 89 | 62 |
| CYTB | Forward,
TCATCGACCTCCCCACCCCATC
Reverse, CGTCTCGAGTGATGTGGGCGATT | 165 | 58 |
| COI | Forward,
TCATGATCACGCCCTCATA
Reverse, CATCGGGGTAGTCCGAGTAA | 222 | 60 |
| ATPase 6 | Forward,
GCCCTAGCCCACTTCTTACC
Reverse, TTAAGGCGACAGCGATTTCT | 256 | 60 |
| β-actin | Forward,
ACAGAGCCTCGCCTTTGC
Reverse, GTTGGCCTTGGGGTTCAGG | 399 | 65 |
RT-qPCR
The mRNA expression levels of mtDNA-encoded ND2,
CYTB, COI and ATPase 6 were determined using RT-qPCR. Prior to
RT-qPCR, standards in a dilution series, containing between
1×10⁷ and 1×10² copies/µl of each
gene, were prepared from the purified RT-PCR products, and were
used as calibration curves in the RT-qPCR runs. RT-qPCR was
performed using a FastStart DNA Master plus SYBR® Green
1 kit (Roche Diagnostics, Basel, Switzerland). The reaction mix
contained SYBR® Green 1 probe, cDNA (10 ng), forward and
reverse primers (50 ng/µl each) and nuclease-free water to a
final volume of 10 µl. All reactions were performed using an
Applied Biosystems 7900HT Fast Real Time PCR system with the
following thermocycling conditions: 95°C for 10 min, followed by
95°C for 15 sec and 60°C for 60 sec for a total of 40 cycles. The
concentrations of mtDNA-encoded ND2, CYTB, COI and ATPase 6 were
converted to copy numbers, with the values expressed relative to
that of β-actin (19–21). All reactions were performed in
duplicate.
SDS-PAGE and western blot analyses
SDS-PAGE and immunoblotting were performed, as
previously described (19).
Briefly, cells were lysed with 0.4 ml of radioimmunoprecipitation
buffer (Santa Cruz Biotechnology, Inc., Dallas, TX, USA) containing
a protease inhibitor cocktail, on ice for 10 min. Lysates were
centrifuged at 12,000 × g for 5 min at 4°C, and the supernatants
were collected. The supernatants containing the protein were
recovered and assayed for total protein using a bicinchoninic acid
assay kit (Pierce Biotechnology, Inc., Rockford, IL, USA) according
to the manufacturer's instructions. Prior to separation on gel,
samples were boiled for 5 min followed by cooling at room
temperature for 5 min. Equal quantities of proteins (25 µg)
were separated using 10% SDS-PAGE (Sigma-Aldrich) and transferred
onto polyvinylidene difluoride membranes (Thermo Fisher Scientific,
Inc.). The membranes were then blocked with 5% skimmed milk in PBS
containing 0.1% Tween 20 (Thermo Fisher Scientific, Inc.) for 1 h
prior to being incubated overnight at 4°C with the following
primary antibodies: Rabbit polyclonal anti-ND2 (1:500; sc-20495-R;
Santa Cruz Biotechnology, Inc.), rabbit polyclonal anti-CYTB
(1:500; sc-11436, Santa Cruz Biotechnology, Inc.), goat polyclonal
anti-COI (1:5,000; sc-23982; Santa Cruz Biotechnology, Inc.) and
mouse monoclonal anti-ATPase 6 (1:1,000; MA3-929; Thermo Fisher
Scientific, Inc.). Following washing with PBS-Tween 20, the
membranes were incubated for 1 h at 4°C with the following
secondary antibodies: Horseradish peroxidase (HRP)-conjugated goat
anti-rabbit IgG (1:5,000; sc-2004; Santa Cruz Biotechnology, Inc.),
HRP-conjugated donkey anti-goat IgG (1:5,000; sc-2020; Santa Cruz
Biotechnology, Inc.), HRP-conjugated goat anti-mouse IgG (1:10,000;
31430; Thermo Fisher Scientific, Inc.) and HRP-conjugated mouse
anti-β-actin (1:500; sc-47778; Santa Cruz Biotechnology, Inc.).
Immunoreactive bands were detected by enhanced chemiluminescence
(Pierce Biotechnology, Inc., Rockford, IL, USA) and the
immunoreactive bands, corresponding to the correct molecular mass
of the target protein, were quantified by densitometry using Image
J software (version 1.46r; National Institutes of Health, Bethesda,
MA, USA). The values were normalized to internal β-actin, which
also served as a loading control, in order to make relative
comparisons.
Statistical analysis
Data were analyzed using SPSS 19 statistical
software (IBM SPSS, Armonk, NY, USA). An independent samples t-test
was performed to compare the mean expression levels of
mtDNA-encoded genes in the cells for each treatment condition. The
results are expressed as the mean ± standard deviation. P<0.05
was considered to indicate a statistically significant
difference.
Results
High glucose induces an increase in
mitochondrial ROS production
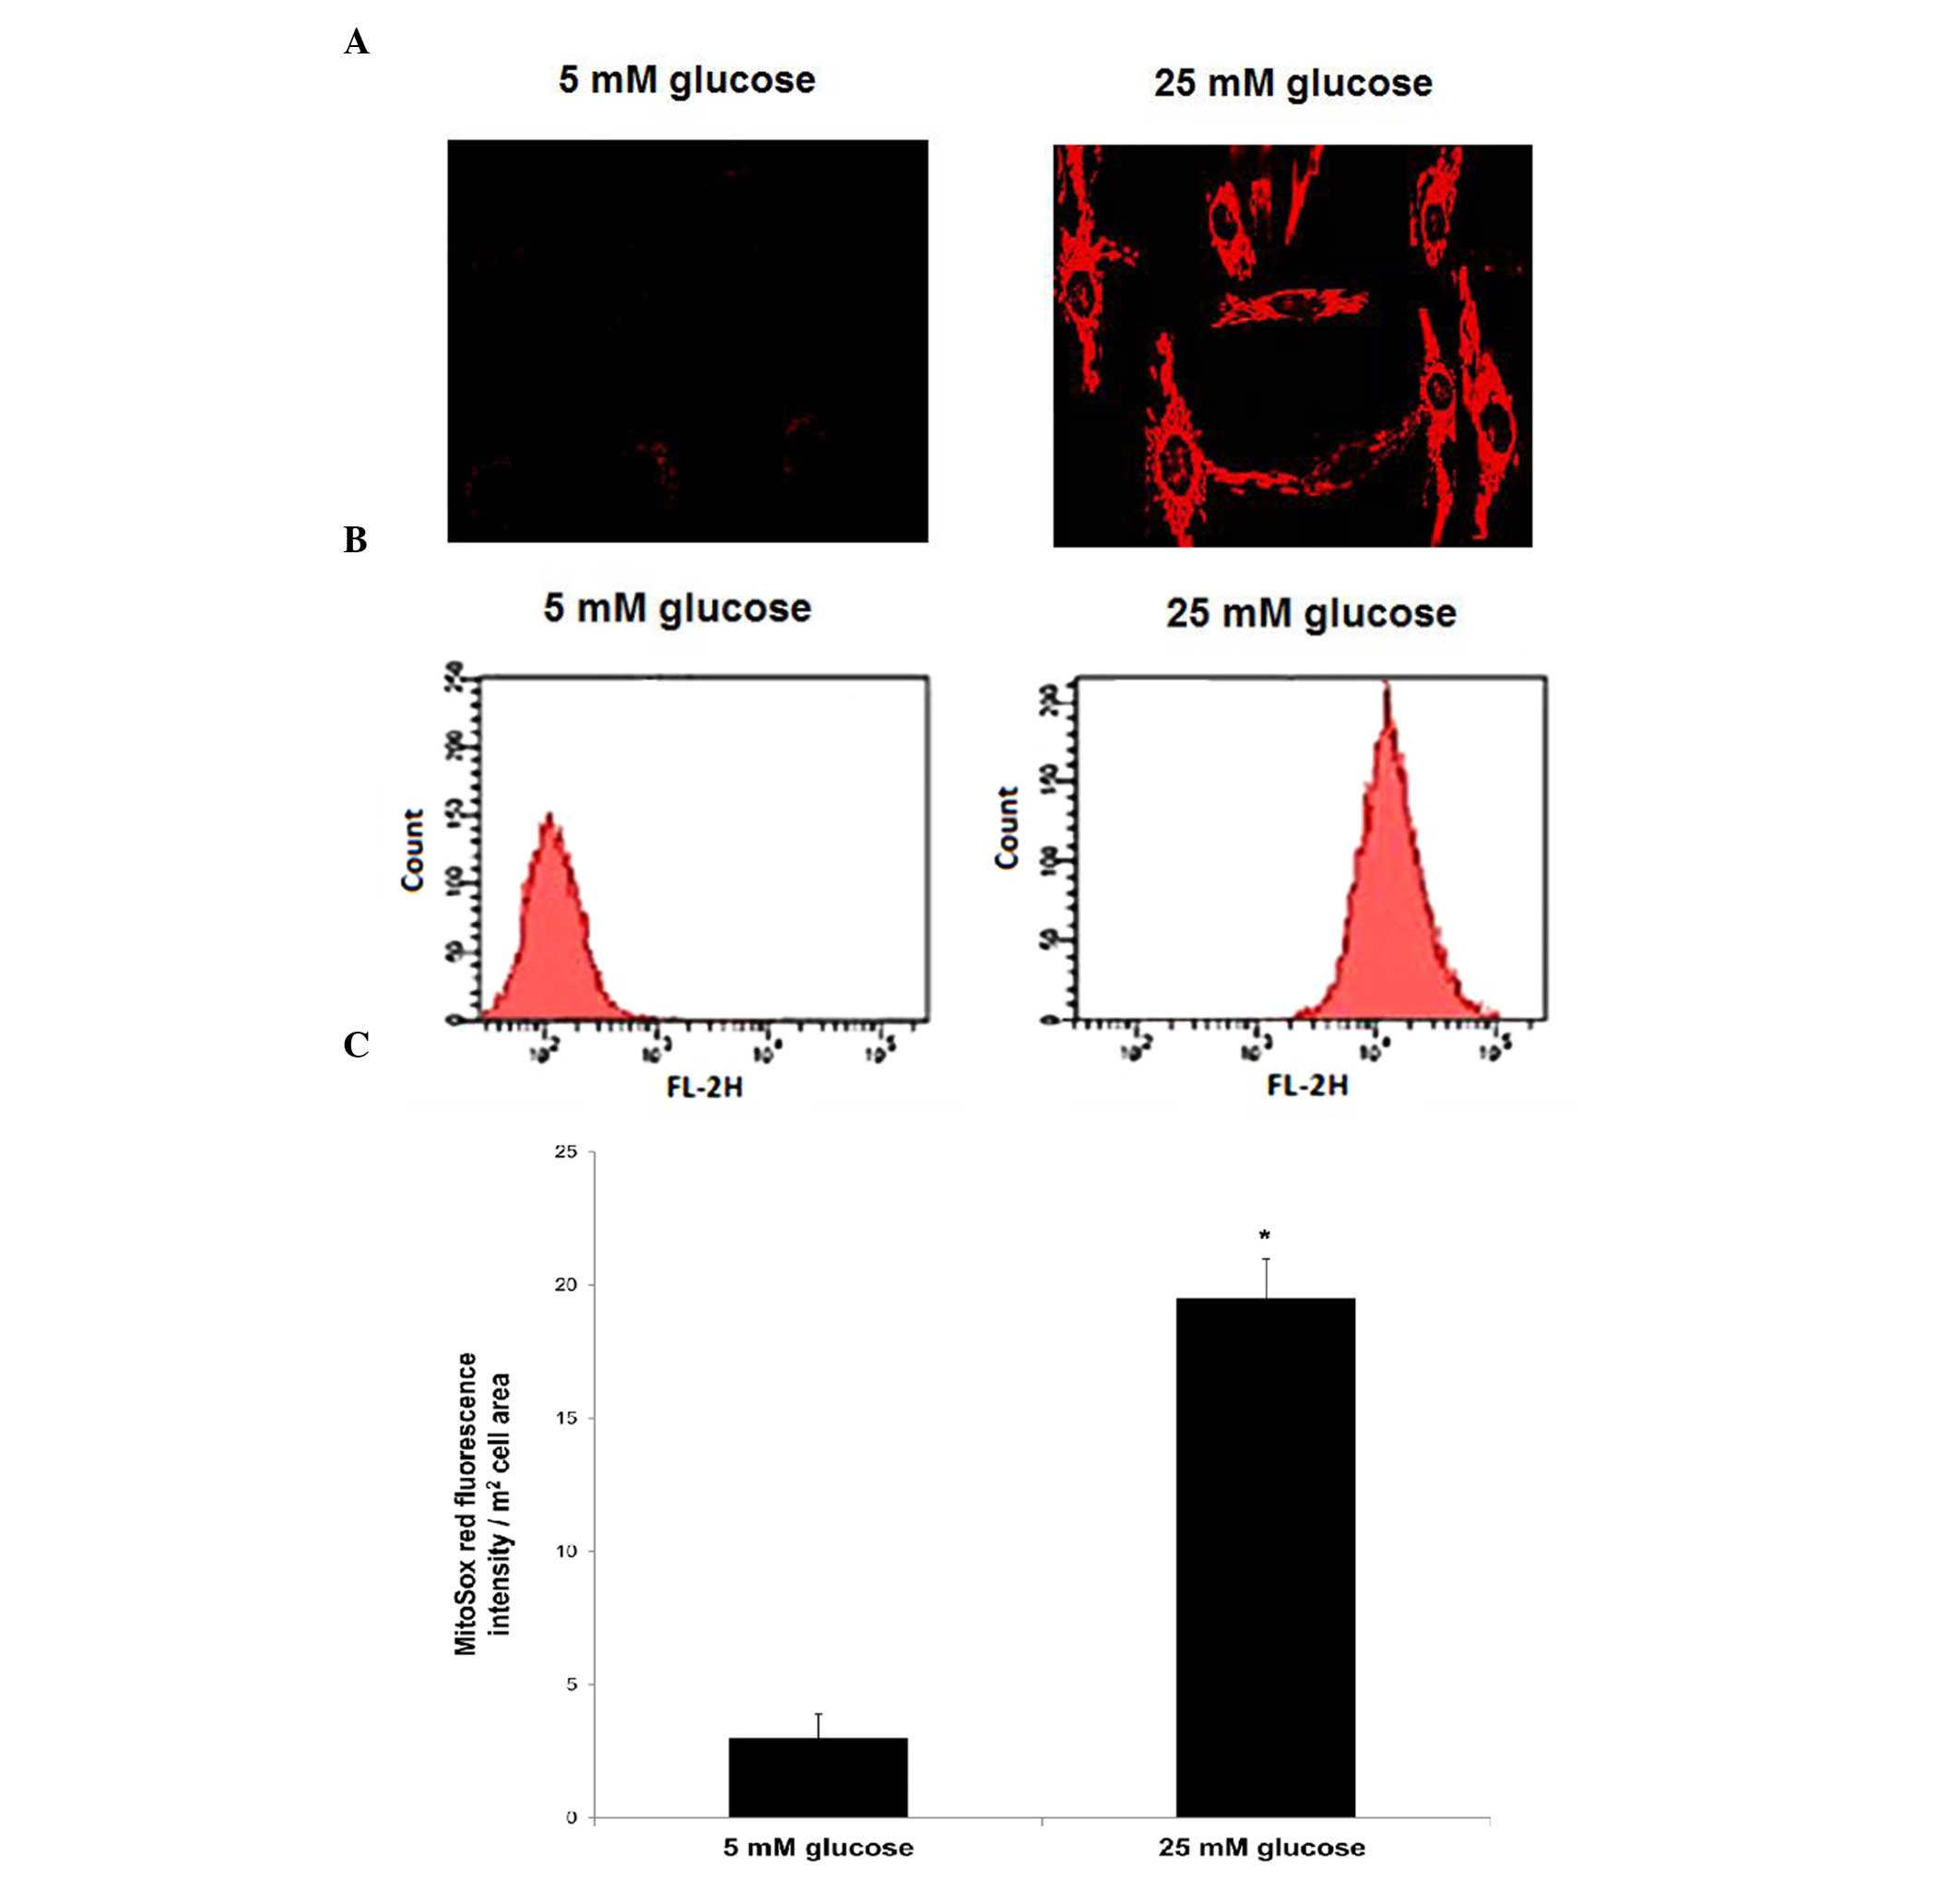
The production of mitochondrial ROS was assessed in
human renal mesangial cells cultured for 24 h in 5 mM glucose
(normal glucose) and 25 mM glucose (high glucose) by confocal
microscopy and flow cytometry, following staining with the
mitochondrial specific probe, MitoSOX red.
The confocal microscopic imaging showed an increase
in MitoSOX red fluorescence signal in the cells cultured in 25 mM
glucose, compared with the cells cultured in 5 mM glucose,
suggesting increased mitochondrial ROS production in these cells.
No fluorescence signal was detected in the cells cultured in 5 mM
glucose (Fig. 1A). Furthermore,
histograms of the results of FACS analysis showed an increase in
the mean fluorescence intensity of MitoSOX in the cells cultured in
25 mM glucose, compared with those cultured in 5 mM glucose
(Fig. 1B). Quantitative
measurements of the mean fluorescence intensities demonstrated a
6.5-fold increase in MitoSOX red fluorescence intensity in the 25
mM glucose-treated cells, compared with the cells treated with 5 mM
glucose (P<0.05; Fig. 1C).
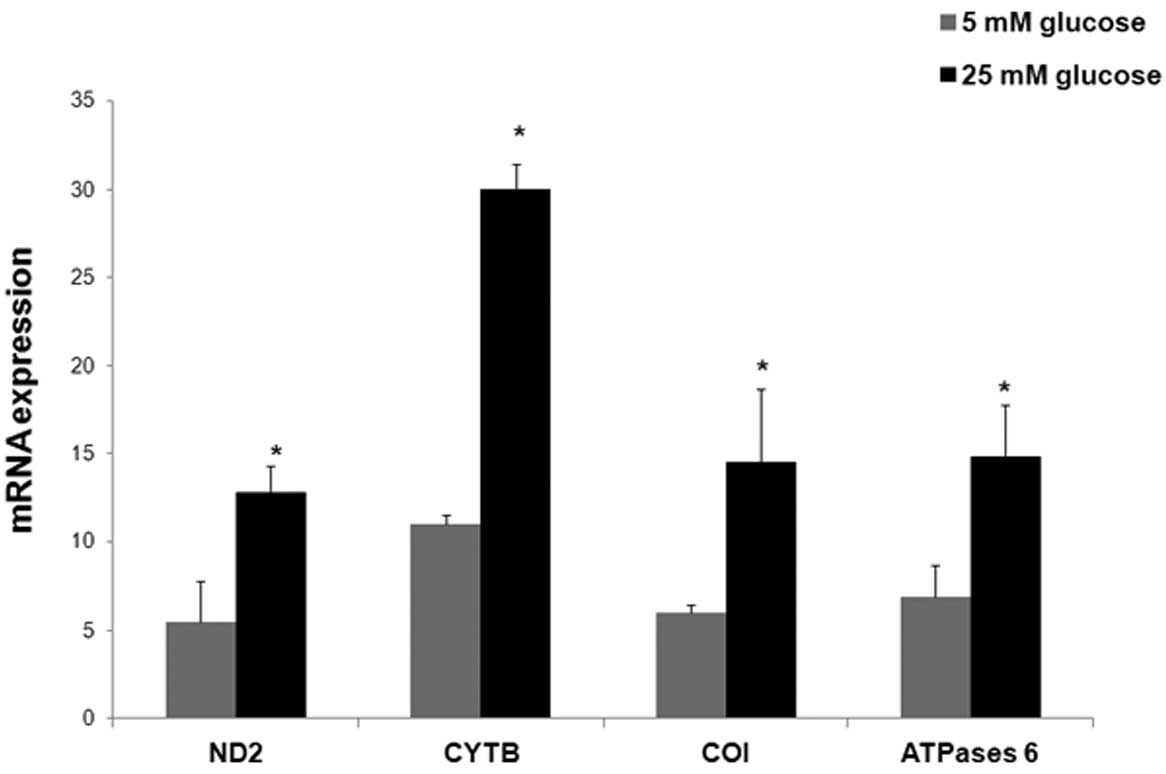
High glucose increases the mRNA
expression levels of mtDNA-encoded subunits of the ETC
The mRNA expression levels of mtDNA-encoded ND2,
CYTB, COI and ATPase 6 relative to β-actin were determined using
RT-qPCR in the human renal mesangial cells, following culture for
24 h in either 5 mM glucose (normal glucose) or 25 mM glucose (high
glucose).
The cells grown in 25 mM glucose showed significant
increases in the mRNA expression levels of ND2, CYTB, COI and
ATPase 6, compared with the cells incubated in 5 mM glucose
(P<0.05; Fig. 2). The relative
mean mRNA expression levels of ND2, CYTB, COI and ATPase 6 were
2.3-fold (12.8±1.5), 2.7-fold (30±1.5), 2.4-fold (14.5±4.2) and
2.1-fold (14.8±3) higher in the cells cultured in 25 mM glucose,
respectively, compared with the mRNA expression levels of ND2,
CYTB, COI and ATPase 6 cultured in 5 mM glucose (5.5±2.3, 11±0.53,
6±0.5 and 6.9±1.8, respectively).
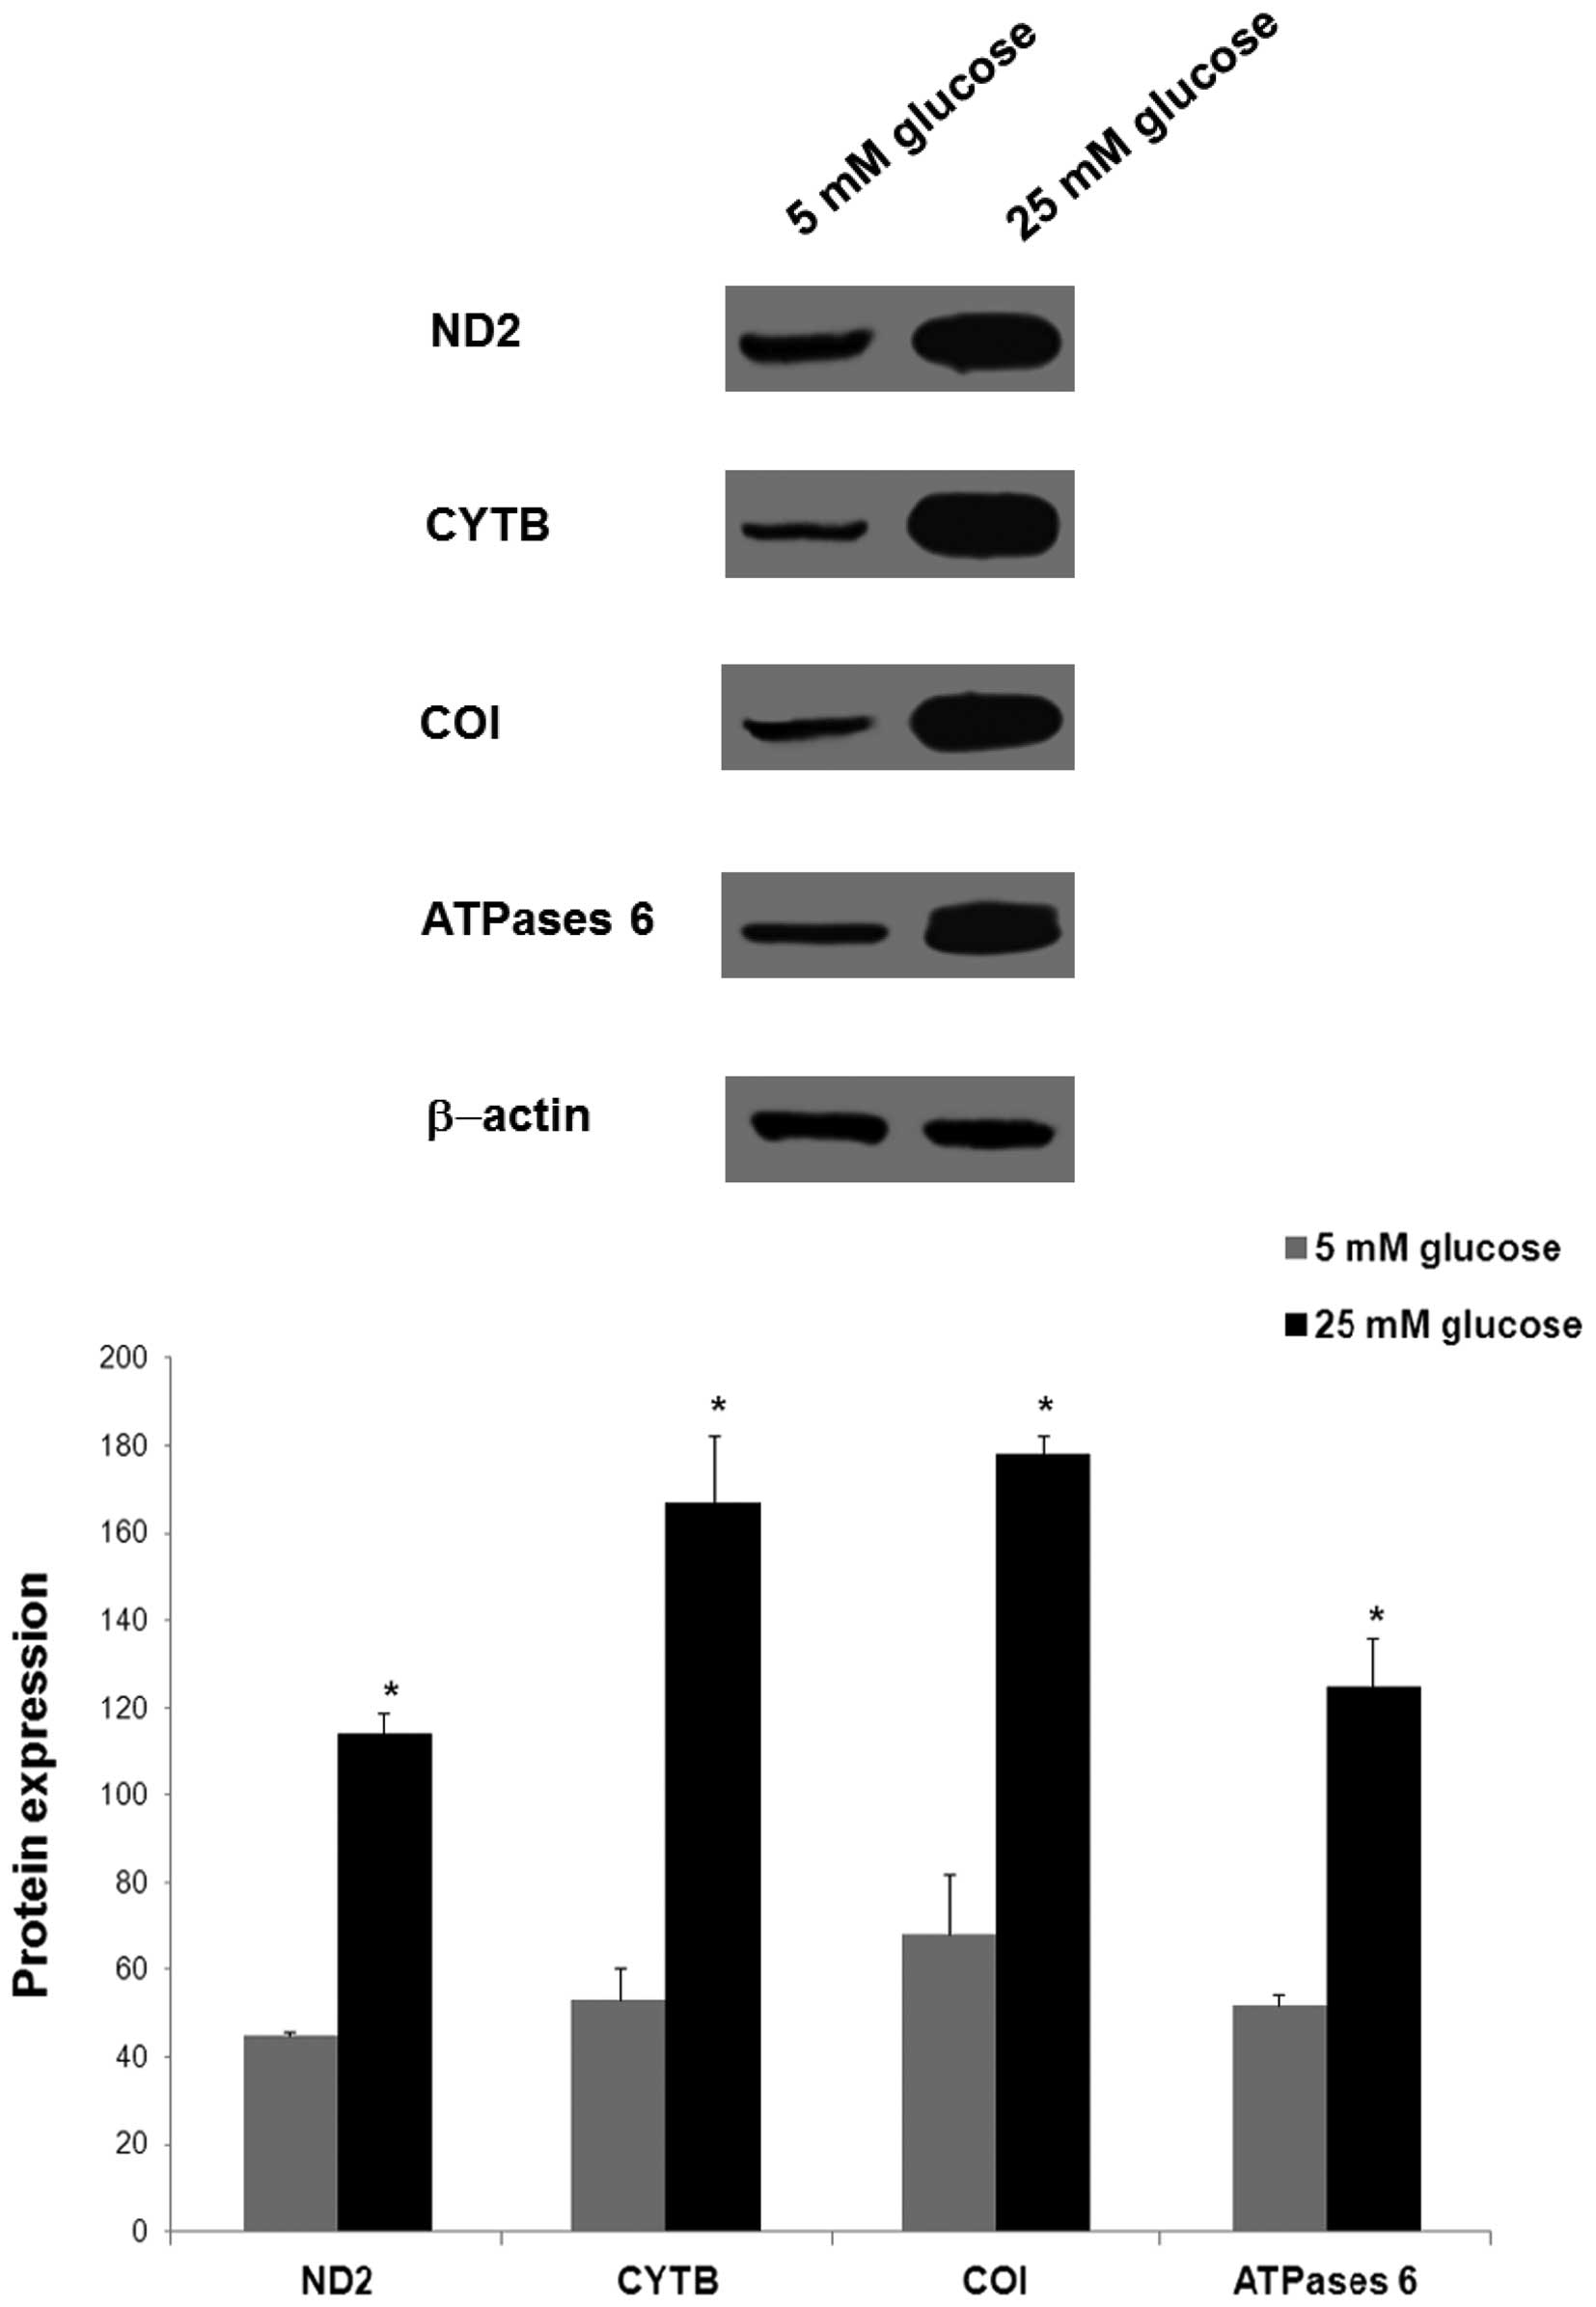
High glucose increases the protein
expression levels of mtDNA-encoded subunits of ETC
In the same cells, the protein expression levels of
mtDNA-encoded ND2, CYTB, COI and ATPase 6, normalized to β-actin,
were determined using western blotting following incubation of the
cells in 5 mM glucose (normal glucose) and 25 mM glucose (high
glucose) for 24 h.
Significant increases in the protein expression
levels of ND2, CYTB, COI and ATPase 6 were also observed in the
cells cultured in 25 mM glucose, compared with the levels observed
in the cells cultured in 5 mM glucose (P<0.05; Fig. 3). The relative mean protein
expression levels of ND2, CYTB, COI and ATPase 6 were 2.5-fold
(114±5), 3.2-fold (167±15.4), 2.6-fold (178±4.2) and 2.4-fold
(125±11) higher in the 25 mM glucose-treated cells, respectively,
compared with the protein expression levels of ND2, CYTB, COI and
ATPase 6 in the 5 mM glucose-treated cells (45±1, 53±7.5, 68±13.8
and 52±2.6, respectively).
Discussion
The present study examined changes in the gene
expression levels of subunits of the ETC complexes encoded by mtDNA
in human renal mesangial cells in response to high glucose-induced
reactive oxygen species (ROS) overproduction. The results of the
present study demonstrated that high glucose induced an increase in
mitochondrial ROS levels, as detected by the increased fluorescence
intensity of the specific mitochondrial MitoSOX red probe. This
increase in fluorescence intensity was not detected in the normal
glucose-treated cells. In addition to the increase in ROS
generation, an increase in the mRNA expression levels of
mtDNA-encoded ND2 of complex I, CYTB of complex III, COI of complex
IV and ATPase 6 of complex V were observed in the high
glucose-cultured cells, compared with the cells treated with normal
glucose. These increases were accompanied by increases in the
expression levels of their corresponding proteins in the high
glucose cultured cells. These results suggested that increased gene
expression of mtDNA-encoded subunits of the ETC in human renal
mesangial cells is the consequence of elevated mitochondrial ROS
production induced by high glucose.
Mitochondria are important intracellular organelles,
which supply energy to cells, and are also the major intracellular
source of ROS (22). Superoxide is
the first free radical produced as mitochondrial derived-ROS, and
is a highly reactive species, which does not diffuse readily
throughout the cell (9,23). mtDNA encodes essential components
of complexes of the ETC, as well as the ribosomal and transfer RNAs
necessary for protein production within the mitochondria, and its
maintenance is vital for proper cellular function (6,7). The
ROS generated by mitochondria can cause defects in the mtDNA and
mitochondrial components, and thus may lead to mitochondrial
dysfunction (7,8).
High glucose elicits the overproduction of ROS via
the mitochondrial ETC during respiration (1), and increased superoxide production
via the mitochondrial respiratory chain has been shown to be the
causal link between high glucose and the signaling pathways
responsible for hyperglycemic tissue damage, which leads to the
complications in diabetes, including diabetic nephropathy (1,4).
Enhanced ROS production and oxidative stress have
been reported in several pathological conditions in which the
respiratory chain is impaired, including neurodegenerative diseases
(9–11,24),
cancer (12,24) and diabetes (15,16).
Furthermore, the aging process in humans has been shown to be
associated with an increase in mitochondrial abundance, mtDNA copy
number and the expression levels of respiratory genes, as a
compensatory response for defective mitochondria and mtDNA damage
(13,14,25).
Our previous study on human renal mesangial cells
also showed that high glucose induces an increase in mtDNA copy
number in response to oxidatively damaged mtDNA due to increased
mitochondrial ROS, which was prevented by normalizing the levels of
mitochondrial ROS (18). The
results of the present study demonstrated increased ROS production
in high glucose-treated human renal mesangial cells. In addition to
ROS overproduction, increases in mtDNA-encoded gene expression
levels of important subunits of ETC complexes were observed.
The increased expression levels of
mitochondrial-encoded genes has been shown to be associated with
mtDNA damage and mitochondrial dysfunction in human cardiomyopathy
(26), as well as in the
pathogenicity of diabetes mellitus (27). In vitro studies using
cultured vascular endothelial and smooth muscle cells have
demonstrated that ROS mediate mtDNA damage and alterations of gene
expression, and impair mitochondrial function (28). Altered gene expression levels of
the mitochondrial ETC complexes due to enhanced mitochondrial ROS
production have also been reported in retinal endothelial cells
cultured under high glucose conditions (29), and have been associated with mtDNA
oxidative damage and mitochondrial dysfunction in animal and
experimental models of diabetic retinopathy (30).
Ide et al (31) demonstrated that increases in ROS
production are associated with mitochondrial damage and dysfunction
in myocardial infarction, which leads to a cyclic increase in ROS
production, mitochondrial damage and cellular injury.
Furthermore, high glucose-induced oxidative damage
to mtDNA and mitochondria has been shown to induce early vascular
damage in diabetic retinopathy by initiating a cycle of
mitochondrial functional decline, increased ROS generation and
further mtDNA damage (32).
The increase in mRNA expression levels of
mtDNA-encoded complexes of the respiratory chain in human renal
mesangial cells observed in the present study may be a feedback
response for defective mtDNA and mitochondria, mediated by high
glucose-induced ROS levels, to allow the production of proteins
involved in the ETC at higher levels and counteracting
mitochondrial functional decline.
Although the present study examined changes in the
expression levels of mtDNA-encoded genes following exposure of
human mesangial cells to high glucose for 24 h, further
investigations with the aim to examine the chronic effect of high
glucose-induced ROS levels on mitochondrial-encoded gene expression
and mitochondrial function in diabetic nephropathy are
underway.
In conclusion, the present study demonstrated for
the first time, to the best of our knowledge, that the gene
expression levels of certain subunits of the ETC complexes encoded
by mtDNA were increased in human renal mesangial cells in response
to high glucose-induced ROS overproduction, to compensate for
mitochondrial dysfunction. High glucose-induced defective
mitochondria may be important in the development and progression of
diabetic nephropathy through enhanced ROS generation.
Acknowledgments
The authors of the present study would like to thank
the Research Unit at the Department of Molecular Medicine,
Al-Jawhara Centre, College of Medicine and Medical Sciences,
Arabian Gulf University, Bahrain for the technical and financial
support. The present study was supported by a departmental fund
from the College of Medicine and Medical Sciences (Arabian Gulf
University).
References
|
1
|
Brownlee M: Biochemistry and molecular
cell biology of diabetic complications. Nature. 414:813–20. 2001.
View Article : Google Scholar : PubMed/NCBI
|
|
2
|
Nohl H: Generation of superoxide radicals
as byproduct of cellular respiration. Ann Biol Clin (Paris).
52:199–204. 1994.
|
|
3
|
Turrens JF: Superoxide production by the
mitochondrial respiratory chain. Biosci Rep. 17:3–8. 1997.
View Article : Google Scholar : PubMed/NCBI
|
|
4
|
Nishikawa T, Edelstein D, Du XL, Yamagishi
S, Matsumura T, Kaneda Y, Yorek MA, Beebe D, Oates PJ, Hammes HP,
et al: Normalizing mitochondrial superoxide production blocks three
different pathways of hyperglycemic damage. Nature. 404:787–790.
2000. View
Article : Google Scholar : PubMed/NCBI
|
|
5
|
Anderson S, Bankier AT, Barrell BG, de
Bruijn MH, Coulson AR, Drouin J, Eperon IC, Nierlich DP, Roe BA,
Sanger F, et al: Sequence and organization of the human
mitochondrial genome. Nature. 290:457–65. 1981. View Article : Google Scholar : PubMed/NCBI
|
|
6
|
Taanman JW: The mitochondrial genome:
Structure, transcription, translation and replication. Biochim
Biophys Acta. 1410:103–123. 1999. View Article : Google Scholar : PubMed/NCBI
|
|
7
|
Bohr VA: Repair of oxidative DNA damage in
nuclear and mitochondrial DNA, and some changes with aging in
mammalian cells. Free Radic Biol Med. 32:804–812. 2002. View Article : Google Scholar : PubMed/NCBI
|
|
8
|
Santos JH, Hunakova L, Chen Y, Bortner C
and Van Houten B: Cell sorting experiments link persistent
mitochondrial DNA damage with loss of mitochondrial membrane
potential and apoptotic cell death. J Biol Chem. 278:1728–1734.
2003. View Article : Google Scholar
|
|
9
|
Kirkinezos IG and Moraes CT: Reactive
oxygen species and mitochondrial diseases. Semin Cell Dev Biol.
12:449–457. 2001. View Article : Google Scholar : PubMed/NCBI
|
|
10
|
Gu XM, Huang HC and Jiang ZF:
Mitochondrial dysfunction and cellular metabolic deficiency in
Alzheimer's disease. Neurosci Bull. 28:631–640. 2012. View Article : Google Scholar : PubMed/NCBI
|
|
11
|
Hauser DN and Hastings TG: Mitochondrial
dysfunction and oxidative stress in Parkinson's disease and
monogenic parkinsonism. Neurobiol Dis. 51:35–42. 2013. View Article : Google Scholar :
|
|
12
|
Boland ML, Chourasia AH and Macleod KF:
Mitochondrial dysfunction in cancer. Front Oncol. 3:2922013.
View Article : Google Scholar : PubMed/NCBI
|
|
13
|
Manczak M, Jung Y, Park BS, Partovi D and
Reddy PH: Time-course of mitochondrial gene expressions in mice
brains: Implications for mitochondrial dysfunction, oxidative
damage and cytochrome c in aging. J Neurochem. 92:494–504. 2005.
View Article : Google Scholar : PubMed/NCBI
|
|
14
|
Lee HC and Wei YH: Mitochondrial role in
life and death of the cell. J Biomed Sci. 7:2–15. 2000. View Article : Google Scholar : PubMed/NCBI
|
|
15
|
Raza H, Prabu SK, John A and Avadhani NG:
Impaired mitochondrial respiratory functions and oxidative stress
in strep-tozotocin-induced diabetic rats. Int J Mol Sci.
12:3133–3147. 2011. View Article : Google Scholar
|
|
16
|
Rolo AP and Palmeira CM: Diabetes and
mitochondrial function: Role of hyperglycemia and oxidative stress.
Toxicol Appl Pharmacol. 212:167–178. 2006. View Article : Google Scholar : PubMed/NCBI
|
|
17
|
Munusamy S, Saba H, Mitchell T, Megyesi
JK, Brock RW and MacMillan-Crow LA: Alteration of renal respiratory
Complex-III during experimental type-1 diabetes. BMC Endocr Disord.
9:22009. View Article : Google Scholar : PubMed/NCBI
|
|
18
|
Al-Kafaji G and Golbahar J: High
glucose-induced oxidative stress increases the copy number of
mitochondrial DNA in human mesangial cells. Biomed Res Int.
2013:7549462013. View Article : Google Scholar : PubMed/NCBI
|
|
19
|
Al-Kafaji G and Malik AN: Hyperglycemia
induces elevated expression of thyroid hormone binding protein in
vivo in kidney and heart and in vitro in mesangial cells. Biochem
Biophys Res Commun. 391:1585–1591. 2010. View Article : Google Scholar
|
|
20
|
Malik AN and Al-Kafaji G: Glucose
regulation of beta-defensin-1 mRNA in human renal cells. Biochem
Biophys Res Commun. 353:318–323. 2007. View Article : Google Scholar
|
|
21
|
Al-Kafaji G, Sabry MA and Skrypnyk C:
Time-course effect of high-glucose-induced reactive oxygen species
on mitochondrial biogenesis and function in human renal mesangial
cells. Cell Biol Int. Aug 6–2015.Epub ahead of print. PubMed/NCBI
|
|
22
|
Murphy MP: How mitochondria produce
reactive oxygen species. Biochem J. 417:1–13. 2009. View Article : Google Scholar
|
|
23
|
Esposito LA, Melov S, Panov A, Cottrell BA
and Wallace DC: Mitochondrial disease in mouse results in increased
oxidative stress. Proc Natl Acad Sci USA. 96:4820–4825. 1999.
View Article : Google Scholar : PubMed/NCBI
|
|
24
|
Enns GM: The contribution of mitochondria
to common disorders. Mol Genet Metab. 80:11–26. 2003. View Article : Google Scholar : PubMed/NCBI
|
|
25
|
Lee HC and Wei YH: Mitochondrial
biogenesis and mitochondrial DNA maintenance of mammalian cells
under oxidative stress. Int J Biochem Cell Biol. 37:822–834. 2005.
View Article : Google Scholar : PubMed/NCBI
|
|
26
|
Ahuja P, Wanagat J, Wang Z, Wang Y, Liem
DA, Ping P, Antoshechkin IA, Margulies KB and MacLellan WR:
Divergent mitochondrial biogenesis responses in human
cardiomyopathy. Circulation. 127:1957–1967. 2013. View Article : Google Scholar : PubMed/NCBI
|
|
27
|
Antonetti DA, Reynet C and Kahn CR:
Increased expression of mitochondrial-encoded genes in skeletal
muscle of humans with diabetes mellitus. J Clin Invest.
95:1383–1388. 1995. View Article : Google Scholar : PubMed/NCBI
|
|
28
|
Ballinger SW, Patterson C, Yan CN, Doan R,
Burow DL, Young CG, Yakes FM, Van Houten B, Ballinger CA, Freeman
BA and Runge MS: Hydrogen peroxide- and peroxynitrite-induced
mitochondrial DNA damage and dysfunction in vascular endothelial
and smooth muscle cells. Circ Res. 86:960–966. 2000. View Article : Google Scholar : PubMed/NCBI
|
|
29
|
Madsen-Bouterse SA, Zhong Q, Mohammad G,
Ho YS and Kowluru RA: Oxidative damage of mitochondrial DNA in
diabetes and its protection by manganese superoxide dismutase. Free
Radic Res. 44:313–321. 2010. View Article : Google Scholar : PubMed/NCBI
|
|
30
|
Santos JM, Tewari S, Goldberg AF and
Kowluru RA: Mitochondria biogenesis and the development of diabetic
retinopathy. Free Radic Biol Med. 51:1849–1860. 2011. View Article : Google Scholar : PubMed/NCBI
|
|
31
|
Ide T, Tsutsui H, Hayashidani S, Kang D,
Suematsu N, Nakamura K, Utsumi H, Hamasaki N and Takeshita A:
Mitochondrial DNA damage and dysfunction associated with oxidative
stress in failing hearts after myocardial infarction. Circ Res.
88:529–535. 2001. View Article : Google Scholar : PubMed/NCBI
|
|
32
|
Xie L, Zhu X, Hu Y, Li T, Gao Y, Shi Y and
Tang S: Mitochondrial DNA oxidative damage triggering mitochondrial
dysfunction and apoptosis in high glucose-induced HRECs. Invest
Ophthalmol Vis Sci. 49:4203–4209. 2008. View Article : Google Scholar : PubMed/NCBI
|