Introduction
Arthritis comprises a variety of diseases with joint
pain as a common feature and includes osteoarthritis (OA),
rheumatoid arthritis (RA) and psoriatic arthritis, while their
underlying mechanisms are divergent (1). OA is a degenerative disease commonly
manifesting with mechanical abnormalities of weight-bearing joints
and hands, including knees and hips. It is characterized by loss of
matrix proteoglycans, fibrillation of cartilage surface and
eventual loss of collagenous matrix. Substantial studies have
proven that synovial membrane inflammation, abnormal articular
chondrocyte differentiation and bone remodeling contribute to the
progression of OA (2–4). RA is a systemic autoimmune disease,
in which the immune system targets body cells of the same organism.
It features chronic inflammation of the synovium and subsequent
cartilage destruction as well as bone erosion. The complement
system is known to be involved in the induction and progression of
inflammatory reactions in RA (5,6).
Synovial fibroblasts (SFs), the most abundant
resident cell type in human synovial tissue, are thought to have an
important role in the pathogenesis of chronic arthritis (7) and display marked hyperplasia in OA
and RA (8). Furthermore,
alterations in the expression of various genes have also been
observed to be associated with the phenotypic changes in OASFs and
RASFs (9,10). Previous microarray studies have
confirmed a relatively high heterogeneity of the RASF phenotype
(11,12). By comparison between healthy SFs,
RASFs and OASFs, Del Rey et al (13) found that OASFs possessed a more
homogeneous phenotype compared to RASFs. The present study
subjected the microarray data from Del Rey et al (13) to a bioinformatics analysis to
identify common and differential molecular mechanisms underlying
the two arthritis sub-types. The transcriptional expression
profiles of the OASF and RASF samples were compared with those of
SFs from healthy controls and key genes were identified.
Materials and methods
Microarray data
Gene microarray dataset GSE29746 was downloaded from
Gene Expression Omnibus (http://www.ncbi.nlm.nih.gov/geo/) database (13). The data had been collected from SF
cultures obtained from nine patients with RA, 11 age- and gender
matched patients with OA, and 11 age- and gender-matched adult
healthy donors. The platform was the Agilent-014850 Whole Human
Genome Microarray 4×44 K G4112F (Agilent Technologies, Santa Clara,
CA, USA).
Microarray data pre-processing
The gene expression profile data were extracted
using the Linear Models for Microarray Data (LIMMA) package in R,
followed by normexp background correction (14) and subsequent quantile normalization
(15). The 95th quantile of all
negative controls in each chip was calculated, and only probes with
expression values larger than this value in all the samples were
retained. According to the annotation platform, the values of
probes corresponding to the same transcript were averaged and then
defined as the final expression value of a transcript.
Screening of differentially expressed
transcripts (DETs)
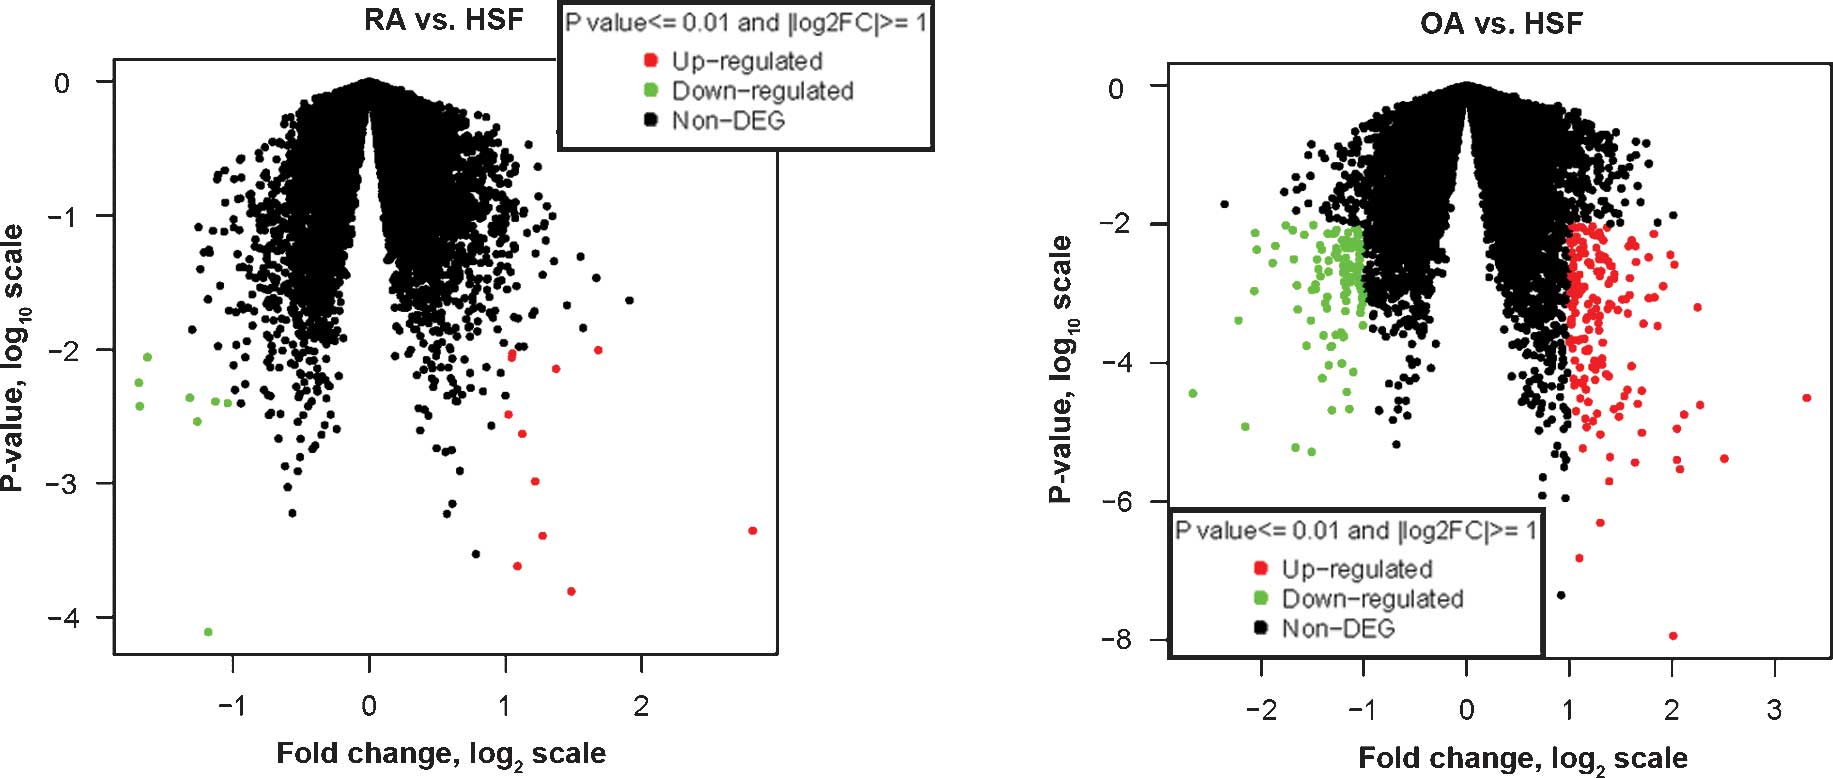
Volcano plots were drawn to display the differential
expression profiles of transcripts for each disease group and the
control group. Differential expression analysis of transcripts
between the RA group and the control group was performed using the
t-test with the LIMMA package, as well as between the OA
group and the control group (16).
Transcripts with |log2fold change (FC)|>1 and P≤0.01
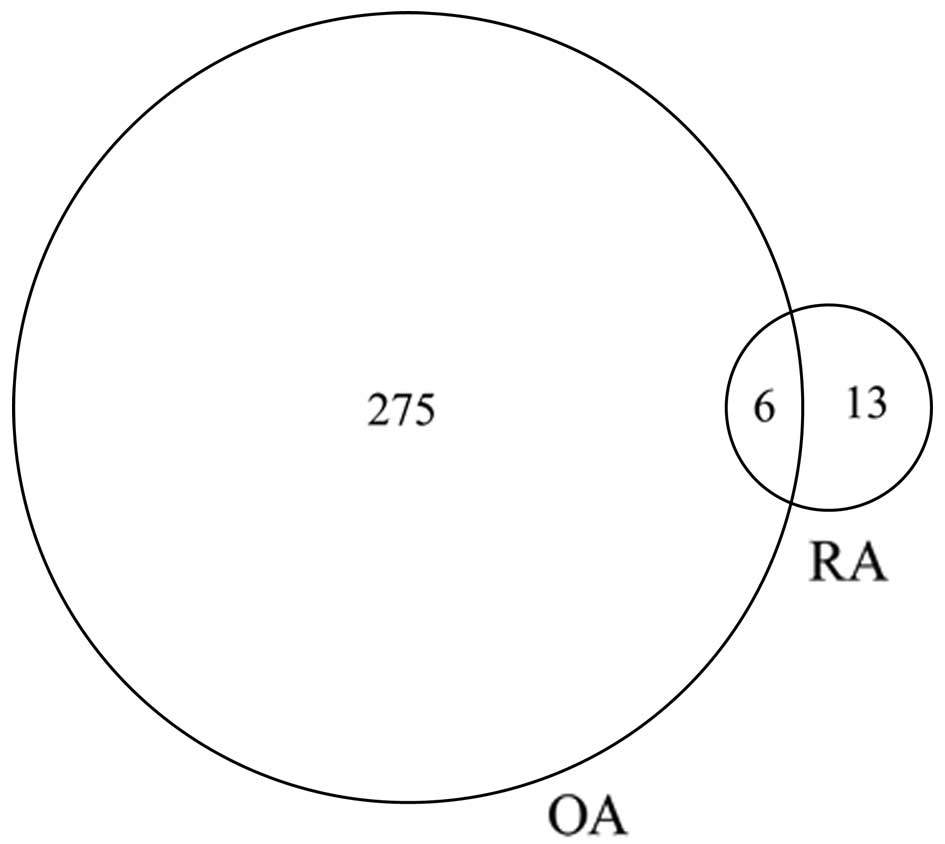
were screened as DETs. DETs from the two disease groups were
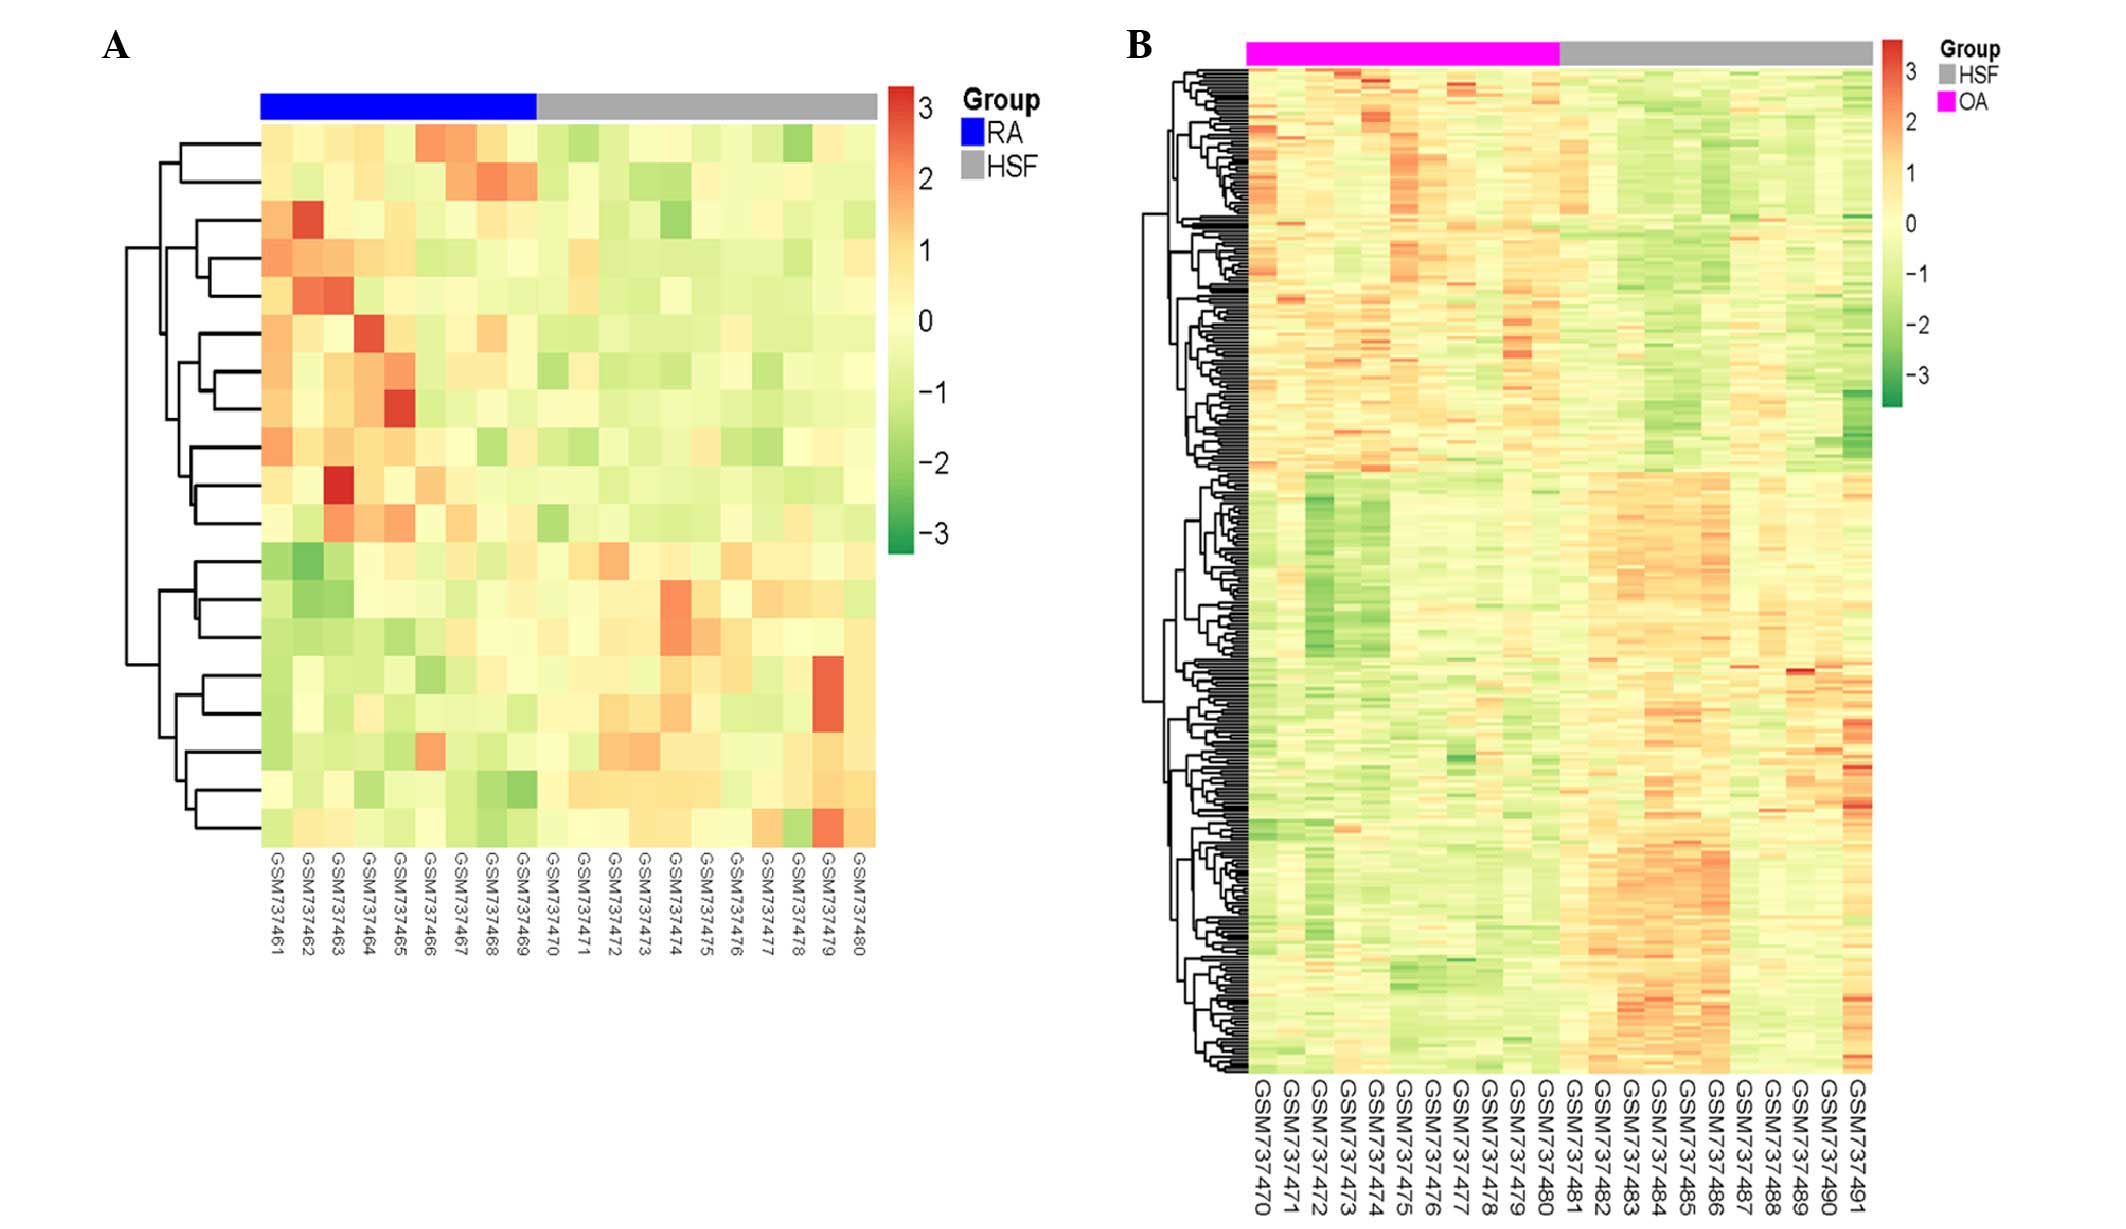
compared, and a Venn diagram was used to display the result. A
heatmap was also used to exhibit the overall expression profiles of
DETs across all samples.
Functional annotation of DETs
The screened DETs were submitted to the online tool
Database for Annotation, Visualization and Integrated Discovery
(DAVID; http://david.abcc.ncifcrf.gov/summary.jsp) to perform
functional annotation based on the gene ontology (GO) database
using Fisher's exact test (17).
Analysis of interaction networks of
DETs
DETs screened from each disease group were submitted
to the Search Tool for the Retrieval of Interacting Genes/Proteins
(http://www.stringdb.org/) to construct
protein-protein interaction (PPI) networks based on the
Biomolecular Interaction Network Database (18). The sub-networks within each network
were then detected by clustering analysis using clusterONE
(19), and genes involved in each
cluster were then subjected to functional enrichment analysis with
DAVID (P<0.05 as cut off value).
Results
Screening of differentially expressed
transcripts
The differential expression profiles between each
disease group and the control group were displayed in Volcano plots
(Fig. 1). In total, 19 DETs were
screened from the RA group, with |log2FC| values of
1–2.8, among which eight genes were downregulated and 11 genes were
upregulated. Furthermore, 281 DETs were screened from the OA group,
with |log2FC| values of 1.0–3.3, among which 113 genes
were downregulated and 168 were upregulated. As illustrated by the
Venn diagram (Fig. 2), the OA
group contained a greater number of DETs than the RA group, while
the two groups had six DETs in common (Table I). In addition, the heatmaps
indicated that the disease samples may be separated from the
control samples using the identified DETs (Fig. 3).
 | Table ICommon differentially expressed
transcripts between the RA group and the OA group. |
Table I
Common differentially expressed
transcripts between the RA group and the OA group.
| Transcript | Gene symbol | RA group
| OA group
|
|---|
| logFC | P-value | logFC | P-value |
|---|
| NM_182734 | PLCB1 | −1.18252 |
7.74×10⁻⁵ | −1.03053 |
7.02×10⁻³ |
| NM_000211 | ITGB2 | 2.81476 |
4.41×10⁻⁴ | 3.31223 |
3.08×10⁻⁵ |
| NM_001853 | COL9A3 | −1.12924 |
4.07×10⁻³ | −1.03848 |
5.18×10⁻³ |
| NM_139125 | MASP1 | −1.31698 |
4.33×10⁻³ | −1.27800 |
3.61×10⁻³ |
| NM_002522 | NPTX1 | −1.69186 |
5.62×10⁻³ | −1.48981 |
9.55×10⁻³ |
| NM_014638 | PLCH2 | 1.37193 |
7.12×10⁻³ | 1.29122 |
7.54×10⁻³ |
| A_32_P4882 | NA | −1.62833 |
8.70×10⁻³ | −2.66329 |
3.58×10⁻⁵ |
Functional annotation of DETs from each
disease group
According to functional annotation, DETs from the RA
and OA groups were enriched in 8 and 130 GO terms, respectively.
Certain DETs from the RA group (e.g. PLCH2, PLCB1,
NPTX1 and MASP1) and from the OA group (e.g.
F2RL2, PLCB4, PLCH2, PLCB1 and
PLCXD1) were commonly enriched in four GO terms, including
two molecular function terms associated with phospholipase C
activity (Table II). In addition
to the four common GO terms, DETs screened from the RA patients
were also associated with immune response (e.g. MASP1,
IL27RA and ITGB2), while those from the OA group were
predominantly associated with the cell cycle and chromosomes,
including NEK2, TTK, PTTG2, MAF,
CENPN and SGOL2.
| Table IICommon GO terms between the RA group
and the OA group. |
Table II
Common GO terms between the RA group
and the OA group.
| GO term and
function | Differentially
expressed genes
|
|---|
| RA group | OA group |
|---|
| GO:0004435 -
Phosphoinositide phospholipase C activity | PLCH2,
PLCB1 | F2RL2, PLCB4,
PLCH2, PLCB1 |
| GO:0004629 -
Phospholipase C activity | PLCH2,
PLCB1 | F2RL2, PLCB4,
PLCH2, PLCB1, PLCXD1 |
| GO:0005509 -
Calcium ion binding | NPTX1, MASP1,
PLCH2, PLCB1 | F10, MASP1,
NRXN2, PCDHB3, PCDHB2, VWCE, COLEC12, GRIN3A, C9ORF140, SLIT2,
NPTX1, CDH15, CLGN, PLCB4, HPSE, PLCH2, PCDHB16, PLCB1, THBS1,
DTNA |
| GO:0007267 –
Cell-cell signaling | NPTX1, WISP1,
ITGB2 | FGF18, ACHE,
NTF3, PCDHB3, DLGAP5, EFNB2, MME, PCDHB2, ITGB2, RIMS1, NPTX1,
PCDHB16, DTNA, HTR2A |
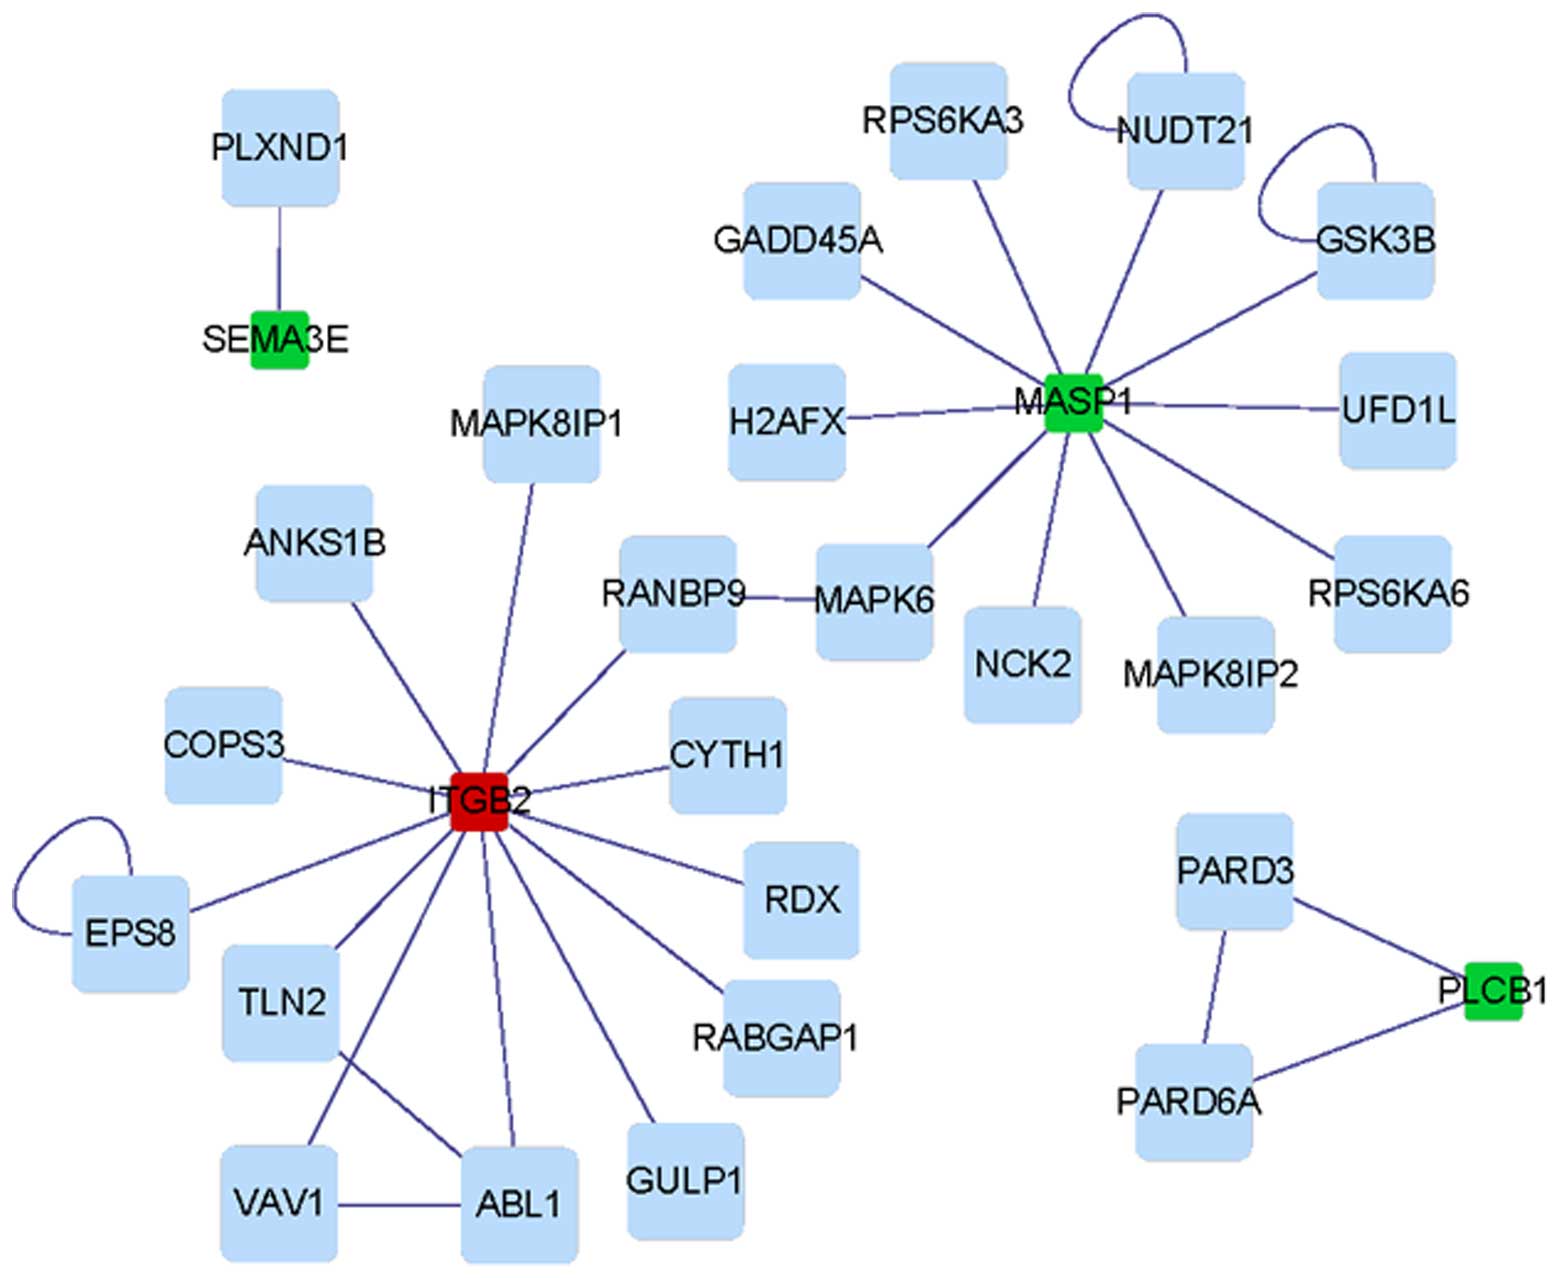
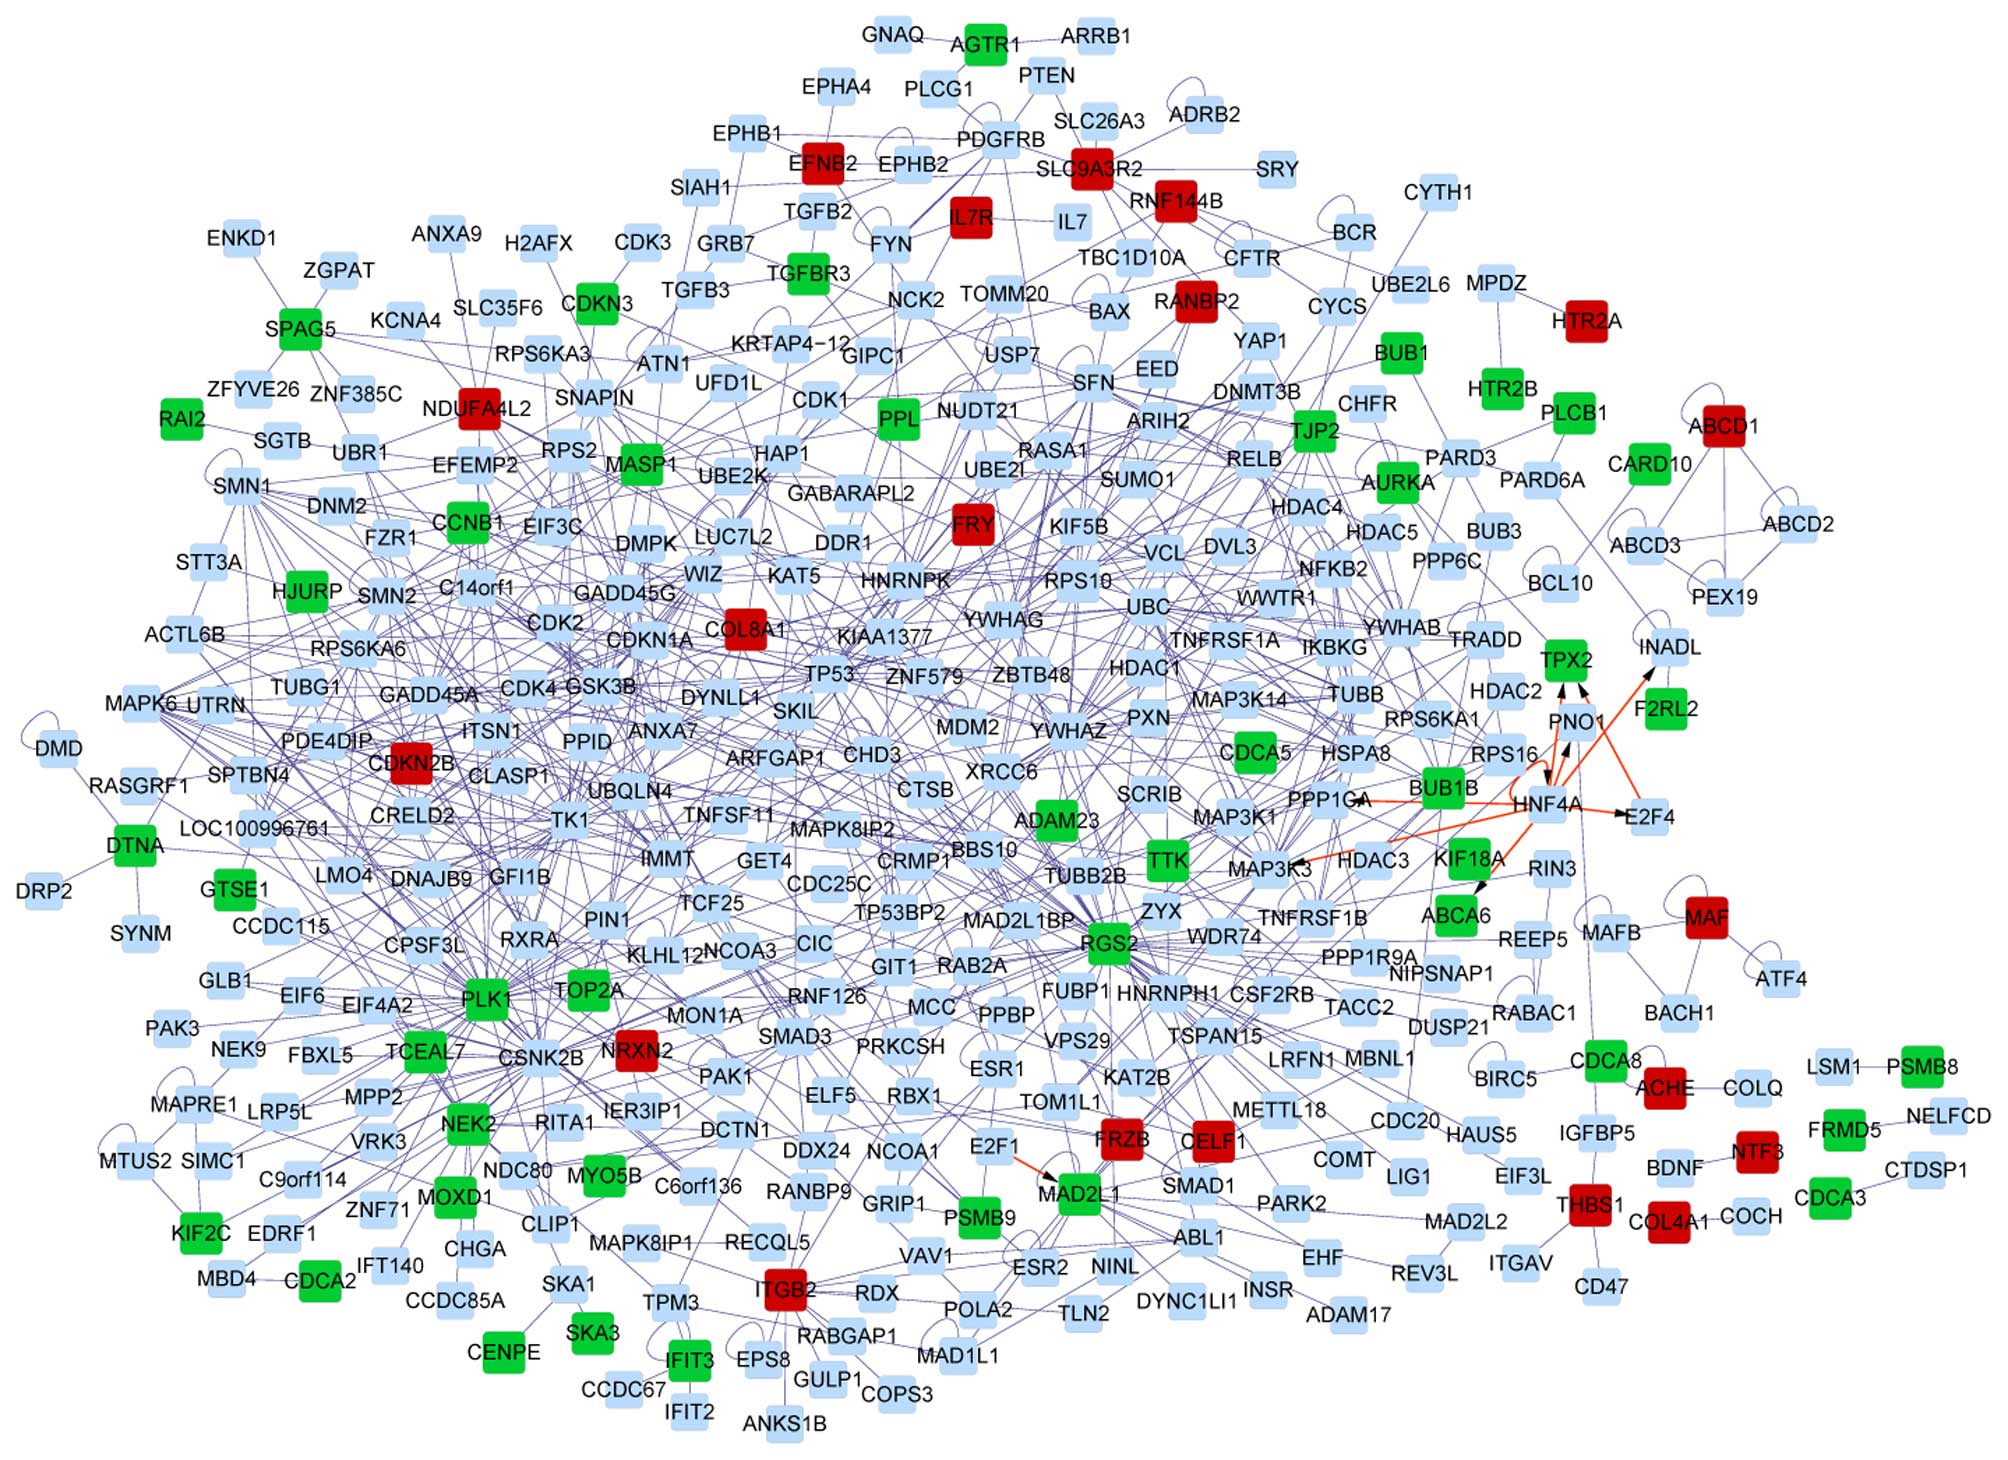
Analysis of PPI networks of DETs
The interaction networks of DETs from the RA group
and the OA group are shown in Figs.
4 and 5, respectively. It was
discovered that the PPI network based on DETs from the OA group was
more complex than that of the RA group. The interaction network of
the RA group contained one sub-network, while that of the OA group
had four sub-networks. DEGs including PSMB9, MAF,
HTR2B and HTR2A were the hubs of corresponding PPI
sub-networks of DEGs from the OA group, while PLCB1 was a
hub of the PPI sub-network of DEGs from the RA group (Table III).
| Table IIIIdentified sub-networks and
functional annotation. |
Table III
Identified sub-networks and
functional annotation.
| Variable | OA group
| RA group
|
|---|
| Cluster1 | Cluster2 | Cluster3 | Cluster4 | Cluster1 |
|---|
| Nodes (n) | 4 | 4 | 3 | 6 | 3 |
| Density | 1 | 0.667 | 0.667 | 0.6 | 1 |
| Quality | 1 | 1 | 1 | 0.529 | 1 |
| P-value | 0.008 | 0.011 | 0.026 | 0.046 | 0.016 |
| Genes | ABCD3, PEX19,
ABCD2, ABCD1 | BACH1, MAF,
MAFB, ATF4 | HTR2A, MPDZ,
HTR2B | NCOA3, ESR1,
NCOA1, PSMB9, GRIP1, ESR2 | PLCB1, PARD3,
PARD6A |
| Top significant GO
terms | Peroxisomal
membrane | Sequence-specific
DNA binding | Serotonin
binding | Steroid hormone
receptor signaling pathway | Occluding
junction |
Discussion
The present study revealed that in OA patients, the
number of DEGs was higher compared to that in RA patients, which
was consistent with the findings of Del Rey et al (13). This previous study identified 2,050
DEGs, several of which were also identified in the screening
performed in the present study, such as ITGB2,
PIP4K2C and NRXN2, although with different magnitudes
of differential expression. Notably, the present study aimed to
unravel the mechanisms underlying RA and OA from the perspective of
PPI by building PPI networks, the constuction of which was not
conducted in the previous study by Del Rey et al (13).
Two DEGs, PLCH2 and PLCB1, screened
from the RA patients as well as the OA patients, were enriched in
two PLC (phospholipase C) activity-associated GO terms, which may
infer that the two arthritis types share certain common mechanisms
regarding phospholipase C activity. PLCH2 and PLCB1
encode two members of the phosphoinositide-specific PLC
superfamily, PLC-eta 2 and -beta 1, respectively, and PLC catalyzes
the hydrolysis of phosphatidylinositol 4,5-bisphosphate into
inositol 1,4,5-trisphosphate and 1,2-diacylglycerol) (20). Previous studies have reported a
notable elevation of the pro-inflammatory enzyme PLA2
(phospholipase A2), another phospholipase type catalyzing the
hydrolysis of membrane glycerophospholipids to release arachidonic
acid and lysophospholipids in synovial fluids and sera of RA
patients, and its expression has been proven to positively
correlate with the disease activity in RA (21,22).
Vignon et al (23) observed
that PLA2 activity in RA and OA patients was similar, implying that
pathological changes mediated by PLA2 are common in RA and OA.
However, to the best of our knowledge, PLC activity has not been
previously reported in RA or OA. As the two phospholipase types
hydrolyze phospholipids at different sites, PLC may presumably also
have a role in RA and OA, which requires further experimental
validation.
Furthermore, in the present study, two
PLC-regulating genes, HTR2B and HTR2A, which encode
two members of the 5-hydroxytryptamine 2 receptor family that binds
to the neurotransmitter serotonin, were also observed to be
specifically differentially expressed in OA patients. These
receptors activate PLC to initiate PLC-mediated signal transduction
pathways (24). Of note,
HTR2A was significantly upregulated, while HTR2B was
significantly downregulated, implying their different roles in
regulating PLC. The two genes were observed to be enriched in the
GO biological process terms phosphoinositide-mediated signaling and
second-messenger-mediated signaling as well as in the cellular
component term plasma membrane-associated processes. This suggests
that alterations in PLC-associated biological functions may be the
predominant aberrations in OA patients.
In addition, DEGs screened from OA samples were also
specifically and predominantly enriched in GO terms associated with
the cell cycle and chromosomes. Among the abundance of DEGs
screened from the OA samples, PSMB9 and MAF were the
key hubs of the sub-PPI network. PSMB9, which was
downregulated in OA, encodes a member of the proteasome B-type
family, and proteasomes cleave peptides via an adenosine
triphosphate/ubiquitin-dependent pathway. This result was in
accordance with previous studies, as the ubiquitin-proteasome
pathway has been implicated in the pathogenesis of OA (25), and Rollin et al (26) has reported that PSMB9 is
aberrantly expressed in chondrocytes of OA patients. As the present
study indicated that PSMB9 was mainly enriched in the GO
biological process terms protein metabolic processes and cell
cycle, it may be hypothesized that the downregulation of
PSMB9 expression induces OA by disturbing normal protein
metabolism and the cell cycle. MAF, a homolog of the avian
musculoaponeurotic fibrosarcoma oncogene V-Maf, encodes a
DNA-binding, leucine zipper-containing transcription factor. The
increase in its expression in chondrocytes from patients with OA
has been validated by Li et al (27), and it has been suggested that the
upregulation of c-MAF expression may alter the phenotype of
chondrocytes via regulating corresponding target genes (28), or interacting with other genes
associated with chondrogenic differentiation (29). As in the present study,
c-MAF was mainly enriched in chromosome-associated GO
cellular component terms, it is presumed that it causes abnormal
chondrogenic differentiation via inducing chromosomal abnormalities
in OA patients.
Compared to those of OA, DETs screened from RA
samples were exclusively enriched in immune response-associated GO
biological process terms in addition to the four common GO terms,
implying that the immune system has a particularly critical role in
the occurrence of RA, which is consistent with the fact that RA is
a systemic autoimmune disease. MASP1 encodes a serine
protease that functions as a component of the lectin pathway of
complement activation (30). The
upregulation of MASP1 expression, which was also observed by
Rioja et al (31),
indicated enhanced activation of the lectin pathway as well as the
activation of the complement system in RA. Enhanced complement
activation has been indicated to be potentially associated with the
occurrence and/or augmentation of inflammation in RA (5). Activated synovial fibroblasts and
upregulation of the expression of various adhesion molecules that
mediate their attachment to the cartilage have been confirmed in
rheumatoid arthritis (32). Among
these adhesion molecules, the expression of integrin α group
proteins, including VLA-3, -4 and -5 has been indicated to increase
most significantly (33,34). ITGB2 encodes integrin β2,
the expression of which was observed to be upregulated in the
present study, which was also reported in RASFs by Del Rey et
al (35); it is therefore
indicated that ITGB2 is linked with RA.
In conclusion, the present study indicated that
genes involved in PLC activity, including PLCH2 and
PLCB1, and its regulation, including HTR2A and
HTR2B, are aberrantly expressed in RA as well as in OA.
Alterations in the expression of genes associated with the cell
cycle, including PSMB9 and MAF, were indicated to be
linked with OA, while genes participating in the immune response
were linked with RA.
References
|
1
|
Roivainen A, Söderström KO, Pirilä L, Aro
H, Kortekangas P, Merilahti-Palo R, Yli-Jama T, Toivanen A and
Toivanen P: Oncoprotein expression in human synovial tissue: An
immunohistochemical study of different types of arthritis. Brit J
Rheumatol. 35:933–942. 1996. View Article : Google Scholar
|
|
2
|
Pullig O, Weseloh G, Ronneberger D,
Käkönen SM and Swoboda B: Chondrocyte differentiation in human
osteoarthritis: Expression of osteocalcin in normal and
osteoarthritic cartilage and bone. Calcif Tissue Int. 67:230–240.
2000. View Article : Google Scholar : PubMed/NCBI
|
|
3
|
Drissi H, Zuscik M, Rosier R and O'Keefe
R: Transcriptional regulation of chondrocyte maturation: Potential
involvement of transcription factors in OA pathogenesis. Mol
Aspects Med. 26:169–179. 2005. View Article : Google Scholar : PubMed/NCBI
|
|
4
|
Kwon DR and Park GY: Intra-articular
injections for the treatment of osteoarthritis: Focus on the
clinical use of several regimens. Osteoarthritis-Diagnosis,
Treatment and Surgery. Chen Q: InTech; Rijeka: pp. 67–100. 2012
|
|
5
|
Nakagawa K, Sakiyama H, Tsuchida T,
Yamaguchi K, Toyoguchi T, Masuda R and Moriya H: Complement C1 s
activation in degenerating articular cartilage of rheumatoid
arthritis patients: Immunohistochemical studies with an active form
specific antibody. Ann Rheum Dis. 58:175–181. 1999. View Article : Google Scholar : PubMed/NCBI
|
|
6
|
Chen M, Daha MR and Kallenberg CG: The
complement system in systemic autoimmune disease. J Autoimmun.
34:J276–J286. 2010. View Article : Google Scholar
|
|
7
|
Bartok B and Firestein GS: Fibroblast-like
synoviocytes: Key effector cells in rheumatoid arthritis. Immunol
Rev. 233:233–255. 2010. View Article : Google Scholar : PubMed/NCBI
|
|
8
|
Izquierdo E, Cañete JD, Celis R, Del Rey
MJ, Usategui A, Marsal S, Sanmartí R, Criado G and Pablos JL:
Synovial fibroblast hyperplasia in rheumatoid arthritis:
Clinicopathologic correlations and partial reversal by anti-tumor
necrosis factor therapy. Arthritis Rheum. 63:2575–2583. 2011.
View Article : Google Scholar : PubMed/NCBI
|
|
9
|
Stanczyk J, Ospelt C, Karouzakis E, Filer
A, Raza K, Kolling C, Gay R, Buckley CD, Tak PP, Gay S and Kyburz
D: Altered expression of microRNA-203 in rheumatoid arthritis
synovial fibroblasts and its role in fibroblast activation.
Arthritis Rheum. 63:373–381. 2011. View Article : Google Scholar : PubMed/NCBI
|
|
10
|
Karouzakis E, Gay RE, Gay S and Neidhart
M: Epigenetic control in rheumatoid arthritis synovial fibroblasts.
Nat Rev Rheumatol. 5:266–272. 2009. View Article : Google Scholar : PubMed/NCBI
|
|
11
|
Van Baarsen LG, Wijbrandts CA, Timmer TC,
Van Der Pouw Kraan TC, Tak PP and Verweij CL: Synovial tissue
heterogeneity in rheumatoid arthritis in relation to disease
activity and biomarkers in peripheral blood. Arthritis Rheum.
62:1602–1607. 2010. View Article : Google Scholar : PubMed/NCBI
|
|
12
|
Kasperkovitz PV, Timmer TC, Smeets TJ,
Verbeet NL, Tak PP, van Baarsen LG, Baltus B, Huizinga TW,
Pieterman E, Fero M, et al: Fibroblast-like synoviocytes derived
from patients with rheumatoid arthritis show the imprint of
synovial tissue heterogeneity: Evidence of a link between an
increased myofibroblast like phenotype and high-inflammation
synovitis. Arthritis Rheum. 52:430–441. 2005. View Article : Google Scholar : PubMed/NCBI
|
|
13
|
Del Rey MJ, Usategui A, Izquierdo E,
Cañete JD, Blanco FJ, Criado G and Pablos JL: Transcriptome
analysis reveals specific changes in osteoarthritis synovial
fibroblasts. Ann Rheum Dis. 71:275–280. 2012. View Article : Google Scholar
|
|
14
|
Ritchie ME, Silver J, Oshlack A, Holmes M,
Diyagama D, Holloway A and Smyth GK: A comparison of background
correction methods for two-colour microarrays. Bioinformatics.
23:2700–2707. 2007. View Article : Google Scholar : PubMed/NCBI
|
|
15
|
Smyth GK and Speed T: Normalization of
cDNA microarray data. Methods. 31:265–273. 2003. View Article : Google Scholar : PubMed/NCBI
|
|
16
|
Smyth GK: Limma: Linear models for
microarray data. Bioinformatics and computational biology solutions
using R and Bioconductor. Gentleman R, Carey VJ, Huber W, Irizarry
RA and Dudoit S: Springer; New York: pp. 397–420. 2005, View Article : Google Scholar
|
|
17
|
Huang da W, Sherman BT and Lempicki RA:
Systematic and integrative analysis of large gene lists using DAVID
bioinformatics resources. Nat Protoc. 4:44–57. 2009. View Article : Google Scholar : PubMed/NCBI
|
|
18
|
Franceschini A, Szklarczyk D, Frankild S,
Kuhn M, Simonovic M, Roth A, Lin J, Minguez P, Bork P, von Mering C
and Jensen LJ: STRING v9. 1: Protein-protein interaction networks,
with increased coverage and integration. Nucleic Acids Res.
41(Database issue): D808–D815. 2013. View Article : Google Scholar :
|
|
19
|
Nepusz T, Yu H and Paccanaro A: Detecting
overlapping protein complexes in protein-protein interaction
networks. Nat Methods. 9:471–472. 2012. View Article : Google Scholar : PubMed/NCBI
|
|
20
|
McLaughlin S, Wang J, Gambhir A and Murray
D: PIP(2) and proteins: Interactions, organization, and information
flow. Annu Rev Biophys Biomol Struct. 31:151–175. 2002. View Article : Google Scholar : PubMed/NCBI
|
|
21
|
Pruzanski W, Keystone EC, Sternby B,
Bombardier C, Snow KM and Vadas P: Serum phospholipase A2
correlates with disease activity in rheumatoid arthritis. J
Rheumatol. 15:1351–1355. 1988.PubMed/NCBI
|
|
22
|
Lin M, Farewell V, Vadas P, Bookman AA,
Keystone EC and Pruzanski W: Secretory phospholipase A2 as an index
of disease activity in rheumatoid arthritis. Prospective double
blind study of 212 patients. J Rheumatol. 23:1162–1166.
1996.PubMed/NCBI
|
|
23
|
Vignon E, Balblanc JC, Mathieu P, Louisot
P and Richard M: Metalloprotease activity, phospholipase A2
activity and cytokine concentration in osteoarthritis synovial
fluids. Osteoarthritis Cartilage. 1:115–120. 1993. View Article : Google Scholar : PubMed/NCBI
|
|
24
|
Berg KA, Maayani S and Clarke WP:
Interactions between effectors linked to serotonin receptors. Ann
NY Acad Sci. 861:111–120. 1998. View Article : Google Scholar
|
|
25
|
Jang BC, Sung SH, Park JG, Park JW, Bae
JH, Shin DH, Park GY, Han SB and Suh SI: Glucosamine hydrochloride
specifically inhibits COX-2 by preventing COX-2 N-glycosylation and
by increasing COX-2 protein turnover in a proteasome-dependent
manner. J Biol Chem. 282:27622–27632. 2007. View Article : Google Scholar : PubMed/NCBI
|
|
26
|
Rollin R, Marco F, Camafeita E, Calvo E,
López Durán L, Jover J, López JA and Fernández-Gutiérrez B:
Differential proteome of bone marrow mesenchymal stem cells from
osteoarthritis patients. Osteoarthritis Cartilage. 16:929–935.
2008. View Article : Google Scholar : PubMed/NCBI
|
|
27
|
Li T, Xiao J, Wu Z and Qiu G:
Over-expression of c-maf by chondrocytes in osteoarthritis. J Int
Med Res. 37:129–135. 2009. View Article : Google Scholar : PubMed/NCBI
|
|
28
|
Maclean HE, Kim JI, Glimcher MJ, Wang J,
Kronenberg HM and Glimcher LH: Absence of transcription factor
c-maf causes abnormal terminal differentiation of hypertrophic
chondrocytes during endochondral bone development. Dev Biol.
262:51–63. 2003. View Article : Google Scholar : PubMed/NCBI
|
|
29
|
Huang W, Lu N, Eberspaecher H and De
Crombrugghe B: A new long form of c-Maf cooperates with Sox9 to
activate the type II collagen gene. J Biol Chem. 277:50668–50675.
2002. View Article : Google Scholar : PubMed/NCBI
|
|
30
|
Goeldner I, Skare T, Boldt AB, Nass FR,
Messias-Reason IJ and Utiyama SR: Association of MASP-2 levels and
MASP2 gene polymorphisms with rheumatoid arthritis in patients and
their relatives. PLoS One. 9:e909792014. View Article : Google Scholar : PubMed/NCBI
|
|
31
|
Rioja I, Clayton CL, Graham SJ, Life PF
and Dickson MC: Gene expression profiles in the rat streptococcal
cell wall-induced arthritis model identified using microarray
analysis. Arthritis Res Ther. 7:R101–R117. 2005. View Article : Google Scholar : PubMed/NCBI
|
|
32
|
Nikkari L, Aho H, Yli-Jama T, Larjava H,
Jalkanen M and Heino J: Expression of integrin family of cell
adhesion receptors in rheumatoid synovium. Alpha 6 integrin subunit
in normal and hyperplastic synovial lining cell layer. Am J Pathol.
142:1019–1027. 1993.PubMed/NCBI
|
|
33
|
Rinaldi N, Schwarz-Eywill M, Weis D,
Leppelmann-Jansen P, Lukoschek M, Keilholz U and Barth TF:
Increased expression of integrins on fibroblast-like synoviocytes
from rheumatoid arthritis in vitro correlates with enhanced binding
to extracellular matrix proteins. Ann Rheum Dis. 56:45–51. 1997.
View Article : Google Scholar : PubMed/NCBI
|
|
34
|
Ishikawa H, Hirata S, Andoh Y, Kubo H,
Nakagawa N, Nishibayashi Y and Mizuno K: An immunohistochemical and
immunoelectron microscopic study of adhesion molecules in synovial
pannus formation in rheumatoid arthritis. Rheumatol Int. 16:53–60.
1996. View Article : Google Scholar : PubMed/NCBI
|
|
35
|
Del Rey MJ, Izquierdo E, Usategui A,
Gonzalo E, Blanco FJ, Acquadro F and Pablos JL: The transcriptional
response of normal and rheumatoid arthritis synovial fibroblasts to
hypoxia. Arthritis Rheum. 62:3584–3594. 2010. View Article : Google Scholar : PubMed/NCBI
|