Introduction
Mesenchymal stem cells (MSCs) are multipotent stem
cells with the capacity for self-renewal and multi-lineage
differentiation. They are obtained from various tissues, including
the human umbilical cord. The isolation and culture of human
umbilical cord-derived MSCs (UC-MSCs) has been previously
demonstrated by Lu et al (1).
MSCs are promising pluripotent cells for use in
regenerative medicine due to their biological characteristics, in
particular their immunomodulatory ability (2,3).
Although the underlying immunomodulatory mechanism of MSCs remains
to be fully elucidated, it is commonly thought that
immunomodulation of MSCs is controlled by inflammation (4). Interferon-γ (IFN-γ) is a critical
inflammatory cytokine, which may activate the immunomodulation of
MSCs, and is involved in inflammation and autoimmune disease
(5). Krampera et al
(6) demonstrated that following
MSC co-culture with IFN-γ-secreting CD4+ T cells,
CD8+ T cells or natural killer cells, MSCs inhibited the
proliferation of these cells. Following MSC co-culture with
non-IFN-γ-secreting B cells and T helper 2 cells, there was minimal
inhibition of proliferation. IFN-γ was demonstrated to induce the
secretion of prostaglandin E2, indoleamine 2,3-dioxygenase (IDO1),
hepatocyte growth factor and transforming growth factor-β1 (TGF-β)
in MSCs (5,6). Notably, IDO1 exhibits important
immunomodulatory properties (7).
The IDO1 level in MSCs increased significantly in mixed lymphocyte
reaction cultures compared with normal culture conditions,
resulting in consumption of tryptophan and the accumulation of
kynurenine in the medium, thus inhibiting the proliferation of
lymphocytes (8). In addition,
IFN-γ may have other effects on MSCs. The tryptophan depletion
mediated by IDO1 inhibited the proliferation of MSCs in serum-free
medium containing IFN-γ. However, in the presence of serum
containing an IDO1 inhibitor, 1-methyl-tryptophan, proliferation of
MSCs was not markedly inhibited by IFN-γ. The mechanism underlying
the inhibition of MSC proliferation by IFN-γ remains to be fully
elucidated (9). Furthermore, IFN-γ
may suppress the differentiation of MSCs. For example, IFN-γ
affected adipogenesis and osteogenesis of MSCs by inhibiting
adipsin, adipoQ and secreted phosphoprotein 1, integrin-binding
sialoprotein expression levels (10). These inhibitory effects were
verified by in vivo experiments; however, the underlying
mechanisms remain unclear. IFN-γ may also influence the apoptosis,
phenotype and chemotactic factors of MSCs (11,12).
MicroRNAs (miRNAs) are small, non-coding RNAs,
typically ~22 nucleotides in length. They regulate gene expression
by degrading mRNA or inhibiting mRNA translation (13). miRNAs are involved in the
regulation of diverse cellular processes, including apoptosis,
proliferation, differentiation and metabolism (14,15).
Previous studies have confirmed that miRNAs contribute to the
regulation of the functions of MSCs, including chondrogenesis,
adipogenic differentiation, osteogenic differentiation,
proliferation and senescence (16,17).
For example, miR-449a may recognize and inhibit the expression of
lymphoid enhancer-binding factor-1, resulting in regulation of the
chondrogenesis of human MSCs (18). In addition, numerous other miRNAs
are involved in the regulation of MSCs, including miR-193, miR-138,
miR-486-5p and miR-22 (19).
Although numerous studies have demonstrated that miRNAs are key
regulators of the majority of the biological processes of MSCs, the
miRNAs involved in the regulation of MSCs by IFN-γ have rarely been
systematically studied (20).
In the present study, UC-MSCs were incubated with
IFN-γ (IFN-UC-MSCs). The miRNA expression profiles of UC-MSCs and
IFN-UC-MSCs were subsequently analyzed using miRNA arrays. The
results of the present study demonstrated that there were
significant differences between the miRNA profiles in UC-MSCs and
IFN-UC-MSCs, and that various miRNAs may be involved in the
regulation of MSCs by IFN-γ.
Materials and methods
Ethics statement
This study was performed in accordance with the
ethical standards of the institutional review board on human
experimentation, the Institutional Review Board of the Institute of
Hematology & Blood Diseases Hospital, Chinese Academy of
Medical Sciences & Peking Union Medical College (Tianjin,
China), and was approved by this review board. Human umbilical
cords (n=11) were obtained from healthy donors with written
informed consent.
Generation of UC-MSCs
UC-MSCs were isolated and expanded from human
umbilical cords as described previously (1). UC-MSCs were cultured in Dulbecco's
modified Eagle medium (DMEM) with nutrient mixture F-12 (Gibco;
Thermo Fisher Scientific, Inc., Waltham, MA, USA) containing 10%
fetal calf serum (FCS; HyClone; GE Healthcare Life Sciences, Logan,
UT, USA), 100 U/ml penicillin (Sigma-Aldrich; Merck Millipore,
Darmstadt, Germany), 100 µg/ml streptomycin (Sigma-Aldrich; Merck
Millipore), 2 mM glutamine and 10 ng/ml epidermal growth factor
(PeproTech, Inc., Rocky Hill, NJ, USA). This mixture medium is
referred to as culture medium. Cells were cultured at 37°C in a
humidified atmosphere containing 5% carbon dioxide in a Forma™
Steri-Cycle™ CO2 Incubator (Thermo Fisher Scientific, Inc.).
UC-MSCs were stained with rhodamine phalloidin and DAPI and
observed under a confocal microscope.
Immunophenotyping of UC-MSCs
UC-MSCs were harvested and placed into tubes at a
density of 1×10⁵ cells/tube. Cells were washed twice in
phosphate-buffered saline (PBS) by centrifugation at 180 × g
for 5 min at room temperature, and labeled with the following
antibodies (10 µl/tube) purchased from BD Pharmingen (San Diego,
CA, USA) for 1 h at 4°C: Mouse anti-cluster of differentiation (CD)
11b-phycoerythrin (PE; catalog no. 555388), mouse anti-CD19-PE
(catalog no. 555413), mouse anti-CD31-fluorescein isothiocyanate
(FITC; catalog no. 555445), mouse anti-CD34-allophycocyanin (APC;
catalog no. 555824), mouse anti-CD44-PE (catalog no. 555479), mouse
anti-CD45-FITC (catalog no. 555482), mouse anti-CD73-PE (catalog
no. 550257), mouse anti-CD90-FITC (catalog no. 555595), mouse
anti-CD105-PE (catalog no. 560839), mouse anti-CD106-PE (catalog
no. 555647), mouse anti-CD166-PE (catalog no. 559263) and human
leukocyte antigen D related (HLA-DR)-FITC (catalog no. 555811).
FITC-(catalog no. 555748), APC-(catalog no. 555751) or
PE-conjugated (catalog no. 555749) isotype control antibodies
served as controls. Following incubation, UC-MSCs were washed with
PBS, resuspended in 2% paraformaldehyde and analyzed on a BD™ LSR
II flow cytometer (BD Biosciences) using BD FACSDiva™ software
version 6.1.3 (BD Biosciences).
Osteogenic differentiation
UC-MSCs were cultured in 24-well cell culture plates
(Corning Incorporated, Corning, NY, USA) until they reached 60%
confluence. Osteogenic medium was then used to culture UC-MSCs for
three weeks. Osteogenic medium comprised low-glucose (LG)-DMEM
(Gibco; Thermo Fisher Scientific, Inc.), 10% FCS, 0.1 µM
dexamethasone (Sigma-Aldrich; Merck Millipore), 0.2 µM ascorbic
acid-2-phosphate (AsA; Sigma-Aldrich; Merck Millipore) and 10 mM
glycerol-2-phosphate (Sigma-Aldrich; Merck Millipore).
Adipogenic differentiation
UC-MSCs were cultured in 24-well cell culture plates
until they reached 60% confluence. Adipogenic medium was then used
to culture UC-MSCs for three weeks. Adipogenic medium comprised
LG-DMEM (Gibco; Thermo Fisher Scientific, Inc.), 10% FCS, 1 µM
dexamethasone, 0.5 µM 3-isobutyl-1-methylxanthine (Sigma-Aldrich;
Merck Millipore), 10 µg/ml insulin (Sigma-Aldrich; Merck Millipore)
and 100 µM indomethacin (Sigma-Aldrich; Merck Millipore).
Chondrogenic differentiation
UC-MSCs were transferred into 15-ml centrifuge tubes
(Corning Incorporated) at 5×10⁵ cells/tube and centrifuged at 110 ×
g for 3 min at room temperature. The pelleted micromass of
UC-MSCs formed at the bottom of each tube was treated with
chondrogenic medium for three weeks. Chondrogenic medium comprised
high-glucose (HG)-DMEM (Gibco; Thermo Fisher Scientific, Inc.), 0.1
µM dexamethasone, 50 µg/ml AsA, 100 µg/ml sodium pyruvate (Lonza
Group, Basel, Switzerland), 40 µg/ml proline (Sigma-Aldrich; Merck
Millipore), 10 ng/ml TGF-β1 (PeproTech, Inc.) and 1%
insulin-transferrin-selenium-A (Gibco; Thermo Fisher Scientific,
Inc.).
Cellular staining
UC-MSCs were stained with Von Kossa reagents to
evaluate mineralized matrix formation following osteogenic
differentiation, and were stained with oil-red O to evaluate lipid
droplets following adipogenic differentiation. Osteogenic and
adipogenic differentiation were observed under an Olympus
IX71-22-000–2 (Olympus Corporation, Tokyo, Japan) inverted
microscope. The cellular pellets obtained from the chondrogenic
differentiation assay were fixed in 2% paraformaldehyde for 24 h,
embedded in optimal cutting temperature compound (Thermo Fisher
Scientific, Inc.) and frozen at −80°C. Samples were sectioned into
6 µm-thick slices on a cryostat and stained with Alcian blue 8GX
(Sigma-Aldrich; Merck Millipore) to evaluate sulfated
proteoglycans. The analysis of chondrogenic differentiation was
performed using a Nikon Eclipse 80i microscope (Nikon Corporation,
Tokyo, Japan).
IFN-γ treatment
UC-MSCs obtained from one donor were seeded in two
T75 culture flasks (Corning Incorporated) in culture medium at a
density of 2×10⁶ cells per flask. A total of 24 h later, the
culture medium was replaced, with one flask receiving fresh medium
and the other ‘IFN-γ-medium’, in which 30 ng/ml recombinant IFN-γ
(PeproTech, Inc.) was added to the culture medium. Cells were
cultured for 24 h (5).
RNA extraction
Total RNA was extracted with mirVana™ miRNA
Isolation kit (Ambion; Thermo Fisher Scientific, Inc.) according to
the manufacturer's instructions. The quality and quantity of the
total RNA was assessed by NanoDrop™ 2000 spectrophotometry (Thermo
Fisher Scientific, Inc.).
miRNA array
TaqMan Array Human MicroRNA A+B Cards Set version
3.0 was purchased from Applied Biosystems (Thermo Fisher
Scientific, Inc.). This two-card set includes Card A, which focuses
on more highly characterized miRNAs and Card B, containing more
recently discovered miRNAs. This makes a total of 754 unique assays
specific to human miRNAs, and each card contains four control
assays (three carefully selected candidate endogenous control
assays and one negative control assay). The miRNA array was
performed by Invitrogen (Thermo Fisher Scientific, Inc.; cnservice.invitrogen.com). Two assays were
performed in parallel, using UC-MSCs obtained from two separate
donors.
Validation of miRNA expression levels
by reverse transcription-quantitative polymerase chain reaction
(RT-qPCR)
UC-MSCs obtained from five donors were cultured and
treated with IFN-γ. RNA was extracted and assessed as described
above. Total RNA (500 ng) was used to generate the single-stranded
cDNA of a specific regulated miRNA using the TaqMan™ MicroRNA RT
kit (Applied Biosystems; Thermo Fisher Scientific, Inc.) and the
miRNA-specific stem-loop RT primer according to the manufacturer's
instructions. The primers used were as follows: hsa-miR-7-5p
stem-loop RT primer,
5′-GTCGTATCCAGTGCAGGGTCCGAGGTATTCGCACTGGATACGACACAACAA-3′;
hsa-miR-34a-3p stem-loop RT primer,
5′-GTCGTATCCAGTGCAGGGTCCGAGGTATTCGCACTGGATACGACAGGGCAG-3′;
hsa-miR-145-3p stem-loop RT primer,
5′-GTCGTATCCAGTGCAGGGTCCGAGGTATTCGCACTGGATACGACAGAACAG-3′;
hsa-miR-301a-3p stem-loop RT primer,
5′-GTCGTATCCAGTGCAGGGTCCGAGGTATTCGCACTGGATACGACGCTTTGA-3′;
hsa-miR-323a-3p stem-loop RT primer,
5′-GTCGTATCCAGTGCAGGGTCCGAGGTATTCGCACTGGATACGACAGAGGTC-3′;
hsa-miR-331-5p stem-loop RT primer,
5′-GTCGTATCCAGTGCAGGGTCCGAGGTATTCGCACTGGATACGACGGATCCC-3′;
hsa-miR-382-5p stem-loop RT primer,
5′-GTCGTATCCAGTGCAGGGTCCGAGGTATTCGCACTGGATACGACCGAATCC-3′;
hsa-miR-424-3p stem-loop RT primer,
5′-GTCGTATCCAGTGCAGGGTCCGAGGTATTCGCACTGGATACGACATAGCAG-3′. qPCR was
performed with a 7900HT Real-Time PCR system (Applied Biosystems;
Thermo Fisher Scientific, Inc.) using the SYBR™ Select Master Mix
(Applied Biosystems; Thermo Fisher Scientific, Inc.). The primers
used were as follows: hsa-miR-7-5p forward,
5′-GGCGGTGGAAGACTAGTGATT-3′ (64 bp); hsa-miR-34a-3p forward,
5′-GGCGGCAATCAGCAAGTATAC-3′ (63 bp); hsa-miR-145-3p forward,
5′-GCGGGGATTCCTGGAAATAC-3′ (62 bp); hsa-miR-301a-3p forward,
5′-TTCGGCAGTGCAATAGTATTGTC-3′ (63 bp); hsa-miR-323a-3p forward,
5′-GCGGCACATTACACGGTCG-3′ (61 bp); hsa-miR-331-5p forward,
5′-CGGCTAGGTATGGTCCCAG-3′ (61 bp); hsa-miR-382-5p forward,
5′-TCGGGAAGTTGTTCGTGGTG-3′ (62 bp); hsa-miR-424-3p forward,
5′-ATTGGCAAAACGTGAGGCGC-3′ (62 bp); the common reverse primer,
5′-CAGTGCAGGGTCCGAGGTAT-3′. The RT-qPCR data were normalized using
the ΔΔCq method (21) and the
endogenous reference gene, U6. The U6 primers were as follows:
Forward, 5′-CTCGCTTCGGCAGCACA-3′; reverse,
5′-AACGCTTCACGAATTTGCGT-3′.
Statistical and bioinformatics
analysis
Fold-change was used to identify the miRNAs that
were significantly differentially expressed. miRNA information was
obtained by referencing the 18th human miRBase (www.mirbase.org/).
The target genes of significantly regulated miRNAs
were predicted using two online databases, miRanda (www.microrna.org/microrna/home.do) and
TartgetScan (www.targetscan.org/vert_71/), to avoid the
overpredicting limitation of individual programs and reduce the
potential for false positives. The intersection of genes was
selected as the preliminary screening target genes.
The significant, accurate and targeting functions of
these genes were analyzed through gene ontology (GO) analysis
(geneontology.org/). All functions of the
preliminary screening target genes were obtained, and then the
Fisher's exact test was used to calculate the P-value and the
chi-square test was used to calculate the Pk-value. The false
discovery rate (FDR) was calculated to correct the P-value, as the
smaller the FDR, the smaller the error in judging the P-value. The
FDR was defined as FDR=1-Nk/T, where Nk refers to the number of
P-values less than Pk-values and T refers to the number of
Pk-values less than P-values. P<0.001 was considered to indicate
a statistically significant difference. In addition, enrichment
analysis was performed. When the P-values of the functions were
identical, the lower enrichment degree represented that the
function was described in more detail in the GO system. Through GO
analysis the significant functions of target genes were determined.
The pathways of the preliminary screening target genes were
analyzed using the Kyoto Encyclopedia of Genes and Genomes (KEGG)
system. The P-value and FDR of these target gene pathways was
calculated with the Fisher's exact test and multiple comparison
test. P<0.05 was considered to indicate a statistically
significant difference. Through pathway analysis the significant
pathways regulated by target genes were determined. The analysis
was performed by Genminix Informatics Ltd., Co. (Shanghai,
China).
Results
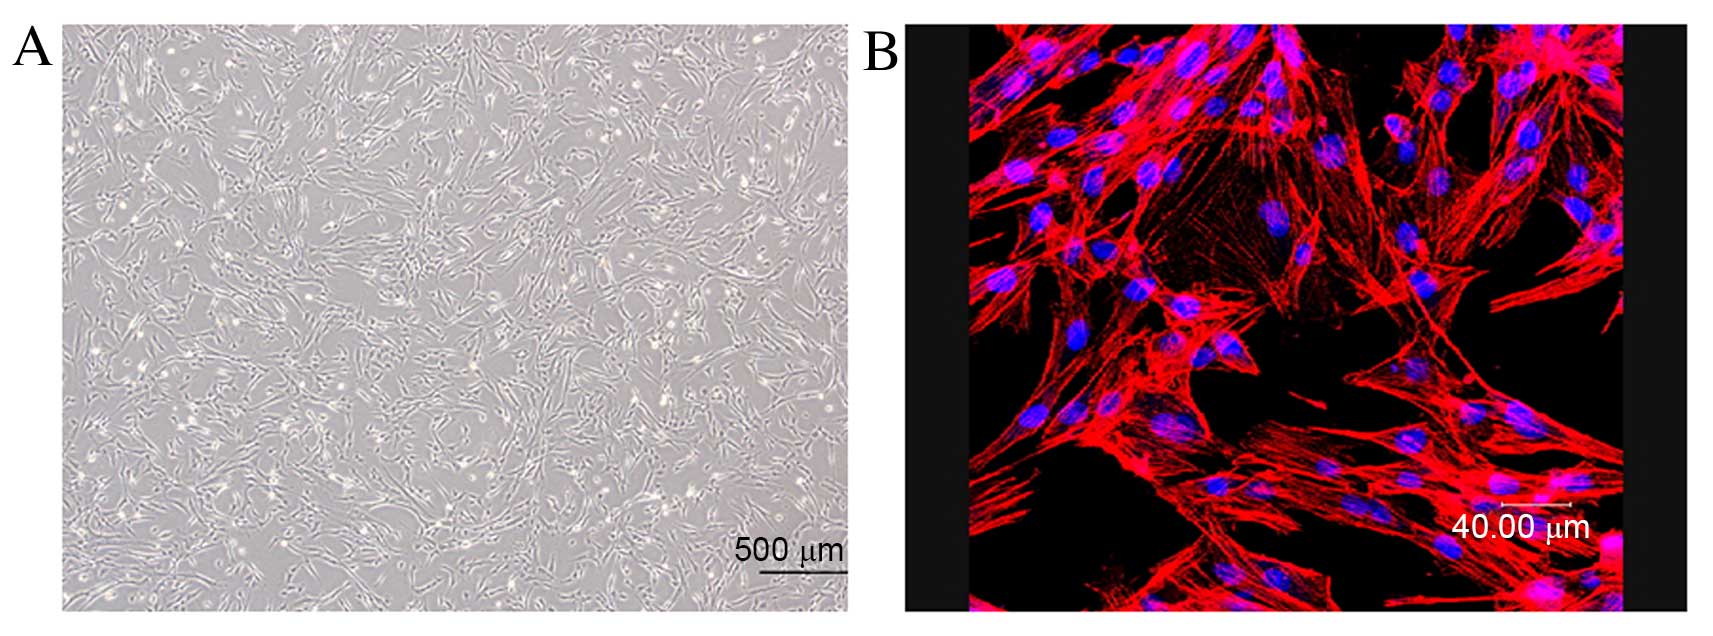
Identification of UC-MSCs
Fibroblast-like cells adhered to the plastic bottom
of flasks were observed under an inverted light microscope
(Fig. 1A). Rhodamine phalloidin,
an actin filament fluorescent dye, was used to stain cells to
identify the shape of fibroblast-like cells under a confocal
fluorescent microscope (Fig.
1B).
Flow cytometry of UC-MSCs revealed them to be
positive for CD44, CD73, CD90, CD105 and CD166, and negative for
CD11b, CD19, CD31, CD34, CD45, CD106 and HLA-DR (Fig. 2). These findings are in accordance
with the minimal criteria for the definition of MSCs (22). In addition, the minimal criteria
state that MSCs must differentiate into osteoblasts, adipocytes and
chondroblasts in vitro. Therefore, differentiation
experiments were performed.
 | Figure 2.Phenotype of UC-MSCs. The phenotype
of UC-MSCs was analyzed by flow cytometry. UC-MSCs were positive
for CD44, CD73, CD90, CD105 and CD166, and negative for CD11b,
CD19, CD31, CD34, CD45, CD106 and HLA-DR. The blue line in each
histogram represents staining with the appropriate isotype control
antibody. UC-MSCs, umbilical cord-mesenchymal stem cells; CD,
cluster of differentiation; PE, phycoerythrin; FITC, fluorescein
isothiocyanate; HLA-DR, human leukocyte antigen-D related. |
Following treatment with osteogenic medium for three
weeks, the shape of UC-MSCs altered from fibroblast-like to
polygon. The deposition of mineralized matrix was detected with Von
Kossa reagents (Fig. 3A). Lipid
droplets gradually appeared during treatment with adipogenic medium
for three weeks, and were detected by oil red O staining (Fig. 3B). During chondrogenic
differentiation, UC-MSCs gradually formed a pellet suspended in
medium, and sulfated proteoglycans were detected by Alcian blue 8GX
staining following three weeks (Fig.
3C).
Culture with IFN-γ significantly
alters the miRNA profile of UC-MSCs
The miRNA array data revealed significant changes in
miRNA expression levels in UC-MSCs following treatment with IFN-γ.
A total of 256 miRNAs were detected in UC-MSCs or IFN-UC-MSCs; of
these, 5 miRNAs were detected only in UC-MSCs and 6 miRNAs were
detected only in IFN-UC-MSCs. As the expression levels of these 11
miRNAs were not significantly different between the two groups
(Cq>35), they were not analyzed further. The remaining 245
miRNAs were expressed in UC-MSCs and IFN-UC-MSCs. The expression
levels of these 245 miRNAs were analyzed; 110 miRNAs were
upregulated and 135 miRNAs were downregulated in UC-MSCs following
treatment with IFN-γ (Table
I).
 | Table I.miRNAs expressed in UC-MSCs and
IFN-UC-MSCs. |
Table I.
miRNAs expressed in UC-MSCs and
IFN-UC-MSCs.
| miRNA category | Number | miRNAs |
|---|
| Upregulated
miRNAs | 110 | hsa-let-7g;
hsa-miR-10b; hsa-miR-15b; hsa-miR-16; hsa-miR-17; hsa-miR-18a;
hsa-miR-19a; hsa-miR-19b; hsa-miR-20a; hsa-miR-20b; hsa-miR-25;
hsa-miR-28-3p; hsa-miR-29a; hsa-miR-29b; hsa-miR-92a; mmu-miR-93;
hsa-miR-106a; hsa-miR-128a; hsa-miR-130b; mmu-miR-134; mmu-miR-137;
hsa-miR-148b; hsa-miR-192; hsa-miR-199a; hsa-miR-214; hsa-miR-218;
hsa-miR-223; hsa-miR-299-5p; hsa-miR-301; hsa-miR-323-3p;
hsa-miR-330; hsa-miR-331-5p; hsa-miR-337-5p; hsa-miR-339-5p;
hsa-miR-345; hsa-miR-361; hsa-miR-362-3p; hsa-miR-369-5p;
hsa-miR-370; hsa-miR-376a; mmu-miR-379; hsa-miR-381; hsa-miR-382;
hsa-miR-410; hsa-miR-411; hsa-miR-422a; hsa-miR-424;
hsa-miR-425-5p; hsa-miR-450b-5p; hsa-miR-454; hsa-miR-455-3p;
hsa-miR-485-3p; hsa-miR-487b; hsa-miR-493; hsa-miR-494;
mmu-miR-495; hsa-miR-500; hsa-miR-501; hsa-miR-502-3p; hsa-miR-503;
hsa-miR-532-3p; hsa-miR-532; hsa-miR-539; hsa-miR-590-5p;
hsa-miR-598; hsa-miR-618; hsa-miR-652; hsa-miR-654-3p; hsa-miR-655;
hsa-miR-671-3p; hsa-miR-744; hsa-miR-758; hsa-miR-885-5p;
hsa-miR-886-3p; hsa-miR-886-5p; hsa-miR-376c; hsa-miR-432;
hsa-miR-656; hsa-miR-550; hsa-miR-629; hsa-miR-454#;
hsa-miR-770-5p; hsa-miR-505#; hsa-miR-136#; hsa-miR-130b#;
hsa-miR-93#; hsa-miR-99a#; hsa-miR-149#; hsa-miR-29b-1#;
hsa-miR-99b#; hsa-miR-378; hsa-miR-10a#; hsa-miR-214#; hsa-miR-22#;
hsa-miR-424#; hsa-miR-409-3p; hsa-miR-543; hsa-miR-125b-1#;
hsa-miR-15a#; hsa-miR-18a#; hsa-miR-19b-1#; hsa-miR-20a#;
hsa-miR-21#; hsa-miR-27a#; hsa-miR-29a#; hsa-miR-1227;
hsa-miR-1254; hsa-miR-1275; hsa-miR-320B; hsa-miR-1300 |
| Downregulated
miRNAs | 135 | hsa-let-7a;
hsa-let-7c; hsa-let-7d; hsa-let-7e; hsa-let-7f; hsa-miR-10a;
hsa-miR-21; hsa-miR-24; hsa-miR-26a; hsa-miR-26b; hsa-miR-27a;
hsa-miR-27b; hsa-miR-28; hsa-miR-29c; hsa-miR-30b; hsa-miR-30c;
hsa-miR-31; hsa-miR-34a; hsa-miR-98; hsa-miR-99a; hsa-miR-99b;
hsa-miR-100; hsa-miR-101; hsa-miR-103; hsa-miR-106b;
hsa-miR-125a-5p; hsa-miR-125b; hsa-miR-126; hsa-miR-127;
hsa-miR-130a; hsa-miR-132; hsa-miR-138; hsa-miR-140-3p;
mmu-miR-140; hsa-miR-143; hsa-miR-145; hsa-miR-146a; hsa-miR-146b;
hsa-miR-148a; hsa-miR-149; hsa-miR-152; hsa-miR-181a; hsa-miR-185;
hsa-miR-186; hsa-miR-191; hsa-miR-193a-3p; hsa-miR-193a-5p;
hsa-miR-193b; hsa-miR-194; hsa-miR-195; hsa-miR-196b; hsa-miR-197;
hsa-miR-199a-3p; hsa-miR-204; hsa-miR-210; hsa-miR-221;
hsa-miR-222; hsa-miR-224; hsa-miR-296; hsa-miR-302b; hsa-miR-320;
hsa-miR-324-3p; hsa-miR-324-5p; hsa-miR-328; hsa-miR-331;
hsa-miR-335; hsa-miR-339-3p; hsa-miR-340; hsa-miR-155; hsa-let-7b;
hsa-miR-342-3p; hsa-miR-362; hsa-miR-365; hsa-miR-374;
mmu-miR-374-5p; hsa-miR-423-5p; hsa-miR-452; hsa-miR-455;
hsa-miR-483-5p; hsa-miR-484; hsa-miR-489; mmu-miR-491;
hsa-miR-542-3p; hsa-miR-574-3p; hsa-miR-582-5p; hsa-miR-625;
hsa-miR-628-5p; hsa-miR-660; hsa-miR-708; hsa-miR-212; dme-miR-7;
hsa-miR-30a-3p; hsa-miR-30a-5p; hsa-miR-30d; hsa-miR-30e-3p;
hsa-miR-126#; hsa-miR-206; hsa-miR-213; rno-miR-7#; hsa-miR-589;
hsa-miR-766; hsa-miR-769-5p; hsa-miR-222#; hsa-miR-34b;
hsa-miR-31#; hsa-miR-33a#; hsa-miR-100#; hsa-miR-145#;
hsa-miR-27b#; hsa-miR-335#; hsa-miR-942; hsa-miR-875-5p;
hsa-miR-151-3p; hsa-miR-425#; hsa-miR-30d#; hsa-miR-10b#;
hsa-miR-34a#; hsa-miR-181a-2#; hsa-miR-550; hsa-miR-625#;
hsa-miR-24-2#; hsa-miR-26a-1#; hsa-miR-151-5P; hsa-miR-590-3P;
hsa-miR-1233; hsa-miR-1271; hsa-miR-1285; hsa-miR-1183;
hsa-miR-1180; hsa-miR-1290; hsa-miR-1274A; hsa-miR-1274B;
hsa-miR-720; hsa-miR-1260; hsa-miR-664 |
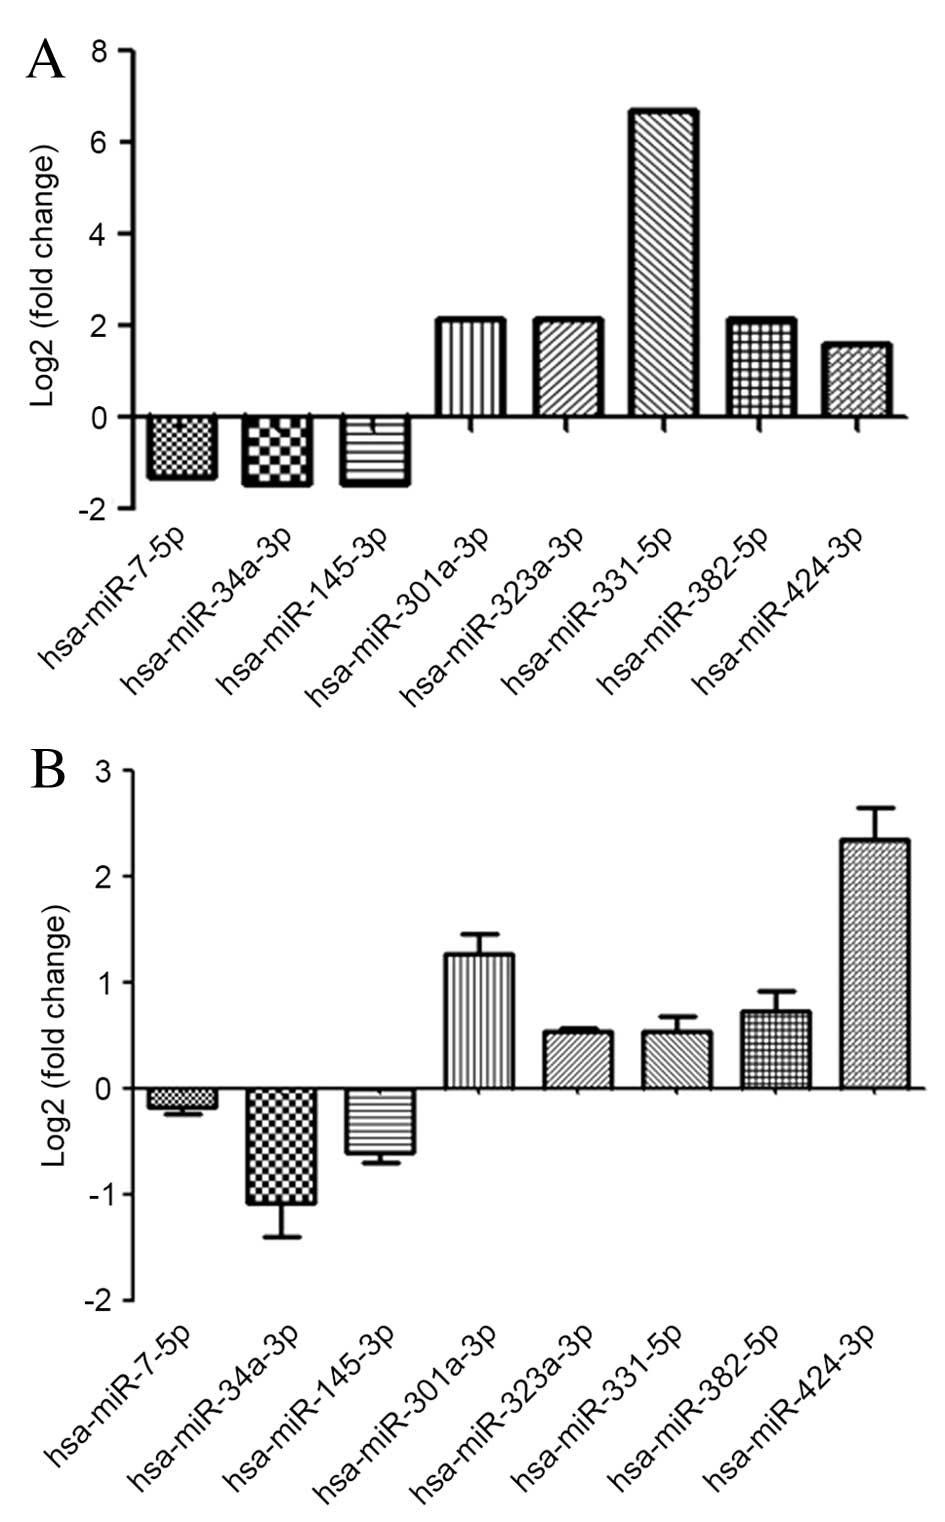
A total of 21 miRNAs exhibited >2-fold
upregulation and 41 miRNAs exhibited >2-fold downregulation.
miRNAs whose fold-changes were <2-fold in one of the two
experiments or that altered in opposite directions in the two
experiments were excluded from further analysis. A total of 10
miRNAs were significantly regulated by >2-fold and were altered
in the same direction in the two experiments. As 2 miRNAs
(miRNA-886-5p and miRNA-1300) had been removed from the 18th human
miRBase, further analysis was performed on 8 significantly
regulated miRNAs. RT-qPCR was performed to validate the results of
the miRNA array; 5 of the miRNAs were upregulated and 3 were
downregulated in IFN-UC-MSCs compared with UC-MSCs. (Fig. 4; Table II).
| Table II.Significantly regulated miRNAs. |
Table II.
Significantly regulated miRNAs.
| miRNA name | miRNA array | RT-qPCR |
|---|
|
|
|
|---|
| Human 18th miRBase
ID | Assay ID | Fold-change | Direction | Fold-change | Direction |
|---|
| hsa-miR-7-5p | dme-miR-7 | 2.488 | Down | 1.12 | Down |
| hsa-miR-34a-3p | hsa-miR-34a# | 2.688 | Down | 1.91 | Down |
| hsa-miR-145-3p | hsa-miR-145# | 2.71 | Down | 1.51 | Down |
|
hsa-miR-301a-3p | hsa-miR-301 | 4.414 | Up | 2.494 | Up |
| hsa-miR-331-5p | hsa-miR-323-3p | 4.44 | Up | 1.457 | Up |
| hsa-miR-382-5p | hsa-miR-331-5p | 105.664 | Up | 1.489 | Up |
|
hsa-miR-323a-3p | hsa-miR-382 | 4.456 | Up | 1.727 | Up |
| hsa-miR-424-3p | hsa-miR-424# | 3.024 | Up | 5.5 | Up |
Target genes of significantly
regulated miRNAs and the ‘microRNA-Gene-Network’
Target gene prediction for the 8 differentially
expressed miRNAs was performed using two online databases,
TargetScan and miRanda. A total of 2,494 predicted genes were
obtained from TargetScan, and 2,271 predicted genes were acquired
from miRanda. To increase the specificity, only genes predicted by
the two databases were examined, leaving 816 predicted target genes
(Fig. 5).
GO and pathway analyses were applied to identify the
key genes in the significant functions and pathways from the
predicted target genes. A total of 149 significant overlapping
genes were obtained following these two analyses (Table III). The miRNA-Gene-Network was
used to evaluate the status of miRNAs and genes (Fig. 6). The functions of the identified
genes are listed in Table IV.
| Table III.Predicted target genes of
significantly regulated miRNAs. |
Table III.
Predicted target genes of
significantly regulated miRNAs.
| miRNA | Target genes |
|---|
| hsa-miR-145-3p | smad4; arnt;
pax8; kcmj1; yes1; itgb3; creb5; pbx3; ddx6; grik2; slc1a2 |
| hsa-miR-34a-3p | fgf9; jun;
hdac2; acvr2b; cab39; cer1; dusp1; pip4k2a; zeb1 |
| hsa-miR-7-5p | egfr; rb1; gli3;
pik3cd; raf1; prkcb; rps6kb1; sp1; irs1; ddit4; ehd1; psen1; mknk1;
col2a1; tab2; cacng7; rras2; kcnj2; grin2a; slit1; cul5; ccnt2;
pbx3; sels; exosc2; cnot8; smc1a; slc38a2 |
|
hsa-miR-301a-3p | fzd6; igf1;
pparg; appl1; pten; tgfa; wnt1; tgfbr2; sos2; egln3; ralbp1; wnt2b;
met; inhbb; bmpr2; smad5; skp1; acvr1; nr3c2; ereg; shc3; prkaa1;
tsc1; ulk2; vps37a; rab5a; cav2; eps15; psd; arap2; ldlr; cltc;
tbl1xr1; fosl1; wasl; ppargc1a; itgb8; pikfyve; gja1; adcy1; itpr1;
chrnb2; nrp1; robo2; dpysl2; kcnj10; ube2d2; ube2d1; birc6; sar1b;
plaa; pdk1; bhlhe41; pan3; ddx6; cnot7; cnot4; dcp2; lrp2; pik3c2a;
tfdp2; homer1; tnfrsf1b; csf1; il6st |
|
hsa-miR-323a-3p | appl1; tgfa;
smad3; kras; cdkn1b; smurf1; atp1b1; rictor; ulk2; dnajc6; fbxw11;
nlk; lmo7; ppp1cc; ppp1cb; map4k4; map3k2; gna13; enah; gnai1;
kcnq3; epha5; sema6d; pbx3; roar; ccl2; tnfsf11 |
| hsa-miR-331-5p | smad2; map3k2;
epha4; cnot4; ccl21 |
| hsa-miR-382-5p | runx1; casp3;
skp1; sgk1; pdpk1; shc4; usp8; hspa2; arhgef7; kcnq3; srgap2;
ube2g1; il6st |
| hsa-miR-424-3p | fos;
smad7 |
| Table IV.The functions of the predicted target
genes. |
Table IV.
The functions of the predicted target
genes.
| Gene | P-value |
|---|
| Proliferation |
|
|
cav2 | 1.80E-10 |
|
cdkn1b | 1.80E-10 |
|
cer1 | 1.80E-10 |
|
cnot8 | 1.80E-10 |
|
ereg | 1.80E-10 |
|
gja1 | 1.80E-10 |
|
gli3 | 1.80E-10 |
|
igf1 | 1.80E-10 |
|
jun | 1.80E-10 |
|
pparg | 1.80E-10 |
|
smad2 | 1.80E-10 |
|
smad3 | 1.80E-10 |
|
smad4 | 1.80E-10 |
|
tsc1 | 1.80E-10 |
|
zeb1 | 1.80E-10 |
|
birc6 | 1.40E-06 |
|
csf1 | 1.40E-06 |
|
egfr | 1.40E-06 |
|
fgf9 | 1.40E-06 |
|
hdac2 | 1.40E-06 |
|
il6st | 1.40E-06 |
|
irs1 | 1.40E-06 |
|
tgfbr2 | 1.40E-06 |
|
wnt1 | 1.40E-06 |
|
appl1 | 7.95E-06 |
|
bhlhe41 | 7.95E-06 |
|
cul5 | 7.95E-06 |
|
eps15 | 7.95E-06 |
|
lrp2 | 7.95E-06 |
|
met | 7.95E-06 |
|
pten | 7.95E-06 |
|
raf1 | 7.95E-06 |
|
tgfa | 7.95E-06 |
|
usp8 | 7.95E-06 |
|
bmpr2 | 8.76E-05 |
|
egln3 | 8.76E-05 |
|
nr3c2 | 8.76E-05 |
|
sgk1 | 8.76E-05 |
|
Differentiation |
|
|
arnt | 7.21E-14 |
|
bhlhe41 | 7.21E-14 |
|
csf1 | 7.21E-14 |
|
dpysl2 | 7.21E-14 |
|
ereg | 7.21E-14 |
|
gna13 | 7.21E-14 |
|
inhbb | 7.21E-14 |
|
nrp1 | 7.21E-14 |
|
pax8 | 7.21E-14 |
|
pik3cd | 7.21E-14 |
|
robo2 | 7.21E-14 |
|
sema6d | 7.21E-14 |
|
slit1 | 7.21E-14 |
|
smurf1 | 7.21E-14 |
|
tnfsf11 | 7.21E-14 |
|
zeb1 | 7.21E-14 |
| Apoptosis |
|
|
acvr1 | 9.54E-08 |
|
cdkn1b | 9.54E-08 |
|
col2a1 | 9.54E-08 |
|
gli3 | 9.54E-08 |
|
hdac2 | 9.54E-08 |
|
prkaa1 | 9.54E-08 |
|
pten | 9.54E-08 |
|
rps6kb1 | 9.54E-08 |
|
smad3 | 9.54E-08 |
|
wnt1 | 9.54E-08 |
|
appl1 | 0.00026423 |
|
arhgef7 | 0.00026423 |
|
birc6 | 0.00026423 |
|
ddit4 | 0.00026423 |
|
egln3 | 0.00026423 |
|
gja1 | 0.00026423 |
|
prkcb | 0.00026423 |
|
psen1 | 0.00026423 |
|
raf1 | 0.00026423 |
|
sos2 | 0.00026423 |
|
tgfbr2 | 0.00026423 |
|
tnfrsf1b | 0.00026423 |
|
ppargc1a | 0.000494088 |
|
tgfa | 0.000494088 |
| Migration |
|
|
igf1 | 1.73E-05 |
|
il6st | 1.73E-05 |
|
nrp1 | 1.73E-05 |
|
rps6kb1 | 1.73E-05 |
|
gja1 | 0.000551751 |
|
met | 0.000551751 |
|
psen1 | 0.000551751 |
| TGF-β/BMP signaling
pathway |
|
|
acvr1 | 4.69E-09 |
|
ccl2 | 4.69E-09 |
|
fos | 4.69E-09 |
|
jun | 4.69E-09 |
|
nlk | 4.69E-09 |
|
smad2 | 4.69E-09 |
|
smad3 | 4.69E-09 |
|
smad4 | 4.69E-09 |
|
smad7 | 4.69E-09 |
|
smurf1 | 4.69E-09 |
|
tgfbr2 | 4.69E-09 |
|
ube2d1 | 4.69E-09 |
|
acvr2b | 1.25E-06 |
|
bmpr2 | 1.25E-06 |
|
cer1 | 1.25E-06 |
|
smad5 | 1.25E-06 |
|
zeb1 | 1.68E-06 |
|
wnt1 | 0.000231202 |
| FGF signaling
pathway |
|
|
cdkn1b | 0.000165506 |
|
fgf9 | 0.000165506 |
|
irs1 | 0.000165506 |
|
rictor | 0.000165506 |
| EGFR signaling
pathway |
|
|
egfr | 2.75E-06 |
|
raf1 | 2.75E-06 |
|
ereg | 2.75E-06 |
|
shc3 | 2.75E-06 |
|
eps15 | 2.75E-06 |
|
cltc | 2.75E-06 |
|
kras | 2.75E-06 |
|
arhgef7 | 2.75E-06 |
Discussion
MSCs affect innate and adaptive immunity; these
immunomodulatory effects are induced by certain inflammatory
cytokines, including IFN-γ (4). In
addition, IFN-γ affects numerous other biological characteristics
of MSCs (10–12). However, the mechanisms underlying
the effect of IFN-γ on MSCs remain to be fully elucidated. As
intracellular miRNAs are essential regulators of proliferation,
survival, migration, differentiation and paracrine functions of
MSCs (19), it was hypothesized
that miRNAs are involved in the effects of IFN-γ on MSCs.
Through miRNA arrays, it was demonstrated that the
miRNA expression profile of UC-MSCs was significantly altered
following stimulation with IFN-γ. Expression of 256 microRNAs were
detected in UC-MSCs or IFN-UC-MSCs of the 754 analyzed. Of these, 5
miRNAs were detected only in UC-MSCs and 6 miRNAs were detected
only in IFN-UC-MSCs; these were excluded from further analysis due
to their weak expression (Cq>35). Following statistical
analysis, 8 significantly differentially expressed miRNAs were
identified from the 245 miRNAs detected in UC-MSCs and IFN-UC-MSCs.
RT-qPCR analysis of these 8 miRNAs demonstrated results consistent
with the miRNA array data. Bioinformatics analysis of the 8 miRNAs
identified 149 significant target genes. In addition to regulation
of transcription, the functions of these genes were associated with
cell growth, proliferation, apoptosis, differentiation and
migration.
Hsa-miR-34a-3p, hsa-miR-7-5p and hsa-miR-145-3p were
downregulated in IFN-UC-MSCs compared with UC-MSCs. Guennewiq et
al (23) demonstrated that
hsa-miR-34a-3p may influence cellular apoptosis via targeting SP4
transcription factor, which is involved in TGF-β signaling.
Epidermal growth factor receptor (EGFR) is an important target gene
of hsa-miR-7-5p. Vasanthan et al (24) revealed that knockdown of
hsa-miR-7-5p resulted in increased EGFR expression. Numerous
studies have reported that EGFR regulates cellular proliferation.
For example, Li et al (25)
suggested the EGFR/mitogen-activated protein kinase signaling has a
principle function in regulating the proliferation of renal and
nephric stem cells. Hsa-miR-301a-3p was one of 5 miRNAs,
(hsa-miR-301a-3p, hsa-miR-323a-3p, hsa-miR-331-5p, hsa-miR-382-5p
and hsa-miR-424-3p) upregulated in IFN-UC-MSCs compared with
UC-MSCs. Lu et al (26)
demonstrated that the miR-301 and miR-302 families target serine
and arginine rich splicing factor 2 and methyl-CpG binding domain
protein 2a, and are involved in human pluripotent stem cell
self-renewal and reprogramming. In our previous study, miR-301a was
upregulated by Toll-like receptor signaling in UC-MSCs. Attenuation
or enhancement of the expression of miR-301a altered the quantity
of inflammation-associated cytokines secreted by UC-MSCs
accordingly (27). Previous
studies have indicated that hsa-miR-323a-3p is a potential
therapeutic target for rheumatoid arthritis, and it has been
associated with Wnt/cadherin signaling (28,29).
Seok et al (30) revealed
that hsa-miR-382-5p may be involved in vascular endothelial cell
proliferation, migration and tube formation in hypoxic conditions
via the regulation of phosphatase and tensin homolog. The results
of GO analysis in the present study suggested that numerous other
predicted target genes may contribute to cellular proliferation,
apoptosis, differentiation and migration. Further studies are
required to determine whether the predicted genes are authentic
targets of the regulated miRNAs.
Through gene function analysis, various important
signaling pathways were identified. Hsa-miR-34a-3p, hsa-miR-145-3p,
hsa-miR-301a-3p, hsa-miR-323a-3p, hsa-miR-331-5p and hsa-miR-424-3p
were predicted to regulate the TGF-β/bone morphogenetic protein
(BMP) signaling pathway. The TGF-β/BMP signaling pathway has been
reported to be associated with osteogenic differentiation of MSCs
(31). Hsa-miR-34a-3p,
hsa-miR-7-5p and hsa-miR-323a-3p were predicted to regulate the
fibroblast growth factor signaling pathway, which has been reported
to be important for differentiation, growth and proliferation of
MSCs (32,33). Hsa-miR-7-5p, hsa-miR-301a-3p and
hsa-miR-323a-3p were predicted to affect the EGFR signaling
pathway, which may regulate the proliferation, differentiation and
paracrine capability of MSCs (34,35).
miRNAs upregulated and downregulated in IFN-UC-MSCs compared with
UC-MSCs are predicted to target genes involved in the same
signaling pathway. This suggests that the mechanism underlying the
involvement of miRNAs in the effect of IFN-γ on MSCs are complex
and require further investigation.
In conclusion, the present study systematically
analyzed the effect of IFN-γ on the miRNA profile of UC-MSCs, to
the best of our knowledge for the first time. The results of the
present study suggest that miRNAs may be crucial in mediating the
effects of IFN-γ on the biological functions of MSCs. The
identification of these miRNAs may indicate a novel direction for
research of the molecular mechanism underlying the effect of IFN-γ
on MSCs, which may provide insight into the influence of
inflammatory environment on MSCs and their immunomodulatory
function.
Acknowledgements
The present study was supported by the National
Natural Science Foundation of China (grant nos. 81330015 and
31470951) and the National Science and Technology Major Project
(grant no. 2014ZX09508002-003).
References
|
1
|
Lu LL, Liu YJ, Yang SG, Zhao QJ, Wang X,
Gong W, Han ZB, Xu ZS, Lu YX, Liu D, et al: Isolation and
characterization of human umbilical cord mesenchymal stem cells
with hematopoiesis-supportive function and other potentials.
Haematologica. 91:1017–1026. 2006.PubMed/NCBI
|
|
2
|
Pittenger MF, Mackay AM, Beck SC, Jaiswal
RK, Douglas R, Mosca JD, Moorman MA, Simonetti DW, Craig S and
Marshak DR: Multilineage potential of adult human mesenchymal stem
cells. Science. 284:143–147. 1999. View Article : Google Scholar : PubMed/NCBI
|
|
3
|
Salem HK and Thiemermann C: Mesenchymal
stromal cells: Current understanding and clinical status. Stem
Cells. 28:585–596. 2010.PubMed/NCBI
|
|
4
|
Wang Y, Chen X, Cao W and Shi Y:
Plasticity of mesenchymal stem cells in immunomodulation:
Pathological and therapeutic implications. Nat Immunol.
15:1009–1016. 2014. View
Article : Google Scholar : PubMed/NCBI
|
|
5
|
Chen K, Wang D, Du WT, Han ZB, Ren H, Chi
Y, Yang SG, Zhu D, Bayard F and Han ZC: Human umbilical cord
mesenchymal stem cells hUC-MSCs exert immunosuppressive activities
through a PGE2-dependent mechanism. Clin Immunol. 135:448–458.
2010. View Article : Google Scholar : PubMed/NCBI
|
|
6
|
Krampera M, Cosmi L, Angeli R, Pasini A,
Liotta F, Andreini A, Santarlasci V, Mazzinghi B, Pizzolo G,
Vinante F, et al: Role for interferon-gamma in the immunomodulatory
activity of human bone marrow mesenchymal stem cells. Stem Cells.
24:386–398. 2006. View Article : Google Scholar : PubMed/NCBI
|
|
7
|
Ryan JM, Barry F, Murphy JM and Mahon BP:
Interferon-gamma does not break, but promotes the immunosuppressive
capacity of adult human mesenchymal stem cells. Clin Exp Immunol.
149:353–363. 2007. View Article : Google Scholar : PubMed/NCBI
|
|
8
|
DelaRosa O, Lombardo E, Beraza A,
Mancheño-Corvo P, Ramirez C, Menta R, Rico L, Camarillo E, García
L, Abad JL, et al: Requirement of IFN-gamma-mediated indoleamine
2,3-dioxygenase expression in the modulation of lymphocyte
proliferation by human adipose-derived stem cells. Tissue Eng Part
A. 15:2795–2806. 2009. View Article : Google Scholar : PubMed/NCBI
|
|
9
|
Chan WK, Lau AS, Li JC, Law HK, Lau YL and
Chan GC: MHC expression kinetics and immunogenicity of mesenchymal
stromal cells after short-term IFN-gamma challenge. Exp Hematol.
36:1545–1555. 2008. View Article : Google Scholar : PubMed/NCBI
|
|
10
|
Croitoru-Lamoury J, Lamoury FM, Caristo M,
Suzuki K, Walker D, Takikawa O, Taylor R and Brew BJ: Interferon-γ
regulates the proliferation and differentiation of mesenchymal stem
cells via activation of indoleamine 2,3 dioxygenase (IDO). PLoS
One. 6:e146982011. View Article : Google Scholar : PubMed/NCBI
|
|
11
|
Liu Y, Wang L, Kikuiri T, Akiyama K, Chen
C, Xu X, Yang R, Chen W, Wang S and Shi S: Mesenchymal stem
cell-based tissue regeneration is governed by recipient T
lymphocytes via IFN-γ and TNF-α. Nat Med. 17:1594–1601. 2011.
View Article : Google Scholar : PubMed/NCBI
|
|
12
|
Laschober GT, Brunauer R, Jamnig A, Singh
S, Hafen U, Fehrer C, Kloss F, Gassner R and Lepperdinger G:
Age-specific changes of mesenchymal stem cells are paralleled by
upregulation of CD106 expression as a response to an inflammatory
environment. Rejuvenation Res. 14:119–131. 2011. View Article : Google Scholar : PubMed/NCBI
|
|
13
|
Bartel DP: MicroRNAs: Genomics,
biogenesis, mechanism, and function. Cell. 116:281–297. 2004.
View Article : Google Scholar : PubMed/NCBI
|
|
14
|
Shenoy A and Blelloch RH: Regulation of
microRNA function in somatic stem cell proliferation and
differentiation. Nat Rev Mol Cell Biol. 15:565–576. 2014.
View Article : Google Scholar : PubMed/NCBI
|
|
15
|
Han ZB, Yang Z, Chi Y, Zhang L, Wang Y, Ji
Y, Wang J, Zhao H and Han ZC: MicroRNA-124 suppresses breast cancer
cell growth and motility by targeting CD151. Cell Physiol Biochem.
31:823–832. 2013. View Article : Google Scholar : PubMed/NCBI
|
|
16
|
Wen Z, Zheng S, Zhou C, Yuan W, Wang J and
Wang T: Bone marrow mesenchymal stem cells for post-myocardial
infarction cardiac repair: MicroRNAs as novel regulators. J Cell
Mol Med. 16:657–671. 2012. View Article : Google Scholar : PubMed/NCBI
|
|
17
|
Shin KK, Kim YS, Kim JY, Bae YC and Jung
JS: miR-137 controls proliferation and differentiation of human
adipose tissue stromal cells. Cell Physiol Biochem. 33:758–768.
2014. View Article : Google Scholar : PubMed/NCBI
|
|
18
|
Paik S, Jung HS, Lee S, Yoon DS, Park MS
and Lee JW: miR-449a regulates the chondrogenesis of human
mesenchymal stem cells through direct targeting of lymphoid
enhancer-binding factor-1. Stem Cells Dev. 21:3298–3308. 2012.
View Article : Google Scholar : PubMed/NCBI
|
|
19
|
Clark EA, Kalomoiris S, Nolta JA and
Fierro FA: Concise review: MicroRNA function in multipotent
mesenchymal stromal cells. Stem Cells. 32:1074–1082. 2014.
View Article : Google Scholar : PubMed/NCBI
|
|
20
|
Tomé M, López-Romero P, Albo C, Sepúlveda
JC, Fernández-Gutiérrez B, Dopazo A, Bernad A and González MA:
miR-335 orchestrates cell proliferation, migration and
differentiation in human mesenchymal stem cells. Cell Death Differ.
18:985–995. 2011. View Article : Google Scholar : PubMed/NCBI
|
|
21
|
Livak KJ and Schmittgen TD: Analysis of
relative gene expression data using real-time quantitative PCR and
the 2(−Delta Delta C(T)) Method. Methods. 25:402–408. 2001.
View Article : Google Scholar : PubMed/NCBI
|
|
22
|
Dominici M, Le Blanc K, Mueller I,
Slaper-Cortenbach I, Marini F, Krause D, Deans R, Keating A,
Prockop Dj and Horwitz E: Minimal criteria for defining multipotent
mesenchymal stromal cells. The International Society for Cellular
Therapy position statement. Cytotherapy. 8:315–317. 2006.
View Article : Google Scholar : PubMed/NCBI
|
|
23
|
Guennewig B, Roos M, Dogar AM, Gebert LF,
Zagalak JA, Vongrad V, Metzner KJ and Hall J: Synthetic
pre-microRNAs reveal dual-strand activity of miR-34a on TNF-α. RNA.
20:61–75. 2014. View Article : Google Scholar : PubMed/NCBI
|
|
24
|
Vasanthan P, Govindasamy V, Gnanasegaran
N, Kunasekaran W, Musa S and Abu Kasim NH: Differential expression
of basal microRNAs' patterns in human dental pulp stem cells. J
Cell Mol Med. 19:566–580. 2015. View Article : Google Scholar : PubMed/NCBI
|
|
25
|
Li Z, Liu S and Cai Y: EGFR/MAPK signaling
regulates the proliferation of Drosophila renal and nephric stem
cells. J Genet Genomics. 42:9–20. 2015. View Article : Google Scholar : PubMed/NCBI
|
|
26
|
Lu Y, Loh YH, Li H, Cesana M, Ficarro SB,
Parikh JR, Salomonis N, Toh CX, Andreadis ST, Luckey CJ, et al:
Alternative splicing of MBD2 supports self-renewal in human
pluripotent stem cells. Cell Stem Cell. 15:92–101. 2014. View Article : Google Scholar : PubMed/NCBI
|
|
27
|
Ma F, Chen D, Chi Y, Chen F, Li X and Han
Z: The expression and role of miR-301a in human umbilical
cord-derived mesenchymal stromal cells. Cytotherapy. 15:1511–1516.
2013. View Article : Google Scholar : PubMed/NCBI
|
|
28
|
Pandis I, Ospelt C, Karagianni N, Denis
MC, Reczko M, Camps C, Hatzigeorgiou AG, Ragoussis J, Gay S and
Kollias G: Identification of microRNA-221/222 and microRNA-323-3p
association with rheumatoid arthritis via predictions using the
human tumour necrosis factor transgenic mouse model. Ann Rheum Dis.
71:1716–1723. 2012. View Article : Google Scholar : PubMed/NCBI
|
|
29
|
Xu T, Huang C, Chen Z and Li J:
MicroRNA-323-3p: A new biomarker and potential therapeutic target
for rheumatoid arthritis. Rheumatol Int. 34:721–722. 2014.
View Article : Google Scholar : PubMed/NCBI
|
|
30
|
Seok JK, Lee SH, Kim MJ and Lee YM:
MicroRNA-382 induced by HIF-1α is an angiogenic miR targeting the
tumor suppressor phosphatase and tensin homolog. Nucleic Acids Res.
42:8062–8072. 2014. View Article : Google Scholar : PubMed/NCBI
|
|
31
|
Zhang R, Lee P, Lui VC, Chen Y, Liu X, Lok
CN, To M, Yeung KW and Wong KK: Silver nanoparticles promote
osteogenesis of mesenchymal stem cells and improve bone fracture
healing in osteogenesis mechanism mouse model. Nanomedicine.
11:1949–1959. 2015.PubMed/NCBI
|
|
32
|
Ng F, Boucher S, Koh S, Sastry KS, Chase
L, Lakshmipathy U, Choong C, Yang Z, Vemuri MC, Rao MS and Tanavde
V: PDGF, TGF-beta, and FGF signaling is important for
differentiation and growth of mesenchymal stem cells (MSCs):
Transcriptional profiling can identify markers and signaling
pathways important in differentiation of MSCs into adipogenic,
chondrogenic, and osteogenic lineages. Blood. 112:295–307. 2008.
View Article : Google Scholar : PubMed/NCBI
|
|
33
|
Mojsilović S, Krstić A, Ilić V,
Okić-Đorđević I, Kocić J, Trivanović D, Santibañez JF, Jovčić G and
Bugarski D: IL-17 and FGF signaling involved in mouse mesenchymal
stem cell proliferation. Cell Tissue Res. 346:305–316. 2011.
View Article : Google Scholar : PubMed/NCBI
|
|
34
|
Rodrigues M, Blair H, Stockdale L,
Griffith L and Wells A: Surface tethered epidermal growth factor
protects proliferating and differentiating multipotential stromal
cells from FasL-induced apoptosis. Stem Cells. 31:104–116. 2013.
View Article : Google Scholar : PubMed/NCBI
|
|
35
|
Tamama K and Barbeau DJ: Early growth
response genes signaling supports strong paracrine capability of
mesenchymal stem cells. Stem Cells Int. 2012:4284032012. View Article : Google Scholar : PubMed/NCBI
|