Introduction
Stress is a systemic non-specific adaptive response,
and is characterized as an inappropriate response to a variety of
stimuli generated by environmental and psychological factors. These
stimuli are divided into acute and chronic stress, according to the
duration and intensity of episodes (1–4).
Acute stress is a condition lasting between several min and h,
whereby the body suffers a rapid and severe psychological trauma.
In addition, it is characterized by a psychomotor excitement with a
heightened response to fear and behavior blindness. These symptoms
disappear following the removal of the stimulus (5–8). By
contrast, chronic stress is a response of body to long-duration,
uncontrollable emotional pressure, and presentation of high blood
pressure, muscle tissue damage, growth inhibition, immune system
suppression and metal health damage (9–12).
The disease has been become a common issue clinically as a result
of its complexity (13–15).
Numerous individuals become plagued with a variety
of stresses in day-to-day life that risk damaging wellbeing, which,
if not correctly treated, frequently leads to diagnoses of
depression and chronic stress (13–18).
As a common and multifactorial condition, depression exhibits the
characteristics of repeated attack, not only affecting the patient,
but also having an impact on those surrounding the patient
(19–21). The gastrointestinal digestive
system is the most susceptible system to environmental effectors,
particularly the gastrointestinal tract and gastrointestinal flora,
and it is easily disturbed when subjected to surrounding aversive
stimuli (22–26).
The present study used a rat model of chronic stress
and depression (16,27) to investigate the gastrointestinal
tract histopathology and gastrointestinal flora profile. As a
result of the previously identified antidepressant and
neuroprotective effects of berberine on neurodegenerative
disorders, it was hypothesized that it may have implications on the
treatment on chronic stress and depression.
Materials and methods
Establishment of rat chronic stress
depression model and drug intervention
A total of 60 adult specific pathogen-free Sprague
Dawley rats (male; weight, 200–220 g; age, 2 months) were purchased
and raised at the Laboratory Animal Center of the Academy of
Military Medical Sciences of the People's Liberation Army (Beijing,
China). They were maintained at 25±2°C in a humidity of 40–60%
under a 12-h light/dark cycle. The rats were randomly divided into
the following six groups (n=10/group): Normal group (regularly
breeding), model group (subject to 10 stress approaches, according
to the previous literature on chronic unpredictable stress), low
berberine group (40 mg/kg/day), high berberine group (200
mg/kg/day), bifidobacterium group (140 mg/kg/day) and fluoxetine
group (2 mg/kg/day). The aforementioned 10 stress approaches
(16,27) included fasting for 24 h, water
deprivation for 24 h, tail nipping (1 cm from end of tail) for 5
min, day and night inversion for 24 h, 4°C cold water swimming for
5 min, 45°C environment for 5 min, damp bedding for 24 h, 45°
sloping of floor for 24 h, behavior constraint for 4 h and
horizontal vibrating (60 Hz) for 45 min. One method was selected
daily and the interval between similar stress approaches was at
least 7 days. Prior to modeling with each chronic unpredictable
stress method, the rats were treated with either 2 ml of a low
concentration of berberine (40 mg/kg/day), a high concentration of
berberine (200 mg/kg/day), bifidobacterium (140 mg/kg/day) or
fluoxetine (2 mg/kg/day). The normal and model groups were treated
with an equal volume (2 ml) of 0.9% saline. The rat body weights
were recorded and the rats were subsequently subjected to an open
field test, forced swimming test and sucrose preference test. The
present study was approved by the Ethics Committee of the Academy
of Military Medical Sciences of the People's Liberation Army.
Behavioral evaluation
Open field test
The open field test was performed in a quiet and
dark environment, and rat behavior was examined prior to and
following modeling. The rats were placed in a homemade open field
box (opaque; height, 40 cm; base, 80×80 cm) that was equally
divided into 25 squares, left uncovered at the top and painted
black inside. Each test lasted 5 min for each measurement. The
three measurements collected included traversing time, vertical
movement and grooming times. These data were followed up using
statistical analysis.
Forced swimming test
Prior to the forced swimming test, the rats were
placed into a homemade forced swimming cylinder (diameter, 30 cm;
height, 30 cm; water temperature, 23±2°C; water depth, 25 cm) and
were preconditioned for 15 min prior to having excess water removed
with a towel. After 24 h, forced swimming was recorded for 6 min,
followed by recording the motionless time for 4 min. Motionless
time was characterized as rats stopping thrashing in the water,
where their limbs had a slight motion in order to keep afloat.
Sucrose preference test
Prior to performing the sucrose preference test, the
rats were divided into one per cage and fed an equal volume of 1%
sucrose (two flasks, 200 ml/flask) to precondition for 24 h.
Following 24 h water deprivation on day 28, an equal volume of 1%
sucrose and water (one flask in each, 200 ml/flask) was fed to the
rats, and the volume of residual liquid was measured in order to
calculate the total liquid consumption, sucrose consumption and
water consumption. The sucrose preference was calculated based on
the formula: Sucrose preference=(sucrose consumption/total liquid
consumption)x100%. Subsequently, the rats underwent cervical
dislocation and the stomach, ileum, cecum, colon and
gastrointestinal contents were collected. The tissues of stomach,
ileum, cecum and colon were sliced at a thickness of 3–5 µm, and
hematoxylin and eosin (H&E) staining was performed. The
different contents of the stomach, ileum, cecum and colon were
separated, and the genomic DNA was extracted prior to analysis by
enterobacterial repetitive intergenic consensus
sequence-based-polymerase chain reaction (ERIC-PCR).
HE staining
The slides were deparaffinized, rehydrated and
frozen or vibratome sections were mounted on slides and rehydrated.
The sections were stained with hematoxylin for ~3-5 min, depending
on the thickness of the section and fixative (up to 20 min if the
solution was not fully ripened), and excess stain was removed using
tap water. The sections were destained for a few sec in acid
alcohol until the sections appeared red. The sections were briefly
rinsed in tap water to remove the acid. Sodium bicarbonate was
applied for ~2 min until the nuclei were clearly visible in blue.
The H&E-stained slides from the final rinse with tap water were
placed in 70% ethanol for 3 min, and then in eosin for 2 min. The
slides were subsequently submerged three times in 95% ethanol for 5
min, prior to being transferred to absolute ethanol. The images
were captured using a microscope connected to a CCD camera.
Extraction of gastrointestinal genomic DNA
The genomic DNA of the stomach, ileum, cecum and
colon was extracted from rats using a genomic DNA Extraction kit
(Promega Corporation, Madison, WI, USA), according to the
manufacturer's protocol. A total of 180–200 mg tissue was weighed
and mixed with 1.4 ml GSL buffer (Promega Corporation) for 1 min.
Following this, the solution was incubated in a 70°C water bath,
vortexed for 15 sec and centrifuged at 12,000 × g at room
temperature for 1 min. The supernatant was removed and transferred
to a 2 ml eppendorf tube and an inhibitor adsorption piece was
added for incubation for 1 min at room temperature, and this was
centrifuged at 12,000 × g for 3 min. The supernatant was removed
and transferred to a 1.5 ml eppendorf tube with an inhibitor
adsorption piece to incubate for 1 min at room temperature, and was
centrifuged at 12,000 × g for 3 min. The supernatant was eluted and
transferred into a 1.5 ml eppendorf tube once again, and 15 µl
proteinase K and 200 µl GB buffer were added and vortexed for 15
sec prior to incubation in a 70°C water bath for 30 min. A total of
200 µl ethanol was added and the solution was vortexed, and
subsequently transferred to a CR2 column (Promega
Corporation), where it was centrifuged at 13,000 × g for 30 sec at
room temperature to discard the centrifugate. A total of 500 µl GD
buffer (Promega Corporation, Madison, WI, USA) was added and
centrifuged at 10,000 × g for 30 sec at room temperature to discard
the centrifugate. The CR2 column was transferred to a
new collection tube and 50 µl TB washing buffer (Promega
Corporation) was added at room temperature for 2–5 min, and the
samples were centrifuged at 10,000 × g for 2 min at room
temperature. The eluent was collected and its concentration was
determined using ultraviolet spectrophotometry.
ERIC-PCR amplification of gastrointestinal flora
profile
The extracted genomic DNA was used as a template to
perform ERIC-PCR using the following primers: ERIC-1 (forward),
5′-ATGTAAGCTCCTGGGGATTCAC-3′ and ERIC-2 (reverse),
5′-AAGTAAGTGACTGGGGTGAGCG-3′. The 25 µl PCR reaction solution was
prepared, as follows: 1 µl genomic DNA, 0.125 µl Ex Taq (5 U/µl),
2.5 µl 10X Ex Taq Buffer, 2 µl dNTP, 0.5 µl ERIC-1 primer, 0.5 µl
ERIC-2 primer and 18.375 µl ddH2O. For ERIC-PCR
amplification, the PCR procedure was performed using the following
steps: 95°C initial denaturation for 7 min, (95°C denaturation for
30 sec, 52°C annealing for 1 min, 65°C extension for 8 min for 30
cycles), then 65°C extension for 16 min, with a 4°C hold. PCR
products were identified using 1.5% agarose gel electrophoresis and
images were captured using Lane 1D image software (version 2.0;
Beijing SAGE Creation Science Co., Ltd., Beijing, China).
Statistical analysis
All data are expressed as the mean ± standard
deviation. Statistical analysis was performed with one-way analysis
of variance using SPSS software (version 21.0; IBM SPSS, Armonk, NY
USA), and Student's t-test was performed in a group of two samples.
P<0.05 and P<0.01 were considered to indicate significant and
highly significant statistical differences, respectively.
Results
Berberine, like bifidobacterium and
fluoxetine, significantly increases rat body weight following
chronic stress modeling
The body weight of rats increased following modeling
using the 10 unpredicted stress methods in all experimental groups.
Prior to modeling, all drug intervention groups (low berberine,
high berberine, bifidobacterium and fluoxetine) exhibited no
significant differences in weight compared with each other.
However, the mean weight of the model group decreased significantly
following modeling (323.39±19.6040 g), when compared with the
normal group (440.91±13.1597 g). Following modeling, the berberine
(low berberine, 385.11±23.8284 g; high berberine, 395.67±18.2214 g)
groups increased their mean body weight more than that observed in
the model group (323.39±19.6040 g). Both bifidocaterium
(385.75±21.1776 g) and fluoxetine (389.43±25.5993 g; Table I) groups demonstrated an identical
pattern of results as the berberine groups.
 | Table I.Alterations to rat body weight prior
to and after modeling. |
Table I.
Alterations to rat body weight prior
to and after modeling.
|
| | |
|---|
| Group | Prior to modeling
(n=10) (g) | After modeling)
(n=10) (g) |
|---|
| Normal | 232.64±7.6539 | 440.91±13.1597 |
| Model | 233.79±9.0775 |
323.39±19.6040a |
| Low berberine | 237.08±12.7968 |
385.11±23.8284a |
| High berberine | 235.31±12.9071 |
395.67±18.2214a |
|
Bifidobacterium | 234.91±9.5875 |
385.75±21.1776a |
| Fluoxetine | 235.59±10.7508 | 389.43±25.5993 |
Berberine significantly increases the
traversing time, vertical movement and grooming times, as did
bifidobacterium and fluoxetine, following chronic stress
modeling
In an open field test, the traversing times of rats
significantly decreased in the model group (54.10±10.7647 sec) when
compared with the normal group (114.50±6.9801 sec; **P<0.01;
Table II). Traversing time in the
low berberine group (53.80±11.3117 sec) was not significantly
different when compared with the model group (54.10±10.7647 sec);
however, the high berberine group (84.30±11.5089 sec) was
significantly increased when compared with the model group
(54.10±10.7647 sec; **P<0.01; Table II). Bifidobacterium (69.10±10.4823
sec) slightly increased traversing time when compared with the
model group, and fluoxetine (90.40±9.0086 sec) increased traversing
time the most of the four drug groups. Similarly, vertical movement
of rats significantly decreased in the model group (7.50±1.4337
sec) compared with that of the normal group (22.20±4.0222 sec;
**P<0.01; Table II). The
vertical movement time of rats in the low berberine group
(9.30±1.8886 sec) demonstrated no significant difference in time
when compared with the model group (7.50±1.4337 sec). However, the
high berberine group was notably increased when comparing to the
model group (7.50±1.4337 sec; **P<0.01; Table II) Bifidobacterium (12.80±3.2249
sec) and fluoxetine (14.70±2.4060 sec) groups demonstrated
similarly increased vertical movement times compared with the model
group. In addition, rat grooming times significantly decreased in
the model group (0.70±0.4830 sec) when compared with the normal
group (3.70±0.8233 sec; **P<0.01; Table II). Rat grooming times in all drug
groups were markedly increased when compared with the model group
(low berberine, 1.80±0.7888 sec; high berberine, 2.70±0.6749 sec;
bifidobacterium, 2.60±0.6992 sec; fluoxetine, 3.10±0.5676 sec; all
**P<0.01; Table II). As
expected, behavioral tests indicated chronic stress induced
depression in the rats.
| Table II.Traversing, vertical and grooming
times in an open-field test following modeling. |
Table II.
Traversing, vertical and grooming
times in an open-field test following modeling.
| Group | Traversing time
(sec; n=10) | Vertical time (sec;
n=10) | Grooming time (sec;
n=10) |
|---|
| Normal | 114.50±6.9801 | 22.20±4.0222 | 3.70±0.8233 |
| Model |
54.10±10.7647b |
7.50±1.4337b |
0.70±0.4830b |
| Low berberine | 53.80±11.3117 |
9.30±1.8886a |
1.80±0.7888b |
| High berberine |
84.30±11.5089b |
13.80±2.3944b |
2.70±0.6749b |
|
Bifidobacterium |
69.10±10.4823a |
12.80±3.2249b |
2.60±0.6992b |
| Fluoxetine |
90.40±9.0086b |
14.70±2.4060b |
3.10±0.5676b |
Chronic stress modeling significantly
increases motionless time, and berberine, bifidobacterium and
fluoxetine significantly decreases motionless time
The motionless time of rats in the model
(76.60±11.1176 sec) was significantly increased when compared with
the rats in the normal group (8.40±2.8363 sec; **P<0.01;
Table III). Low berberine
(41.20±5.3083 sec) and high berberine (22.60±4.1952 sec) were
significantly decreased when compared with the model group
(76.60±11.1176 sec, **P<0.01; Table III) as that of bifidobacterium
(25.60±4.5265 sec) and fluoxetine (17.80±3.2592 sec) positive
control.
| Table III.Measurements of motionless time
during a forced-swimming test following modeling. |
Table III.
Measurements of motionless time
during a forced-swimming test following modeling.
| Group | Motionless time
during forced-swimming (sec; n=10) |
|---|
| Normal | 8.40±2.8363 |
| Model |
76.60±11.1176b |
| Low berberine |
41.20±5.3083b |
| High berberine |
22.60±4.1952b |
|
Bifidobacterium |
25.60±4.5265b |
| Fluoxetine |
17.80±3.2592b |
Sucrose preference decreases in the
model group, and berberine significantly increases as with
bifidobacterium and fluoxetine
In the sucrose preference test, rats sucrose
preference significantly decreased in the model group
(55.10±10.03%) when compared with the normal group (93.14±4.84%;
**P<0.01; Table IV). Low
berberine (76.72±5.52%), high berberine (78.95±1.92%),
bifidobacterium (76.79±1.90%) and fluoxetine (87.16±3.85%) groups
demonstrated an increased sucrose preference when compared with the
model group (55.10±10.03%; **P<0.01; Table IV).
| Table IV.Sucrose preference assay
post-modeling. |
Table IV.
Sucrose preference assay
post-modeling.
| Group | Sucrose preference
(n=10) (%) |
|---|
| Normal | 93.14±4.84 |
| Model |
55.10±10.03b |
| Low berberine |
76.72±5.52b |
| High berberine |
78.95±1.92b |
|
Bifidobacterium |
76.79±1.90b |
| Fluoxetine |
87.16±3.85b |
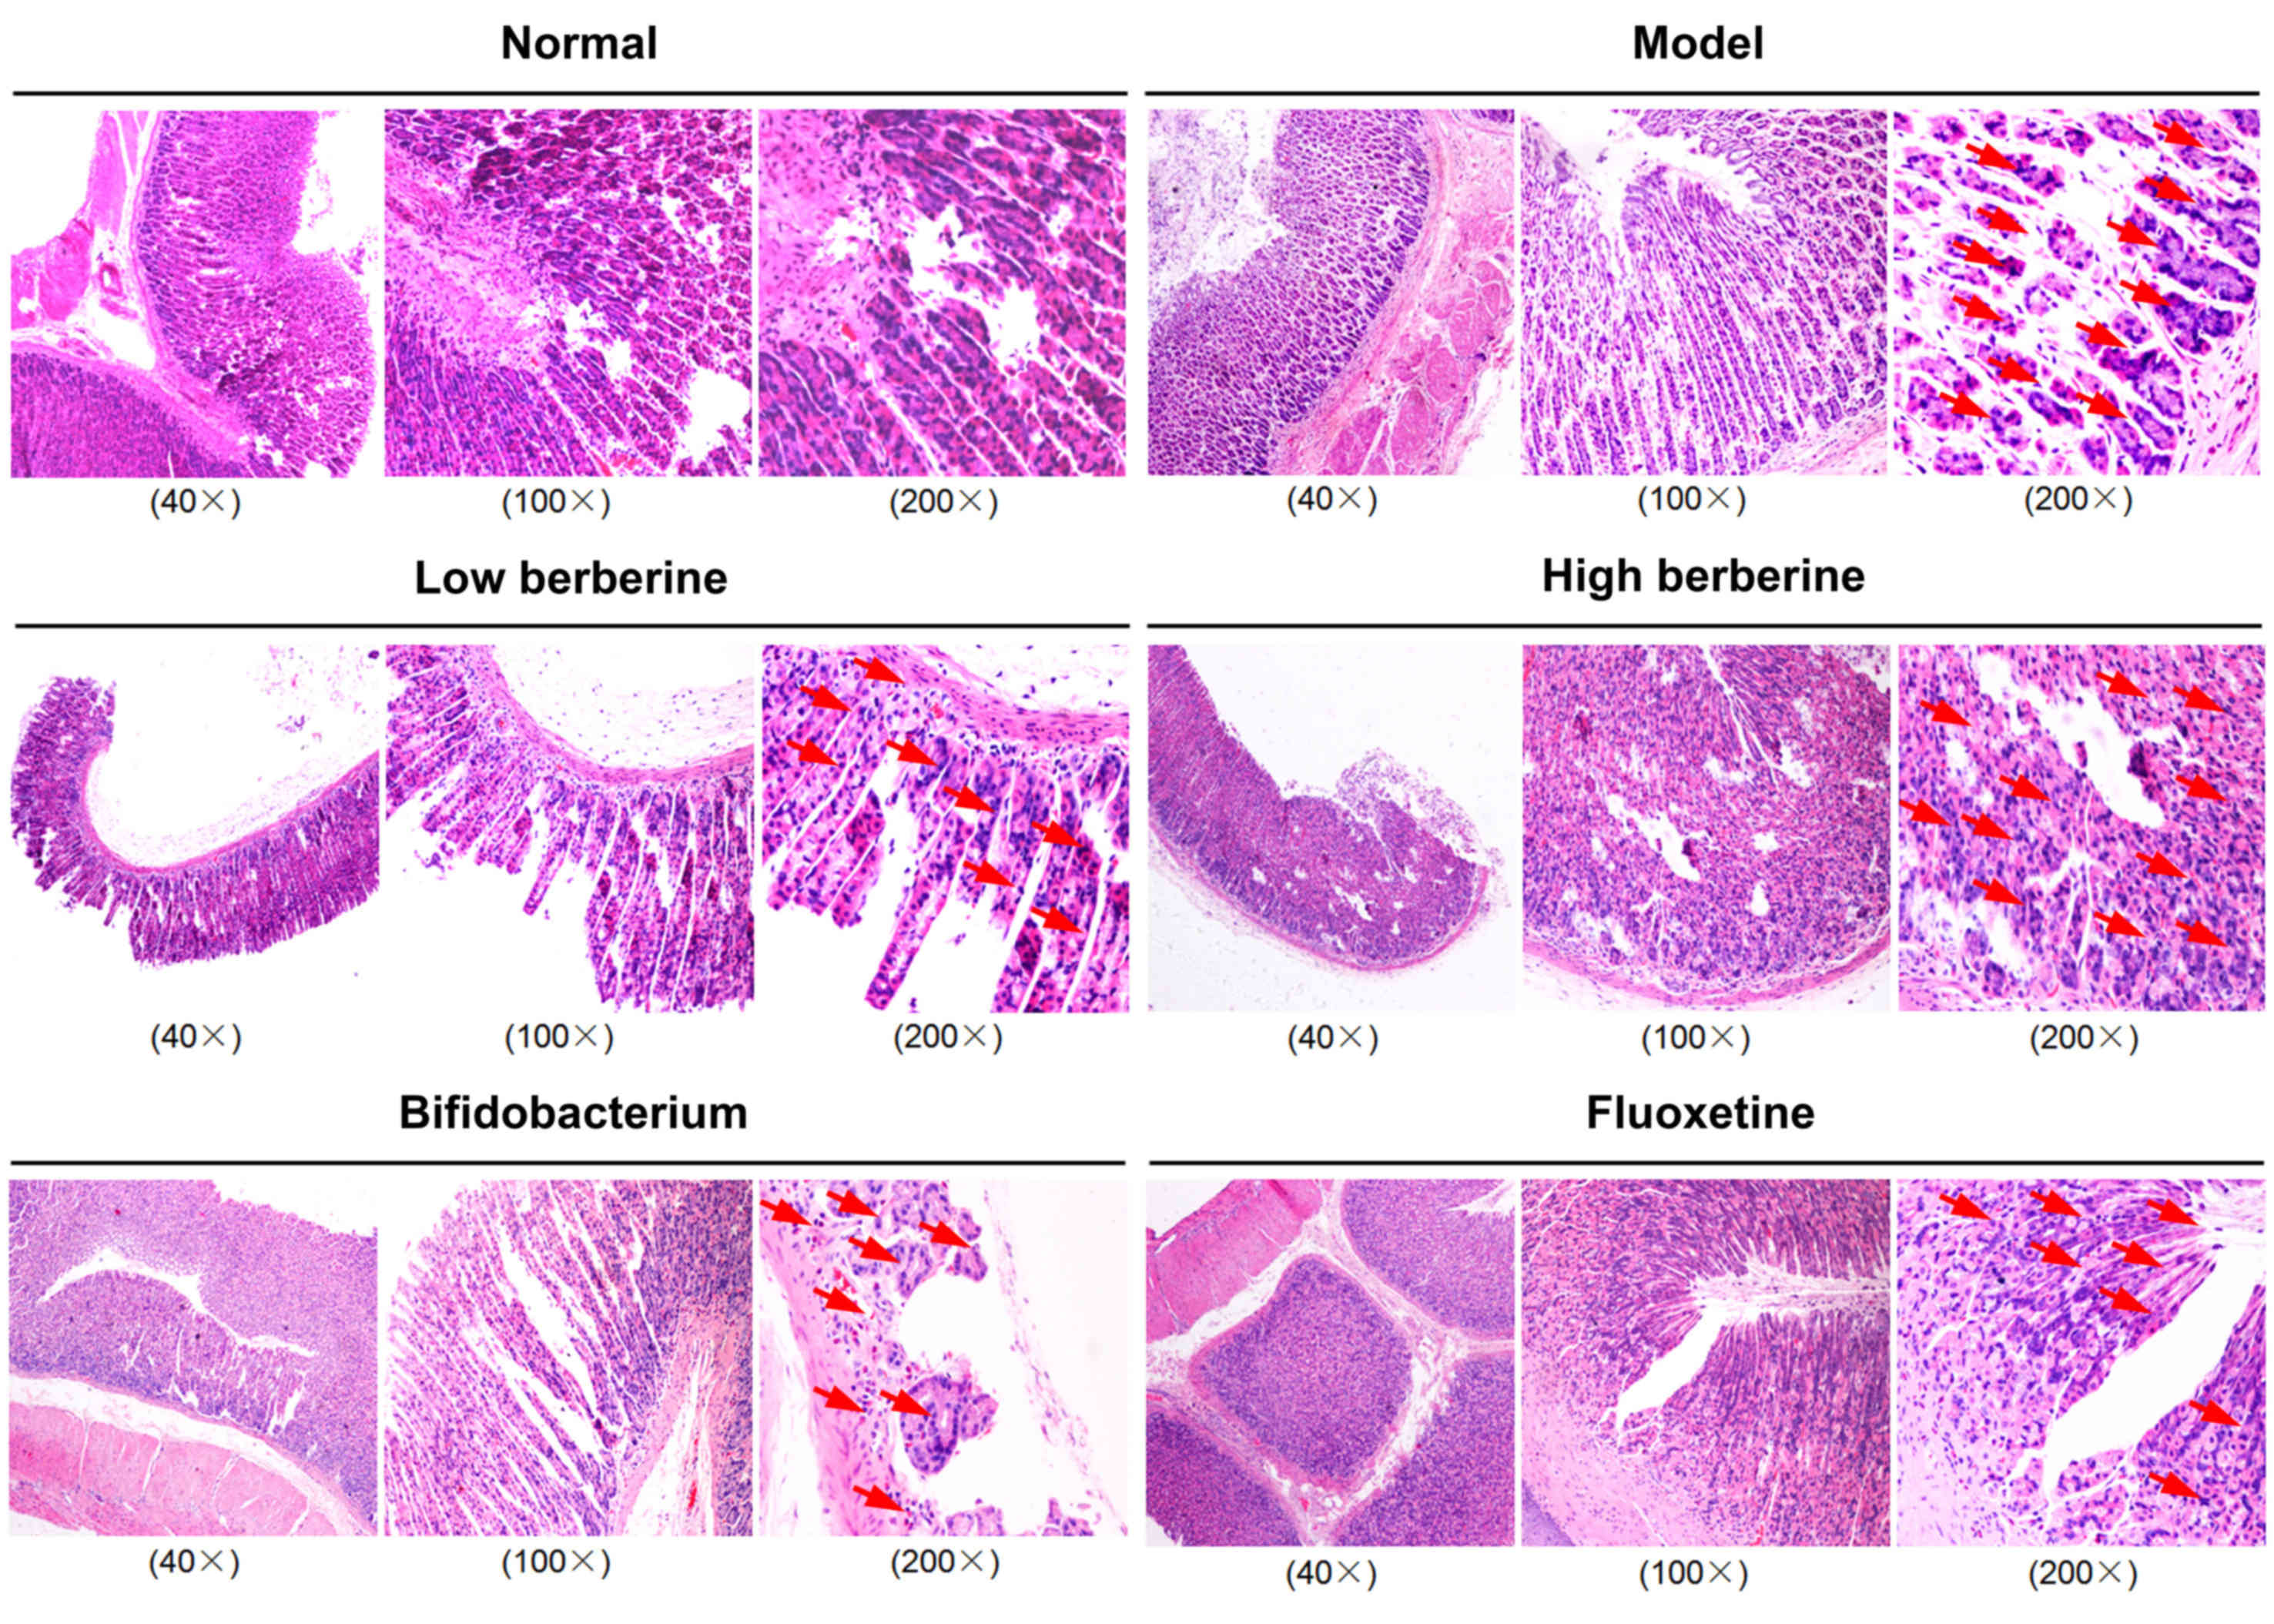
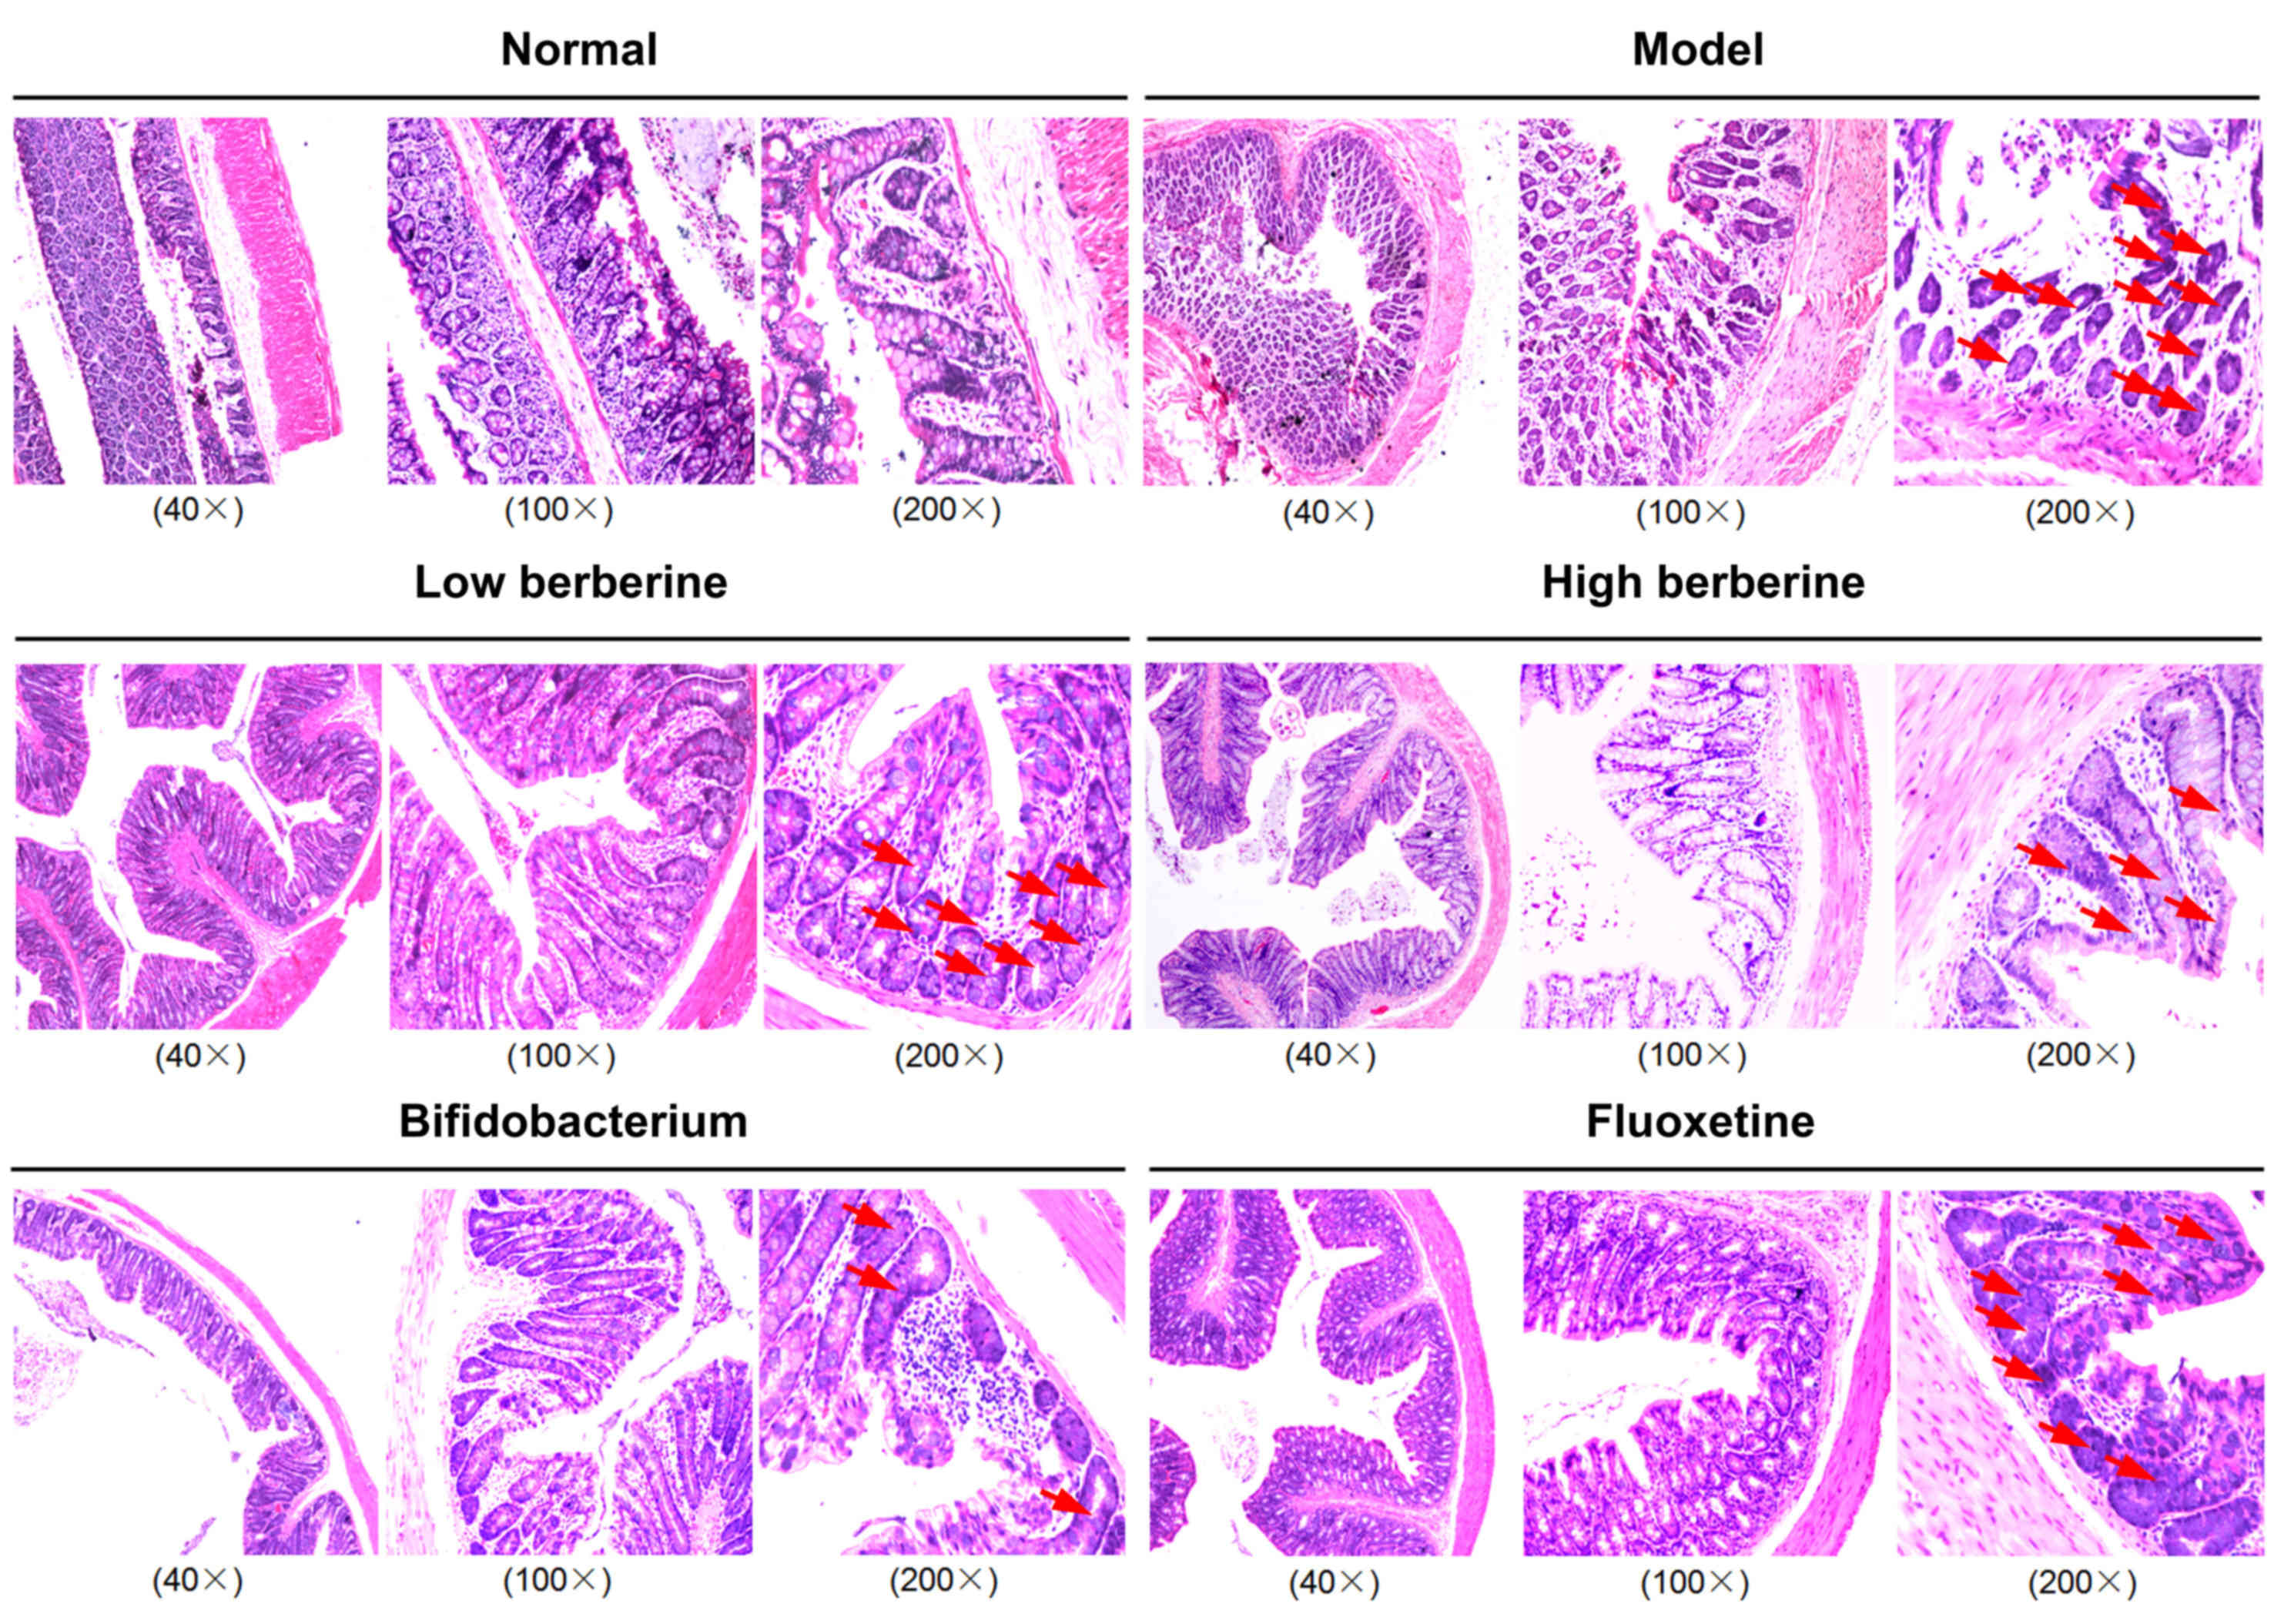
Histopathological analysis of rat
gastrointestinal contents demonstrates severe damage following
modeling, which was reversed by berberine, bifidobacterium and
fluoxetine
Histopathological assays demonstrated that the model
group exhibited severe damage to the gastric mucosa and intestinal
microvilli, as well as exhibiting a looser cell structure, mild
nuclear contraction, deep staining, and inflammatory cell invasion
in the stomach, ileum, cecum and colon tissues. Following low and
high berberine treatment, the rat gastric mucosa and intestinal
microvilli, and cells structure gradually returned to normal,
presenting no inflammatory cell invasion in stomach, ileum, cecum
and colon tissues, unlike following treatment with either
bifidobacterium or the fluoxetine positive control (Figs. 1–4).
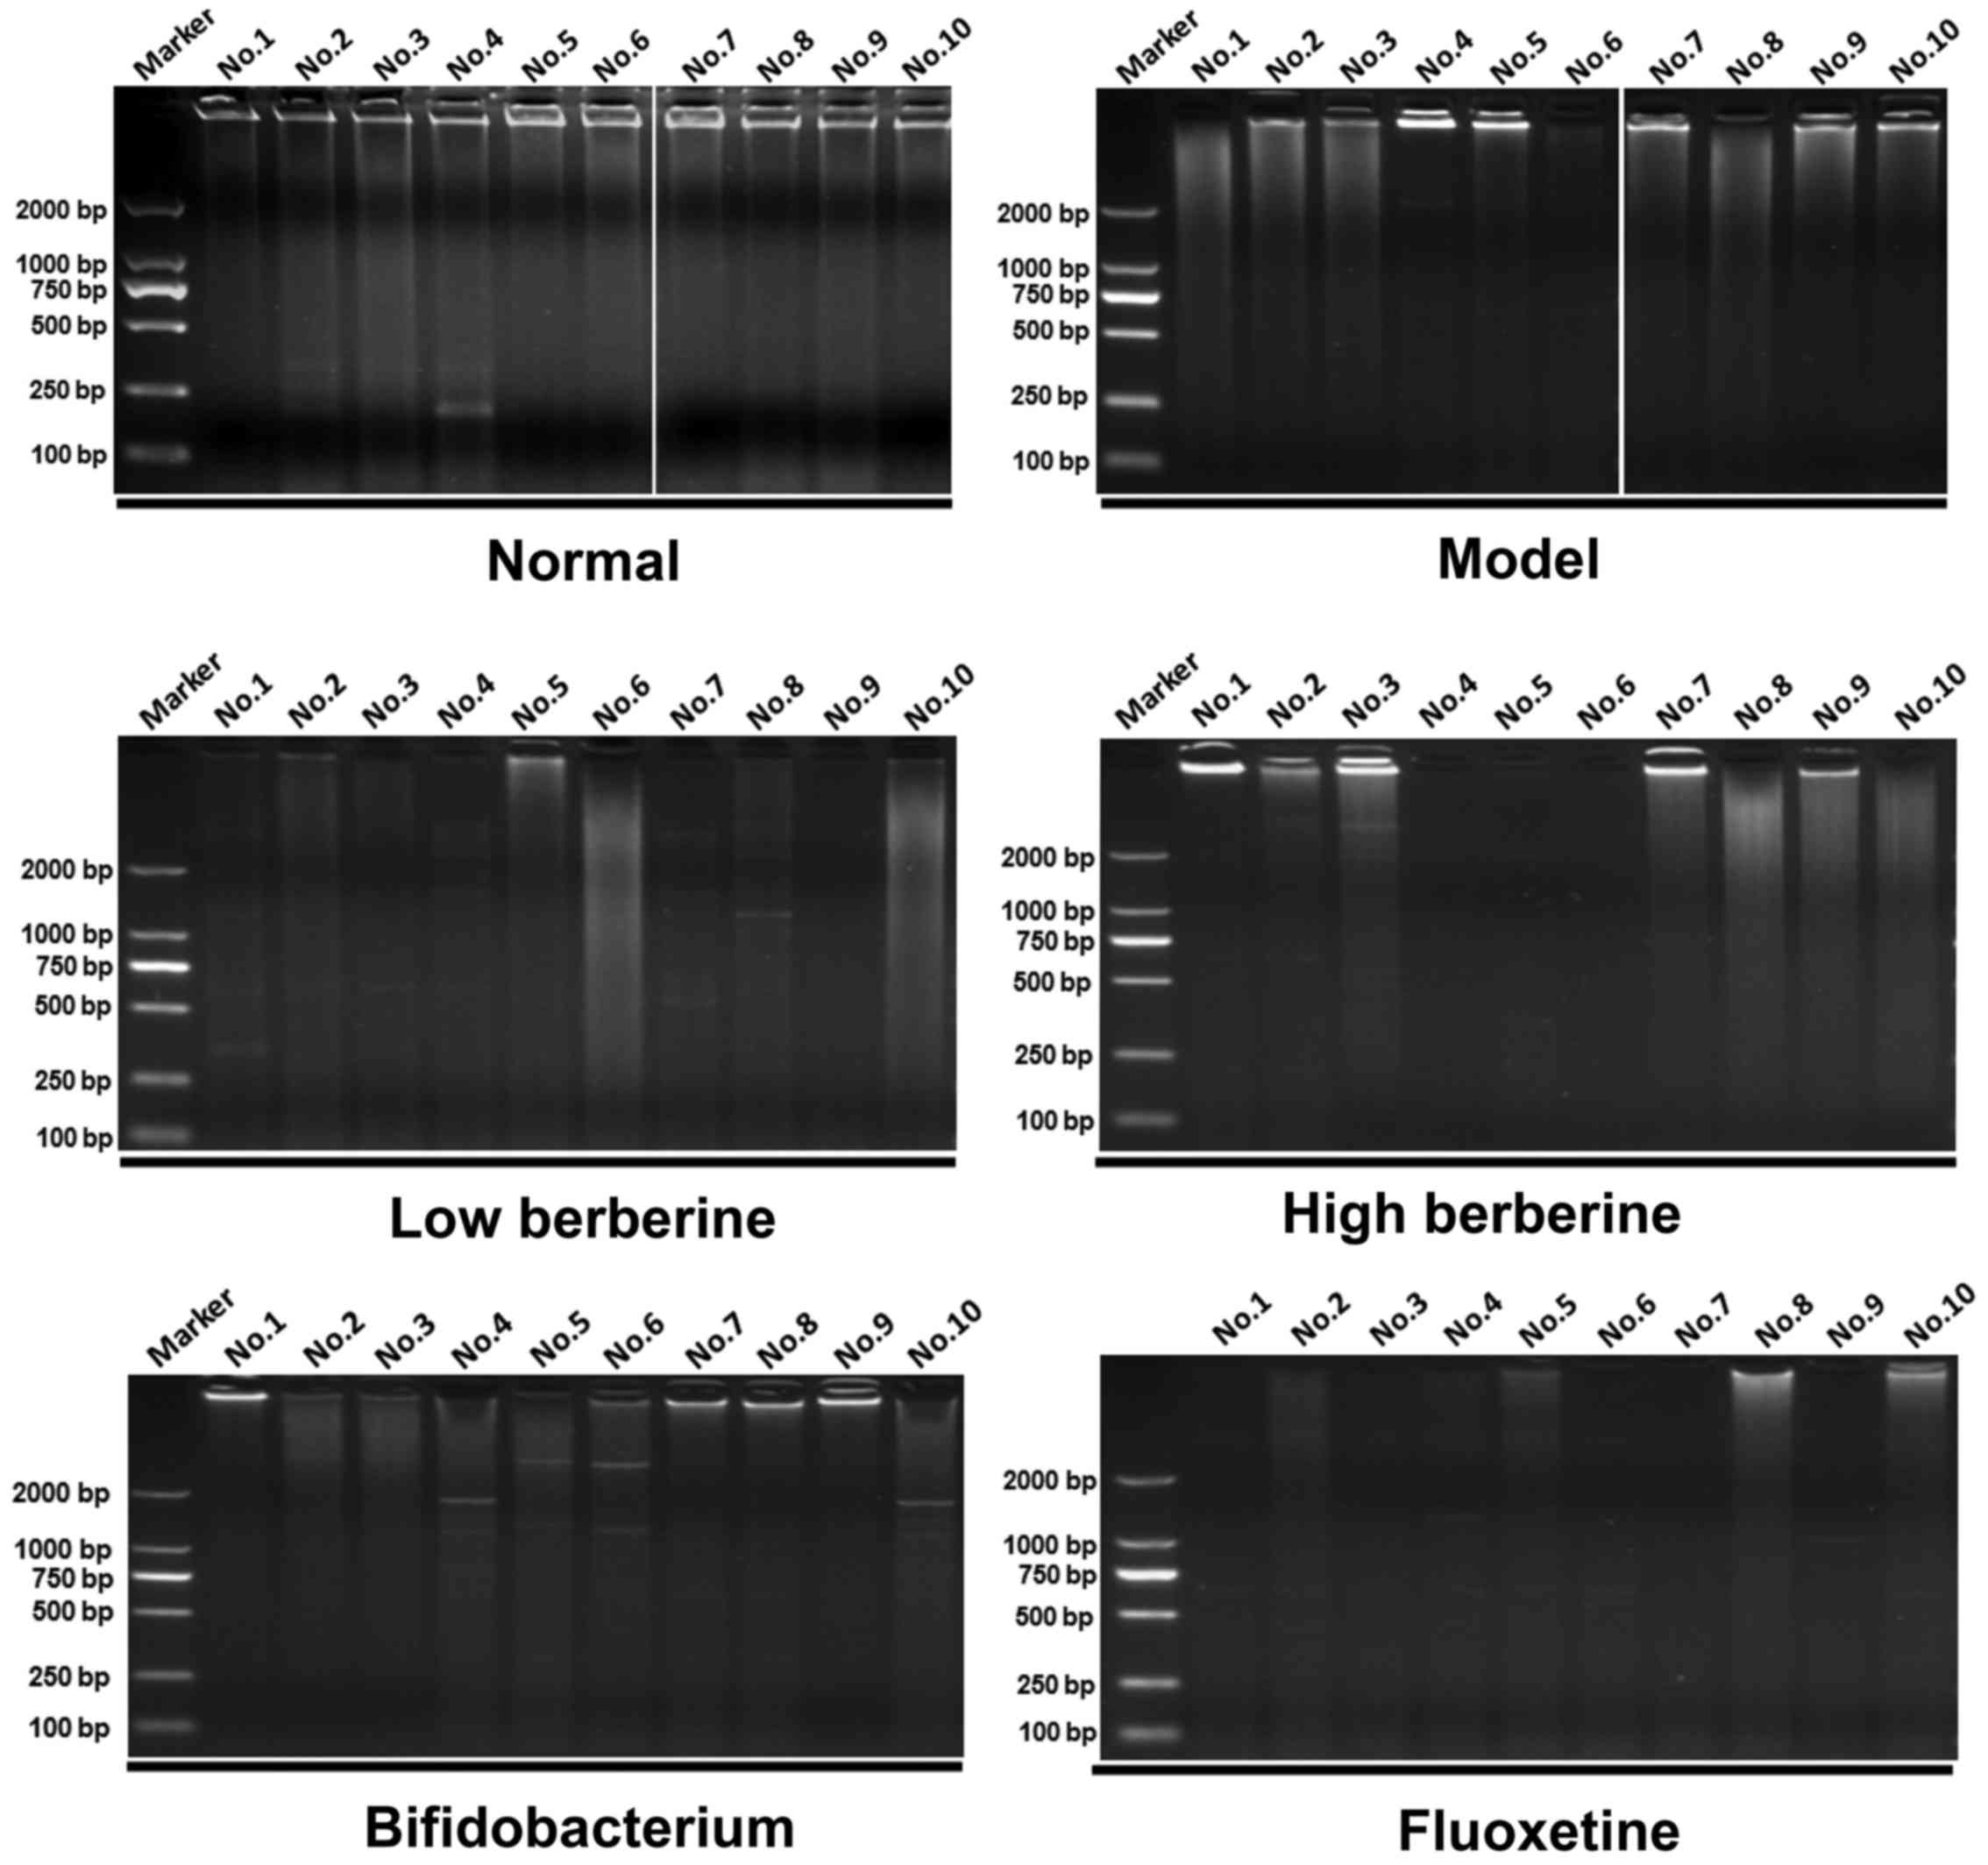
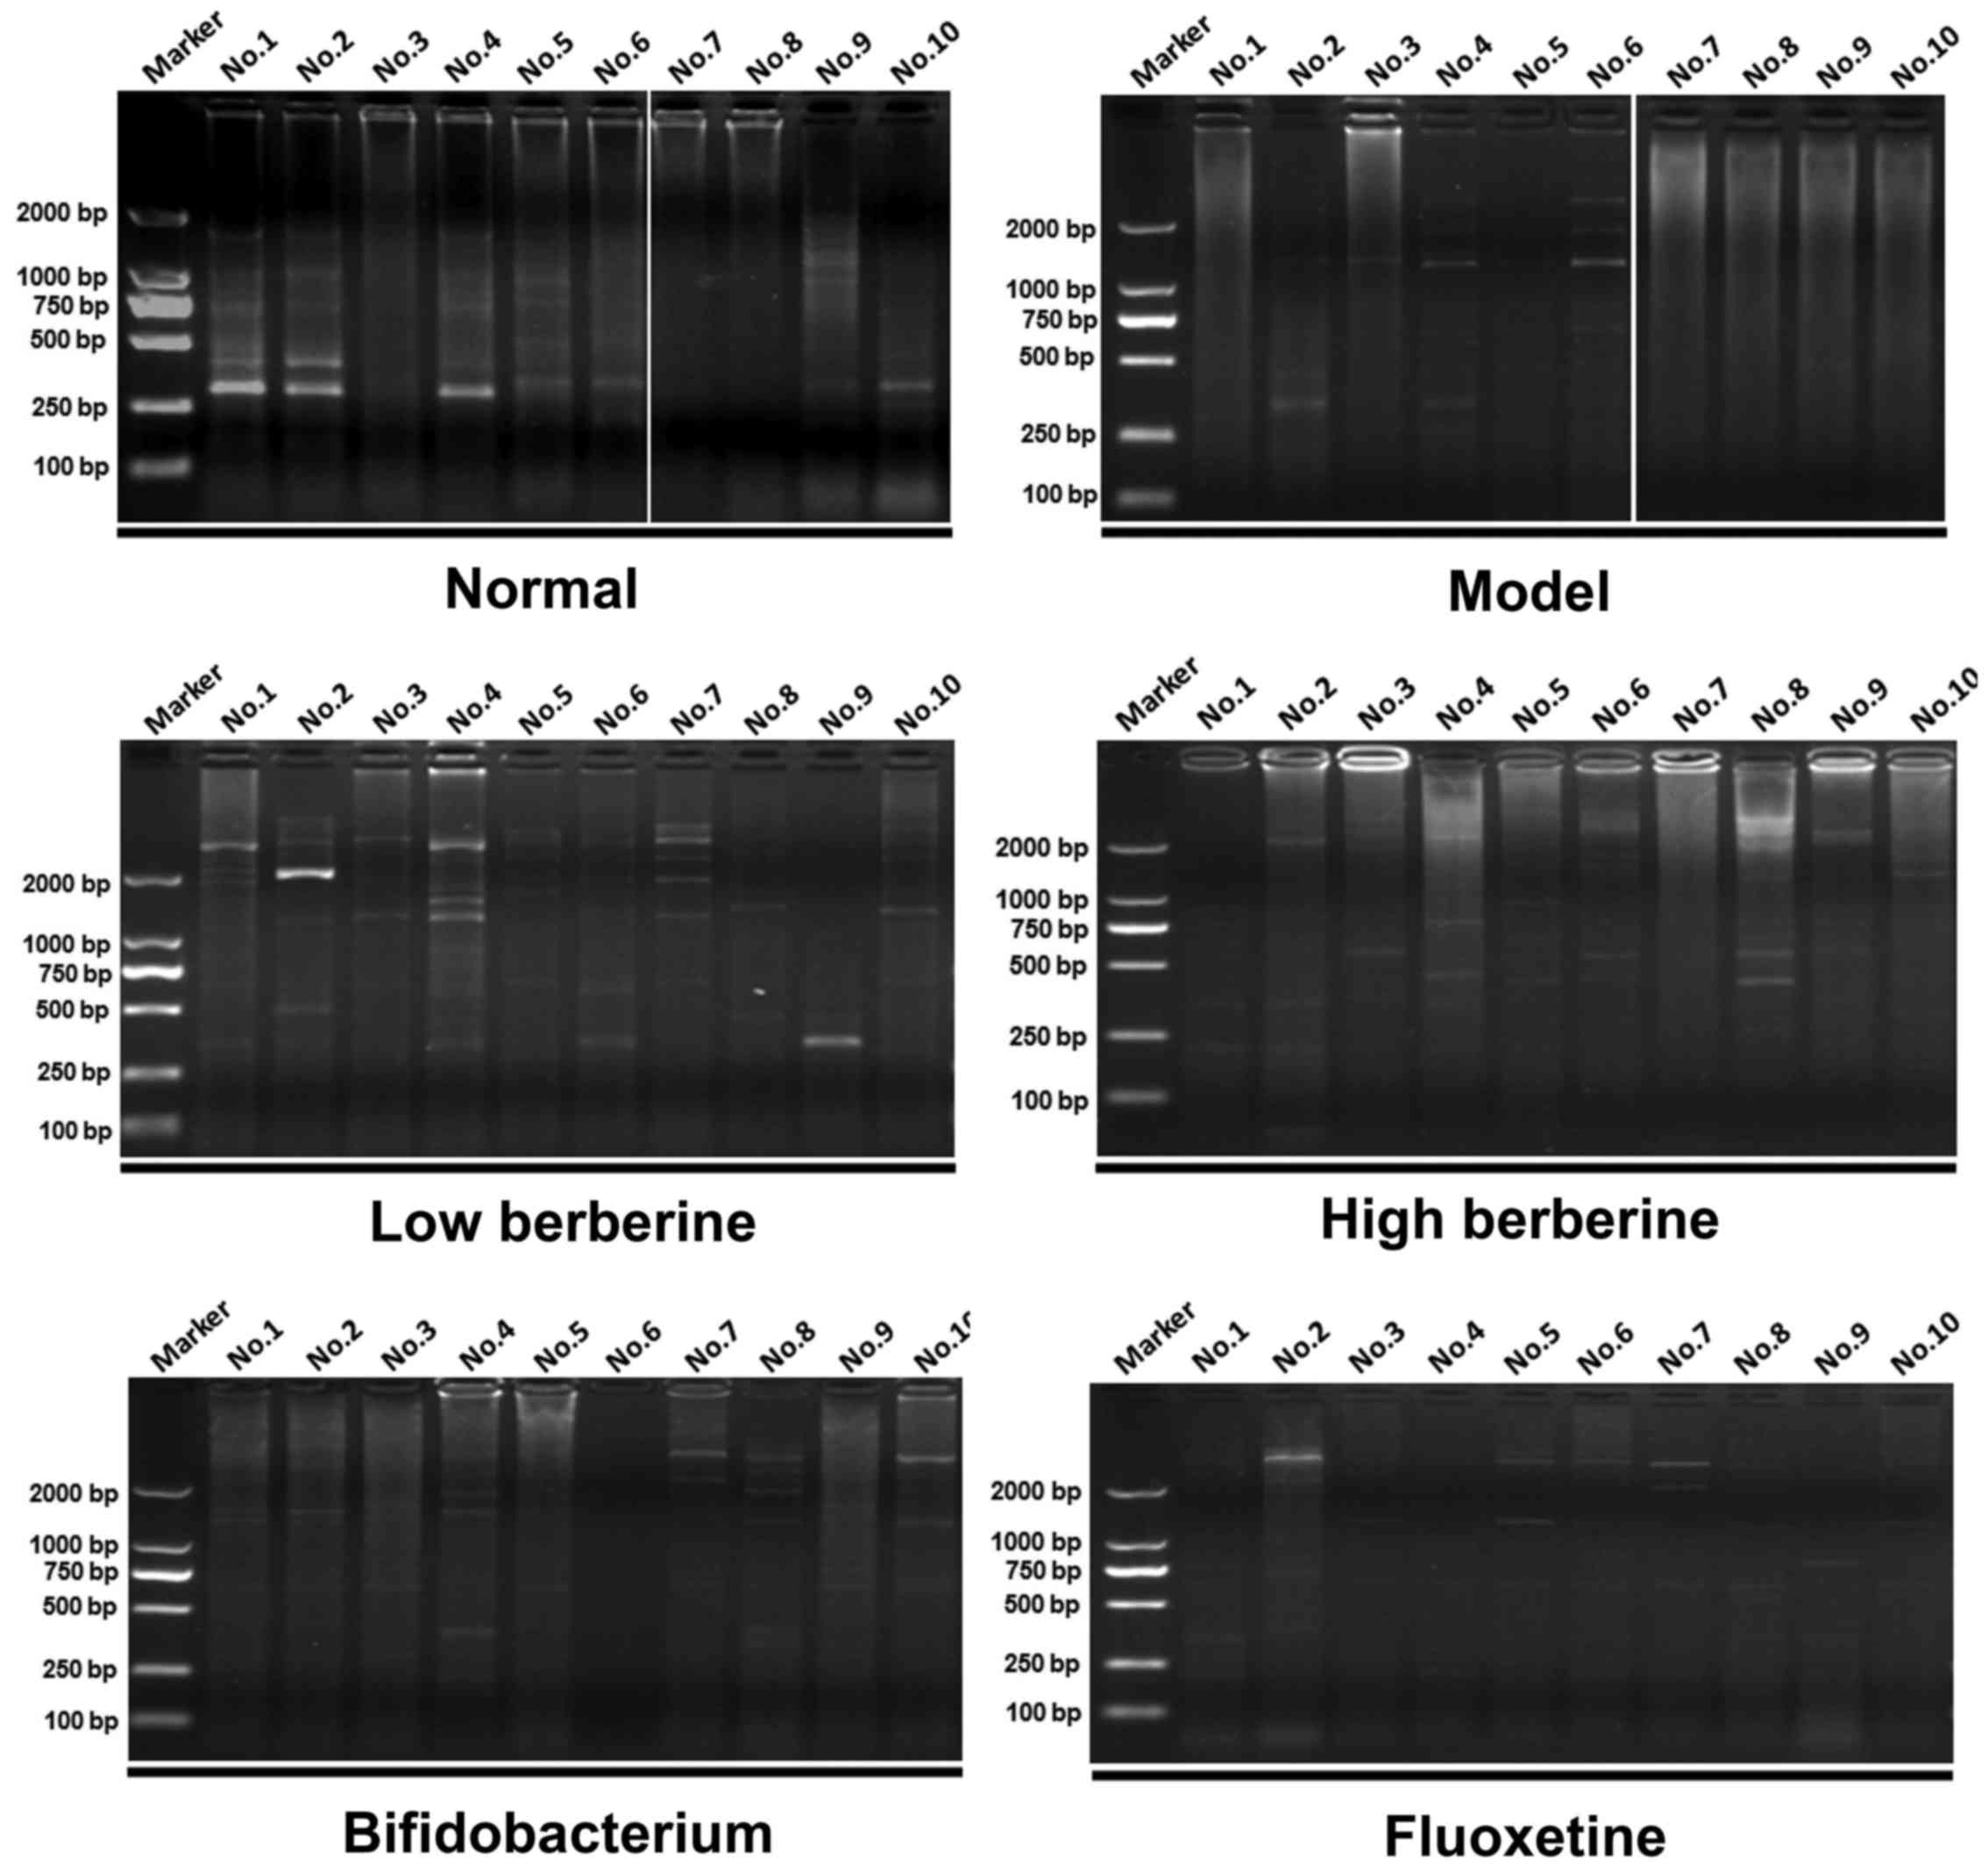
ERIC-PCR analysis comparing drug
intervention groups with the model and normal groups
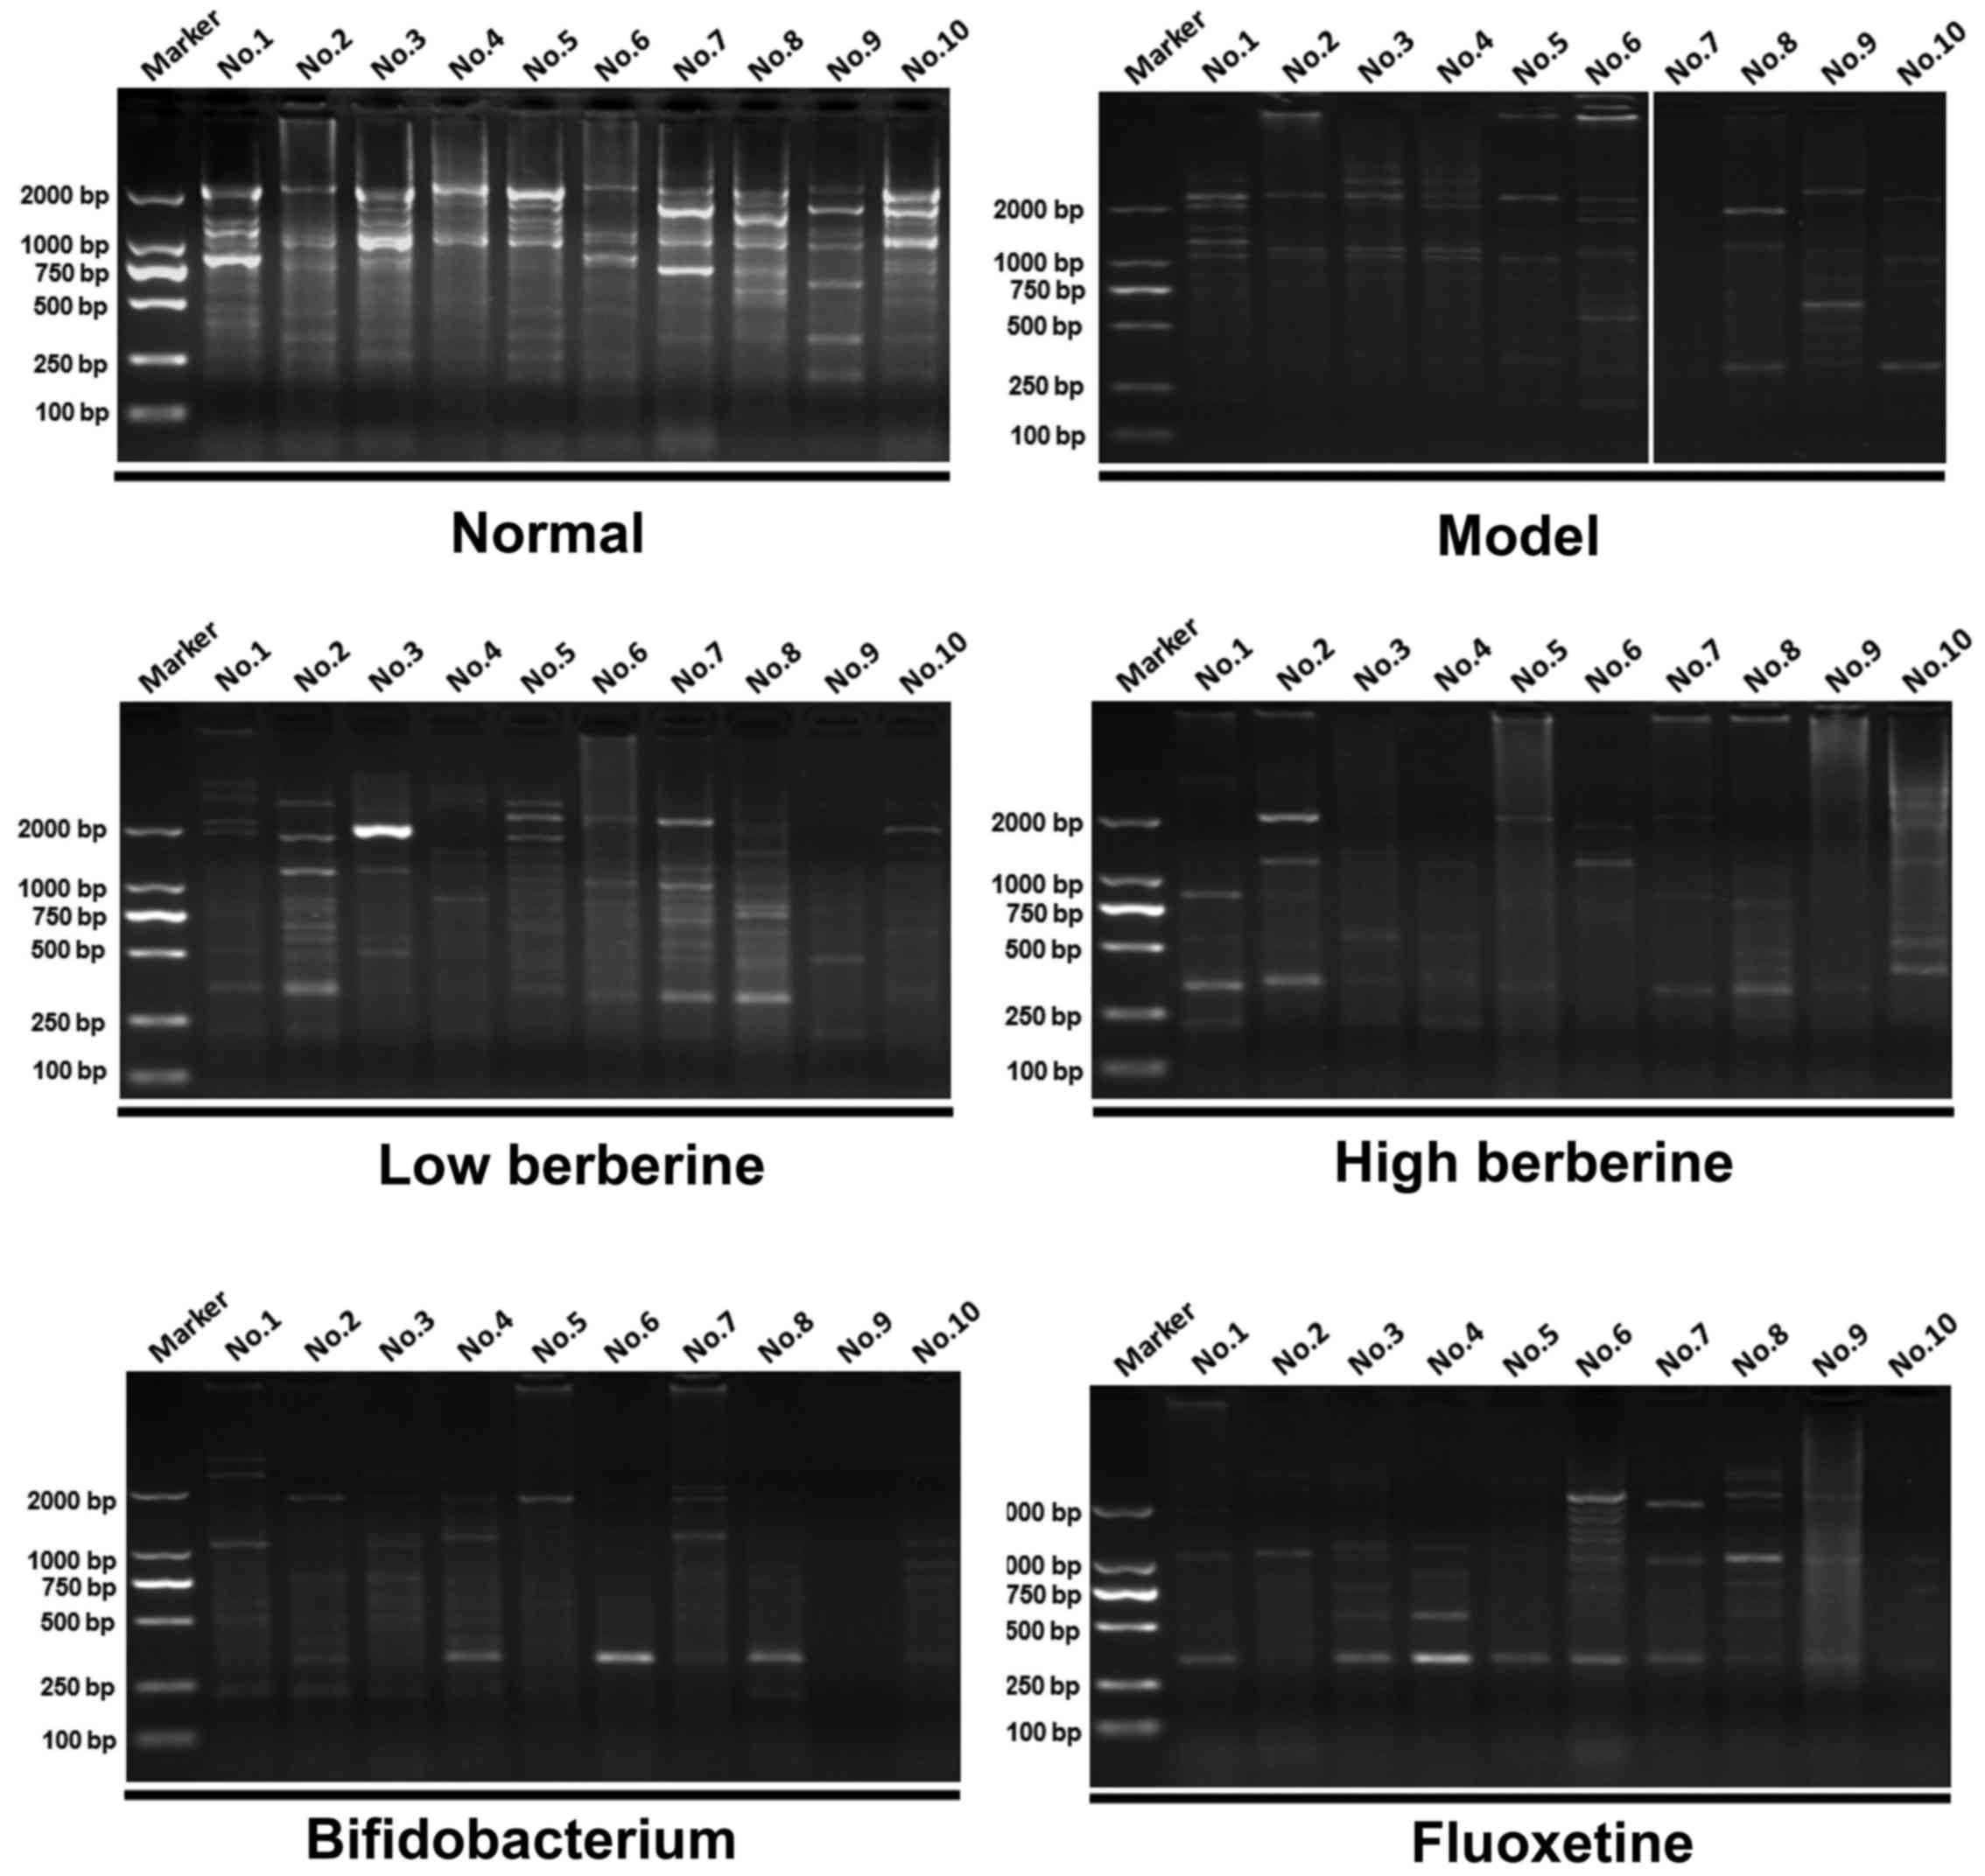
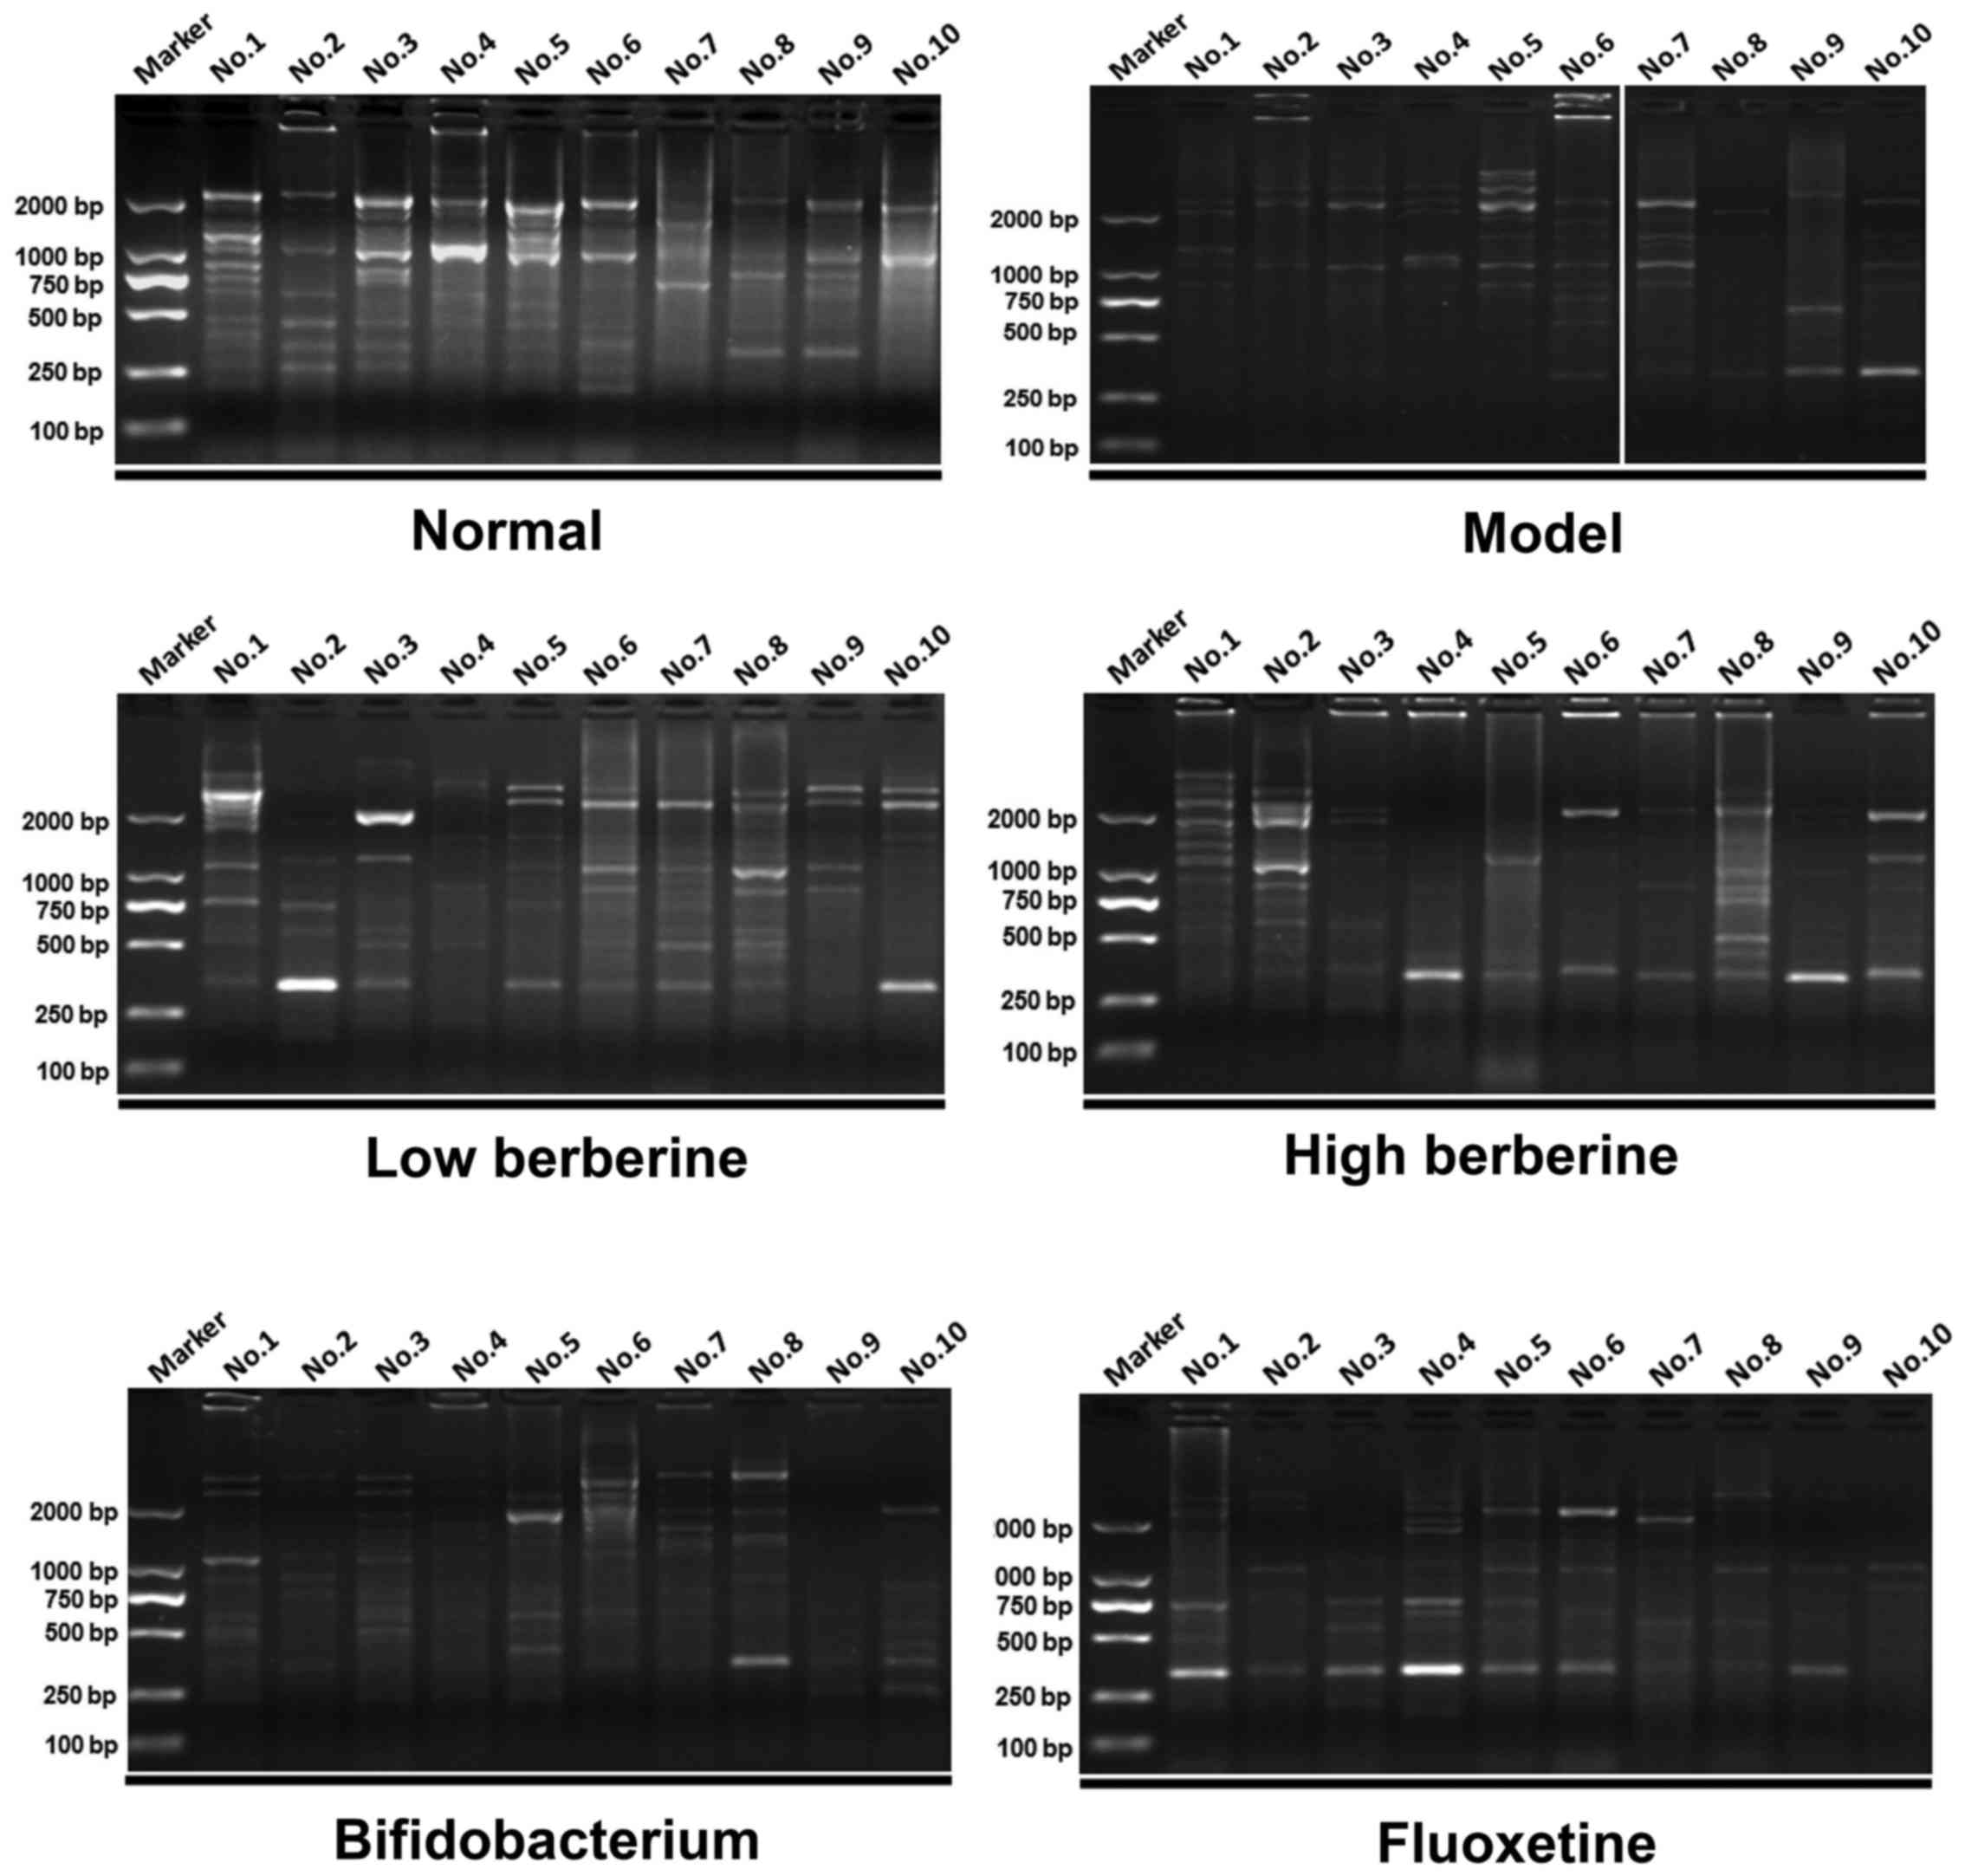
ERIC-PCR was used to perform a gastrointestinal
flora profile assay on the rat stomach, ileum, cecum and colon
tissues. Following modeling, several distinctive bands disappeared
when compared with the normal group. In addition, certain new
distinctive bands appeared in the low and high berberine groups,
similar to the results of the bifidobacterium and fluoxetine
treatment groups. For example, two new bands appeared in the
stomach tissue following modeling at ~2,000 bp and between 750 bp
and 500 bp in lanes 4–6 of the model group results. Several
distinctive bands appeared following treatment with low and high
berberine, including a new band between 750–500 bp in lanes 1–4
following low berberine treatment, and in lanes 1–3 following high
berberine treatment (Fig. 5).
Similarly, several distinctive bands appeared and disappeared in
the other tissues analyzed, within the ileum (Fig. 6), cecum (Fig. 7) and colon (Fig. 8). These data indicate that
berberine altered the gastrointestinal flora, and may be further
affected by depression.
Discussion
Following undergoing 10 stress methods, rat body
weight and sucrose preference significantly decreased when compared
with unstressed rats. This was gradually restored following graded
berberine treatment. In addition, the traversing, grooming and
motionless times were all increased following modeling and
decreased again following graded berberine treatment. Furthermore,
berberine appeared beneficial in the restoration of pathological
damage to rat stomach, ileum, cecum and colon, as demonstrated
using ERIC-PCR analysis.
Gastrointestinal flora is a normal microbial
population that is widely distributed in living organisms, involved
in the synthesis of multiple nutrients, including vitamins,
proteins and metals (28–30). A total of 10 trillion bacteria
exist within the human gastrointestinal system and may be divided
into three groups: Beneficial, neutral and pernicious bacteria,
according to their differing functions. These functions are not
only influenced by body weight, digestive ability, outstanding
infection and the risk of autoimmune disease, but are also involved
in the body's response to cancer therapeutic agents (28,31,32).
Following a disturbance to the gastrointestinal flora, diseases may
emerge (33). Gastrointestinal
flora may be divided into major and minor microflora. Major
microflora consist of obligate anaerobes with a large number of
involved species, including bacteroides, eubacterium,
bifidobacterium, ruminococci and fusobacterium, all of which
influence the function of host flora and determine physiological
and pathological regulation (28,29).
Minor microflora consist of facultative anaerobes, fewer in number
and species, including Escherichia coli and streptococcus,
which have high mobility and potential pathogenicity (28,34).
Major microflora typically exist in a microhabitat with low
disposal rate and highly abundant nutrients, for example, the colon
(28,32,34).
Aerobe or facultative anaerobe typically exist in microhabitats
with a higher disposal rate, for example, the proximal small
intestine (35). As
gastrointestinal flora and depression have previously been linked,
studying the major microflora in different orifices, particularly
the change of major microflora after stress stimulation, was
beneficial to prevention and treatment of these diseases.
ERIC sequences were initially discovered and named
by Sharples and Lloyd (36) and
described in a number of other previous studies (37–39).
Following this, Hulton et al (40) discovered ERIC sequences in the
genome of Escherichia coli and the genus Salmonella,
and Versalovic et al (41)
designed a PCR primer using the sequence of ERIC, and established a
ERIC-PCR amplification technique in the same year. This technique
involves designing a PCR primer according to the highly conserved
sequence of the ERIC core, subsequent amplification, followed by
analysis of the ERIC-PCR profile to identify the major microflora
distribution in gastrointestinal flora (41). In the present study, the ERIC-PCR
technique was selected and used to identify the variation of
gastrointestinal flora in a rat model, following ten stress methods
and/or drug intervention. Although several distinctive bands
appeared with or without drug intervention, this method requires
further analysis.
Berberine is a quaternary ammonium salt from the
protoberberine group of isoquinoline alkaloids, and it is present
in certain plants, including Berberis vulgaris and
Hydrastis canadensis (42).
Berberine was traditionally used as a medicine or dietary
supplement against fungal (43)
and MRSA infections (44).
Previous studies identified certain novel functions of berberine,
including prevention of cardiovascular disease (45), anti-inflammatory effects (45), treatment of diabetes mellitus
(46), antidepressant effects
(47–49) and neuroprotection (50). Therefore, the present study aimed
to further investigate the effects of the antidepressant effects of
berberine in a rat model of chronic stress and depression.
Following berberine treatment after inducing stress, rat behavior,
motionless time, sucrose preference, histopathology and
gastrointestinal flora profile markedly improved. The results
presented indicated that berberine may serve a significant
therapeutic effect in the treatments of chronic stress and
depression.
The present study induced chronic stress and
depression according to the results of the behavioral tests using
chronic unpredictable stress methods, and identified that treatment
with berberine not only provided a significant reference point for
studying the mechanism of chronic stress depression, but also
demonstrated a significant application in a clinical setting.
Acknowledgements
The present study was supported by the Armed Police
Force Scientific Research Fund Project (grant no. WZ2012050).
References
|
1
|
Technow JR, Hazel NA, Abela JR and Hankin
BL: Stress sensitivity interacts with depression history to predict
depressive symptoms among youth: Prospective changes following
first depression onset. J Abnorm Child Psychol. 43:489–501. 2015.
View Article : Google Scholar : PubMed/NCBI
|
|
2
|
Mayberry LS, Egede LE, Wagner JA and
Osborn CY: Stress, depression and medication nonadherence in
diabetes: Test of the exacerbating and buffering effects of family
support. J Behav Med. 38:363–371. 2015. View Article : Google Scholar : PubMed/NCBI
|
|
3
|
Fan LB, Blumenthal JA, Watkins LL and
Sherwood A: Work and home stress: Associations with anxiety and
depression symptoms. Occup Med (Lond). 65:110–116. 2015. View Article : Google Scholar : PubMed/NCBI
|
|
4
|
Wang X, Cai L, Qian J and Peng J: Social
support moderates stress effects on depression. Int J Ment Health
Syst. 8:412014. View Article : Google Scholar : PubMed/NCBI
|
|
5
|
Reynaud E, Guedj E, Trousselard M, El
Khoury-Malhame M, Zendjidjian X, Fakra E, Souville M, Nazarian B,
Blin O, Canini F and Khalfa S: Acute stress disorder modifies
cerebral activity of amygdala and prefrontal cortex. Cogn Neurosci.
6:39–43. 2015. View Article : Google Scholar : PubMed/NCBI
|
|
6
|
Pulopulos MM, Hidalgo V, Almela M,
Puig-Perez S, Villada C and Salvador A: Acute stress and working
memory in older people. Stress. 18:178–187. 2015. View Article : Google Scholar : PubMed/NCBI
|
|
7
|
Nilsson D, Nordenstam C, Green S,
Wetterhall A, Lundin T and Svedin CG: Acute stress among
adolescents and female rape victims measured by ASC-Kids: A pilot
study. Nord J Psychiatry. 69:539–545. 2015. View Article : Google Scholar : PubMed/NCBI
|
|
8
|
Gonzalez M, Melamed G and Dillon C: Acute
stress disorder in the emergency, its relationship with trigger
factors from a gender perspective. Vertex. 25:172–178. 2014.(In
Spanish). PubMed/NCBI
|
|
9
|
Razzoli M, McCallum J, Gurney A, Engeland
WC and Bartolomucci A: Chronic stress aggravates glucose
intolerance in leptin receptor-deficient (db/db) mice. Genes Nutr.
10:4582015. View Article : Google Scholar : PubMed/NCBI
|
|
10
|
Radenbach C, Reiter AM, Engert V, Sjoerds
Z, Villringer A, Heinze HJ, Deserno L and Schlagenhauf F: The
interaction of acute and chronic stress impairs model-based
behavioral control. Psychoneuroendocrinology. 53:268–280. 2015.
View Article : Google Scholar : PubMed/NCBI
|
|
11
|
Hoffman AN, Parga A, Paode PR, Watterson
LR, Nikulina EM, Hammer RP Jr and Conrad CD: Chronic stress
enhanced fear memories are associated with increased amygdala
zif268 mRNA expression and are resistant to reconsolidation.
Neurobiol Learn Mem. 120:61–68. 2015. View Article : Google Scholar : PubMed/NCBI
|
|
12
|
Breuer K, Göldner FM, Jager B, Werfel T
and Schmid-Ott G: Chronic stress experience and burnout syndrome
have appreciable influence on health-related quality of life in
patients with psoriasis. J Eur Acad Dermatol Venereol.
29:1898–1904. 2015. View Article : Google Scholar : PubMed/NCBI
|
|
13
|
Gutknecht L, Popp S, Waider J, Sommerlandt
FM, Göppner C, Post A, Reif A, van den Hove D, Strekalova T,
Schmitt A, et al: Interaction of brain 5-HT synthesis deficiency,
chronic stress and sex differentially impact emotional behavior in
Tph2 knockout mice. Psychopharmacology (Berl). 232:2429–2441. 2015.
View Article : Google Scholar : PubMed/NCBI
|
|
14
|
Elfving B, Jakobsen JL, Madsen JC, Wegener
G and Muller HK: Chronic restraint stress increases the protein
expression of VEGF and its receptor VEGFR-2 in the prefrontal
cortex. Synapse. 190–194:692015.
|
|
15
|
Duncan J, Wang N, Zhang X, Johnson S,
Harris S, Zheng B, Zhang Q, Rajkowska G, Miguel-Hidalgo JJ, Sittman
D, et al: Chronic social stress and ethanol increase expression of
KLF11, a cell death mediator, in rat brain. Neurotox Res. 28:18–31.
2015. View Article : Google Scholar : PubMed/NCBI
|
|
16
|
Zhao J, Jung YH, Jang CG, Chun KH, Kwon SW
and Lee J: Metabolomic identification of biochemical changes
induced by fluoxetine and imipramine in a chronic mild stress mouse
model of depression. Sci Rep. 5:88902015. View Article : Google Scholar : PubMed/NCBI
|
|
17
|
Xing H, Zhang K, Zhang R, Zhang Y, Gu L,
Shi H, Bi K and Chen X: Determination of depression biomarkers in
rat plasma by liquid chromatography-mass spectrometry for the study
of the antidepressant effect of Zhi-Zi-Hou-Po decoction on rat
model of chronic unpredictable mild stress. J Chromatogr B Analyt
Technol Biomed Life Sci. 988:135–142. 2015. View Article : Google Scholar : PubMed/NCBI
|
|
18
|
Thompson AK, Fourman S, Packard AE, Egan
AE, Ryan KK and Ulrich-Lai YM: Metabolic consequences of chronic
intermittent mild stress exposure. Physiol Behav. 150:24–30. 2015.
View Article : Google Scholar : PubMed/NCBI
|
|
19
|
Yu M, Zhang X, Lu F and Fang L: Depression
and risk for diabetes: A meta-analysis. Can J Diabetes. 39:266–272.
2015. View Article : Google Scholar : PubMed/NCBI
|
|
20
|
Smith HR: Depression in cancer patients:
Pathogenesis, implications and treatment (Review). Oncol Lett.
9:1509–1514. 2015.PubMed/NCBI
|
|
21
|
Fagelman KM, Methratta S, Cilley RE,
Wilson MZ and Hollenbeak CS: The depression index: An objective
measure of the severity of pectus excavatum based on vertebral
diameter, a morphometric correlate to patient size. J Pediatr Surg.
50:1130–1133. 2015. View Article : Google Scholar : PubMed/NCBI
|
|
22
|
Tchuenbou J, Hamy A, Papapietro V, Sagan
C, Paineau J and Le Bodic L: Gastrointestinal mucormycosis: A rare
cause of digestive system hemorrhage. Gastroenterol Clin Biol.
23:794–795. 1999.(In French). PubMed/NCBI
|
|
23
|
Infant nutrition: Metabolism and the
digestive system. Proceedings, international symposium in infant
nutrition and the development of the gastrointestinal tract.
Niagara falls, Ontario, June 21–25, 1982. J Pediatr Gastroenterol
Nutr. 2:(Suppl 1). S1–S342. 1983.
|
|
24
|
Gastrointestinal hormones and pathology of
the digestive system. Adv Exp Med Biol. 106:1–326. 1978.
|
|
25
|
Results in gastroenterology 1978. Immune
system and the gastrointestinal tract; classification and therapy
of intestinal neoplasms. 33rd meeting of the German society for
digestive and metabolic diseases, Hamburg, 28–30 September 1978. Z
Gastroenterol Verh. 1–115. 1978.(In German).
|
|
26
|
Cossel L: Functional disorders of the
gastrointestinal system; a contribution to the chronic digestive
disorders of the duodenum and to the acute stomach dilatation.
Zentralbl Chir. 80:273–289. 1955.(In German). PubMed/NCBI
|
|
27
|
Ge L, Zhu MM, Yang JY, Wang F, Zhang R,
Zhang JH, Shen J, Tian HF and Wu CF: Differential proteomic
analysis of the anti-depressive effects of oleamide in a rat
chronic mild stress model of depression. Pharmacol Biochem Behav.
131:77–86. 2015. View Article : Google Scholar : PubMed/NCBI
|
|
28
|
Adak A, Maity C, Ghosh K and Mondal KC:
Alteration of predominant gastrointestinal flora and oxidative
damage of large intestine under simulated hypobaric hypoxia. Z
Gastroenterol. 52:180–186. 2014. View Article : Google Scholar : PubMed/NCBI
|
|
29
|
Wiwanitkit V: Antibiotic and
gastrointestinal tract flora. Vet Microbiol. 148:4522011.
View Article : Google Scholar : PubMed/NCBI
|
|
30
|
Shimizu K, Ogura H, Asahara T, Nomoto K,
Morotomi M, Nakahori Y, Osuka A, Yamano S, Goto M, Matsushima A, et
al: Gastrointestinal dysmotility is associated with altered gut
flora and septic mortality in patients with severe systemic
inflammatory response syndrome: A preliminary study.
Neurogastroenterol Motil. 23:330–335, e157. 2011. View Article : Google Scholar : PubMed/NCBI
|
|
31
|
Björkstén B: Impact of gastrointestinal
flora on systemic diseases. J Pediatr Gastroenterol Nutr. 46:(Suppl
1). E12–E13. 2008. View Article : Google Scholar
|
|
32
|
Shanahan F: Gut flora in gastrointestinal
disease. Eur J Surg Suppl. 47–52. 2002.PubMed/NCBI
|
|
33
|
Marteau P: Role of the intestinal flora in
gastrointestinal diseases. Lancet. 356:(Suppl). s282000. View Article : Google Scholar : PubMed/NCBI
|
|
34
|
Adams JB, Johansen LJ, Powell LD, Quig D
and Rubin RA: Gastrointestinal flora and gastrointestinal status in
children with autism-comparisons to typical children and
correlation with autism severity. BMC Gastroenterol. 11:222011.
View Article : Google Scholar : PubMed/NCBI
|
|
35
|
in't Huis Veld JH: Gastrointestinal flora
and health in man and animal. Tijdschr Diergeneeskd. 116:232–239.
1991.(In Dutch). PubMed/NCBI
|
|
36
|
Sharples GJ and Lloyd RG: A novel repeated
DNA sequence located in the intergenic regions of bacterial
chromosomes. Nucleic Acids Res. 18:6503–6508. 1990. View Article : Google Scholar : PubMed/NCBI
|
|
37
|
Ture M, Altinok I and Capkin E: Comparison
of pulsed-field gel electrophoresis and enterobacterial repetitive
intergenic consensus PCR and biochemical tests to characterize
Lactococcus garvieae. J Fish Dis. 38:37–47. 2015. View Article : Google Scholar : PubMed/NCBI
|
|
38
|
Fendri I, Ben Hassena A, Grosset N,
Barkallah M, Khannous L, Chuat V, Gautier M and Gdoura R: Genetic
diversity of food-isolated Salmonella strains through Pulsed
Field Gel Electrophoresis (PFGE) and Enterobacterial Repetitive
Intergenic Consensus (ERIC-PCR). PLoS One. 8:e813152013. View Article : Google Scholar : PubMed/NCBI
|
|
39
|
Adzitey F: Genetic diversity of
Escherichia coli isolated from ducks and the environment
using enterobacterial repetitive intergenic consensus. Pak J Biol
Sci. 16:1173–1178. 2013. View Article : Google Scholar : PubMed/NCBI
|
|
40
|
Hulton CS, Higgins CF and Sharp PM: ERIC
sequences: A novel family of repetitive elements in the genomes of
Escherichia coli, Salmonella typhimurium and other
enterobacteria. Mol Microbiol. 5:825–834. 1991. View Article : Google Scholar : PubMed/NCBI
|
|
41
|
Versalovic J, Koeuth T and Lupski JR:
Distribution of repetitive DNA sequences in eubacteria and
application to fingerprinting of bacterial genomes. Nucleic Acids
Res. 19:6823–6831. 1991. View Article : Google Scholar : PubMed/NCBI
|
|
42
|
Zhang Q, Cai L, Zhong G and Luo W:
Simultaneous determination of jatrorrhizine, palmatine, berberine,
and obacunone in Phellodendri Amurensis Cortex by RP-HPLC. Zhongguo
Zhong Yao Za Zhi. 35:2061–2064. 2010.(In Chinese). PubMed/NCBI
|
|
43
|
Berberine. Altern Med Rev. 5:175–177.
2000.PubMed/NCBI
|
|
44
|
Yu HH, Kim KJ, Cha JD, Kim HK, Lee YE,
Choi NY and You YO: Antimicrobial activity of berberine alone and
in combination with ampicillin or oxacillin against
methicillin-resistant Staphylococcus aureus. J Med Food. 8:454–461.
2005. View Article : Google Scholar : PubMed/NCBI
|
|
45
|
Kuo CL, Chi CW and Liu TY: The
anti-inflammatory potential of berberine in vitro and in vivo.
Cancer Lett. 203:127–137. 2004. View Article : Google Scholar : PubMed/NCBI
|
|
46
|
Gu Y, Zhang Y, Shi X, Li X, Hong J, Chen
J, Gu W, Lu X, Xu G and Ning G: Effect of traditional Chinese
medicine berberine on type 2 diabetes based on comprehensive
metabonomics. Talanta. 81:766–772. 2010. View Article : Google Scholar : PubMed/NCBI
|
|
47
|
Kulkarni SK and Dhir A: Sigma-1 receptors
in major depression and anxiety. Expert Rev Neurother. 9:1021–1034.
2009. View Article : Google Scholar : PubMed/NCBI
|
|
48
|
Kulkarni SK and Dhir A: Current
investigational drugs for major depression. Expert Opin Investig
Drugs. 18:767–788. 2009. View Article : Google Scholar : PubMed/NCBI
|
|
49
|
Kulkarni SK and Dhir A: On the mechanism
of antidepressant-like action of berberine chloride. Eur J
Pharmacol. 589:163–172. 2008. View Article : Google Scholar : PubMed/NCBI
|
|
50
|
Kulkarni SK and Dhir A: Berberine: A plant
alkaloid with therapeutic potential for central nervous system
disorders. Phytother Res. 24:317–324. 2010. View Article : Google Scholar : PubMed/NCBI
|