Introduction
As a type of tumor derived from glial cells in the
spine or brain (1), gliomas
account for ~80% of malignant brain tumors, and 30% of central
nervous system and brain tumors (2). According to their histological
features, gliomas are classified into astrocytomas, ependymomas,
oligodendrogliomas, optic nerve gliomas, mixed gliomas and
brainstem gliomas, among which astrocytomas are the common type of
primary brain tumor among adults (3). Gliomas are also divided into
low-grade gliomas (grade I and II) and high-grade gliomas (grade
III and IV) according to the World Health Organization
classification criteria (4). High
grade gliomas are malignant gliomas comprising glioblastoma
multiforme and anaplastic astrocytomas, and the median overall
survival rates of patients with glioblastoma multiforme and
anaplastic astrocytomas are ~15 months and 3 years, respectively
(5). Therefore, elucidation of the
mechanisms underlying malignant gliomas and the development of
novel therapeutic strategies are urgently required.
Several studies have investigated the genes in
involved in gliomas. In children with malignant gliomas, the
overexpression of p53 is closely associated with adverse
outcomes, independently of histological findings and clinical
prognostic factors (6,7). As a critical mediator of the unfolded
protein response, 78-kDa glucose-regulated protein (GRP78)
is significantly upregulated in human malignant glioma and
associated with its proliferation rate, suggesting that drugs
capable of inhibiting GRP78 may be applied in the treatment
of malignant glioma (8). Promoter
methylation-induced silencing of the O6-methylguanine-DNA
methyltransferase DNA-repair gene contributes to longer survival
rates in patients with glioblastoma who are treated with alkylating
agents (9). A previous study
demonstrated that the increased level of hypoxia-inducible
factor-1α (HIF-1α) is critical for the activation of glioma
cell motility through affecting molecules associated with invasion
(10,11). The Decoy receptor 3 (DcR3) soluble
protein may be implicated in the immune evasion and progression of
malignant gliomas through inhibiting CD95 ligand (CD95 L)
(12). It has also been reported
that the overexpression of Neuropilin 1 (NRP1) promotes
tumor progression and is associated with poor prognosis in glioma
(13). Spy1, which belongs to the
Speedy/RINGO family, is correlated with the poor prognosis in
patients with glioma and may serve as an independent prognostic
predictor for patients with the disease (14). However, a comprehensive
understanding of the mechanisms underlying gliomas is required.
In 2014, Guan et al used newly sequenced
glioma datasets and downloaded glioma gene expression profiles to
investigate the association between known molecular subtypes of
grade IV glioblastoma (GBM) with grade II/III gliomas (GII/III),
and found shared patterns between the GBMs and GII/IIIs (15). Using the data deposited by Guan
et al (15), the present
study further identified the differentially expressed genes (DEGs)
in three comparison groups (grade III, vs. grade II, grade IV, vs.
grade II, and grade IV, vs. grade III), and their functions were
predicted using enrichment analysis. Subsequently, protein-protein
interaction (PPI) networks were constructed and module analysis was
performed to analyze the interactions among the DEGs. In addition,
glioma-associated genes and glioma marker genes among the DEGs were
screened to identify the key genes implicated in malignant
glioma.
Materials and methods
Microarray data
The gene expression profile of GSE54004, which was
sequenced on the platform of GPL18281 Illumina HumanHT-12 WG-DASL
V4.0 R2 expression beadchip (gene symbol version), was downloaded
from the Gene Expression Omnibus database (http://www.ncbi.nih.gov/geo). To identify the key
genes involved in the progression of malignant glioma, a total 143
samples were selected from the GSE54004 dataset, including 12 grade
II astrocytomas, 33 grade III astrocytomas and 98 grade IV
astrocytomas. The astrocytomas were collected from patients with
glioma, following which the tissues were fixed in formalin and
embedded in paraffin at MD Anderson Cancer Center (Houston, TX,
USA) (15). The GSE54004 dataset
was deposited by Guan et al (15), and this study by Guan et al
(15) was approved by the
Institutional Review Board of MD Anderson Cancer Center, with
informed consent provided by all participants.
DEG screening
The downloaded gene expression files were merged to
obtain a gene expression matrix. Using the Limma package (16) in R (version 3.22.7, http://www.bioconductor.org/packages/release/bioc/html/limma.html),
the DEGs in three comparison groups (grade III, vs. grade II, grade
IV, vs. grade II, and grade IV, vs. grade III) were analyzed. The
thresholds of P<0.05 and |log2fold change (FC)|≥1
were used. VennPlex software (version 1.0.0.2; http://www.irp.nia.nih.gov/bioinformatics/vennplex.html)
enables the screening of upregulated, downregulated or
contraregulated individual factors between complex data sets
(17). Venn diagram analysis was
performed for the DEGs screened from different groups using
VennPlex software (17) (version
1.0.0.2; http://www.irp.nia.nih.gov/bioinformatics/vennplex.html).
Functional and pathway enrichment
analysis
Gene Ontology (GO; http://www.geneontology.org/) can be utilized to
predict the potential functions for genes and their products in
terms of molecular function (MF), cellular component (CC) and
biological process (BP) (18). The
Kyoto Encyclopedia of Genes and Genomes (KEGG; http://www.genome.jp/kegg/) database contains
integrated knowledge of information regarding biochemical reactions
and compounds, information on proteins and genes, and information
on molecular interaction networks (19). GO functional and KEGG pathway
enrichment analyses were performed separately for the upregulated
and downregulated genes in each comparison group, using Database
for Annotation, Visualization and Integrated Discovery software
(DAVID version 6.7; http://www.david.niaid.nih.gov). Those terms involving
at least two genes and with a P-value of P<0.05 were
selected.
PPI network and module analyses
The Search Tool for the Retrieval of Interacting
Genes (STRING version 10.0; http://string-db.org/) web resource and database
contributes to the identification of PPIs, involving functional and
physical associations (20). The
PPI associations among the DEGs in each comparison group were
searched using the STRING database (21), with a combined score (required
confidence) >0.9. Following this, the PPI networks for the DEGs
in each comparison group were visualized separately using Cytoscape
software (version 3.2.0; http://www.cytoscape.org/) (22). In the PPI network, the degrees of
nodes were determined by the number of edges involved, and nodes
with higher degrees were determined as key nodes. Module analysis
was also performed for the PPI networks using the ClusterONE tool
(23).
Identification of glioma-associated
genes and glioma marker genes
The Comparative Toxicogenomics Database (CTD;
http://ctdbase.org/) (24) collects gene-disease,
chemical-disease and chemical-gene interactions, which are manually
searched from scientific literature through strict text mining
using structured notation, ontologies and controlled vocabularies.
Combined with the CTD database, glioma-associated genes and glioma
marker genes among the DEGs screened for each group were
analyzed.
Results
DEG analysis
With the thresholds of P<0.05 and
|log2FC| ≥1, the DEGs in the three comparison groups
were analyzed. Compared with grade II samples, a total of 27 DEGs
(grade III, vs. grade II), including nine upregulated and 18
downregulated genes, were screened in the grade III samples. A
total of 1,446 DEGs (grade IV, vs. grade II), including 643
upregulated and 803 downregulated genes, were identified in the
grade IV samples. A total of 776 DEGs (grade IV, vs. grade III),
including 410 upregulated and 366 downregulated genes, were
identified in the grade IV samples relative to the grade III
samples. There were more DEGs in the grade III and grade IV
samples.
Venn diagram analysis showed that 20 DEGs, including
five upregulated and 15 downregulated genes, were common genes
between the grade III, vs. grade II and grade IV, vs. grade II
comparison groups. In addition, 698 DEGs, including 356 upregulated
and 342 downregulated genes, were common genes between the grade
IV, vs. grade II, and grade IV, vs. grade III comparison groups
(Fig. 1).
Functional and pathway enrichment
analysis
No functions were enriched for the upregulated genes
in the grade III, vs. grade II group. However, the downregulated
genes in the grade III, vs. grade II group were significantly
enriched in functions including synaptic transmission (GO_BP;
P=8.06E-04) and plasma membrane (GO_CC; P=1.98E-02; Table I). No pathways were enriched for
the DEGs in the grade III, vs. grade II group.
 | Table I.Functions enriched for the
downregulated genes in the grade III, vs. grade II group. |
Table I.
Functions enriched for the
downregulated genes in the grade III, vs. grade II group.
| Category | Term | P-value | Genes (n) | Gene symbol |
|---|
| BP | GO:0007268~synaptic
transmission | 8.06E-04 | 4 | NOS1, PCDHB4,
UNC13C, HTR2A |
|
|
GO:0019226~transmission of nerve
impulse | 1.28E-03 | 4 | NOS1, PCDHB4,
UNC13C, HTR2A |
|
|
GO:0050877~neurological system
process | 5.56E-03 | 5 | NOS1, PCDHB4,
POU4F1, UNC13C, HTR2A |
|
|
GO:0007267~cell-cell signaling | 5.97E-03 | 4 | NOS1, PCDHB4,
UNC13C, HTR2A |
|
| GO:0043271~negative
regulation of ion transport | 1.52E-02 | 2 | NOS1,
HTR2A |
|
|
GO:0007416~synaptogenesis | 2.11E-02 | 2 | PCDHB4,
POU4F1 |
|
| GO:0009408~response
to heat | 3.67E-02 | 2 | NOS1,
XYLT1 |
|
| GO:0050808~synapse
organization | 3.99E-02 | 2 | PCDHB4,
POU4F1 |
| CC | GO:0005886~plasma
membrane | 1.98E-02 | 8 | CAMKV, EPHB6,
NOS1, PCDHB4, UNC13C, TMEM25, ABCC8, HTR2A |
For the upregulated genes in the grade IV, vs. grade
II group, functions including extracellular matrix organization
(GO_BP; P=2.64E-17), extracellular matrix (GO_CC; P=2.90E-25),
which involves matrix metallopeptidase 9 (MMP9) and
extracellular matrix structural constituent (GO_MF; P=4.83E-10), in
addition to the systemic lupus erythematosus pathway (P=4.70E-16),
were significantly enriched. For the downregulated genes in the
grade IV, vs. grade II group, functions including transmission of
nerve impulse (GO_BP; P=1.12E-20), synapse (GO_CC; P=1.96E-21) and
ion channel activity (GO_MF; P=1.35E-18), in addition to the
neuroactive ligand-receptor interaction pathway (P=6.62E-07), were
significantly enriched (Table
II).
| Table II.Functions and pathways separately
enriched for the upregulated and downregulated genes in the grade
IV, vs. grade II group. |
Table II.
Functions and pathways separately
enriched for the upregulated and downregulated genes in the grade
IV, vs. grade II group.
| Category | Term | P-value | Genes (n) | Gene symbol |
|---|
| Upregulated |
|
|
|
|
| BP |
GO:0030198~extracellular matrix
organization | 2.64E-17 | 29 | ADAMTS14, MMP9,
LUM, COL3A1, ELN, POSTN, DCN, SERPINH1, TGFB2, TNFRSF11B… |
|
| GO:0009611~response
to wounding | 2.31E-15 | 61 | F2RL2, NRP1,
S100A8, S100A9, C1QC, CXCL10, TGFB2, CD97, S1PR3, SAA2… |
|
| GO:0022403~cell
cycle phase | 2.89E-15 | 53 | KIF23, KIFC1,
PRC1, PTTG1, GTSE1, CDKN2C, CDCA2, DNAJC2, CCNA2,
SNHG3-RCC1… |
| CC |
GO:0031012~extracellular matrix | 2.90E-25 | 62 | CTHRC1, LTBP1,
NPNT, MMP9, MMP7, POSTN, MMP2, TGFB2, TNFRSF11B, TGFBI… |
|
|
GO:0005576~extracellular region | 1.42E-23 | 161 | F2RL2, CTHRC1,
LTBP1, C9ORF47, FAM20A, MMP9, FAM20C, MMP7, TNFSF14,
POSTN… |
|
|
GO:0005578~proteinaceous extracellular
matrix | 5.13E-23 | 57 | CTHRC1, LTBP1,
NPNT, MMP9, MMP7, POSTN, MMP2, TNFRSF11B, TGFBI, LOX… |
| MF |
GO:0005201~extracellular matrix structural
constituent | 4.83E-10 | 19 | COL4A2, COL4A1,
LUM, ELN, COL3A1, CHI3L1, MGP, COL5A3, EMILIN2, COL5A2… |
|
|
GO:0050840~extracellular matrix
binding | 5.02E-10 | 12 | BGN, TGFBI,
C6ORF15, VEGFA, ELN, OLFML2A, NID1, DCN, THBS1, ADAM9… |
|
|
GO:0030246~carbohydrate binding | 1.18E-09 | 38 | CCL2, C21ORF63,
CD248, SUSD2, HEXB, POSTN, DCN, MDK, SIGLEC9, HMMR… |
| Pathway | hsa05322: Systemic
lupus erythematosus | 4.70E-16 | 28 | HIST1H2AB,
HIST4H4, HIST1H4L, HIST2H2AA4, HLA-DRB1, C1R, C1S, C1QC, HIST1H2BO,
HIST1H2BM… |
|
| hsa04512:
ECM-receptor interaction | 6.20E-11 | 21 | COL4A2, COL4A1,
TNC, COL3A1, ITGA1, HSPG2, ITGA3, COL5A3, COL5A2, COL5A1… |
|
| hsa04510: Focal
adhesion | 5.34E-09 | 29 | CAV2, CAV1, TNC,
COL3A1, COL6A3, COL6A1, ZYX, PDGFD, LAMB1, THBS1… |
| Downregulated |
|
|
| BP |
GO:0019226~transmission of nerve
impulse | 1.12E-20 | 58 | SYT1, GABRB3,
SYT4, GLRA3, CNP, GABBR2, KCNIP2, VIPR1, SLC1A4, KCNQ5… |
|
| GO:0007268~synaptic
transmission | 1.47E-19 | 52 | SYT1, GABRB3,
SYT4, GLRA3, CNP, GABBR2, KCNIP2, VIPR1, SLC1A4, KCNQ5… |
|
| GO:0006811~ion
transport | 2.91E-15 | 79 | KCNC2, KCNH1,
SLC22A17, SLC8A3, JPH4, JPH3, GABRB3, SCN3A, KCNAB1,
SCN3B… |
| CC |
GO:0045202~synapse | 1.96E-21 | 63 | SYT1, SEPT3,
ENAH, CLSTN2, GABRB3, SYT4, GRIP1, GLRA3, GABRB1, SYT9… |
|
| GO:0044456~synapse
part | 7.63E-19 | 49 | SYT1, SYT4,
GABRB3, CLSTN2, GRIP1, GABRB1, GLRA3, SYT9, GABBR2,
GRIN3A… |
|
| GO:0043005~neuron
projection | 2.24E-12 | 48 | SNCG, SYT1,
CDK5R1, CCK, ADCY2, SYT4, GABRB3, SNCB, ALDOC, GRIN3A… |
| MF | GO:0005216~ion
channel activity | 1.35E-18 | 59 | KCNC2, KCNH1,
SCN3A, GABRB3, KCNAB1, SCN3B, GLRA3, GABRB1, GRIN3A,
KCNIP2… |
|
| GO:0015267~channel
activity | 1.56E-18 | 61 | KCNC2, KCNH1,
SCN3A, GABRB3, KCNAB1, SCN3B, GLRA3, GABRB1, GRIN3A,
KCNIP2… |
|
| GO:0022803~passive
transmembrane transporter activity | 1.76E-18 | 61 | KCNC2, KCNH1,
SCN3A, GABRB3, KCNAB1, SCN3B, GLRA3, GABRB1, GRIN3A,
KCNIP2… |
| Pathway | hsa04080:
Neuroactive ligand-receptor interaction | 6.62E-07 | 28 | GPR83, THRA,
PRLHR, GABRB3, GABRB1, DRD5, GLRA3, GRIN3A, GABBR2, VIPR1… |
|
| hsa04020: Calcium
signaling pathway | 6.83E-06 | 21 | SLC8A3, ADCY2,
SLC8A2, NOS1, ADCY8, DRD5, GRIN1, CACNA1I, GRM1, ATP2B2… |
|
| hsa04360: Axon
guidance | 2.96E-03 | 13 | NGEF, PLXNB1,
ABLIM3, NTN4, SLIT1, EPHB1, PAK7, EPHB6, SEMA6B, EPHA6… |
For the upregulated genes in the grade IV, vs. grade
III group, terms including extracellular matrix organization
(GO_BP; P=9.69E-20), extracellular region part (GO_CC; P=5.11E-28),
extracellular matrix structural constituent (GO_MF; P=3.47E-13),
which involves chitinase 3-like 1 (CHI3L1), and ECM-receptor
interaction (P=1.35E-10) were significantly enriched. For the
downregulated genes in the grade IV, vs. grade III group, terms
including transmission of nerve impulse (GO_BP; P=1.02E-14),
synapse (GO_CC; P=4.37E-22), calcium ion binding (GO_MF;
P=2.79E-13) and calcium signaling pathway (P=2.15E-05) were
significantly enriched (Table
III).
| Table III.Functions and pathways separately
enriched for the upregulated and downregulated genes in the grade
IV, vs. grade III group. |
Table III.
Functions and pathways separately
enriched for the upregulated and downregulated genes in the grade
IV, vs. grade III group.
| Category | Term | P-value | Genes (n) | Gene symbol |
|---|
| Upregulated |
|
|
|
|
| BP |
GO:0030198~extracellular matrix
organization | 9.69E-20 | 27 | IBSP, ADAMTS14,
LUM, MMP9, COL3A1, POSTN, SERPINH1, TGFBI, BCL3, LOX… |
|
|
GO:0001944~vasculature development | 1.06E-15 | 34 | CAV1, NRP1,
TNFRSF12A, COL3A1, ENPEP, TYMP, ACE, HOXA3, ANG, HMOX1… |
|
|
GO:0043062~extracellular structure
organization | 1.42E-15 | 28 | IBSP, ADAMTS14,
MMP9, LUM, COL3A1, POSTN, SERPINH1, TGFBI, BCL3, LOX… |
| CC |
GO:0044421~extracellular region part | 5.11E-28 | 87 | CTHRC1, MMP9,
IGFBP6, MMP7, TNFSF14, POSTN, HP, CXCL10, ISG15, SAA2… |
|
|
GO:0031012~extracellular matrix | 3.40E-26 | 52 | CTHRC1, MMP9,
MMP7, POSTN, ANG, TGFBI, LOX, SPON2, VWA1, LOXL1… |
|
|
GO:0005578~proteinaceous extracellular
matrix | 6.96E-26 | 50 | ADAMTS18,
CTHRC1, ADAMTS14, CD248, MMP9, LUM, COL3A1, MMP7, POSTN,
TIMP1… |
| MF |
GO:0005201~extracellular matrix structural
constituent | 3.47E-13 | 19 | COL18A1, COL4A2,
COL4A1, LUM, EFEMP2, COL3A1, CHI3L1, MGP, EMILIN2, COL5A2… |
|
| GO:0019838~growth
factor binding | 1.25E-11 | 19 | COL4A1, IL2RA,
OSMR, IGFBP6, COL3A1, ESM1, COL5A1, CD36, IL1RAP, COL1A2… |
|
|
GO:0030247~polysaccharide binding | 7.81E-09 | 19 | FGFR1, SUSD2,
C6ORF15, POSTN, CXCL6, COL5A1, PCOLCE2, TNFAIP6, BGN, ANG… |
| Pathway | hsa04512:
ECM-receptor interaction | 1.35E-10 | 17 | IBSP, COL4A2,
COL4A1, COL3A1, ITGA1, ITGA3, COL5A2, COL5A1, CD36, ITGA5… |
|
| hsa04510: Focal
adhesion | 2.82E-09 | 23 | IBSP, CAV2,
CAV1, COL4A2, COL4A1, VAV3, COL3A1, MET, ITGA1, ACTN1… |
|
| hsa05322: Systemic
lupus erythematosus | 2.98E-05 | 12 | HIST1H2AB,
HIST2H3A, HIST2H2AA4, HIST1H4L, HIST1H2BH, ACTN1, C1R, HIST2H3C,
HIST2H3D… |
| Downregulated |
|
|
|
|
| BP |
GO:0019226~transmission of nerve
impulse | 1.02E-14 | 34 | SYT1, SYT4,
GABRB3, GLRA3, GABBR2, KCNIP2, SLC1A4, NPTX1, GAD2, S1PR1… |
|
| GO:0007268~synaptic
transmission | 2.14E-13 | 30 | SYT1, SYT4,
GABRB3, GLRA3, GABBR2, KCNIP2, SLC1A4, NPTX1, GAD2, SYN1… |
|
|
GO:0007267~cell-cell signaling | 5.65E-12 | 40 | SYT1, EDN3,
CCL3, SYT4, GABRB3, FGF17, CAMK2G, GLRA3, FGF12, GABBR2… |
| CC |
GO:0045202~synapse | 4.37E-22 | 45 | SYT1, SEPT3,
CDK5R1, ENAH, SNAP91, CLSTN2, GABRB3, SYT4, GLRA3, GABRB1… |
|
| GO:0044456~synapse
part | 1.31E-20 | 37 | SYT1, SNAP91,
CLSTN2, GABRB3, SYT4, GABRB1, GLRA3, SYT9, BCAN, ATP6V1G2… |
|
| GO:0043005~neuron
projection | 2.66E-11 | 31 | SNCG, SYT1,
CDK5R1, CCK, ADCY2, SNCB, SYT4, GABRB3, GRIN3A, GABBR2… |
| MF | GO:0005509~calcium
ion binding | 2.79E-13 | 53 | SYT1, CLSTN2,
SYT4, MASP1, SYT9, GRIN3A, KCNIP2, KCNIP3, SYP, ATP2B2…… |
|
| GO:0022836~gated
channel activity | 4.21E-12 | 29 | KCNC2, GABRB3,
GABRB1, GLRA3, GRIN3A, KCNIP2, KCNK12, KCNJ3, KCNIP3,
GRIN2C…… |
|
| GO:0005216~ion
channel activity | 3.09E-11 | 31 | KCNC2, GABRB3,
GABRB1, GLRA3, GRIN3A, KCNIP2, KCNK12, KCNJ3, KCNIP3,
SLC1A4…… |
| Pathway | hsa04080:
Neuroactive ligand-receptor interaction | 9.42E-07 | 19 | GABRG2, GABRA1,
THRA, PRLHR, GABRB3, GLRA3, GABRB1, ADCYAP1R1, GRIN1,
GRIN3A…… |
|
| hsa04020: Calcium
signaling pathway | 2.15E-05 | 14 | ADCY2, SLC8A2,
ADCY8, CAMK2G, CACNA1I, GRIN1, GRM1, ATP2B2, CD38,
GRIN2C…… |
|
| hsa04720: Long-term
potentiation | 1.65E-03 | 7 | GRIA2, ADCY8,
GRIN2C, CAMK2G, PPP1R1A, GRIN1, GRM1 |
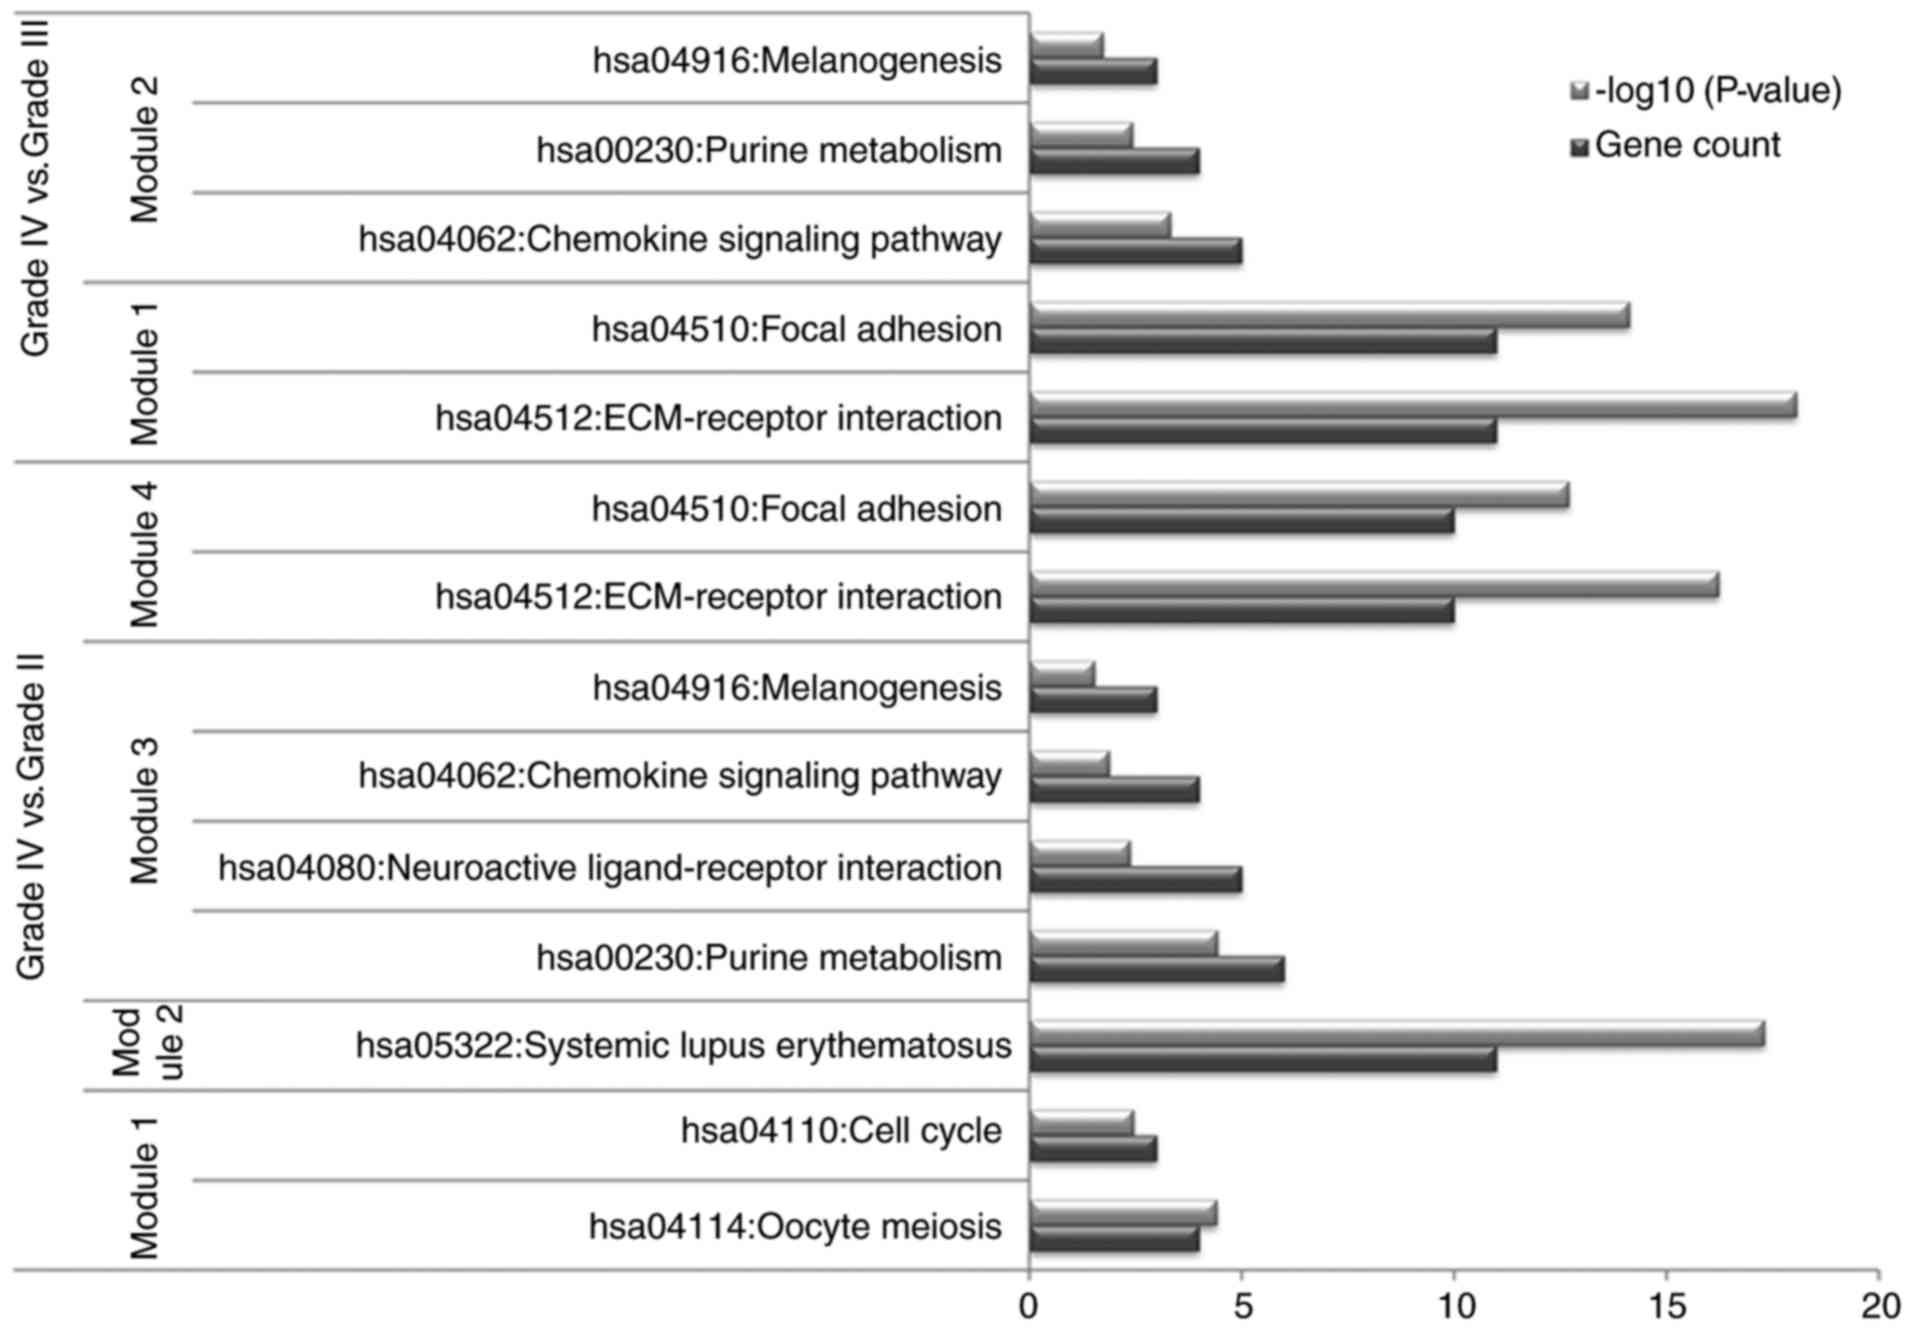
PPI network and module analyses
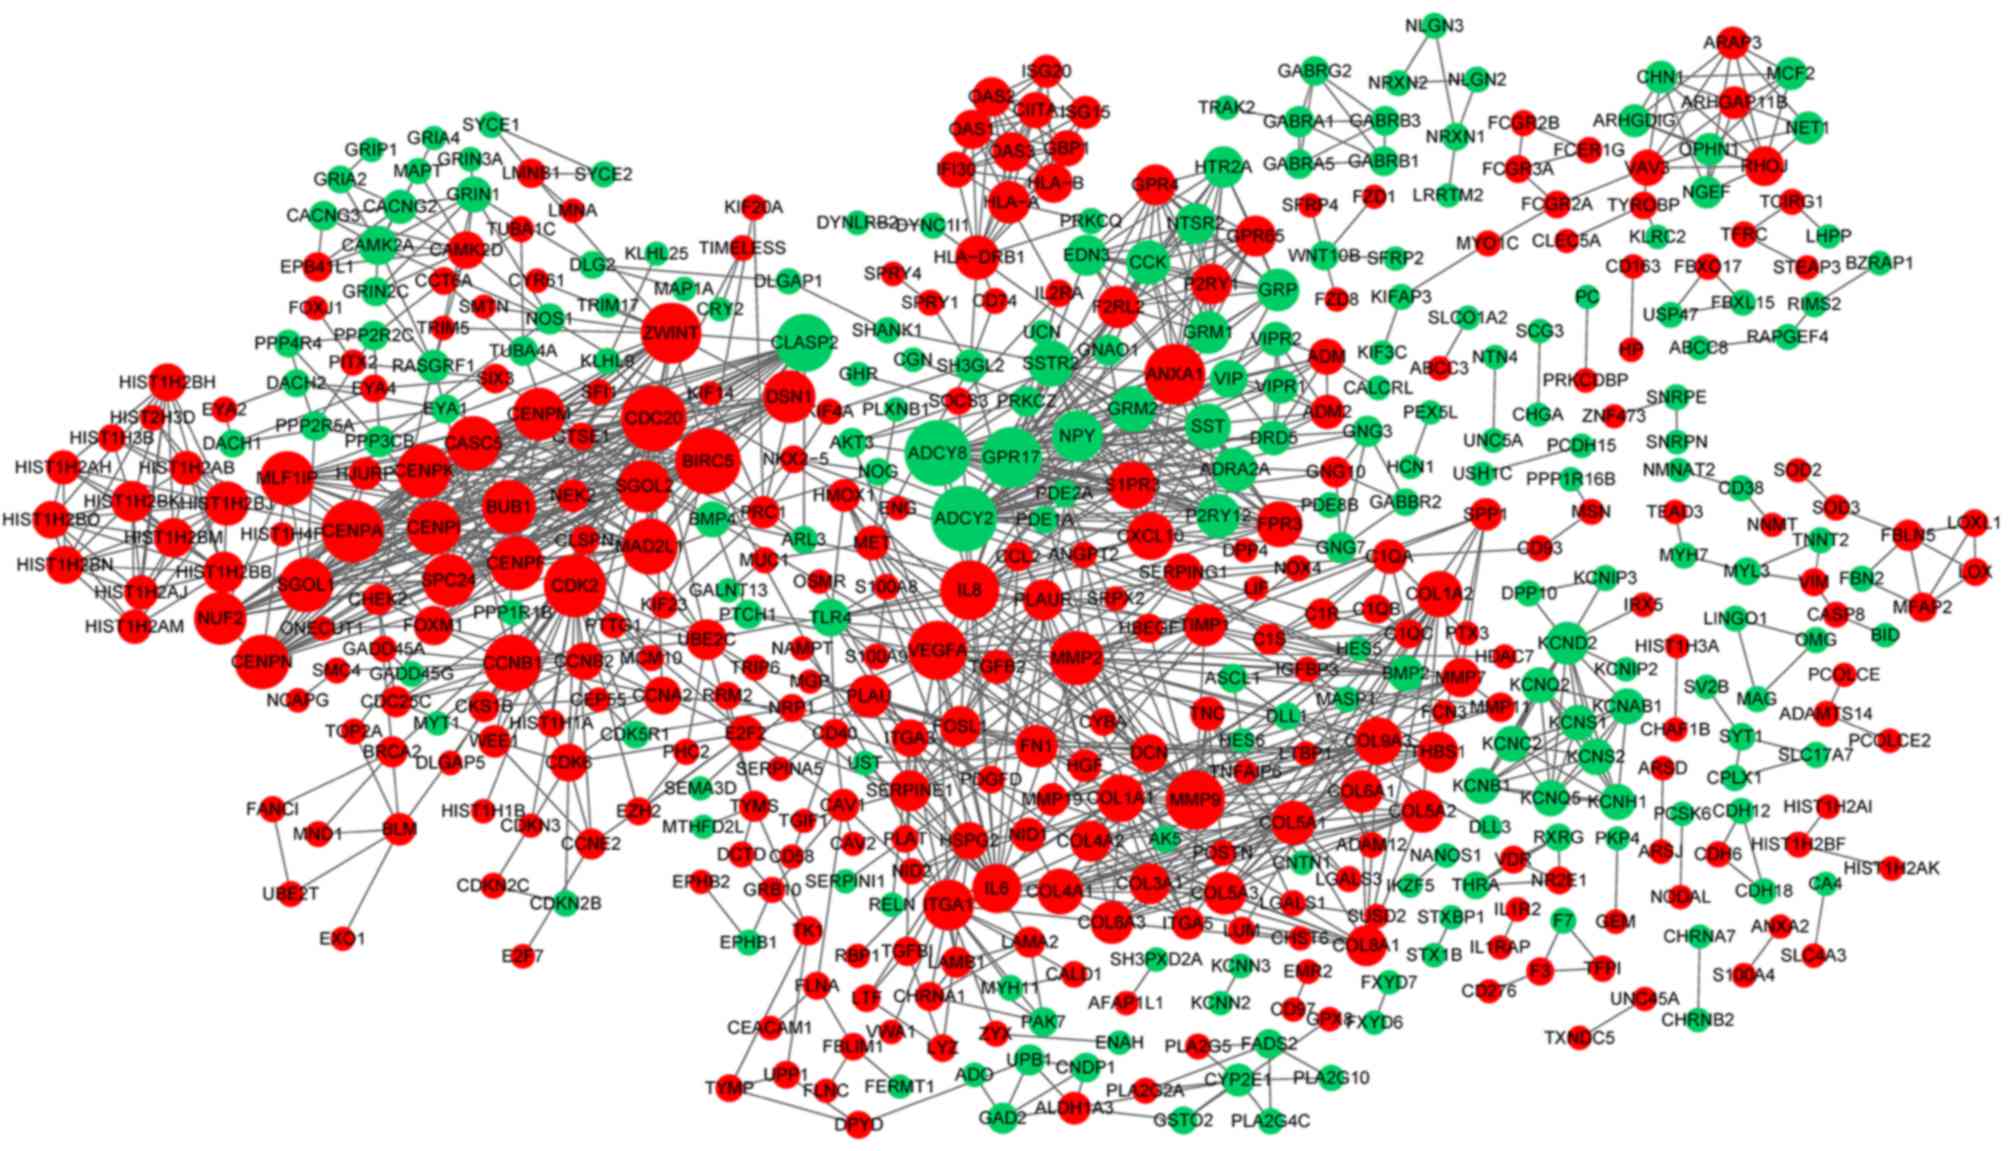
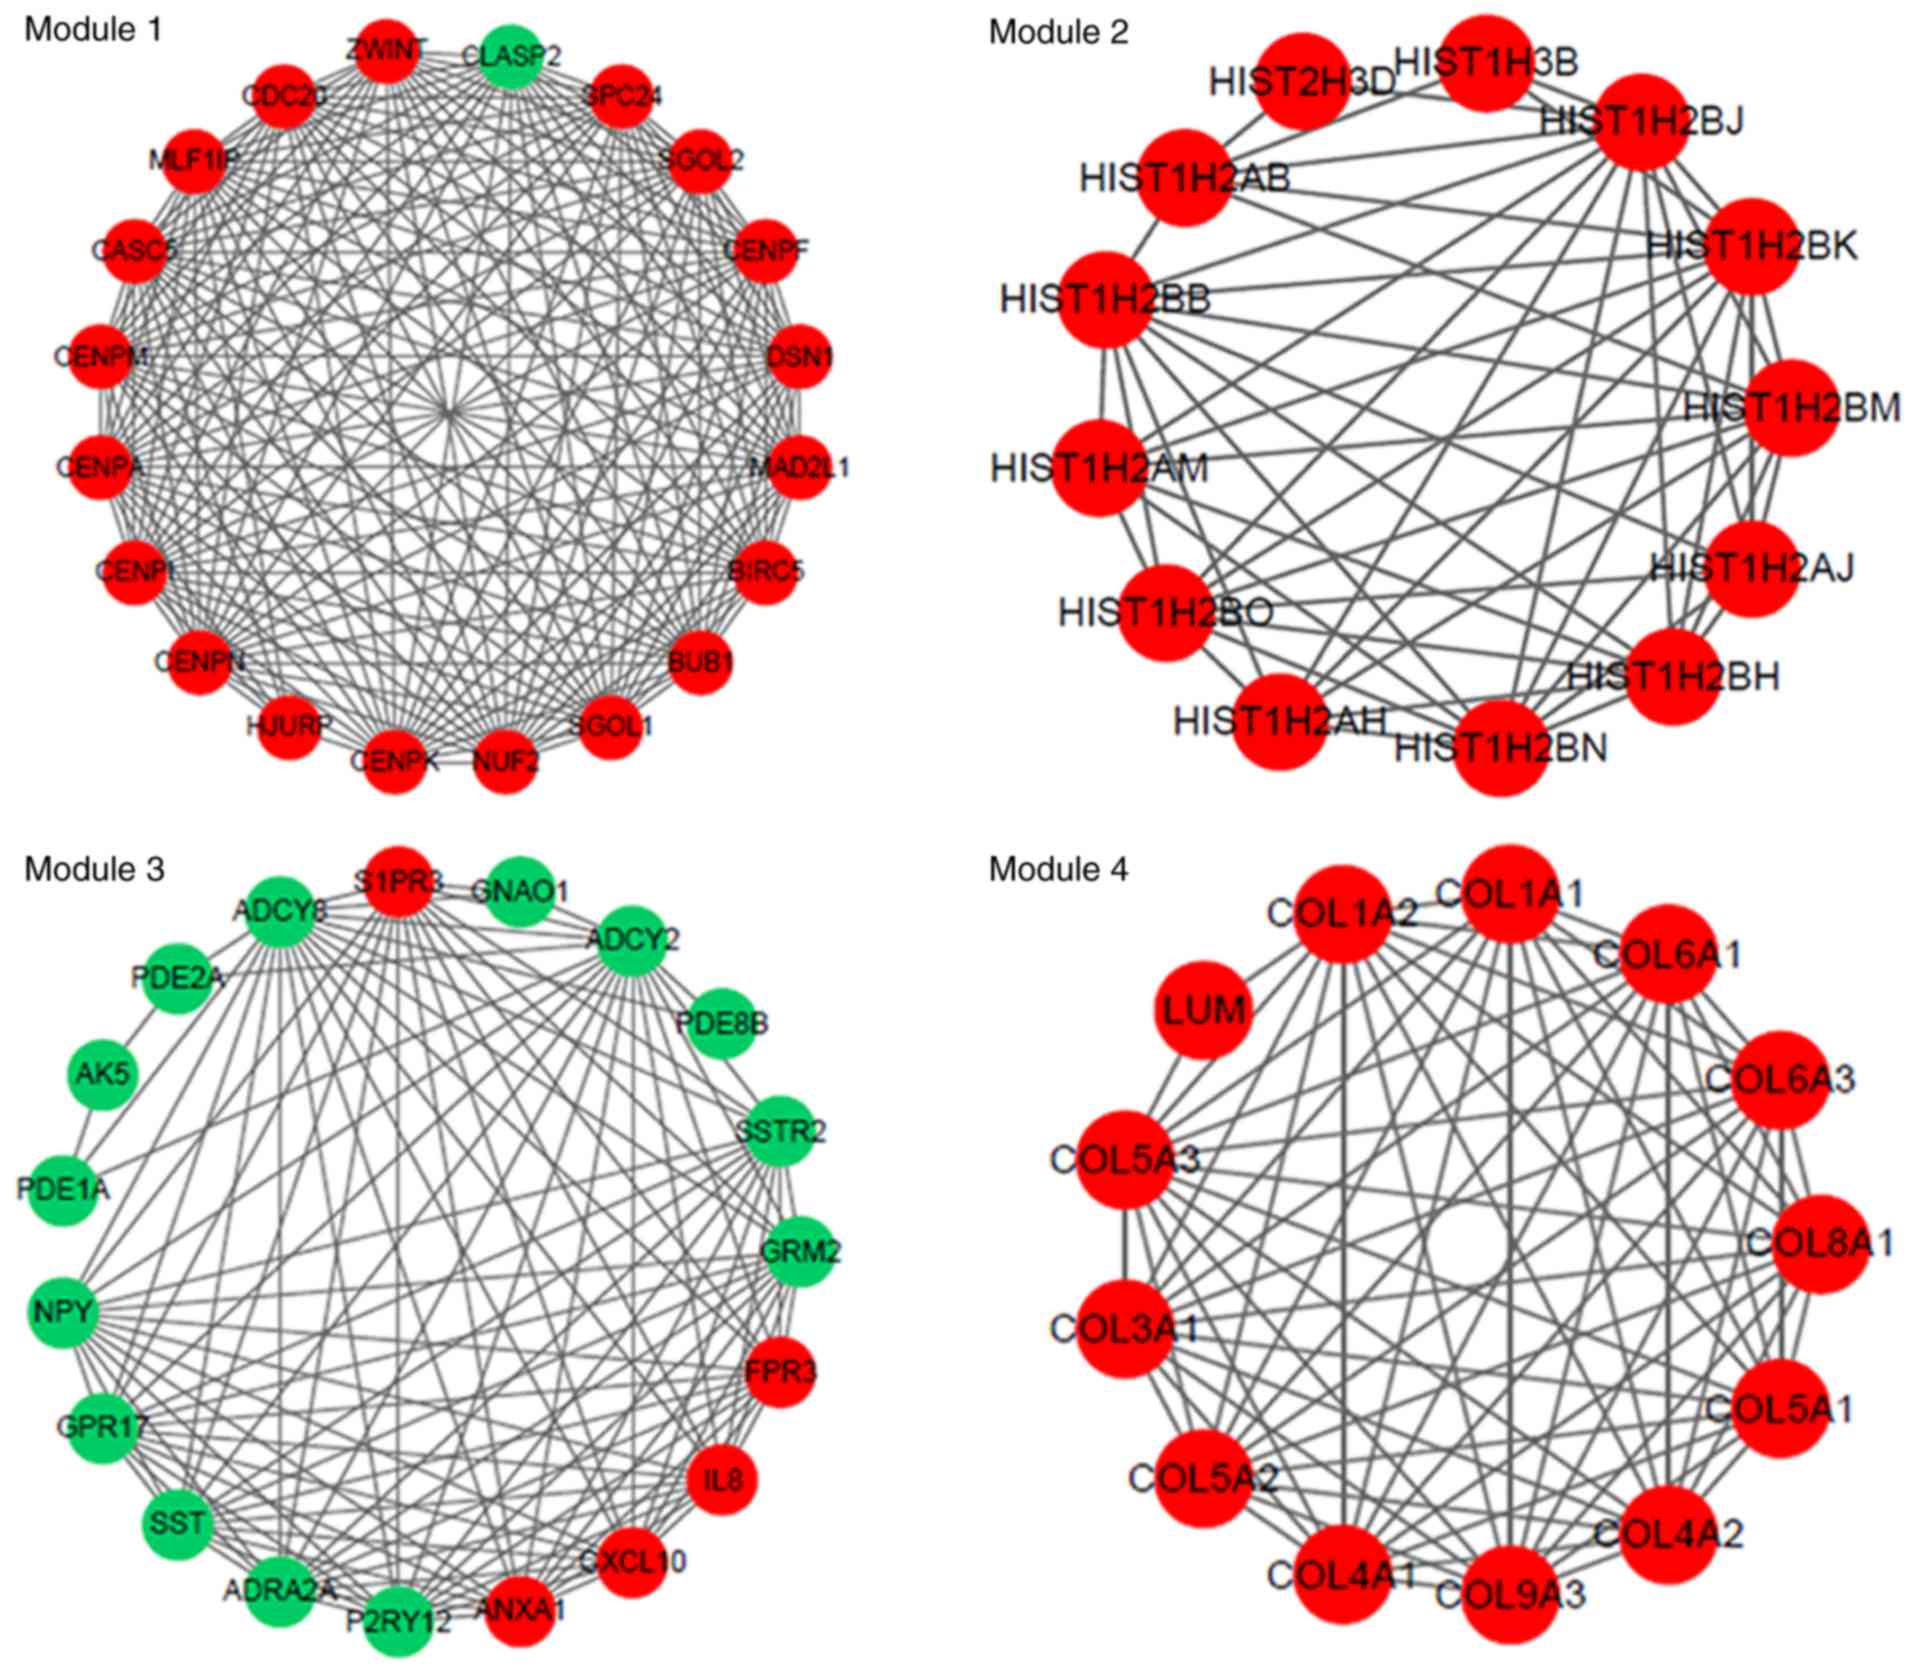
The PPI network constructed for the DEGs in the
grade IV, vs. grade II group had 489 nodes and 1,244 interactions
(Fig. 2), in which four
significant modules were identified (Fig. 3). The PPI network constructed for
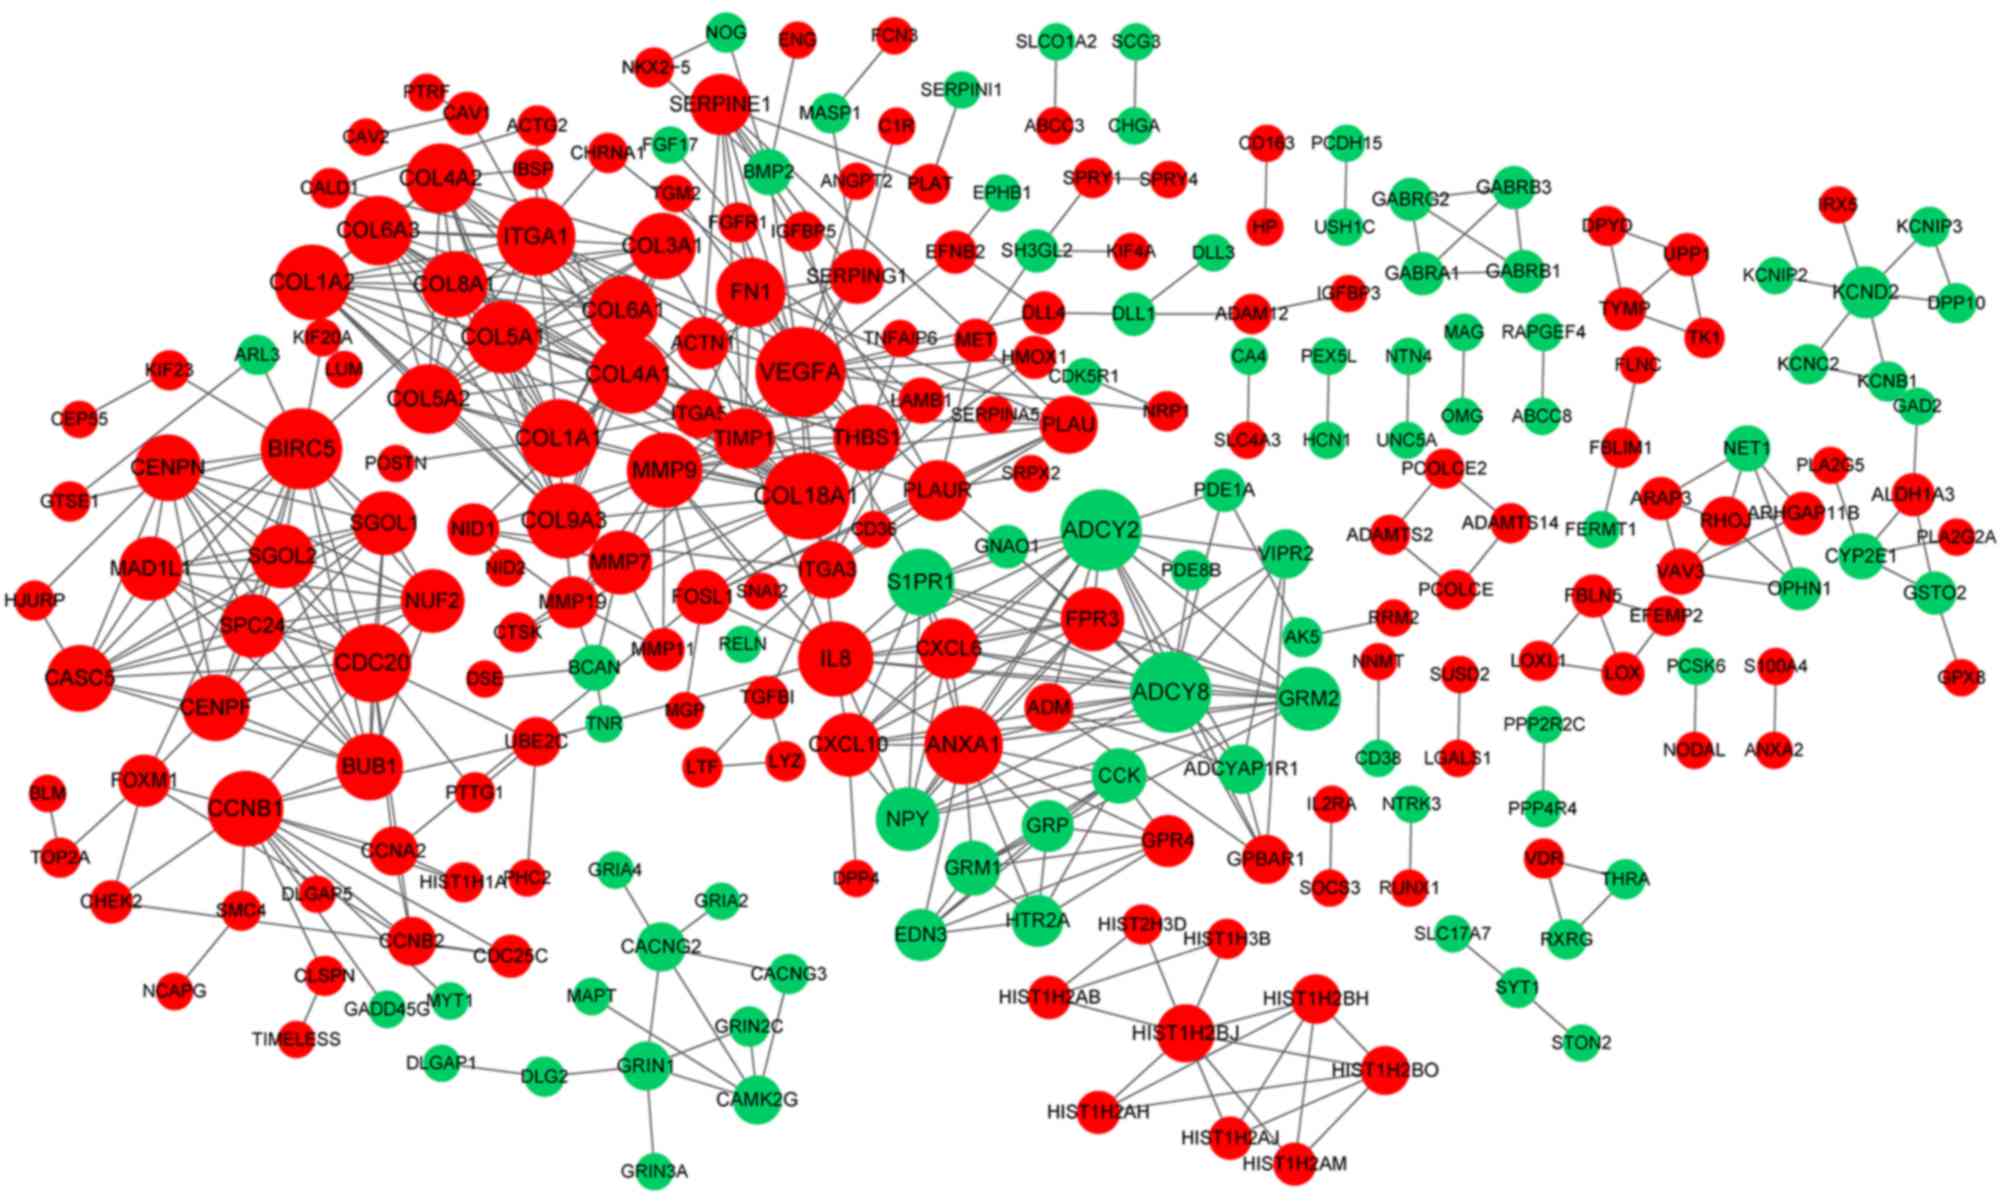
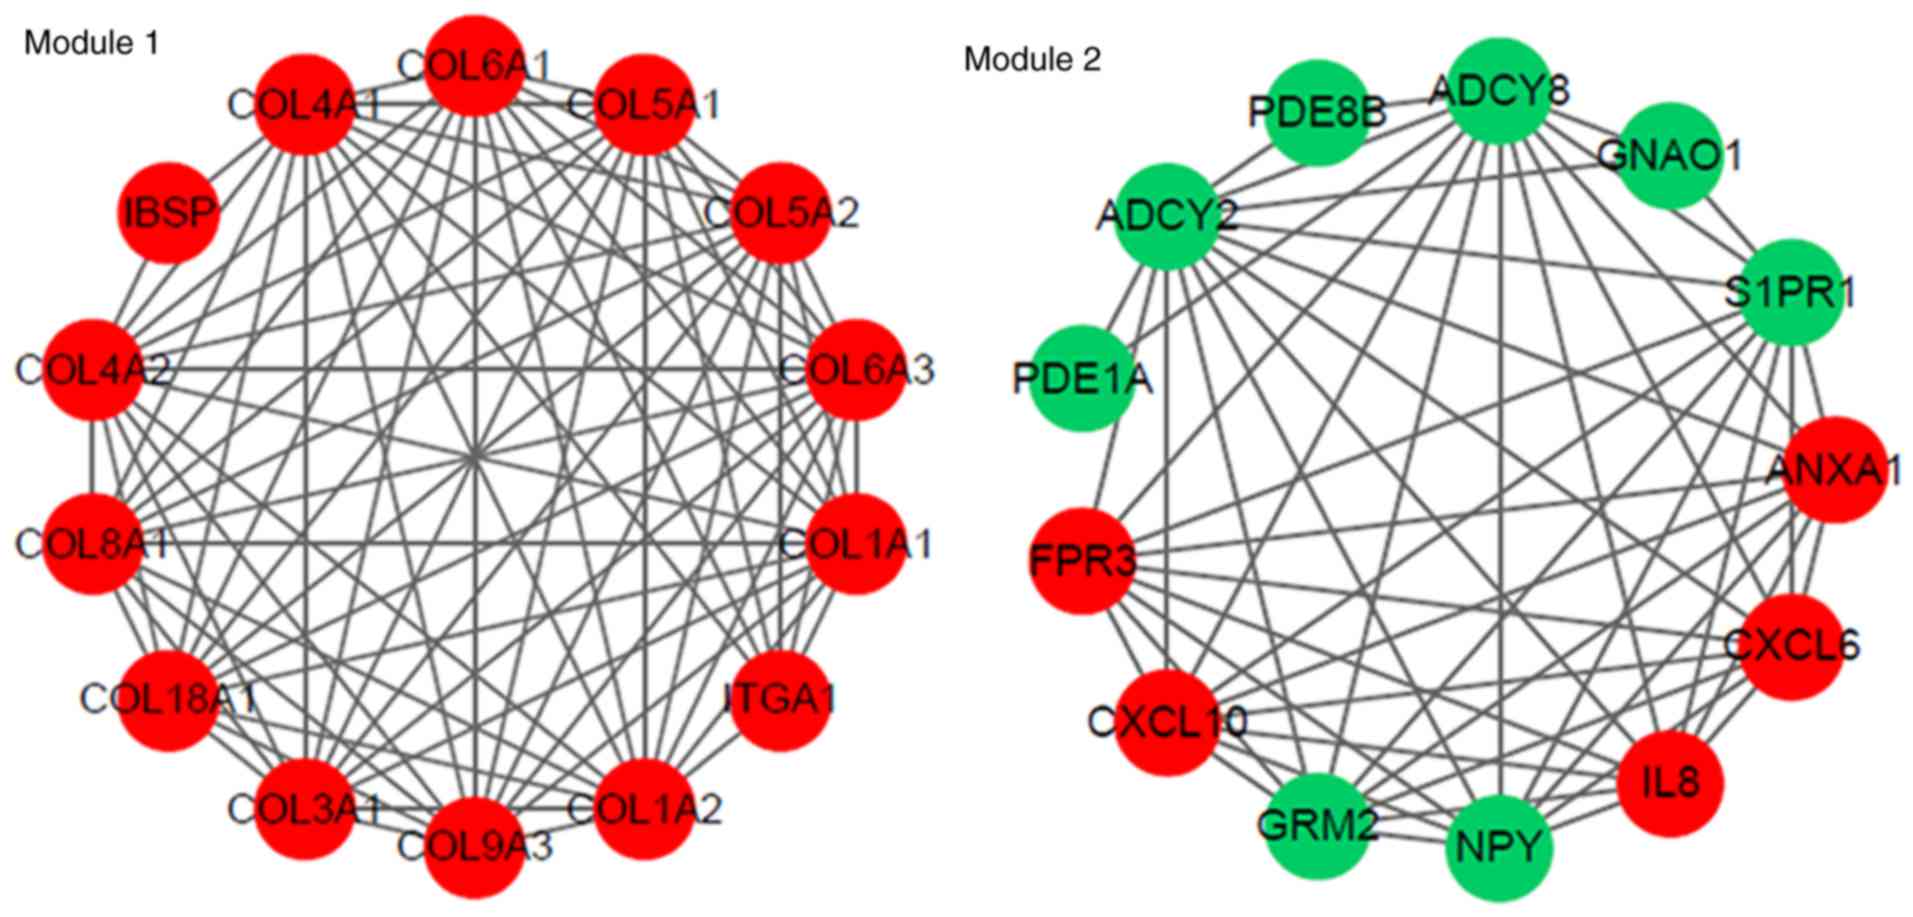
the DEGs in the grade IV, vs. grade III group had 243 nodes and 500
interactions (Fig. 4), from which
two significant modules were identified (Fig. 5). The nodes with higher degrees,
including MMP9, vascular endothelial growth factor A (VEGFA) and
annexin A1 (ANXA1), in the two networks are listed in Table IV. MMP9 interacted with VEGFA in
these two PPI networks. No PPI network was constructed for the DEGs
in grade III, vs. grade II group. The pathways enriched for the
genes involved in the modules are shown in Fig. 6.
| Table IV.Top 15 nodes with highest degrees in
the grade IV, vs. grade II protein-protein interaction
networks. |
Table IV.
Top 15 nodes with highest degrees in
the grade IV, vs. grade II protein-protein interaction
networks.
| Node | Log fold
change | Degree |
|---|
| ADCY2 | −1.98963 | 26 |
| ADCY8 | −1.17088 | 26 |
| BIRC5 | 1.359254 | 26 |
| CDC20 | 1.816218 | 26 |
| CENPA | 1.236634 | 24 |
| CDK2 | 1.239547 | 24 |
| GPR17 | −1.2297 | 23 |
| ANXA1 | 2.129899 | 23 |
| ZWINT | 1.196125 | 23 |
| IL8 | 1.634318 | 22 |
| MMP9 | 3.458891 | 22 |
| VEGFA | 2.236317 | 22 |
| CLASP2 | −1.04519 | 21 |
| CCNB1 | 1.290933 | 21 |
| MAD2L1 | 1.046268 | 20 |
| VEGFA | 2.225246 | 19 |
| COL18A1 | 1.107411 | 18 |
| BIRC5 | 1.006404 | 16 |
| ADCY8 | −1.09838 | 16 |
| ADCY2 | −1.40787 | 16 |
| CDC20 | 1.497869 | 15 |
| COL4A1 | 1.877445 | 15 |
| COL1A1 | 2.614414 | 15 |
| ANXA1 | 1.793973 | 15 |
| ITGA1 | 1.174656 | 15 |
| MMP9 | 3.32357 | 14 |
| CCNB1 | 1.097028 | 14 |
| IL8 | 1.420499 | 14 |
| COL1A2 | 2.180694 | 14 |
| COL9A3 | 1.231098 | 14 |
Identification of glioma-associated
genes and glioma marker genes
The glioma-associated genes and glioma marker genes
among the DEGs screened for each group were further analyzed using
the CTD database. In general, 81.48, 86.93 and 89.95% of the DEGs
in the grade III, vs. grade II, grade IV, vs. grade II, and grade
IV, vs. grade III comparison groups, respectively, were
glioma-associated genes. Of note, there were 10 common glioma
marker genes, including MMP9, CHI3L1, VEGFA
and S100 calcium binding protein A4 (S100A4) between the
grade IV, vs. grade II, and grade IV, vs. grade III comparison
groups (Table V).
| Table V.Numbers of glioma-associated genes
and glioma marker genes among the differentially expressed genes
screened for each group. |
Table V.
Numbers of glioma-associated genes
and glioma marker genes among the differentially expressed genes
screened for each group.
| Group | Glioma-associated
genes, n (%) | Glioma marker genes
(n) |
|---|
| Grade III vs. grade
II | 22 (81.48) | 1 |
| Grade IV vs. grade
II | 1,257 (86.93) | 24 |
| Grade IV vs. grade
III | 698 (89.95) | 13 |
Discussion
In the present study, a total of 27 (nine
upregulated and 18 downregulated), 1,446 (643 upregulated and 803
downregulated) and 776 (410 upregulated and 366 downregulated) DEGs
were identified in the grade III, vs. grade II, grade IV, vs. grade
II, and grade IV, vs. grade III comparison groups, respectively.
Venn diagram analysis showed that 20 DEGs, including five
upregulated and 15 downregulated genes, were common genes between
the grade III, vs. grade II and grade IV, vs. grade II comparison
groups. A total of 698 DEGs, including 356 upregulated and 342
downregulated genes) were common genes between the grade IV, vs.
grade II and grade IV, vs. grade III comparison groups. Four
significantly modules were identified from the PPI network
constructed for the DEGs in the grade IV, vs. grade II group, and
two significantly modules were identified from the PPI network
constructed for the DEGs in the grade IV, vs. grade III group. No
PPI network was constructed for the DEGs in the grade III, vs.
grade II group. It was found that 81.48, 86.93 and 89.95% of the
DEGs in the grade III, vs. grade II, grade IV vs. grade II, and
grade IV vs. grade III comparison groups, respectively, were
glioma-associated genes. In addition, there were 10 common glioma
marker genes, including MMP9, CHI3L1, VEGFA
and S100A4, between the grade IV, vs. grade II and grade IV,
vs. grade III comparison groups.
Inhibiting the expression of MMP9 through RNA
interference represses the malignancy of glioma cells, indicating
that it can be applied in the treatment of malignant gliomas
(25–27). MMP2 and MMP9 have
significant effects on the degradation of extracellular matrix
(ECM) and angiogenesis, and on the invasiveness of gliomas,
therefore, they can be utilized in targeted therapy of malignant
glioma (28). CHI3L1 and
MMP-9 are overexpressed in malignant gliomas, and can serve
as a predictors of survival rates in patients with the disease
(29). In addition, CHI3L1
is important in regulating local invasiveness and malignant
transformation in gliomas, therefore, CHI3L1 may be a used
as a molecular target in the treatment of gliomas (30). In patients with glioma, the serum
level of CHI3L1, which encodes a secreted glycoprotein, is
associated with tumor grade and possibly tumor burden in
glioblastoma multiforme (31).
Functional enrichment analyses have shown that MMP9 and
CHI3L1 were separately enriched in the ECM and its
structural constituent, respectively. ECM rigidity can mediate the
invasion of glioblastoma multiforme cells through actomyosin
contractility (32,33). These findings indicate that
MMP9 and CHI3L1 may function in the progression of
malignant gliomas through the ECM.
VEGF is an effective mediator of vascular
permeability, and its inhibition can decrease tumor burden and
edema production in malignant glioma (34). The growth and progression of
astrocytoma is dependent on neovascularization, and the
angiogenesis factor VEGFA may be essential for the
infiltrative and aggressive growth of astrocytomas (35). VEGFA affects the
neovascularization and invasion of glioblastoma, not only by
promoting endothelial mitogenesis and permeability, but also by
regulating MMP2 (36). In
the two PPI networks in the present study, VEGFA interacted with
MMP9, indicating that VEGFA may also affect malignant
gliomas via interacting with MMP9.
The expression of S100A4 is promoted by
neutrophil infiltration, and targeting S100A4 may be
promising in reducing antiangiogenic therapy resistance and
inhibiting the glioma malignant phenotype (37). S100A4/Mts1 has a higher
expression in high-grade glioblastomas, compared with low-grade
astrocytic tumors, indicating that it has an effect on brain tumor
progression (38). ANXA1,
targeted by forkhead box M1 (FOXM1) has a high expression in
gliomas and can function as a predictor of poor prognosis in
patients with the disease (39). A
previous study demonstrated that ANXA1 may contribute to
maintaining brain homeostasis and may be used as chemotherapeutic
target in the treatment of glioblastoma multiforme (40). Therefore, S100A4 and
ANXA1 may be involved in the development of malignant
gliomas.
In conclusion, the present study identified 27,
1,446 and 776 DEGs in the grade III, vs. grade II, grade IV, vs.
grade II, and grade IV vs. grade III comparison groups
respectively. It was found that MMP9, CHI3L1,
VEGFA, S100A4 and ANXA1 may act in the
progression of malignant gliomas. However, these findings were
obtained from bioinformatics analysis and require further
validation.
Acknowledgements
This study was financially supported by the
Heilongjiang Province Postdoctoral Scientific Research
Developmental Fund (grant no. LBH-Q14113).
References
|
1
|
Mamelak AN and Jacoby DB: Targeted
delivery of antitumoral therapy to glioma and other malignancies
with synthetic chlorotoxin (TM-601). Expert Opin Drug Deliv.
4:175–186. 2007. View Article : Google Scholar : PubMed/NCBI
|
|
2
|
Goodenberger ML and Jenkins RB: Genetics
of adult glioma. Cancer Genet. 205:613–621. 2012. View Article : Google Scholar : PubMed/NCBI
|
|
3
|
Kleihues P, Soylemezoglu F, Schäuble B,
Scheithauer BW and Burger PC: Histopathology, classification, and
grading of gliomas. Glia. 15:211–221. 1995. View Article : Google Scholar : PubMed/NCBI
|
|
4
|
Louis DN, Ohgaki H, Wiestler OD, Cavenee
WK, Burger PC, Jouvet A, Scheithauer BW and Kleihues P: The 2007
WHO classification of tumours of the central nervous system. Acta
Neuropathol. 114:97–109. 2007. View Article : Google Scholar : PubMed/NCBI
|
|
5
|
Bleeker FE, Molenaar RJ and Leenstra S:
Recent advances in the molecular understanding of glioblastoma. J
Neurooncol. 108:11–27. 2012. View Article : Google Scholar : PubMed/NCBI
|
|
6
|
Pollack IF, Finkelstein SD, Woods J,
Burnham J, Holmes EJ, Hamilton RL, Yates AJ, Boyett JM, Finlay JL
and Sposto R; Children's Cancer Group, : Expression of p53 and
prognosis in children with malignant gliomas. N Engl J Med.
346:420–427. 2002. View Article : Google Scholar : PubMed/NCBI
|
|
7
|
Hirose Y, Berger MS and Pieper RO: p53
effects both the duration of G2/M arrest and the fate of
temozolomide-treated human glioblastoma cells. Cancer Res.
61:1957–1963. 2001.PubMed/NCBI
|
|
8
|
Pyrko P, Schönthal AH, Hofman FM, Chen TC
and Lee AS: The unfolded protein response regulator GRP78/BiP as a
novel target for increasing chemosensitivity in malignant gliomas.
Cancer Res. 67:9809–9816. 2007. View Article : Google Scholar : PubMed/NCBI
|
|
9
|
Hegi ME, Diserens AC, Gorlia T, Hamou MF,
de Tribolet N, Weller M, Kros JM, Hainfellner JA, Mason W, Mariani
L, et al: MGMT gene silencing and benefit from temozolomide in
glioblastoma. N Engl J Med. 352:997–1003. 2005. View Article : Google Scholar : PubMed/NCBI
|
|
10
|
Fujiwara S, Nakagawa K, Harada H, Nagato
S, Furukawa K, Teraoka M, Seno T, Oka K, Iwata S and Ohnishi T:
Silencing hypoxia-inducible factor-1alpha inhibits cell migration
and invasion under hypoxic environment in malignant gliomas. Int J
Oncol. 30:793–802. 2007.PubMed/NCBI
|
|
11
|
Zagzag D, Lukyanov Y, Lan L, Ali MA,
Esencay M, Mendez O, Yee H, Voura EB and Newcomb EW:
Hypoxia-inducible factor 1 and VEGF upregulate CXCR4 in
glioblastoma: Implications for angiogenesis and glioma cell
invasion. Lab Invest. 86:1221–1232. 2006. View Article : Google Scholar : PubMed/NCBI
|
|
12
|
Roth W, Isenmann S, Nakamura M, Platten M,
Wick W, Kleihues P, Bähr M, Ohgaki H, Ashkenazi A and Weller M:
Soluble decoy receptor 3 is expressed by malignant gliomas and
suppresses CD95 ligand-induced apoptosis and chemotaxis. Cancer
Res. 61:2759–2765. 2001.PubMed/NCBI
|
|
13
|
Osada H, Tokunaga T, Nishi M, Hatanaka H,
Abe Y, Tsugu A, Kijima H, Yamazaki H, Ueyama Y and Nakamura M:
Overexpression of the neuropilin 1 (NRP1) gene correlated with poor
prognosis in human glioma. Anticancer Res. 24:547–552.
2004.PubMed/NCBI
|
|
14
|
Zhang L, Shen A, Ke Q, Zhao W, Yan M and
Cheng C: Spy1 is frequently overexpressed in malignant gliomas and
critically regulates the proliferation of glioma cells. J Mol
Neurosci. 47:485–494. 2012. View Article : Google Scholar : PubMed/NCBI
|
|
15
|
Guan X, Vengoechea J, Zheng S, Sloan AE,
Chen Y, Brat DJ, O'Neill BP, de Groot J, Yust-Katz S, Yung WK, et
al: Molecular subtypes of glioblastoma are relevant to lower grade
glioma. PLoS One. 9:e912162014. View Article : Google Scholar : PubMed/NCBI
|
|
16
|
Ritchie ME, Phipson B, Wu D, Hu Y, Law CW,
Shi W and Smyth GK: Limma powers differential expression analyses
for RNA-sequencing and microarray studies. Nucleic Acids Res.
43:e472015. View Article : Google Scholar : PubMed/NCBI
|
|
17
|
Cai H, Chen H, Yi T, Daimon CM, Boyle JP,
Peers C, Maudsley S and Martin B: VennPlex-a novel Venn diagram
program for comparing and visualizing datasets with differentially
regulated datapoints. PLoS One. 8:e533882013. View Article : Google Scholar : PubMed/NCBI
|
|
18
|
Harris MA, Clark J, Ireland A, Lomax J,
Ashburner M, Foulger R, Eilbeck K, Lewis S, Marshall B, Mungall C,
et al: The Gene Ontology (GO) database and informatics resource.
Nucleic Acids Res. 32(Database Issue): D258–D261. 2004.PubMed/NCBI
|
|
19
|
Kanehisa M, Goto S, Kawashima S, Okuno Y
and Hattori M: The KEGG resource for deciphering the genome.
Nucleic Acids Res. 32(Database Issue): D277–D280. 2004. View Article : Google Scholar : PubMed/NCBI
|
|
20
|
Jensen LJ, Kuhn M, Stark M, Chaffron S,
Creevey C, Muller J, Doerks T, Julien P, Roth A, Simonovic M, et
al: STRING 8-a global view on proteins and their functional
interactions in 630 organisms. Nucleic Acids Res. 37(Database
Issue): D412–D416. 2009. View Article : Google Scholar : PubMed/NCBI
|
|
21
|
Szklarczyk D, Franceschini A, Wyder S,
Forslund K, Heller D, Huerta-Cepas J, Simonovic M, Roth A, Santos
A, Tsafou KP, et al: STRING v10: Protein-protein interaction
networks, integrated over the tree of life. Nucleic Acids Res.
43(Database Issue): D447–D452. 2014.PubMed/NCBI
|
|
22
|
Saito R, Smoot ME, Ono K, Ruscheinski J,
Wang PL, Lotia S, Pico AR, Bader GD and Ideker T: A travel guide to
Cytoscape plugins. Nat Methods. 9:1069–1076. 2012. View Article : Google Scholar : PubMed/NCBI
|
|
23
|
Nepusz T, Yu H and Paccanaro A: Detecting
overlapping protein complexes in protein-protein interaction
networks. Nat Methods. 9:471–472. 2012. View Article : Google Scholar : PubMed/NCBI
|
|
24
|
Davis AP, Grondin CJ, Lennon-Hopkins K,
Saraceni-Richards C, Sciaky D, King BL, Wiegers TC and Mattingly
CJ: The Comparative Toxicogenomics Database's 10th year
anniversary: Update 2015. Nucleic Acids Res. 43(Database Issue):
D914–D920. 2015. View Article : Google Scholar : PubMed/NCBI
|
|
25
|
Lakka SS, Gondi CS, Yanamandra N, Olivero
WC, Dinh DH, Gujrati M and Rao JS: Inhibition of cathepsin B and
MMP-9 gene expression in glioblastoma cell line via RNA
interference reduces tumor cell invasion, tumor growth and
angiogenesis. Oncogene. 23:4681–4689. 2004. View Article : Google Scholar : PubMed/NCBI
|
|
26
|
Sun C, Wang Q, Zhou H, Yu S, Simard AR,
Kang C, Li Y, Kong Y, An T, Wen Y, et al: Antisense MMP-9 RNA
inhibits malignant glioma cell growth in vitro and in vivo.
Neurosci Bull. 29:83–93. 2013. View Article : Google Scholar : PubMed/NCBI
|
|
27
|
Gondi CS, Lakka SS, Dinh DH, Olivero WC,
Gujrati M and Rao JS: Downregulation of uPA, uPAR and MMP-9 using
small, interfering, hairpin RNA (siRNA) inhibits glioma cell
invasion, angiogenesis and tumor growth. Neuron Glia Biol.
1:165–176. 2004. View Article : Google Scholar : PubMed/NCBI
|
|
28
|
Wang M, Wang T, Liu S, Yoshida D and
Teramoto A: The expression of matrix metalloproteinase-2 and-9 in
human gliomas of different pathological grades. Brain Tumor Pathol.
20:65–72. 2003. View Article : Google Scholar : PubMed/NCBI
|
|
29
|
Hormigo A, Gu B, Karimi S, Riedel E,
Panageas KS, Edgar MA, Tanwar MK, Rao JS, Fleisher M, DeAngelis LM
and Holland EC: YKL-40 and matrix metalloproteinase-9 as potential
serum biomarkers for patients with high-grade gliomas. Clin Cancer
Res. 12:5698–5704. 2006. View Article : Google Scholar : PubMed/NCBI
|
|
30
|
Ku BM, Lee YK, Ryu J, Jeong JY, Choi J,
Eun KM, Shin HY, Kim DG, Hwang EM, Yoo JC, et al: CHI3L1 (YKL-40)
is expressed in human gliomas and regulates the invasion, growth
and survival of glioma cells. Int J Cancer. 128:1316–1326. 2011.
View Article : Google Scholar : PubMed/NCBI
|
|
31
|
Tanwar MK, Gilbert MR and Holland EC: Gene
expression microarray analysis reveals YKL-40 to be a potential
serum marker for malignant character in human glioma. Cancer Res.
62:4364–4368. 2002.PubMed/NCBI
|
|
32
|
Ulrich TA, de Juan Pardo EM and Kumar S:
The mechanical rigidity of the extracellular matrix regulates the
structure, motility, and proliferation of glioma cells. Cancer Res.
69:4167–4174. 2009. View Article : Google Scholar : PubMed/NCBI
|
|
33
|
Bellail AC, Hunter SB, Brat DJ, Tan C and
Van Meir EG: Microregional extracellular matrix heterogeneity in
brain modulates glioma cell invasion. Int J Biochem Cell Biol.
36:1046–1069. 2004. View Article : Google Scholar : PubMed/NCBI
|
|
34
|
Carlson MR, Pope WB, Horvath S, Braunstein
JG, Nghiemphu P, Tso CL, Mellinghoff I, Lai A, Liau LM, Mischel PS,
et al: Relationship between survival and edema in malignant
gliomas: Role of vascular endothelial growth factor and neuronal
pentraxin 2. Clin Cancer Res. 13:2592–2598. 2007. View Article : Google Scholar : PubMed/NCBI
|
|
35
|
Johansson M, Brännström T, Bergenheim AT
and Henriksson R: Spatial expression of VEGF-A in human glioma. J
Neurooncol. 59:1–6. 2002. View Article : Google Scholar : PubMed/NCBI
|
|
36
|
Gong J, Zhu S, Zhang Y and Wang J:
Interplay of VEGFa and MMP2 regulates invasion of glioblastoma.
Tumor Biol. 35:11879–11885. 2014. View Article : Google Scholar
|
|
37
|
Liang J, Piao Y, Holmes L, Fuller GN,
Henry V, Tiao N and de Groot JF: Neutrophils promote the malignant
glioma phenotype through S100A4. Clin Cancer Res. 20:187–198. 2014.
View Article : Google Scholar : PubMed/NCBI
|
|
38
|
Takenaga K, Nygren J, Zelenina M, Ohira M,
Iuchi T, Lukanidin E, Sjöquist M and Kozlova EN: Modified
expression of Mts1/S100A4 protein in C6 glioma cells or surrounding
astrocytes affects migration of tumor cells in vitro and in vivo.
Neurobiol Dis. 25:455–463. 2007. View Article : Google Scholar : PubMed/NCBI
|
|
39
|
Cheng SX, Tu Y and Zhang S: FoxM1 promotes
glioma cells progression by up-regulating Anxa1 expression. PLoS
One. 8:e723762013. View Article : Google Scholar : PubMed/NCBI
|
|
40
|
Festa M, Caputo M, Cipolla C, D'Acunto C,
Rossi A, Tecce M and Capasso A: The involvement of xanthohumol in
the expression of annexin in human malignant glioblastoma cells.
Open Biochem J. 7:1–10. 2013. View Article : Google Scholar : PubMed/NCBI
|