Introduction
Insulin resistance (IR) is an important part of the
pathogenesis of type 2 diabetes mellitus (T2DM). MicroRNA affects
the secretion of insulin and protein expression of insulin target
organs as a regulatory factor before protein transcription
(1). Several studies have reported
changes in MicroRNAs (miRNAs) in human or animal DM models
(2), and recommended plasma miRNAs
as the underlying biomarker of T2DM (3).
Astragalus polysaccharides (APS, the main
bioactive ingredient of Astragalus) is a macromolecular
polysaccharide extracted from the dry root of traditional Chinese
medicine Astragalus, which has a good therapeutic effect on
diabetes (4). Most previous
studies on the action mechanism of APS for DM focused on insulin
sensitivity, insulin secretion, glucolipid metabolism in the liver,
reduced intestinal absorption of glucose, and modulation of gut
microbiota, antioxidant and anti-Inflammatory activities (5–7).
However, few studies have reported the mechanism of APS at RNA
transcriptional level. Whether the role of APS in improving IR is
associated with the regulation of liver microRNAs and its
underlying mechanism have not been reported. This study used
Goto-Kakizaki (GK) rats to establish a T2DM rat model, The aim of
the present study was to see whether APS could induce miRNA change
in the liver of diabetic rats, and how this change affects the
downstream genes in Goto Kakizaki (GK) rats, APS-treated rats and
Wistar rats.
Materials and methods
Experimental animals
Breeds and strains: A total of 20
specific-pathogen-free (SPF) male GK rats (aged 10 weeks) and 10
SPF male Wistar rats (aged 4 weeks) were purchased from the
Shanghai Experimental Animal Center of Chinese Academy of
Sciences/Shanghai Laboratory Animal Center [Production license:
SCXK (Hu) 2007-0005].
SPF-level barrier system rats were fed in the
laboratory at 23±1°C and humidity 50–70%. Moreover, the light was
150–200 lx, and bright and dark phases were alternated every 12 h
(6:00 a.m. to 6:00 p.m.). The noise was less than 50 dB, and the
use license was SYXK (Zhejiang) 2008–0115.
Drinking water: Running water was filtered,
sterilized, and placed in an autoclaved drinking water bottle. The
rats had free access to drinking water. Feedstuff: The rats were
fed pellets irradiated with Co60 for sterilization. Feeding style:
The rats had free access to food and drinks, and plenty of
feedstuff and water were kept in the cages. Each cage contained two
to three rats. Each rat was weighed and marked with a number before
starting the experiments.
The animal experiment procedures were conducted
according to guidelines of the National Institutes of Health (NIH),
and approved by the Ethics Committee of the Experimental Animal
Centre of Zhejiang Chinese Medical University (Approval no. SYXK
(ZHE) 2008–0115).
Reagents and instruments
The reagents included APS (Sigma-Aldrich; Merck
KGaA, Darmstadt, Germany), TRIzol (Invitrogen; Thermo Fisher
Scientific, Inc., Waltham, MA, USA), blood glucose reagent strips
(Roche Diagnostics, Basel, Switzerland), insulin enzyme-linked
immunosorbent assay (ELISA) kit (R&D Systems, Inc.,
Minneapolis, MN, USA), urethane (CAS no. 51-79-6; Shanghai Shanpu
Co., Ltd., Shanghai, China), reverse transcription kit (Thermo
Fisher Scientific, Inc.), miScript II reverse transcription (RT)
kit (Qiagen GmbH, Hilden, Germany), miRcute miRNA quantitative
polymerase chain reaction (qPCR) detection kit (SYBR-Green)
(Tiangen Biotech Co., Ltd., Beijing, China), whole-protein
extraction kit, bicinchoninic acid (BCA) protein quantification kit
(KGI Biotechnology Development Co., Ltd., Nanjing, China),
polyvinylidene difluoride (PVDF) membrane (EMD Millipore,
Billerica, MA, USA), anti-glucose-regulated protein (GRP)78
antibody, anti-DNA-damage inducible transcript 3 (GADD153/CHOP)
antibody, anti-c-Jun N-terminal kinase 1 (JNK1) antibody,
anti-phosphorylation-c-Jun N-terminal kinase 1 (pJNK1) antibody,
anti-caspase-12 antibody, anti-glyceraldehyde 3-phosphate
dehydrogenase (GAPDH) antibody (Abcam, Cambridge, UK), bovine serum
albumin, sodium dodecyl sulfate-polyacrylamide gel electrophoresis
(SDS-PAGE) gel kit, horseradish peroxidase (HRP)-labeled goat
anti-mouse immunoglobulin G (IgG), HRP-labeled goat anti-rabbit IgG
(Beijing Zhongshan Jinqiao Biological Technology Co., Ltd.,
Beijing, China), prestained marker (Thermo Fisher Scientific,
Inc.), and enhanced chemiluminescence (ECL) developer (Thermo
Fisher Scientific, Inc.). Moreover, other reagents were domestic
analytical reagents. The instruments included Accu-Chek Advantage
blood glucose meter (Roche Diagnostics GmbH, Mannheim, Germany),
AG204-electronic analytical balance (Mettler-Toledo. Instruments
Co., Ltd., Shanghai, China), VarioScan Flash Multi-functional
Microplate Reader (Thermo Fisher Scientific, Inc.), low-temperature
centrifuge (Eppendorf, Hamburg, Germany), quantitative PCR
instrument (Applied Biosystems; Thermo Fisher Scientific, Inc.),
and gel imaging system (Bio-Rad Laboratories, Inc., Hercules, CA,
USA).
Animal screening and grouping
administration
20 SPF male GK rats (aged 10 weeks) and 10 Wistar
male rats (aged 4 weeks) were selected and fed for 6 week before
starting the experiments. The animals had free access to tap water.
GK rats were fed high-fat diet containing 10% fat, whereas Wistar
rats were fed ordinary feed. The rats were fasted food, but not
water, every other night for 12 h. The weight was measured, and the
tail vein blood was extracted. Twenty GK rats were randomly
assigned into two groups: Model and APS groups with 10 rats in each
group. Ten normal Wistar rats were selected as the control group.
The APS group was given APS (500 mg/kg/day) intragastrically,
whereas the rats in the model and control groups were given the
same volume of normal saline, once daily for 8 weeks.
Area under the curve of blood
glucose
During the experimental period, the body weights
were measured at weekly intervals, and all animals received Random
plasma glucose tests before administered and at the 2nd, 4th, 6th
and 8th w after treatment. Blood samples were obtained from tail
vessels, blood glucose values were determined by glucose oxidase
method (Toecho Super II, Kagawa, Japan).
Determination of fasting serum insulin
and calculation of HOMA-IR index
Fasting serum insulin was determined using ELISA kit
for insulin following the manufacturer's protocol. Using an ELISA
reader, the absorbance of the reaction product was read at 450 nm.
IR was assessed using the homeostasis model assessment index for IR
(HOMA-IR index) using the formula reported by Matthews et al
(8): HOMA-IR index=[fasting
glucose (mmol/l) × fasting insulin (µU/ml)]/22.5).
Measurement of blood lipids
After the last administration, the rats were fasted,
but with free access to water, for 12 h. They were anesthetized by
injecting 20% urethane (1.2 g/kg) intraperitoneally, and 5 ml of
blood was extracted from the abdominal aorta. All rats executed by
the way of cervical spine dislocation. Of this, 1 ml was placed in
a centrifuge tube without anticoagulant, stored at 4°C for 10 min,
and centrifuged at 3,000 × g for 15 min. The serum was separated,
and the levels of TC, TG, HDL-c, and LDL-c were measured using an
automatic biochemical analyzer.
Measurement of the TNF-α level in the
serum of rats using the ELISA
The experiments were performed according to the
TNF-α ELISA kit instructions. The absorbance value was measured at
425 nm, and the TNF-α levels in the serum of each group of rats
were measured using a standard curve.
Hematoxylin and eosin (H&E)
staining of the liver
For histological analysis, the 10% buffered formalin
fixed liver tissues was embedded in paraffin wax, sectioned (6 µm)
and stained with H&E.
MicroRNA gene chip screening: MicroRNA
microarray analysis
RNA was isolated from the liver in three groups rats
using TRIzol, microRNA gene chip screening was performed in the
model and APS groups, and differentially expressed microRNA was
detected. The equipment for MicroRNA microarray experiments and
analysis were provided by Shanghai Bohao Biotechnology Co., Ltd.
(Shanghai, China). The chip used for the project was Agilent Rat
miRNA (8×15 K) V19.0 chip (design ID: 46066). The miRNA molecules
in the RNA of the experimental samples were fluorescently labeled
using the Agilent miRNA microarray kit according to the standard
operating procedure for labeling. The samples were hybridized
according to the standard operating procedures provided with the
Agilent miRNA chip and kit. The slices were washed in a wash tank
after hybridization. The results of the chip were scanned using the
Agilent Microarray Scanner. Data were read using the Feature
Extraction software 10.7 and normalized using the Gene Spring
Software 11.0. The used algorithm was Quantile.
Construction of luciferase reporter
plasmid and analysis of luciferase activity
To examine whether miR-203a-3p regulated the
expression of GRP78, a predicted target of miR-203a-3p, the dual
luciferase psiCheck2 reporter plasmid (Promega Corporation,
Madison, WI, USA), was used to generate the reporter plasmid
harboring GRP78 3′-UTR. Briefly, a 387-bp fragment of GRP78 3′-UTR
containing the putative miR-203a-3p binding site was amplified from
rat genomic DNA by PCR, using Xho1 and Not1 primers
(left Xho1 primer: ctc gag CGG AGC AGA GCC ATG GGC ACG TCT
TCA G, right Not1 primer: gcg gcc gcC CTA TTG CTG GAT GCT
TTC CAA GTC CC). The PCR product was digested with Xho1 and
Not1, followed by insertion into the multiple cloning region
located at the 3′-UTR of the synthetic Renilla luciferase gene
within the psiCheck2 plasmid. The psiCheck2 plasmid also contained
a synthetic firefly luciferase gene that serves as the transfection
control (9).
The 293T cells were co-transfected with the
psiCheck2 vector containing GRP78 3′-UTR and miR-203a-3p mimic
using Lipofectamine® 2000 (Invitrogen; Thermo Fisher
Scientific, Inc.), and the co-transfection with non-targeting
negative control RNA was performed as control. The cells were
harvested 24 h after transfection, and luciferase activity was
measured with a dual luciferase reporter assay kit (Thermo Fisher
Scientific, Inc.) on a luminometer (Lumat LB9507), as we described
previously (9).
Reverse transcriptase-quantitative
polymerase chain reaction (RT-qPCR)
miRNA levels in the liver and the underlying mRNA
level of the target genes belonging to miR-203a-3p were determined
by RT-qPCR. One gram out of overall RNA elicited by Trizol
(Invitrogen, Shanghai, China) was transcribed reversely by M-MLV
reverse transcriptase along with oligo-dT for mRNAs and a
particular stem-loop primer as GTC GTA TCC AGT GCA GGG TCC GAG GTA
TTC GCA CTG GAT ACG ACC TAG TGG T(5′-3′), for a miRNA.
The performance of PCR with real-time quantity was
acted in a Rotor-Gene 3,000 real-time detection systems of DNA
(Corbett Research Pty Ltd., Sydney, Australia) by SYBR-Green
(Qiagen, Shanghai, China) using the primers as shown in Table I. All samples were analyzed in
duplicate, containing no-template controls. The normalized curve
method was used to determine the linked expression level of GRP78
and miRNAs, which was standardized to GAPDH and U6,
respectively.
 | Table I.Primers for quantitative polymerase
chain reaction. |
Table I.
Primers for quantitative polymerase
chain reaction.
| Gene name | Forward primer
(5′-3′) | Reverse primer
(5′-3′) |
|---|
| miR-203a |
GTGCAGGGTCCGAGGTATT |
GCCGCGTGAAATGTTTAGGACCAC |
| GRP78 |
GGAGTGGGTCAATTCTGTTGTCA |
CCCGGCACTAACGTCATTC |
| U6 |
CTCGCTTCGGCAGCACA |
AACGCTTCACGAATTTGCGT |
| GAPDH |
AACGACCCCTTCATTGACCTC |
CCTTGACTGTGCCGTTGAACT |
Establishment of the IR cells
model
HepG2 cell lines were preserved in Typical culture
preservation commission cell bank (Chinese Academy of Sciences,
Shanghai, China). Hepatoblastoma HepG2 cells were cultured in DMEM
medium (HyClone, Beijing, China) supplemented with 10% fetal bovine
serum (HyClone) and maintained at 37°C in a humidified incubator
with 5% CO2. 24 h after plating, serum was removed and
cells were stimulated with insulin (Gibco; Thermo Fisher
Scientific, Inc.) at 100 nm for 48 h. IR model were equally
randomized to two groups: A APS-treatment group, and a model group.
APS group were treated with APS (10 µm/ml), for 48 h. And normal
HepG2 cells were set as the control group.
HepG2 cells transfection
The HepG2 cells were cultured according to the
method described above. The specific mimic or inhibitor RNA was
transfected to overexpress or knock down miR-203a-3p expression.
For transfection experiments, HepG2 cells were seeded at a density
of 2×9-104 cells/cm2 in serum-free DMEM, with
addition of the transfection agent and RNAs. MiR-203a-3p mimics (40
nM) or inhibitor (40 nM) transfected to HepG2 cells for 48 h,
respectively. Then stimulated with insulin (100 nM) for 12 h,
negative control oligo (NC) as the negative control. Stem-loop
primer: Negative control oligo: 5′-UUCUCCGAACGUGUCACGUTT-3′;
miR-203a-3p mimics: 5-GUG AAA UGU UUA GGA CCA CUA G-3; miR-203a-3p
inhibitor: 5′-CUAGUGGUCCUAAACAUUUCAC-3′.
Cells were divided into six groups: Control group
(normal HepG2 cells), IR+NC group (IR model transfected with
negative control), IR+miR203a mimics group (IR model transfected
with miR-203a-3p mimics), IR+miR203 inhibitor group (IR model
transfected with miR-203a-3p inhibitor), IR+miR203 mimics + APS
group (IR model transfected with miR-203a-3p mimics) and IR+miR203
inhibitor + APS group (IR model transfected with miR-203a-3p
inhibitor). After 24 h transfection, the medium was changed and the
HepG2 cells were incubated with fresh serum-containing medium for
48 h (Both of the two APS groups treated with APS 10 um/ml). And
then cells were harvested for protein analysis.
Detection of the protein expressions
of GRP78, CHOP, JNK1, pJNK1 and caspase-12 using Western blot
The total protein of the liver tissue was extracted
using the BCA protein extraction method. The same amount of total
protein was used to add the loading buffer for denaturation for 3
min. After SDS-PAGE electrophoresis, the proteins were
electrotransferred onto the PVDF membrane. After blocking, the
proteins were incubated with the corresponding primary antibody
(GRP78, CHOP, JNK1, pJNK1 and caspase-12, diluted 1:1,000) at 4°C
overnight, respectively. Then, they were incubated with the
secondary antibody (diluted 1:7,000) at room temperature for 2 h.
After that, ECL was performed, and images were taken using the gel
imaging system. Finally, the gray scale scanning analysis was
performed for the results.
Statistical analysis
miRNA expression data were compared between model
and APS groups by independent-sample t-test. All data are expressed
as mean ± standard deviation and analyzed by one-way ANOVA followed
by LSD when Equal Variances assumed and Dunnett's-T3 when Equal
Variances not assumed. Differences between groups were compared by
Fisher's least significant difference (LSD). All statistical
analyses were performed by using SAS 9.0 (SAS Institute, Inc.,
Cary, NC, USA). Two-tailed P<0.05 showed statistical
significance. Statistical comparisons were performed on GraphPad
Prism 6.02.
Results
Effects of APS on body weight (BW),
area under the curve (AUC) of plasma blood glucose, HOMA-IR index,
serum lipid levels and TNF-α level
The mean BW in GK rats was significantly increased
as compared with that in Wistar rats of the matched age (Fig. 1A). BW of the rats in APS group was
reduced by 5.6% as compared with that in model group. Area under
the curve (AUC) of PBG in model group was elevated by 164% as
compared with that in control groups (Fig. 1B). In contrast, AUC of PBG in APS
group was reduced significantly by 14% as compared with that in
model rats (Fig. 1B).
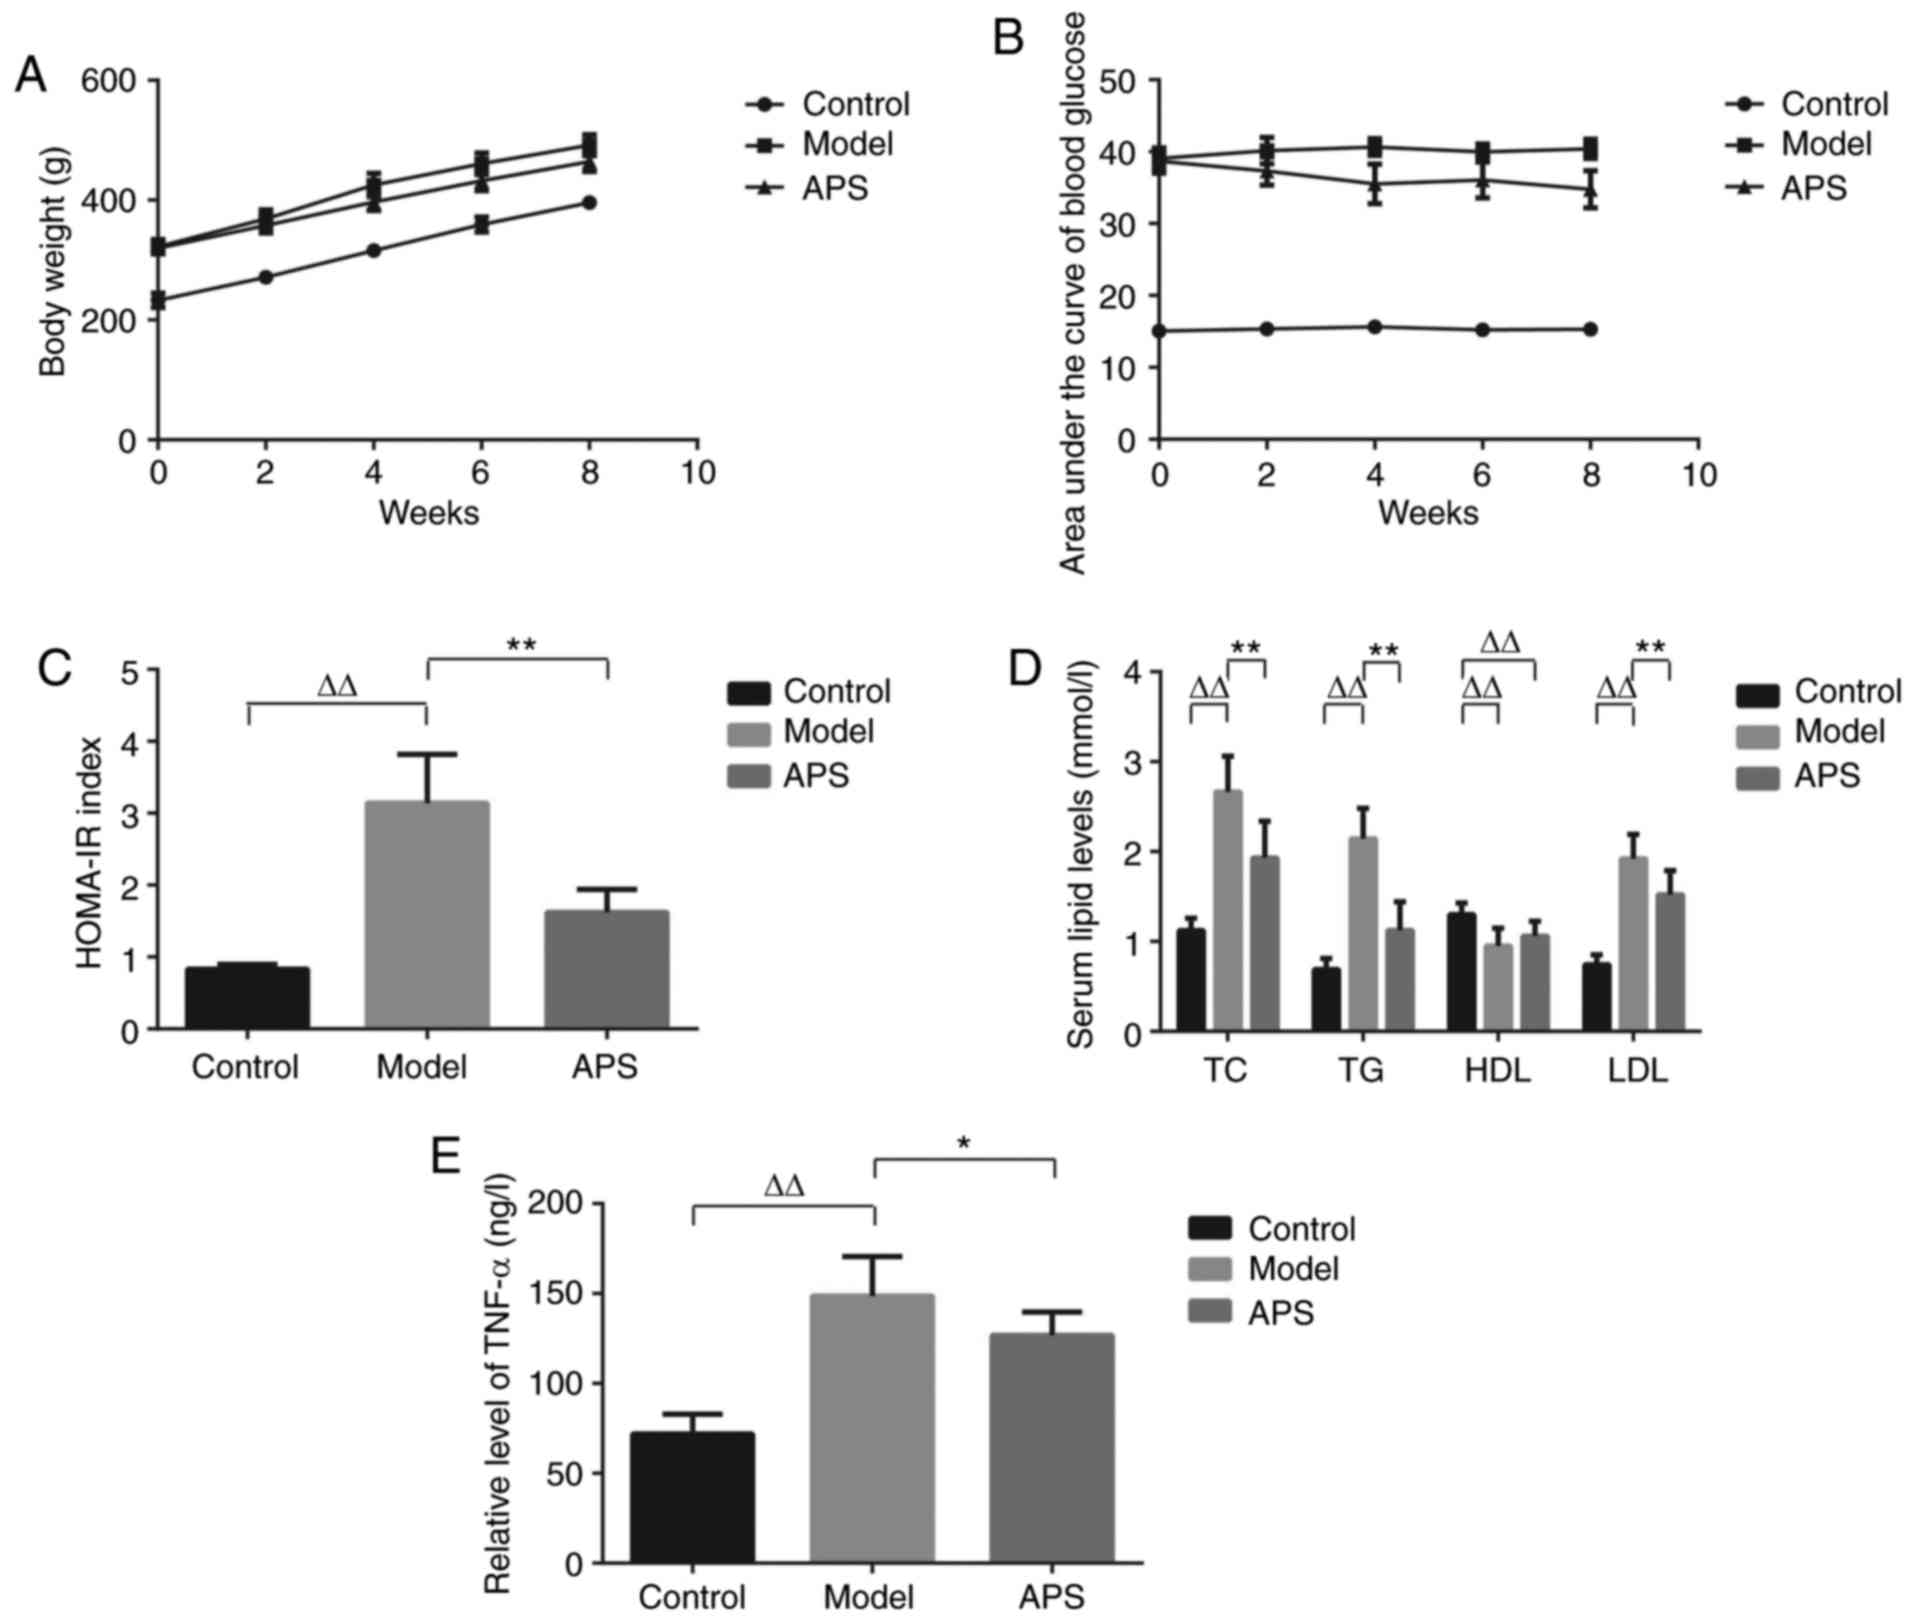 | Figure 1.Effect of APS on body weight. (A) Body
weight was recorded at 0, 2, 4, 6 and 8 weeks. (B) Blood glucose
was recorded at 0, 2, 4, 6 and 8 weeks. (C) Effect of APS on
HOMA-IR index, n=10. (D) Effect of APS on Serum lipid profile,
n=10. (E) Effect of APS on TNF-α level, n=10.
ΔΔP<0.01, **P<0.01 and *P<0.05 as indicated.
APS, Astragalus polysaccharides. |
TC, TG and LDL levels was increased by about 2.4-,
3.1- and 2.6-fold respectively in model group as compared with
those in control group (P<0.01) (Fig. 1E). In contrast, HDL level in model
group was decreased by 27% (P<0.01). After APS treatment, TC, TG
and LDL levels were decreased by 27, 48 and 21%, respectively
(P<0.01), while HDL level showed no significant change as
compared with model group (P>0.05). Serum level of TNF-α in
model group were increased by about 2.1-fold respectively as
compared with those in control group. After APS treatment, the
level decreased by 14.7% as compared with model group (P<0.01)
(Fig. 1F). Data are shown by mean
± standard deviation (n=10). ΔΔP<0.01, showing a
significant difference as compared with control group; **P<0.01,
showing a critical difference as compared with model group,
employing one-way ANOVA following Tukey-Kramer multiple comparisons
post hoc test.
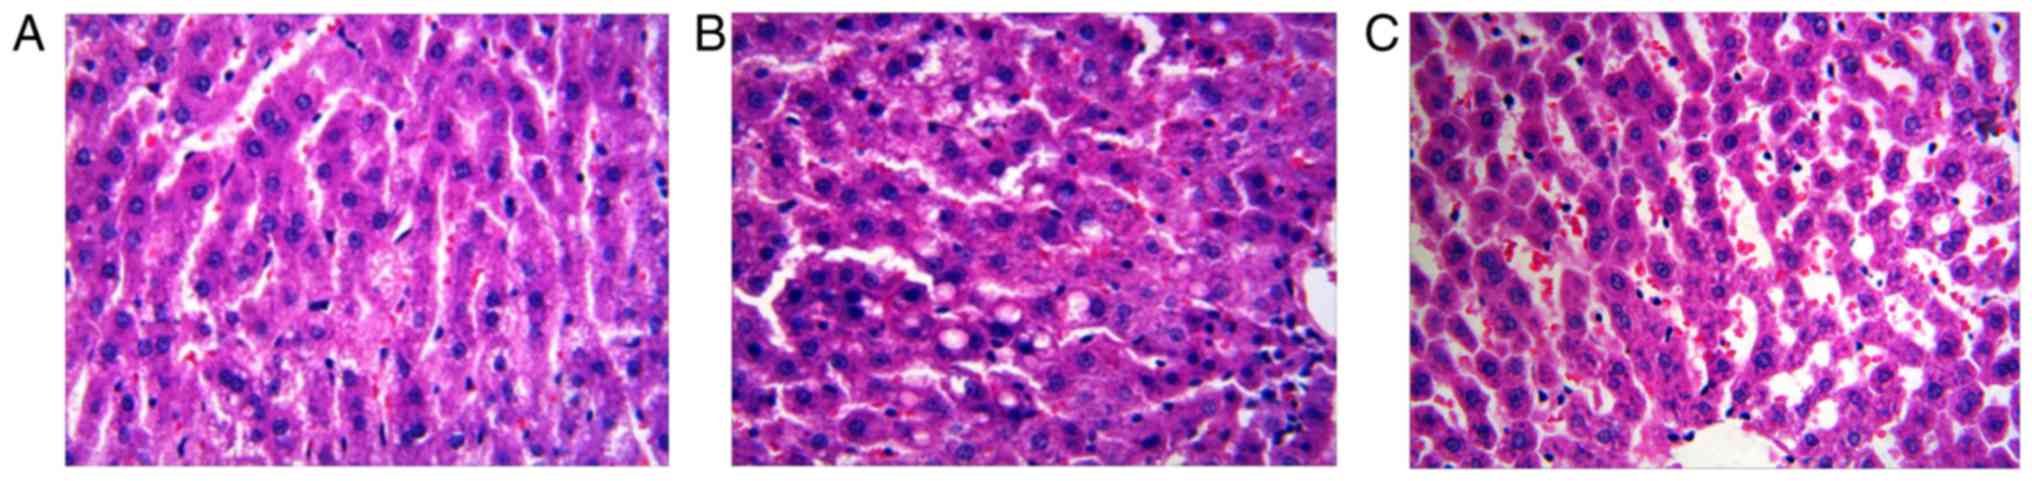
Pathology staining of the liver
H&E staining demonstrated that liver cells of
the rats in the control group were arranged neatly, the liver
lobular structure was regular and a large and round nucleus was
present in the center (Fig. 2A).
Moreover, the cytoplasm was uniform, and no lipid deposition was
noted in the liver cells. Liver cells of the rats in the model
group were swollen, and lipid droplets of various sizes were found
in the cytoplasm, which were mainly larger-bubble fat droplets
(Fig. 2B). Lipid droplets
decreased significantly in the APS group (Fig. 2C).
Results of microRNA microarray
analysis
The microRNA microarray analysis showed 12 microRNAs
that had significant differences in expression in the model and APS
groups. Among them, five were upregulated in the model group,
including miR-103a-3p, miR-181a-5p, miR-384-3p, and so forth, and
seven were downregulated, including miR-203a-3p, miR-106b-5p, and
so forth. Changes of the expression of microRNA-203a-3p might be
related to IR in rats (Fig.
3).
GRP78 is a target of miR-203a-3p
To explore the mechanism by which miR-203a-3p
effected on IR, we searched potential targets of miR-203a-3p using
bioinformatic algorithms, such as MiRanda, Pictar and TargetScan.
GRP78, a critical executioner of endoplasmic reticulum stress (ERS)
signaling, was predicted as a putative target of miR-203a-3p. The
identification of one miR-203a-3p-binding site was done in the
3′-UTR of GRP78 mRNA (Fig.
4A).
We determined the levels of miR-203a-3p and GRP78
mRNA. As shown in Fig. 4B and C,
the miR-203a-3p levels were decreased by 0.45-fold in model group.
Interestingly, the increase in miR-203a-3p expression was most
pronounced by 0.3-fold in APS group (Fig. 4B). We further examined the
expression of GRP78, one confirmed target of miR-203a-3p, along
with mRNA levels by RT-qPCR. It was found that the expression of
GRP78 mRNA was increased significantly in model group as compared
with that in control group (P<0.05). On the contrary, there was
no significant difference between APS and control groups (Fig. 4C).
To affirm the interrelation between miR-203a-3p and
GRP78, the dual-luciferase reporter assay was implemented. Compared
with the negative control RNA, the miR-203a-3p mimic significantly
suppressed the activity of the luciferase reporter fused with GRP78
3′-UTR by 45% (Fig. 4D),
suggesting that miR-203a-3p inhibited GRP78 expression through its
3′-UTR.
The WB result showed that GRP78 was down-regulated
by miR-203a-3p, while anti-miR-203a-3p promoted GRP78 expression
(Fig. 4E and F). Overall, these
results revealed that miR-203a-3p could directly target and
regulate the expression of GRP78.
Effect of APS on protein expressions
in liver of T2DM GK rats and IR cells model
ERS is a change in the microenvironment of the
endoplasmic reticulum, such as defects and disorders of protein
translation, modification, turnover metabolism (10–12).
Appropriate ERS can protect cells, whereas sustained
or prolonged ERS accelerates apoptosis. When ERS occurs, its
classical marker GRP78 protein is highly expressed and activates
three apoptotic pathways. The corresponding apoptotic mechanisms
include CHOP transcriptional activation, activation of JNK
signaling pathway, activation of caspase-12, and so forth (13).
We used qRT-PCR to identify the transfection effect
in our preliminary experiments. All of the negative control,
miR-203a-3p mimics and miR-203a-3p inhibitor had high transfection
efficiency.
As demonstrated in Fig.
5, in both T2DM GK rats and IR cells model, the protein
expressions of GRP78, CHOP, pJNK1, and caspase-12 were all
increased significantly as compared with those in control group,
respectively (P<0.01), while there were no significantly between
APS group and control group (Fig. 5A
and B). The levels of GRP78, CHOP, pJNK1, and caspase-12
proteins was decreased significantly in the clones infected with
miR-203a-3p mimics in IR cells model (P<0.01), among which the
protein expressions of those increased significantly in the clones
infected with miR-203a-3p inhibitor (P<0.01). After APS treated,
GRP78, CHOP, pJNK1, and caspase-12 protein expressions were all
decreased significantly as compared with those in model group
(P<0.01) (Fig. 5C adn D).
 | Figure 5.Effect of APS on GRP78, CHOP, pJNK1
and caspase-12 protein expressions. The protein expressions of
GRP78, CHOP, pJNK1 and caspase-12 were detected by western blotting
as described in the text. The figure represents one of three
experiments with similar results (A and C). Data are presented as
the means ± standard deviation from three independent experiments.
In (B), ΔΔP<0.01 vs. control group, **P<0.01, vs.
model group. In (D), ΔΔP<0.01 vs. control,
**P<0.01 vs. IR+NC, ##P<0.01 vs. IR+miR203 mimics,
&&P<0.01 vs. IR+miR203 inhibitor. APS,
Astragalus polysaccharides; GRP78, glucose-regulated protein
78; CHOP, CAAT-enhancer-binding protein homologous protein; pJNK1,
phosphorylated-c-Jun N-terminal kinase 1. |
Discussion
MiRNAs belong to a clan for non-coding RNAs with
20–24 nucleotides in length (14).
The expression of multiple genes involving various pathways can be
regulated coordinately by a singular miRNA, and therefore the gene
regulation can be unraveled by discovering changed miRNA expression
in complex diseases. Recent studies have found that miRNAs play an
important role in the development and progression of diabetes
mellitus. They are involved in blood glucose regulation, IR, islet
β cell damage and dysfunction (15). Increased number of drugs have been
found to regulate miRNAs in different tissues of DM patients
(16).
The Goto-Kakisaki (GK) rat is a genetic model of
type non-insulin dependent diabetes mellitus without obesity. It
was developed from Wistar rat with impaired glucose tolerance over
successive generations. Therefore, according to the experimental
routine, we chose Wistar rats as the control group. GK rats sexual
maturity in 12 weeks, abnormal blood glucose usually occurs in
14–16 weeks of age, so the choice of 10 weeks old GK rats
pre-feeding 6 weeks (16 weeks old) began experiment. Wistar rats of
the same age had higher body weight than GK rats under the same
feeding conditions. In order to better reflect the differences in
body weight between the experimental group and the model group,
Wistar rats with relatively small age and slightly lighter weight
were selected as the normal control group. Because Wistar rat
sexual maturity in 8–10 weeks, so 10 weeks of age in mature Wistar
rats were tested, increased age after the biochemical indicators of
the difference was not obvious, can be used as a stable control
group. Also worth mentioning is that the HepG2 cell line was
originally established in 1979 by Barbara Knowles and colleagues,
and mistakenly reported as a hepatocellular carcinoma (17). Based on some histologic and
biologic evidence that HepG2 originated as a hepatoblastoma and not
a hepatocellular carcinoma (18,19).
The current study aimed to investigate changes in
miRNA expression in the liver of a obesity-associated T2DM GK rat
model to assess their underlying devotion to disease development
and progression and evaluate the effect of APS against T2DM, in an
attempt to explore the mechanism of APS-affected miRNA expressions
in the liver of T2DM GK rats.
Our findings indicate that particular alterations in
hepatic miRNA expression existing in diabetic conditions reflect
the coexisting adaptive procedure-elicited compensated IR. Analysis
of the functional impact of individual changes on miRNA expression
in the isolated liver revealed that some of them had beneficial
effects on the activity of insulin sensitivity while others
resulted in IR.
We propose that APS attenuates IR by upregulating
the levels of particular miRNAs, such as miR-203a-3p, let-7i-5p,
-miR-106b-5p and miR-23a-3p, miR-490-3p and miR-490-5p and
downregulating miR-101a-3p, miR-103-3p, miR-181a-5p and miR-384-3p,
etc. To the best of our knowledge, our study for the first time
addressed the importance of miRNAs in T2DM GK rats through
systematic investigations on APS's efficacy in regulating IR of
miRNA changes. Our data demonstrate that IR induced by obesity is
associated with alterations in two different groups of hepatic
miRNAs, which have opposing phenotypic effects on the liver. These
alterations in miRNA expression provide clear evidence that APS
regulates hepatic miRNAs in T2DM GK rats. It was found in our study
that the most striking change was the miR-203a-3p expression in
model group rats. And we identified the target gene GRP78 through
bioinformatic algorithms, dual-luciferase reporter assay and RT-PCR
method. Thus, our primary research question was how myocardial
miR-203a-3p played its negative or positive role in the genes
related to ERS signaling signaling.
Recent studies have found that ERS-induced apoptosis
is a new pathway of apoptosis different from the death receptor and
mitochondrial pathways (20,21).
Under strong stimulation or sustained ERS, GRP78 is highly
expressed and activates apoptosis induced by multiple ways
(22). No or extremely low
expression of GRP78 is found under the normal state. However, GRP78
is extremely sensitive to the endoplasmic reticulum environment.
Many factors that can cause changes in the endoplasmic reticulum
can directly or indirectly cause changes in GRP78 expression, such
as high blood glucose, high blood pressure, oxidative stress, and
inflammation, inducing the mass release of its proteins. Our data
suggest miR-203a-3p upregulated by APS could reduce the expression
of GRP78 mRNA and protein.
CHOP-mediated ERS apoptosis is closely related to
the duration of stimulation. Gentle stimulation for a longer
duration can lead to the reduction of CHOP level through degrading
CHOP mRNA and CHOP protein to adapt to the environment (23). The activation of JNK is achieved by
the Ire1-TRAF2-ASK1-JNK pathway, which promotes apoptosis by
affecting Bcl-2. JNK is involved in obesity and IR-associated
inflammation and oxidative stress, which plays an important role in
developing obesity-induced IR (24). Cysteine aspartic acid protease 12
(caspase-12) is present on the cell membrane. Studies have revealed
that sustained ERS can activate pre-caspase-12, and pre-caspase-12
can be pyrolyzed into active caspase-12 through m-calpain C when it
encounters ERS or intracellular calcium mobilization in the
endoplasmic reticulum membrane (25).
In our study, protein expressions belonging to CHOP,
pJNK1, and caspase-12 in the liver were significantly increased
under the condition of IR. Here, we revealed that following
treatment with APS, protein expressions belonging to CHOP, pJNK1,
and caspase-12 were partially restored.
Generally, our study adds new clues to the
understanding about the action mechanism of APS in the treatment of
IR. We propose that dysregulation and function of miR-203a-3p in
the liver play an important role in IR. Overexpression of
miR-203a-3p in the liver may prove to be able to attenuate IR.
GRP78 is inhibited by miR-203a-3p under physiological conditions,
and during the T2DM process as well. These results also imply that
miR-203a-3p may regulate ERS signaling-related genes. Our study
suggested that APS attenuated IR probably by enhancing the
expression of miR-203a-3p and down-regulating the expression of
GRP78 mRNA and protein and reducing the expression of CHOP,
caspase-12 and phosphorylation of JNK1 protein in the liver of T2DM
GK rats, which seemingly implies that the APS regulating ERS
signaling might be the cause of attenuated IR.
For the first time, we discovered that APS could
attenuated IR probably through up-regulating or maintaining the
miR-203a-3p levels, reducing GRP78 mRNA and protein and reducing
the expression of CHOP, caspase-12 and phosphorylation of JNK1
protein of the ERS signaling pathway. The research results will be
benefit to better understand the effect and its mechanism in the
miRNA field of APS for the treatment of diabetes.
Acknowledgements
We warmly thank Pathology Laboratory (Zhejiang
Chinese Medical University, Hangzhou) for their expertise and
technical help. This study was supported by grants from the
National Natural Science Foundation of China (no. 81603351) and the
Zhejiang Provincial Natural Science Foundation Project (no.
LY16H270014).
Glossary
Abbreviations
Abbreviations:
|
APS
|
Astragalus polysaccharides
|
|
HFD
|
high-fat diet
|
|
miRNA
|
microRNA
|
|
GK
|
Goto Kakizaki
|
|
GRP78
|
glucose-regulated protein 78
|
|
BW
|
body weight
|
|
PBG
|
plasma blood glucose
|
|
HOMA-IR
|
homeostasis model assessment index for
insulin resistance
|
|
TC
|
total cholesterol
|
|
TG
|
triglycerides
|
|
LDL-C
|
low-density
lipoprotein-cholesterol
|
|
HDL-C
|
high-density
lipoprotein-cholesterol
|
|
TNF-α
|
tumor necrosis factor-α
|
|
RT-qPCR
|
reverse transcription-quantitative
polymerase chain reaction
|
|
GADD153/CHOP
|
growth arrest and DNA-damage inducible
transcript 3/C/EBP homologous protein
|
|
JNK1
|
c-Jun N-terminal kinase 1
|
|
pJNK1
|
phosphorylation of c-Jun N-terminal
kinase 1
|
References
|
1
|
Bacon S, Engelbrecht B, Schmid J, Pfeiffer
S, Gallagher R, McCarthy A, Burke M, Concannon C, Prehn JH and
Byrne MM: MicroRNA-224 is readily detectable in urine of
individuals with diabetes mellitus and is a potential indicator of
beta-cell demise. Genes (Basel). 6:399–416. 2015. View Article : Google Scholar :
|
|
2
|
Willeit P, Skroblin P, Kiechl S,
Fernández-Hernando C and Mayr M: Liver microRNAs: Potential
mediators and biomarkers for metabolic and cardiovascular disease?
Eur Heart J. 37:3260–3266. 2016. View Article : Google Scholar :
|
|
3
|
Rawal S, Munasinghe PE, Shindikar A,
Paulin J, Cameron V, Manning P, Williams MJ, Jones GT, Bunton R,
Galvin I and Katare R: Down-regulation of proangiogenic
microRNA-126 and microRNA-132 are early modulators of diabetic
cardiac microangiopathy. Cardiovasc Res. 113:90–101. 2017.
View Article : Google Scholar
|
|
4
|
Chen W, Xia YP, Chen WJ, Yu MH, Li YM and
Ye HY: Improvement of myocardial glycolipid metabolic disorder in
diabetic hamster with Astragalus polysaccharidess treatment.
Mol Biol Rep. 39:7609–7615. 2012. View Article : Google Scholar
|
|
5
|
Li GQ, Kam A, Wong KH, Zhou X, Omar EA,
Alqahtani A, Li KM, Razmovski-Naumovski V and Chan K: Herbal
medicines for the management of diabetes. Adv Exp Med Biol.
771:396–413. 2012.
|
|
6
|
Park J and Jang HJ: Anti-diabetic effects
of natural products an overview of therapeutic strategies. Mol Cell
Toxicol. 13:pp1–20. 2017. View Article : Google Scholar
|
|
7
|
Wagner H and Ulrich-Merzenich G: Towards a
contemporary and evidence-based development of TCM. Evid Ration
Based Res Chin Drugs. 489–516. 2012.
|
|
8
|
Matthews DR, Hosker JP, Rudenski AS,
Naylor BA, Treacher DF and Turner RC: Homeostasis model assessment:
Insulin resistance and beta-cell function from fasting plasma
glucose and insulin concentrations in man. Diabetologia.
28:412–419. 1985. View Article : Google Scholar
|
|
9
|
Fang J, Song XW, Tian J, Chen HY, Li DF,
Wang JF, Ren AJ, Yuan WJ and Lin L: Overexpression of microRNA-378
attenuates ischemia-induced apoptosis by inhibiting caspase-3
expression in cardiac myocytes. Apoptosis. 17:410–423. 2012.
View Article : Google Scholar
|
|
10
|
Yorimitsu T and Klionsky DJ: Autophagy:
Molecular machinery for self-eating. Cell Death Differ. 12 Suppl
2:S1542–S1552. 2005. View Article : Google Scholar
|
|
11
|
Shintani T and Klionsky DJ: Autophagy in
health and disease: A double-edged sword. Science. 306:990–995.
2004. View Article : Google Scholar :
|
|
12
|
Hamasaki M, Noda T, Baba M and Ohsumi Y:
Starvation triggers the delivery of the endoplasmic reticulum to
the vacuole via autophagy in yeast. Traffic. 6:56–65. 2005.
View Article : Google Scholar
|
|
13
|
Yan M, Shen J, Person MD, Kuang X, Lynn
WS, Atlas D and Wong PK: Endoplasmic reticulum stress and unfolded
protein response in Atm-deficient thymocytes and thymic lymphoma
cells are attributable to oxidative stress. Neoplasia. 10:160–167.
2008. View Article : Google Scholar :
|
|
14
|
Galimov A, Hartung A, Trepp R, Mader A,
Flück M, Linke A, Blüher M, Christ E and Krützfeldt J: Growth
hormone replacement therapy regulates microRNA-29a and targets
involved in insulin resistance. J Mol Med (Berl). 93:1369–1379.
2015. View Article : Google Scholar :
|
|
15
|
Pogribny IP, Starlard-Davenport A,
Tryndyak VP, Han T, Ross SA, Rusyn I and Beland FA: Difference in
expression of hepatic microRNAs miR-29c, miR-34a, miR-155, and
miR-200b is associated with strain-specific susceptibility to
dietary nonalcoholic steatohepatitis in mice. Lab Invest.
90:1437–1446. 2010. View Article : Google Scholar :
|
|
16
|
Matsui M and Corey DR: Non-coding RNAs as
drug targets. Nat Rev Drug Discov. 16:167–179. 2017. View Article : Google Scholar
|
|
17
|
Aden DP, Fogel A, Plotkin S, Damjanov I
and Knowles BB: Controlled synthesis of HbsAg in a differentiated
human liver carcinoma-derived cell line. Nature. 282:615–616. 1979.
View Article : Google Scholar
|
|
18
|
Adesina AM, López-Terrada D, Wong KK,
Gunaratne P, Nguyen Y, Pulliam J, Margolin J and Finegold MJ: Gene
expression profiling reveals signatures characterizing histologic
subtypes of hepatoblastoma and global deregulation in cell growth
and survival pathways. Hum Pathol. 40:843–853. 2009. View Article : Google Scholar :
|
|
19
|
López-Terrada D, Cheung SW, Finegold MJ
and Knowles BB: Hep G2 is a hepatoblastoma-derived cell line. Hum
Pathol. 40:1512–1515. 2009. View Article : Google Scholar
|
|
20
|
Paschen W and Mengesdorf T: Cellular
abnormalities linked to endoplasmic reticulum dysfunction in
cerebrovascular disease-therapeutic potential. Pharmacol Ther.
108:362–375. 2005. View Article : Google Scholar
|
|
21
|
Szegezdi E, Logue SE, Gorman AM and Samali
A: Mediators of endoplasmic reticulum stress-induced apoptosis.
EMBO Rep. 7:880–885. 2006. View Article : Google Scholar :
|
|
22
|
Bertolotti A, Zhang Y, Hendershot LM,
Harding HP and Ron D: Dynamic interaction of BiP and ER stress
transducers in the unfolded-protein response. Nat Cell Biol.
2:326–332. 2000. View
Article : Google Scholar
|
|
23
|
Oyadomari S and Mori M: Roles of
CHOP/GADD153 in endoplasmic reticulum stress. Cell Death Differ.
11:381–389. 2004. View Article : Google Scholar
|
|
24
|
Ozcan U, Yilmaz E, Ozcan L, Furuhashi M,
Vaillancourt E, Smith RO, Görgün CZ and Hotamisligil GS: Chemical
chaperones reduce ER stress and restore glucose homeostasis in a
mouse model of type 2 diabetes. Science. 313:1137–1140. 2006.
View Article : Google Scholar :
|
|
25
|
Liu Y, Wang J, Qi SY, Ru LS, Ding C, Wang
HJ, Zhao JS, Li JJ, Li AY and Wang DM: Reduced endoplasmic
reticulum stress might alter the course of heart failure via
caspase-12 and JNK pathways. Can J Cardiol. 30:368–375. 2014.
View Article : Google Scholar
|