Introduction
Diabetes mellitus (DM) is a disease characterized by
a marked increase in blood glucose (BG) and concomitant presence of
glucose in urine. Previously, induction of insulin-dependent DM was
confirmed by a marked increase in BG concentration observed in rats
following intraperitoneal injection of alloxan monohydrate
(1). The principle defect in type
2 (T2) DM is insulin resistance, leading to a relative insulin
deficiency in the liver and peripheral tissues with overt
hyperglycemia (2). In type 1 (T1)
DM, insulin production of the pancreatic Langerhans islet cells is
completely eliminated due to a decease in islet cell number. In T1
and 2 DM, glucose uptake is disturbed, particularly in muscle and
fat cells, resulting in hyperglycemia. Neuron cells take up glucose
without insulin, therefore, in hyperglycemic DM, hyperglycemia
causes an up to 4-fold increase in neuronal glucose uptake.
Elevated intracellular glucose metabolism leads to neuronal damage
(3). In human and animal models,
DM was demonstrated to be associated with pathological changes in
the central nervous system leading to cognitive and affective
deficits and an increased risk of vascular complications in the
brain (2). Several brain
alterations have been described, including increased hippocampal
astrocytic reactivity, impaired synaptic plasticity, vascular
alterations, decreased dendritic complexity and disturbed
neurotransmission (4). During
these pathological changes, damaged mitochondria develop
imperfectly coupled electron transport systems, becoming a
principal source of reactive oxygen species (ROS) in the cell.
Therefore, oxidative stress is widely accepted as a key mediatory
process in the development and progression of diabetic
complications, due to increased production of free radicals and
impaired antioxidant defenses (5).
Oxidative stress is also a hallmark of pathophysiological responses
resulting from alterations in cellular redox homeostases due to an
overproduction of ROS or a deficiency in the buffering or
scavenging systems for ROS (6).
Antioxidants have been classified according to their mode of action
and Bonnefont-Rousselot et al(7) differentiated these molecules into
three groups: i) antioxidants that prevent the formation of ROS,
including ceruloplasmin, metallothioniene, albumin, myoglobin,
ferritin and transferrin; ii) scavenging antioxidants which remove
ROS once formed, preventing radical chain reactions, including
reduced glutathione (GSH), vitamins E and C, α-carotene, uric acid
and billirubin; and iii) enzyme antioxidants that function by
catalyzing the oxidation of other molecules, including superoxide
dismutase (SOD) which converts superoxide radicals into hydrogen
peroxide as well as GSH-peroxidase (GPx) and catalase (CAT) which
decompose hydrogen peroxide.
In addition, aldose reductase (AR) is key enzyme in
DM that catalyzes the formation of nicotinamide adenine
dinucleotide phospate (NADPH) via the polyol pathway, eventually
leading to reduction of glucose to sorbitol (8). AR activity induces diabetic
nephropathy by several mechanisms, including increased lipid
peroxidation, depletion of major non-enzymatic antioxidants and
downregulation of SOD activity (9). The polyol pathway, which is activated
by hyperglycemic conditions, may increase the production of
superoxide- and NAD-induced ROS and sorbitol levels in tissues may
affect myo-inositol content, Na+ and
K+-ATPase activity and oxidative stress (10). In addition, T2 DM has been
associated with an increased risk of developing premature
atherosclerosis due to increased triglyceride (TG) and low-density
lipoprotein (LDL) levels and decreased high-density lipoprotein
(HDL) levels. Therefore, investigating the association between BG,
antioxidant enzymes and AR activity in the diabetic brain at
various stages following chemically-induced hyperglycemia is
important and animal DM models are useful tools to gain new
insights into the human form of this disease. Chemicals, including
streptozotocin (STZ), a powerful alkylating agent, interfere with
glucose transporters and glucokinase function and induce
double-strand DNA breaks. To determine the successful establishment
in a DM animal model, fasting BG and glucose tolerance tests must
be conducted (11). Animals that
present with hyperglycemia, uric acid and insulin resistance are
classified as successful models of DM. Although the brain is not a
classical target organ of insulin, insulin was previously
identified as important in human neurophysiology and dysregulation
of insulin receptor signaling has been associated with a number of
mental illnesses (12). Therefore,
the aim of the current study was to evaluate the effects of
STZ-induced DM on oxidative stress in the hippocampus, prefrontal
cortex and vessels and analyze ionoregulatory disruptions, acute
anemia, hyperlipidemia, nephropathy and hepatopathy in an animal
model of DM (13).
Materials and methods
Animals and drugs
Eight-week-old male Sprague-Dawley rats, weighing
170–190 g, were purchased from Vital River Laboratory Animal
Technology Co., Ltd. (Beijing, China) and housed in individual
cages at a constant temperature (18–22°C) under a 12-h light-dark
cycle. All rats were habituated to the cage for at least 1 week
prior to the experiments and randomly divided into 2 groups. The
control group was composed of 30 rats. Another group of 90 rats
were administered a high-fat and high-sugar diet for 4 weeks (food
composition: 32% carbohydrate, 28% fat, 17% protein and 23% other)
to induce insulin resistance (Table
I). Following this, 25 mg/kg STZ dissolved in CASC buffer
(Sigma-Aldrich, St. Louis, MO, USA) was injected intraperitoneally.
An additional injection (40 mg/kg) was administered 4 weeks later
(14,15) to each rat of the second group. To
determine successful establishment of the DM model, BG levels were
measured weekly using BG test strips (HMD BioMedical Co., Taiwan,
China). The success rate of T2 DM model establishment was 76%.
STZ-injected animals were continuously fed a high-fat and
high-sugar diet and the animals were sacrificed at corresponding
times (8, 12 and 16 weeks following model establishment). Brain
tissues from the hippocampal region were rapidly removed into ice
cold artificial cerebrospinal fluid and glycated hemoglobin (HbA1c)
and cholesterol levels were measured (Olympus 5421, Olympus
Corporation, Tokyo, Japan) prior to freezing at −80°C for
analysis.
 | Table INutritional content (%) of high-fat
and ordinary diets. |
Table I
Nutritional content (%) of high-fat
and ordinary diets.
| Ordinary diet | High-fat and
high-sugar diet |
|---|
|
|
|
|---|
| Food
composition | Rate (wt/wt) % | Total energy
(%) | Rate (wt/wt) % | Total energy
(%) |
|---|
| Carbohydrates | 50 | 62 | 32 | 28 |
| Fat | 5 | 12 | 28 | 57 |
| Protein | 23 | 26 | 17 | 15 |
| Others | 22 | - | 23 | - |
The investigation conformed to the Guide for the
Care and Use of Laboratory Animals published by the US National
Institutes of Health (NIH publication no. 85-23, revised in 1996).
Animal experiments followed the ethical standards approved by the
Research Ethics Committee of Kunming Medical University (Yunnan,
China). The study was approved by the ethics committee of the No. 2
Affiliated Hospital of Kunming Medical University, Kunming, China.
Written informed consent was obtained from the patient.
BG and serum insulin estimations
Blood samples were obtained by repeated needle
puncture of the tail tip veins 1 day prior to STZ-treatment and
every day following DM induction. BG concentrations were determined
using Bayer Glucometer Elite® and compatible BG test
strips (Bayer, Pittsburgh, PA, USA). Fasted STZ-treated rats with
BG concentrations ≥16 mmol/l were considered to have DM and were
used in the current study (16,17).
Serum insulin concentrations were determined by an enzyme-linked
immunosorbent assay, using a commercial kit (Crystal Chem, Chicago,
IL, USA).
CAT activity
The activity of CAT was measured using its
perioxidase function according to the method of Johansson and Borg
(18). Potassium phosphate buffer
(50 μl; 250 mM, pH 7.0) was incubated with 50 μl methanol and 10 μl
hydrogen peroxide (0.27%). The reaction was initiated by the
addition of 100 μl enzyme sample with continuous agitation at room
temperature (25±1°C). Following 20 min, the reaction was terminated
by addition of 50 μl 7.8 M potassium hydroxide and 100 μl purpald
(4-amino-3-hydrazino-5-mercapto-1,2,4-triazole; 34.2 mM in 480 mM
HCl) was immediately added and the mixture was again incubated for
10 min at 25±1°C with continuous agitation. Potassium peroxidate
(50 μl 65.2 mM solution) was added to obtain a colored compound and
the absorbance was read at 550 nm using a spectrophotometer.
Results are expressed as formaldehyde produced (μmol)/protein
(mg).
SOD activity
Peripheral blood and brain tissue SOD activity was
assayed by the method of Kakkar et al(19). The reaction mixture contained 1.2
ml sodium pyrophosphate buffer (0.052 mM, pH 7.0), 0.1 ml phenazine
methosulphate (186 μM) and 0.3 ml nitro blue tetrazolium (300 μM).
Supernatant (0.2 ml) obtained following centrifugation (1,500 × g,
10 min followed by 10,000 × g, 15 min) of 5% tissue homogenate was
added to the reaction mixture. The enzyme reaction was initiated by
adding 0.2 ml NADH (780 μM) and stopped at 1 min by adding 1 ml
glacial acetic acid. The amount of chromogen formed was measured by
recording the color intensity at 560 nm. Results are expressed as
U/protein (mg).
GPx activity
GPx activity was measured by NADPH oxidation, using
a coupled reaction system consisting of GSH, GSH reductase and
cumene hydroperoxide (20). Enzyme
sample (100 μl) was incubated for 5 min with 1.55 ml stock solution
(prepared in 50 mM Tris buffer, pH 7.6 with 0.1 mM EDTA) containing
0.25 mM GSH, 0.12 mM NADPH and 1 unit GSH reductase. The reaction
was initiated by adding 50 μl cumene hydroperoxide (1 mg/ml) and
the rate of NADPH reduction was determined by monitoring the
absorbance at 340 nm. One unit of enzyme activity is defined as the
amount of enzyme that transforms 1 μmol NADPH to NADP/min. Results
are expressed as U/protein (mg).
Determination of serum cholesterol,
lipoproteins and TG
Blood samples were collected from tail tip veins of
rats following 16 h fasting and transferred to sterilized
centrifuge tubes at room temperature. Blood samples were
centrifuged for 10 min at 4,000 × g to obtain the serum. Serum was
stored in a freezer for later analysis of total cholesterol (TC),
TG and HDL- and LDL-cholesterols. Aliquots of serum were obtained
for the determination of TC using a enzymatic colorimetric assay
method (21) and TG using an
enzymatic glycerol phosphate oxidase/peroxidase method described by
Cheng et al(22) using an
autoanalyzer (Oympus 5421, Olympus Corporation) and ELITech kit.
Serum HDL-cholesterol was assayed by precipitation of chylomicrons,
while very LDL and LDL were determined with sodium phosphotungstic
acid and magnesium chloride (23).
Centrifugation was performed to leave only HDL in the supernatant
and cholesterol content was determined as described previously
(24). Estimation of
LDL-cholesterol was performed using the empirical formula reported
by Friedewald et al(25)
for samples with TG levels <4.5 mmol/l: LDL-cholesterol = TC -
HDL-cholesterol - TG/2.2; where all concentrations are in
mmol/l.
Protein expression measurements by
western blot analysis
Membranes were incubated with primary rat antibodies
against SOD, CAT (both obtained from Abzoom Biolabs, Inc., Dallas,
TX, USA), GPx (R&D Systems, Minneapolis, MN, USA), β-actin
(ACTB; Abzoom Biolabs, Inc.) for 2 h at room temperature. Goat
anti-rat horseradish peroxidase (HRP)-conjugated antibodies were
used as secondary antibodies and visualized using an
electrochemiluminescent detection kit. Values are expressed as
Au/protein (mg). ACTB was used as a loading control.
Quantitative real-time polymerase chain
reaction (RT-PCR)
Genes were validated by the quantitative
RT-PCR-based TaqMan Array (Applied Biosystems, Bedford, MA, USA)
system, according to the manufacturer’s instructions. Relative gene
expression data were obtained using the 2−ΔΔCT method
described by the manufacturer’s instructions. Briefly, 18S
ribosomal RNA (18S) was selected as a housekeeping (internal
control) gene for normalization of the RT-PCR data. The expression
of all five target genes (AR, GPx, Cu-Zu-SOD, CAT; primers are
listed in Table II) was
normalized against 18S expression (relative quantification). Cycle
threshold values were set in the exponential range of the
amplification plots using the 7300 System Sequence Detection
software 1.3 (Applied Biosystems).
| Table IIPrimer sequences for antioxidant
enzyme factors. |
Table II
Primer sequences for antioxidant
enzyme factors.
| Target factors | Primers | Length of amplified
fragment (kb) |
|---|
| AR | s
GCACGTTCCACGACCAGAGC
as GGGAGGAGCAGGATTCGTCC | 739 |
| GPx | s
AGTCCACCGTATATGCCTTC
as TCTGAGGGGATTTTTCTGGA | 697 |
| Cu-Zn-SOD | s
GCAGAAGGCAAGCGGTGAAC
as TAGCAGGACAGCAGATGAGT | 447 |
| β-actin | s
GACAGCAGAAAACTTTCGTGC
as TCCAGCCACTCAGTCTTGG | 275 |
Histology and immunostaining
Samples were fixed in 10% formalin, dehydrated in
ascending alcohol and embedded in paraffin for histological
examination. The 4-μm serial cross-sections were stained with
hematoxylin and eosin and observed under a light microscope
(Olympus Corporation).
Serial sections were incubated in blocking solution,
followed by an overnight incubation at 4°C with the following
primary antibodies: rabbit anti-SOD (Dako, Carpinteria, CA, USA),
rat anti-AR or goat anti-ionized calcium-binding adaptor molecule 1
(Iba1; Abcam, Cambridge, MA, USA). SOD and AR immunostaining
sections were rinsed and the EnVision™ HRP-conjugated system (Dako)
was used as secondary reagent.
Electronmicroscopic observations
Cerebral cortex tissues of DM rats were excised and
subdivided into small samples for transmission electron microscopy
(TEM; JEM-1011, JEOL, Tokyo, Japan) analysis. The collected
specimens were fixed in 2.5% glutaraldehyde buffer, cut into small
sections (~3×1×1 mm) and further fixed in the same fixative for 1
day at room temperature. Sections were rinsed several times in 0.1
mol/l phosphate buffer (pH 7.4) for 1 h at 4°C and then rinsed with
distilled water, post-fixed in 1% osmium tetroxide for 1 h at room
temperature, rinsed again with distilled water and dehydrated in a
graded concentration of ethanol. For TEM observation, samples were
embedded in resin. Ultra-thin (110 nm) sections were mounted onto a
copper grid, stained with 1% uranyl acetate for 8 min and 1% lead
citrate for an additional 10 min and then examined with an
accelerating voltage of 80 kV.
Statistical analysis
Results are expressed as the mean ± SE. ANOVA with
multiple comparisons using Bonferroni’s test or one-way ANOVA was
performed where appropriate. GraphPad Prism (v3.02) was used for
linear regression, curve fitting and dose-response analysis.
P<0.05 was considered to indicate a statistically significant
difference.
Results
Blood analysis of DM patients and
rats
DM rats exhibited elevated BG, HDL, LDL, TG, TC and
HbA1c levels at week 16 following STZ injection (P<0.05,
P<0.01), whereas their weights decreased (Table III). Lipid abnormalities of DM
rats were compared with data from 185 DM patients from the Second
Affiliated Hospital of Kunming Medical University treated between
April and May 2008 and Febuary and March 2009 (Table IV). The comparison indicated that
the high-fat and -glucose diet following 2 STZ injections in rats
reflects the incidence of dyslipidemia in T2 DM patients.
| Table IIIBasic profile of rat DM (week 16
following model establishment) and control groups. |
Table III
Basic profile of rat DM (week 16
following model establishment) and control groups.
| Parameters | Control group | DM group | P-value |
|---|
| Body weight, g | 384.76±34.39 | 286.53±24.97 | <0.01 |
| Blood glucose | 6.53±1.83 | 20.06±4.76 | <0.01 |
| Insulin sensitivity
index | 32.31±11.77 | 35.39±30.63 | <0.05 |
| Fast insulin | 32.31±11.77 | 35.39±30.63 | <0.05 |
| Glycosylated
hemoglobin | 5.98±1.19 | 6.71±1.37 | <0.05 |
| High density
lipoprotein | 0.73±0.18 | 0.9±0.41 | <0.05 |
| Low density
lipoprotein | 0.36±0.11 | 0.75±0.32 | <0.01 |
| Triglyceride | 0.70±0.29 | 1.72±0.60 | <0.01 |
| Total
cholesterol | 1.002±0.20 | 1.43±1.07 | <0.01 |
| Table IVComparison of lipid abnormalities
cases between DM patients and rats. |
Table IV
Comparison of lipid abnormalities
cases between DM patients and rats.
| Cases | DM patients (type
2) | DM rats (type
2) | P-value |
|---|
| Total number | 185 (100) | 30 (100) | >0.05 |
| Lipid abnormal | 51 (34.33) | 14 (47.21) | >0.05 |
| HDL reduction | 8 (4.44) | 1 (3.68) | >0.05 |
| LDL increasing | 31 (21.34) | 7 (23.37) | >0.05 |
| TC increasing | 21 (14.92) | 7 (23.31) | >0.05 |
| TG increasing | 29 (19.59) | 6 (20.36) | >0.05 |
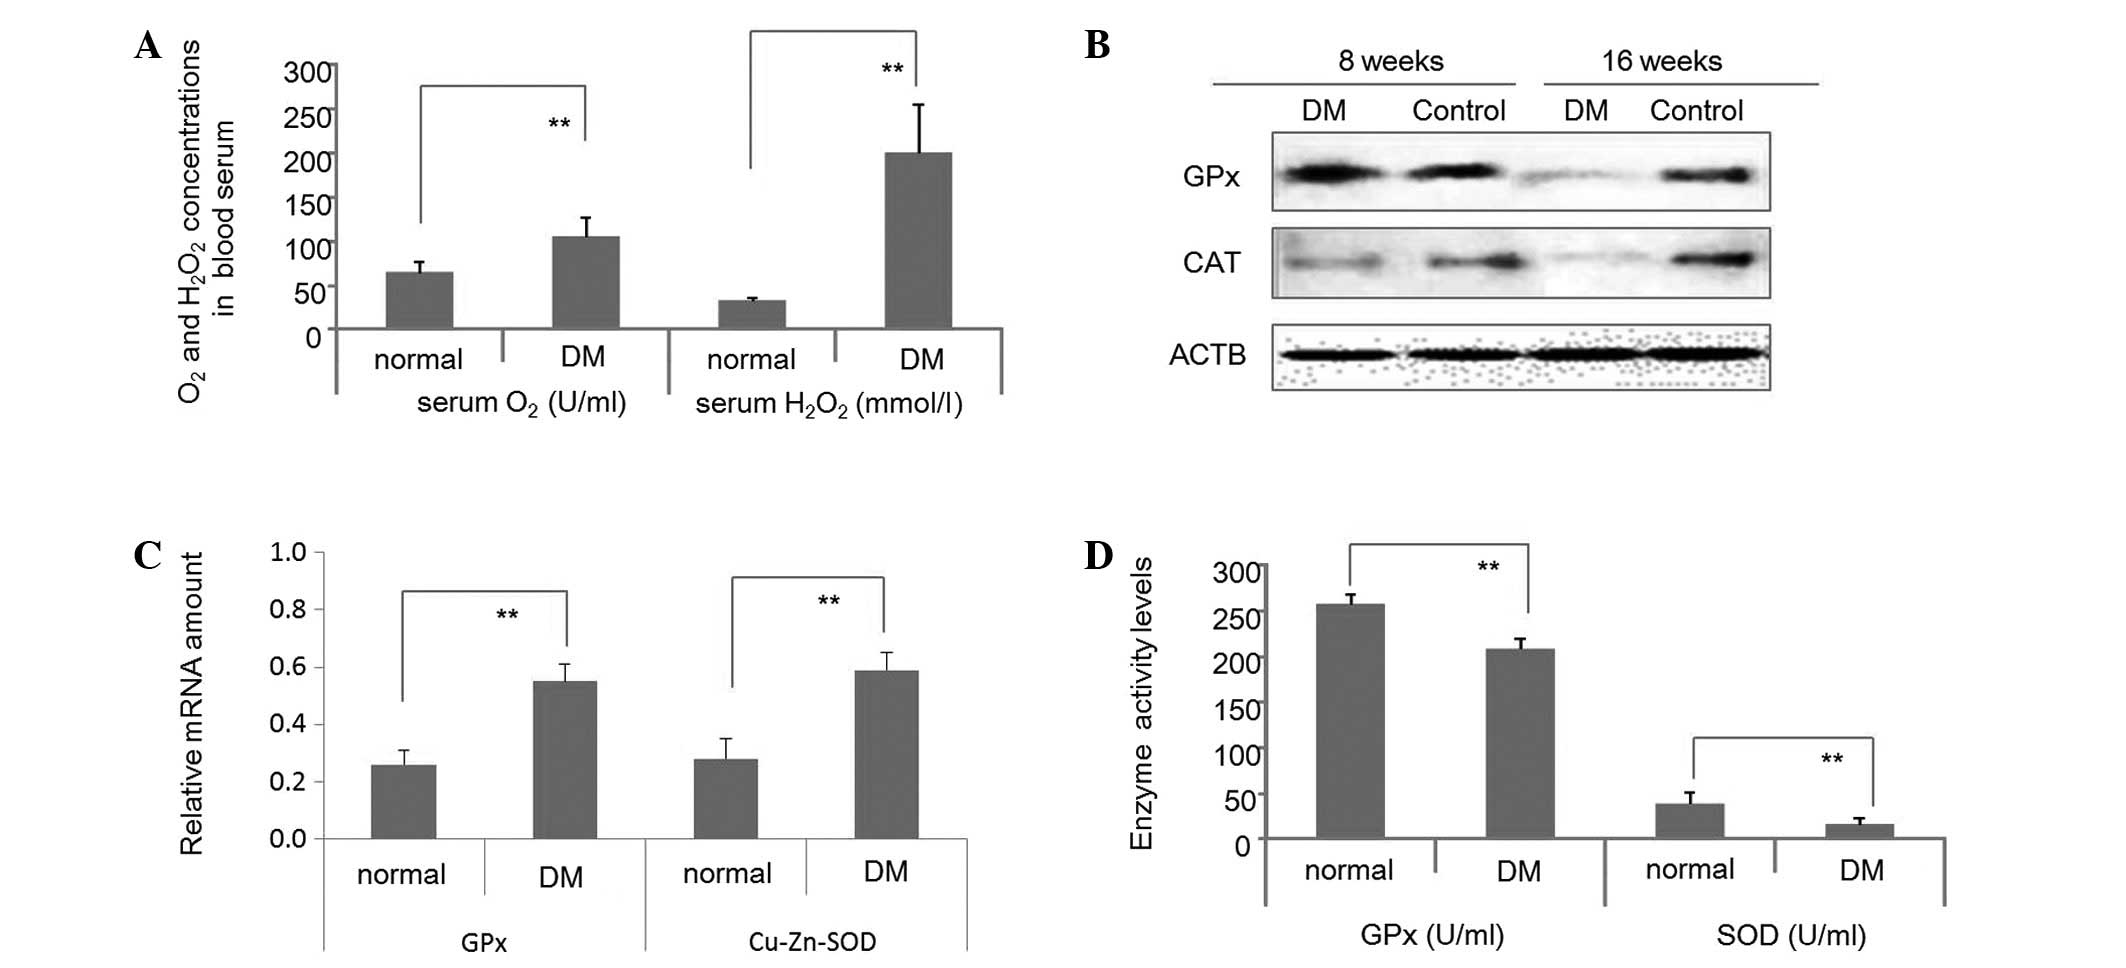
Oxidative stress and antioxidant enzyme
changes in the STZ-induced DM rat group
At week 16 following STD induction, O2
and H2O2 serum levels of DM and control rats
were determined. As demonstrated in Fig. 1A, levels were significantly
enhanced in the STZ-treated group. Fig. 1B reveals that GPx protein levels in
the brain tissues 8 weeks following STZ-induction were enhanced in
DM rats, compared with the control. By contrast, CAT protein levels
were decreased in the brains of the DM group compared with the
control at 8 weeks. At week 16 following STZ-induction GPx and CAT
protein levels in the brain tissues were substantially lower in the
DM group than the control. Fig. 1C
presents GPx and Cu-Zn-SOD mRNA levels in the blood serum of DM and
control rats at week 16 following STZ-induction, indicating that
the transcription of GPx and Cu-Zn-SOD was enhanced in DM rats. By
contrast, GPx and SOD protein levels were reduced in the blood
serum of DM rats at week 16 (Fig.
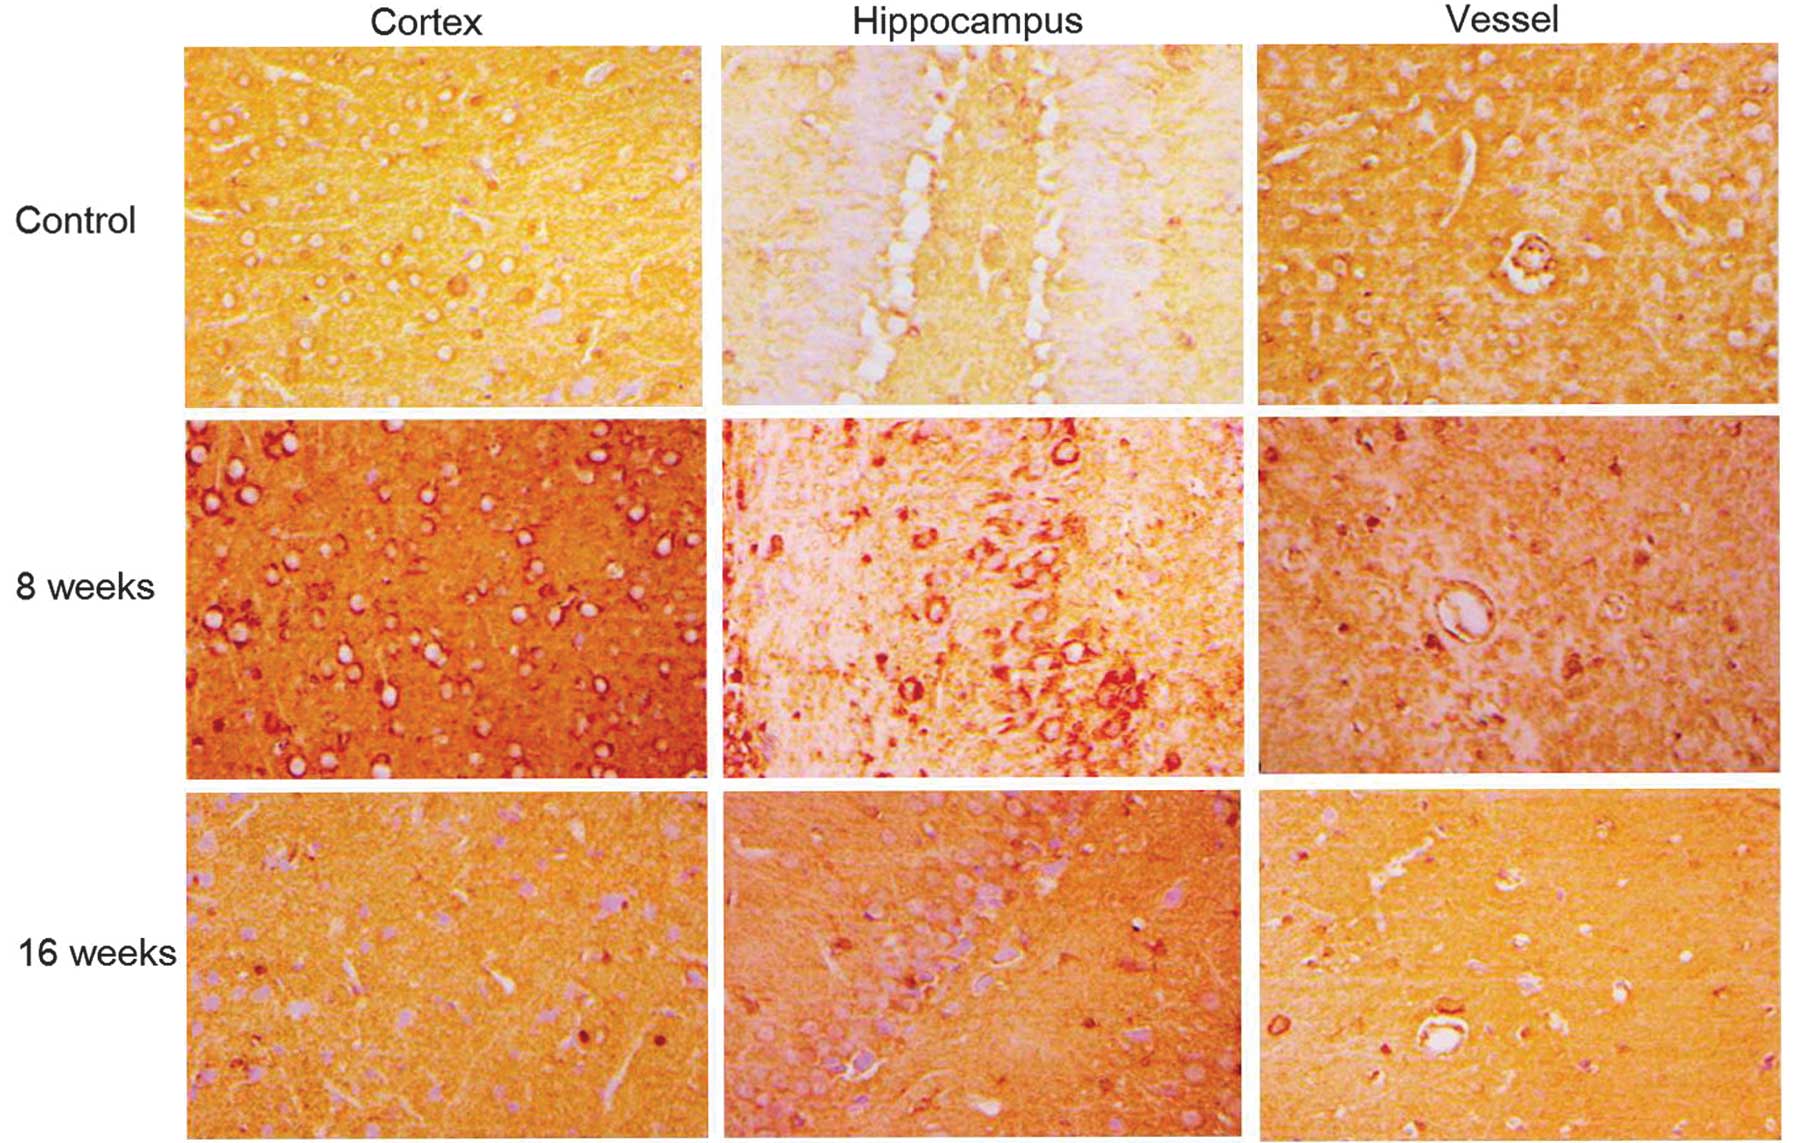
1D). SOD staining in the cortex, hippocampus and blood vessels
of DM rat brains revealed that SOD increased in the early stages
following STZ-induction (week 8), however, at later stages
following DM establishment, levels reduced with the severity of
dyslipidemia in brain tissues (week 16; Fig. 2).
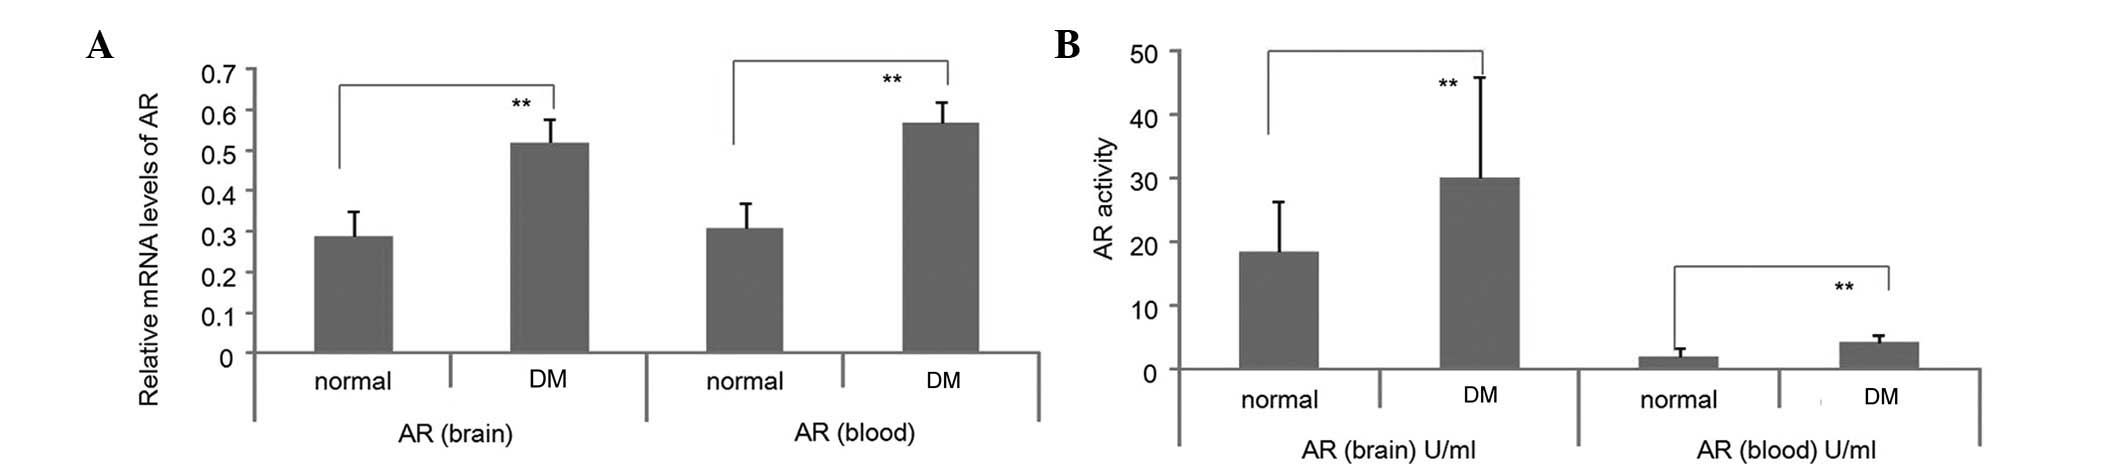
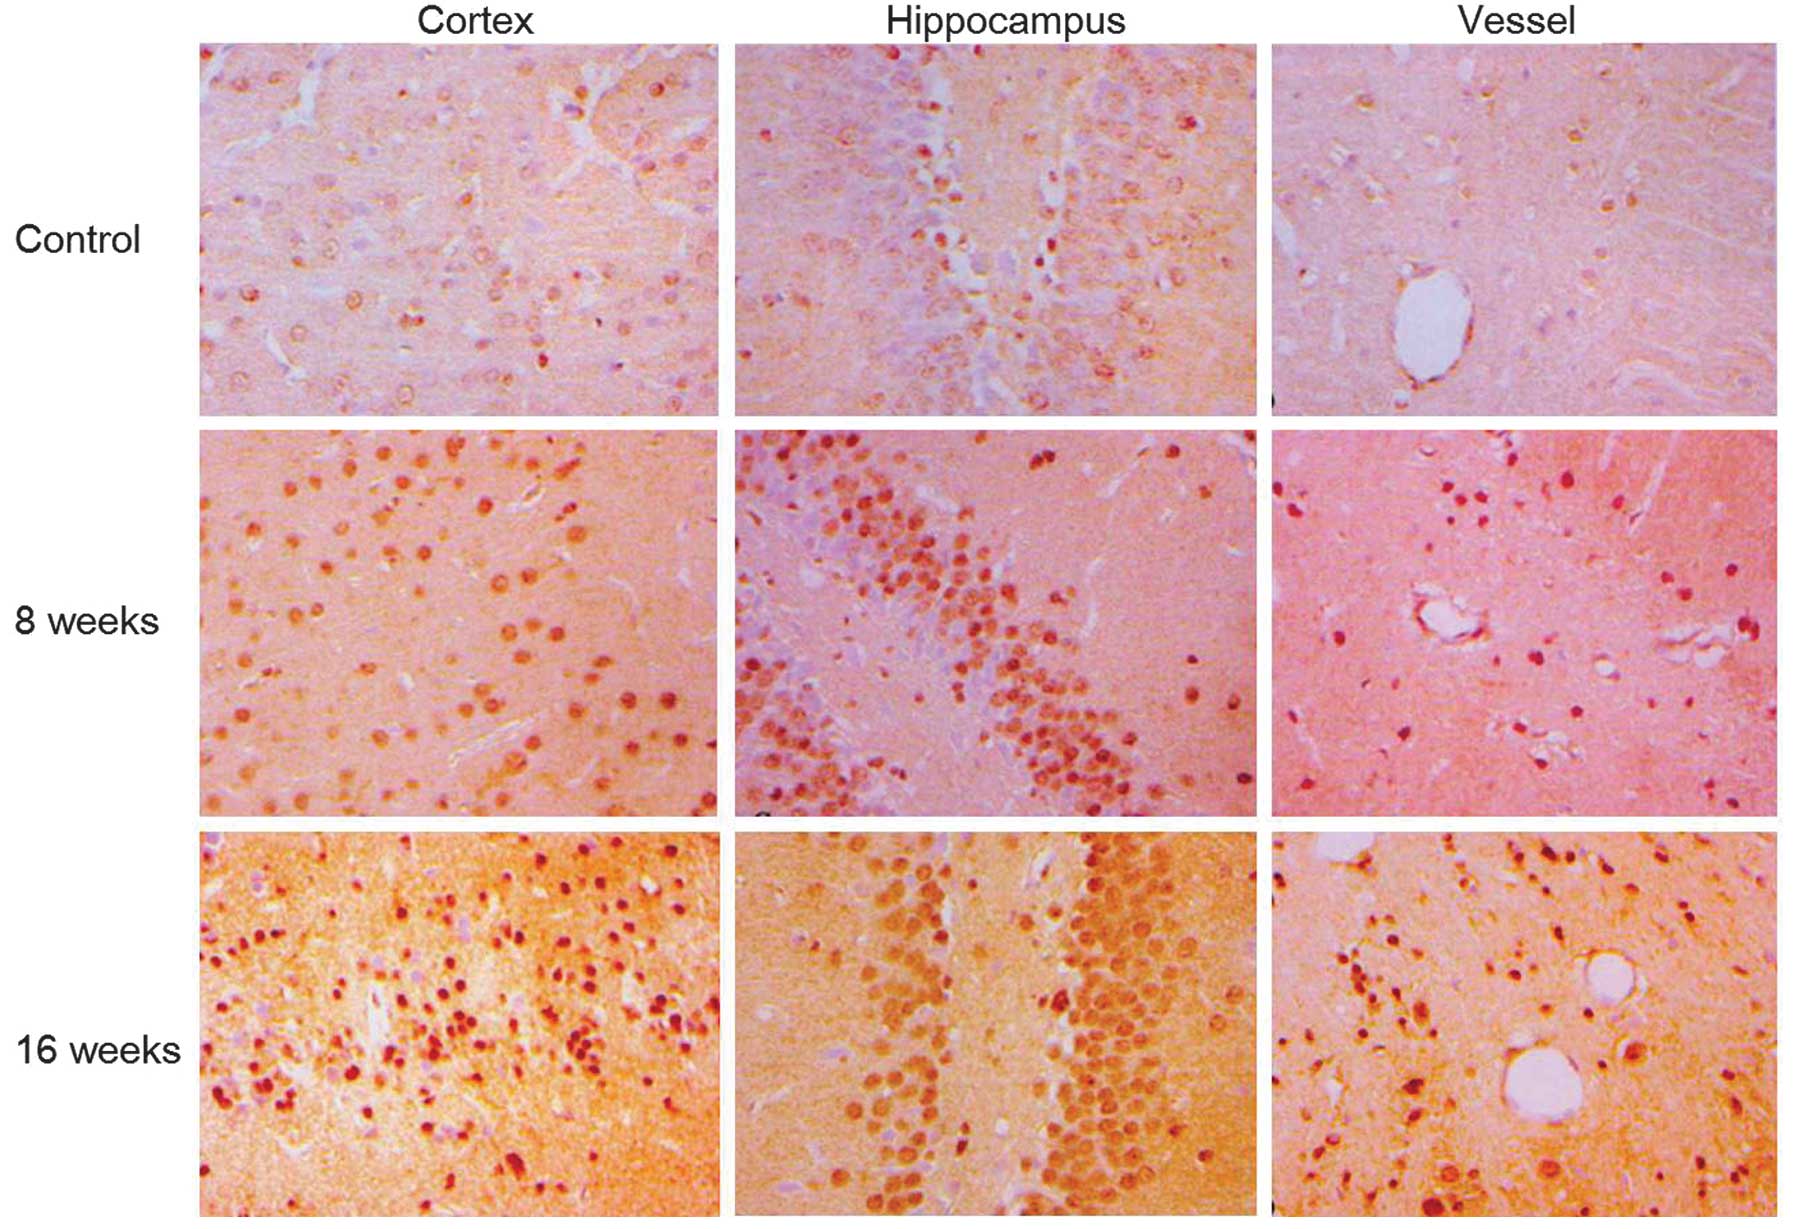
AR accumulation in DM rat brains
In STZ-treated DM rats, mRNA levels and enzyme
activities of AR significantly increased in blood sera and brains
of DM rats at week 16 following STZ-induced DM (Fig. 3; P<0.05). Consistent with these
observations, AR immunostaining revealed an accumulation of AR
protein at weeks 8 and 16 following STZ-induction in the cortex,
hippocampus and vessels of the DM rat brains (Fig. 4).
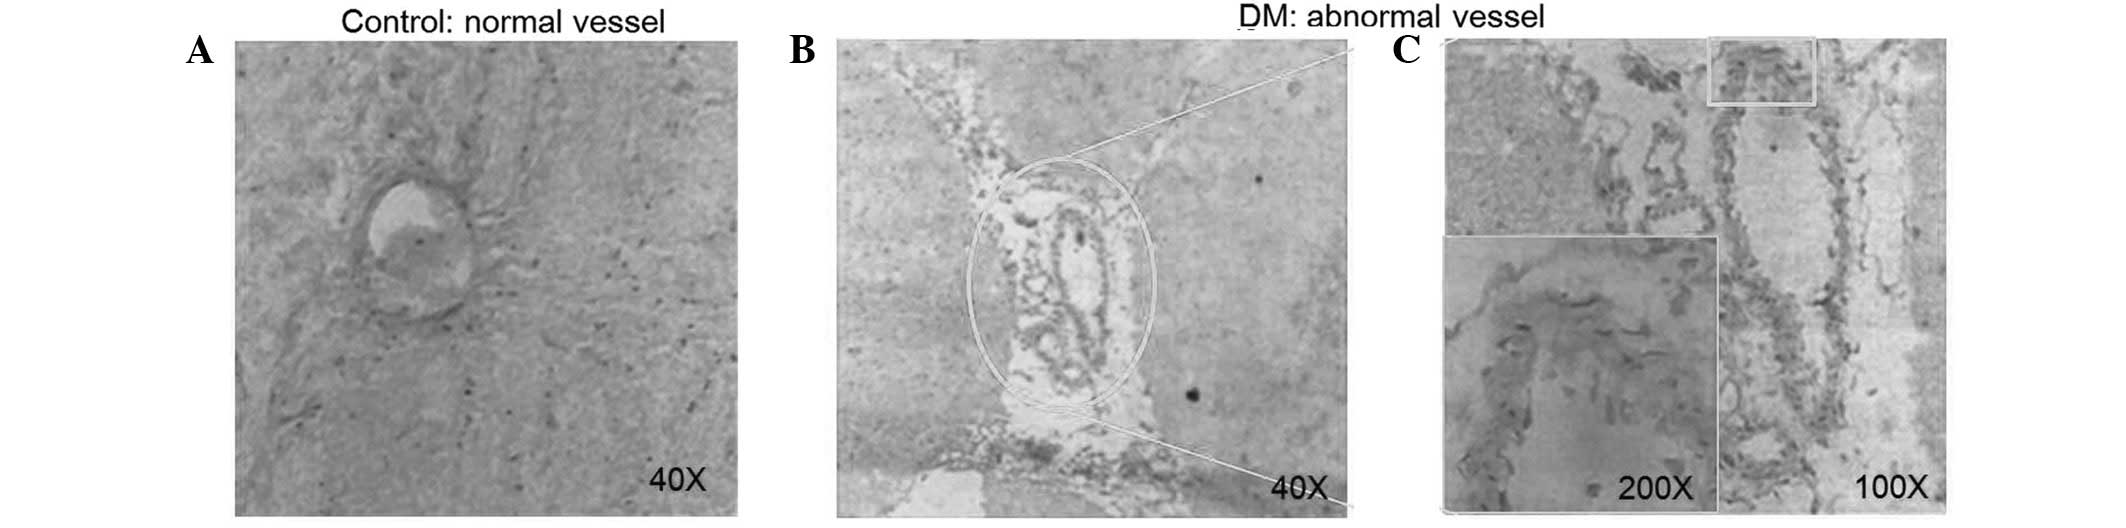
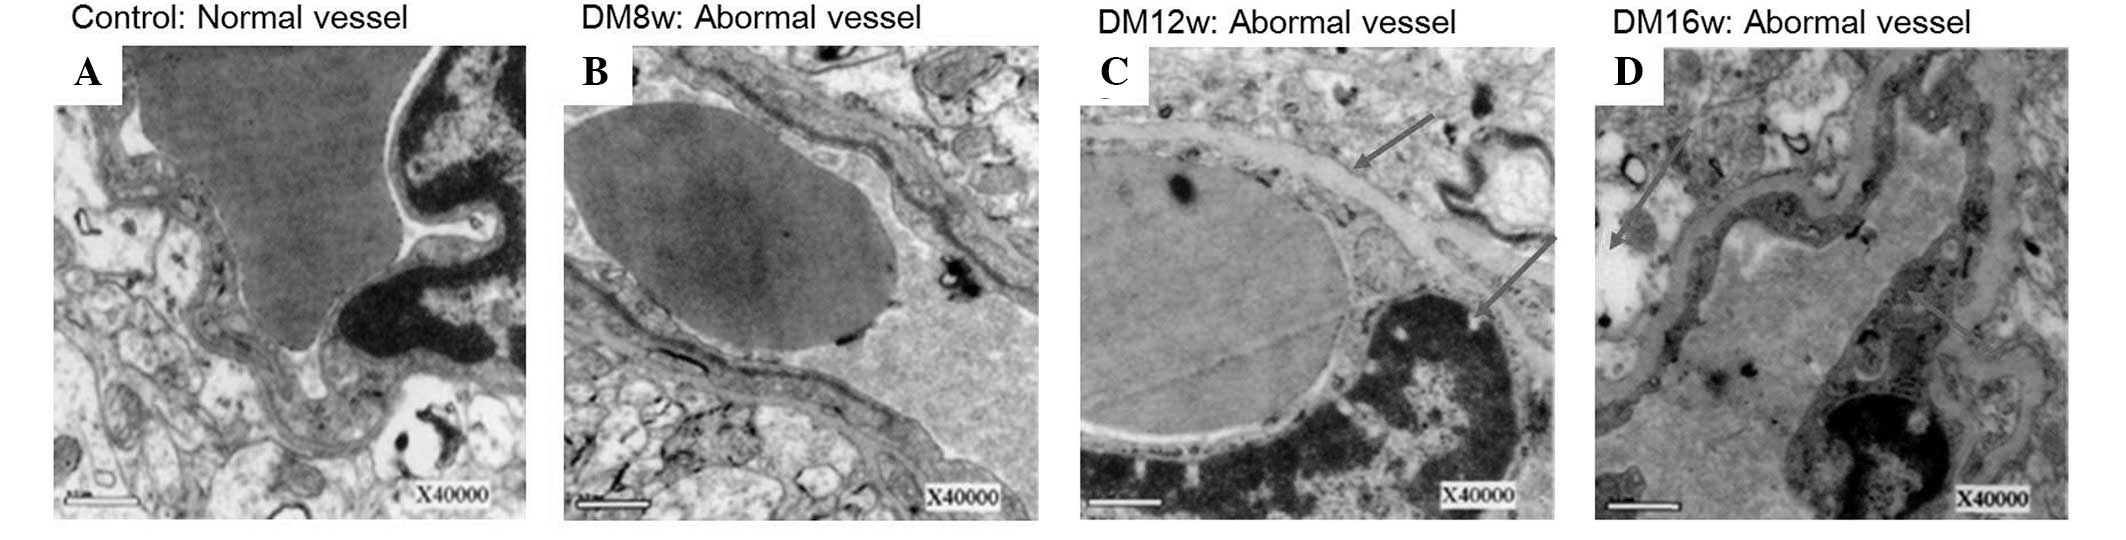
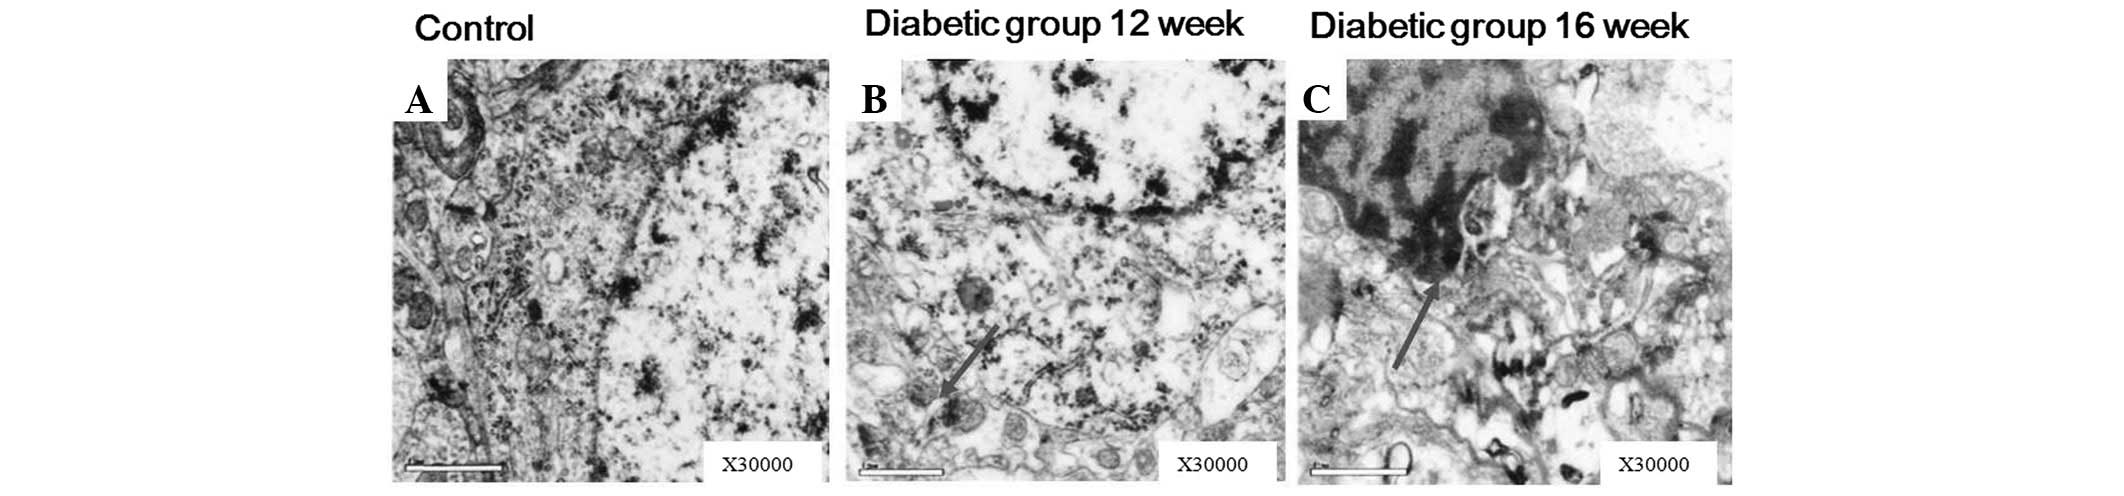
Varying degrees of pathological changes
on cerebral blood vessels and neural tissue with disease
progression of DM
To explore the pathological changes in various
stages of DM, vessels and neural cells in DM rat brains were
analyzed using electron microscopy. Lumen stenosis (Fig. 5B), vessel wall collapse (Fig. 5C), frame loss and endothelial cell
swelling and shedding (Fig. 5C)
was identified in vessels and vessel thickening and perivascular
edema development was revealed to increase with disease severity
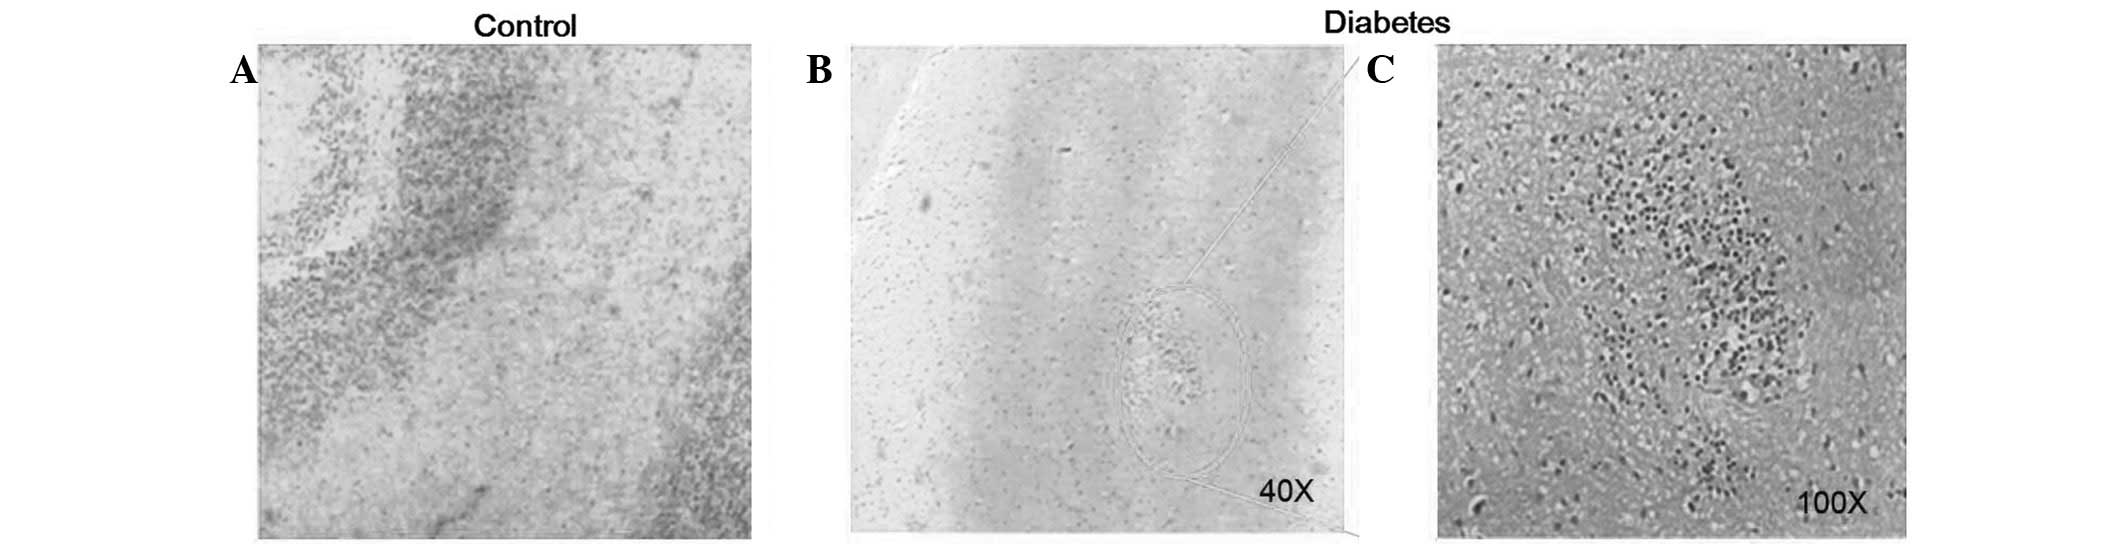
(Fig. 6). In addition,
proliferation of glial cells in the brain at week 8 following DM
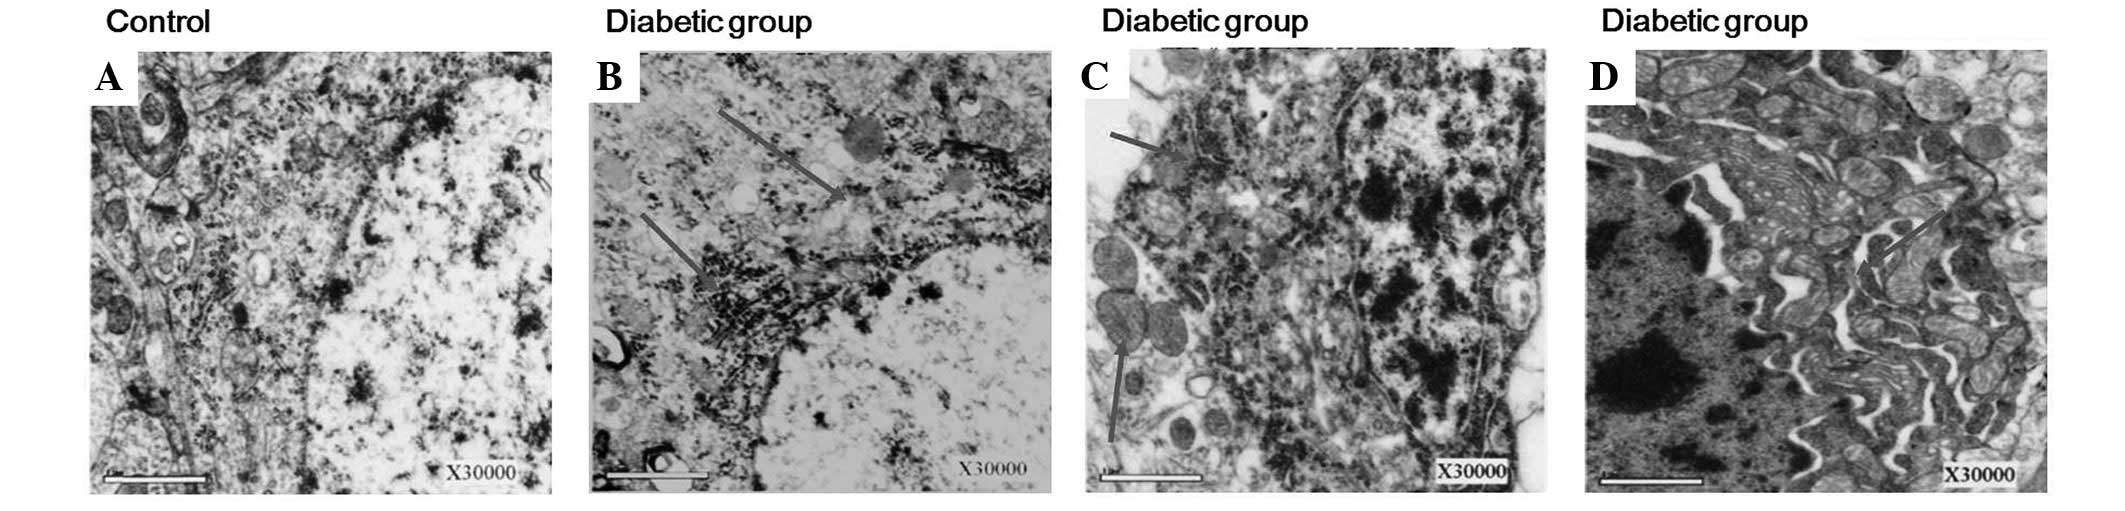
rat model establishment was observed (Fig. 7). Neuron cells were shrunken and
cell membranes became blurry at week 16 following DM onset
(Fig. 8). In addition, this damage
developed in the mitochondria, Golgi bodies and rough endoplasmic
reticulua of neuron cells (Fig.
9), clearly demonstrating that these pathological changes were
dependent on the time of disease progression (Fig. 10).
Discussion
In previous years, 30 genes from the hippocampus,
including the inhibitory neuropeptide galanin, synuclein γ and
uncoupling protein 2, as well as 22 genes from the prefrontal
cortex, including galanin receptor 2, protein kinase C γ and ɛ,
ATP-binding cassette A1, cluster of differentiation 47 and the
rearranged during transfection proto-oncogene, were found to
exhibit altered expression levels in T2 DM model animals compared
with non-DM controls using pathway analysis and validation of genes
by RT-PCR. Gene lists were identified to be partly overlapping and
included genes associated with neurotransmission, lipid metabolism,
neuronal development, insulin secretion, oxidative damage and DNA
repair (26). In DM, protein
glycation and glucose auto-oxidation leads to formation of free
radicals which induce lipid peroxidation (27). Increased lipid peroxidation impairs
membrane functions by decreasing membrane fluidity and changing the
activity of membrane-bound enzymes and receptors (28) and was observed in the present study
(Figs. 8-10). Oxidative stress in DM causes
disturbances at the level of subcellular organelles, including
mitochondrial damage which, in turn, generates further oxidative
stress inside the cell. With hyperglycemia and abnormalities in
serum lipids, DM is usually associated with microvascular and
macrovascular complications which are the major causes of morbidity
and mortality in diabetic individuals (29).
In the present study, elevated serum lipids were
observed in STZ-treated DM rats (Tables III and V). Lipids are important for the
pathogenesis of DM. Serum lipid levels are usually raised in DM and
represent a risk factor for brain disease. A previous study
demonstrated that elevated LDL, TG and TC and an increase in
STZ-induced HDL levels, may be beneficial for the prevention of
complications associated with DM, as well as improving lipid
metabolism (30). At early stages
following STZ injection, damage of brain tissue was limited,
despite rapid BG increase, indicating that BG was not associated
with antioxidant enzyme activities in DM rats during early stages
of the disease. Previously, variable antioxidant enzyme responses
to DM have been noted in brain tissues, with observations of either
unchanged, increased or decreased GSH reductase (31–33).
These results indicate that antioxidant enzyme activity varies
between tissue types and the severity of DM at various stages may
be a major contributing factor.
| Table VBlood glucose in various stages of
control and DM rat group establishment. |
Table V
Blood glucose in various stages of
control and DM rat group establishment.
| Blood glucose
concentration (mmol/l) |
|---|
|
|
|---|
| Stage of group
establishment | Control group | DM group | t-value |
|---|
| High-fat diet for 4
weeks | 6.55±1.34 | 6.61±1.43 | 1.457 |
| STZ injection
1 | 6.13±1.43 | 17.78±3.69 | 7.547a |
| Prior to STZ
injection 2 | 6.80±1.32 | 15.80±2.76 | 7.114a |
| Following STZ
injection 2 | 6.84±3.40 | 18.61±3.65 | 10.098a |
| Week 16 following
model establishment | 6.53±1.83 | 20.06±4.76 | 11.849a |
In the present study, experimental DM was observed
to increase SOD and reduce CAT protein levels in brain tissue at
week 8 following STZ-induction (Figs.
2 and 1B). Previous studies on
the effects of experimental DM on SOD or CAT activities in tissues
have been inconsistent (34–37)
and are likely to be dependent on several factors, including
differential baseline expression of these enzymes and techniques
used to generate the DM animals. In addition, oxidative stress is
widely accepted as a key mediator in the development and
progression of DM and its complications, due to the increased
production of free radicals and impaired antioxidant defenses
(5). The present findings revealed
that SOD and CAT activities decreased in the cortex, hippocampus
and vessels at week 16 following DM onset. SOD is a protective
enzyme that selectively scavenges the superoxide anion radical
(O2−•) by catalyzing its dismutation to
hydrogen peroxide (H2O2). CAT catalyzes the
degradation of H2O2 to water and
O2. An additional study demonstrated that SOD and CAT
activities were increased in livers of alloxan-induced DM rats
(38). Di Naso et
al(39) reported that
exogenous antioxidant Cu-Zn SOD decreased liver peroxidation and
increased nitric oxide synthase in DM rats. Considering the
pathophysiology of DM and the results presented in this study, we
hypothesize that differences in oxidative stress parameters may be
associated, at least in part, with brain metabolism. GPx levels in
DM rat brains first increased at week 8 and then markedly decreased
at week 16 following STZ-induction (Fig. 1B), consistent with blood serum GPx
levels presented in Fig. 1C. All
measured oxidative stress quenching enzyme activities (SOD, CAT and
GPx) were reduced at week 16, whereas transcription of GPx and
Cu-Zn-SOD were enhanced at this time. Concomitant AR accumulation
in the same tissue was present at week 8 (Fig. 4). We hypothesize that in the first
8 weeks following STZ-induction of DM, oxidative stress increases,
but is compensated, in part, by maintained levels of GPx (Fig. 1B) and accumulation of SOD (Fig. 2), however CAT levels are already
reduced. At the same time AR accumulates in neuron cells (Fig. 4), leading to increased NADPH
depletion and reduced GSH production. At week 16, AR expression is
enhanced further and Cu-Zn-SOD and GPx transcription and enzymatic
activities and CAT levels in the brain tissues are markedly
reduced, leading to accumulation of cell damage caused by oxidative
stress, which was only partly visible at week 8 of DM onset
(Figs. 5-10).
Based on the current study, STZ treatment is
associated with oxidative stress in brain tissues. Prolonged DM
with a high-fat diet led to AR accumulation and concomitant
depletion of GPx, SOD and CAT activities in the neuron cells of
rats, leading to pathological changes of cortex, hippocampus and
vessel cell structures caused by accumulation of oxidative stress
and reduced antioxidant enzyme activity.
Acknowledgements
The authors thank Dr Mingxing Ma for technical
assistance. The present study was supported by grants from the
Native Science Institutes of China (81060141), the Foundation
Research of Yunnan Province (2007C0013R) and the Special Foundation
of Kunming Medical University.
References
|
1
|
Piro S, Anello M, Di Pietro C, et al:
Chronic exposure to free fatty acids or high glucose induces
apoptosis in rat pancreatic islets: possible role of oxidative
stress. Metabolism. 51:1340–1347. 2002. View Article : Google Scholar : PubMed/NCBI
|
|
2
|
Biessels GJ and Gispen WH: The impact of
diabetes on cognition: what can be learned from rodent models?
Neurobiol Aging. 26(Suppl 1): 36–41. 2005. View Article : Google Scholar : PubMed/NCBI
|
|
3
|
Tomlinson DR and Gardiner NJ: Glucose
neurotoxicity. Nat Rev Neurosci. 9:36–45. 2008. View Article : Google Scholar
|
|
4
|
Magarinos AM and McEwen BS: Experimental
diabetes in rats causes hippocampal dendritic and synaptic
reorganization and increased glucocorticoid reactivity to stress.
Proc Natl Acad Sci USA. 97:11056–11061. 2000. View Article : Google Scholar
|
|
5
|
Ceriello A: New insights on oxidative
stress and diabetic complications may lead to a ‘causal’
antioxidant therapy. Diabetes Care. 26:1589–1596. 2003.
|
|
6
|
Roriz-Filho SJ, Sá-Roriz TM, Rosset I, et
al: (Pre)diabetes, brain aging and cognition. Biochim Biophys Acta.
1792:432–443. 2009. View Article : Google Scholar : PubMed/NCBI
|
|
7
|
Bonnefont-Rousselot D, Bastard JP, Jaudon
MC and Delattre J: Consequences of the diabetic status on the
oxidant/antioxidant balance. Diabetes Metab. 26:163–176.
2000.PubMed/NCBI
|
|
8
|
Tang WH, Martin KA and Hwa J: Aldose
reductase, oxidative stress, and diabetic mellitus. Front
Pharmacol. 3:872012.PubMed/NCBI
|
|
9
|
Obrosova IG, Van Huysen C, Fathallah L,
Cao XC, Greene DA and Stevens MJ: An aldose reductase inhibitor
reverses early diabetes-induced changes in peripheral nerve
function, metabolism and antioxidative defense. FASEB J.
16:123–125. 2002.
|
|
10
|
Oates PJ: Aldose reductase, still a
compelling target for diabetic neuropathy. Curr Drug Targets.
9:14–36. 2008. View Article : Google Scholar : PubMed/NCBI
|
|
11
|
Watala C, Kazmierczak P, Dobaczewski M, et
al: Anti-diabetic effects of 1-methylnicotinamide (MNA) in
streptozocin-induced diabetes in rats. Pharmacol Rep. 61:86–98.
2009. View Article : Google Scholar : PubMed/NCBI
|
|
12
|
Huang CC, Lee CC and Hsu KS: The role of
insulin receptor signaling in synaptic plasticity and cognitive
function. Chang Gung Med J. 33:115–125. 2010.PubMed/NCBI
|
|
13
|
Adeyi AO, Idowu BA, Mafiana CF, Oluwalana
SA, Ajayi OL and Akinloye OA: Rat model of food-induced
non-obese-type 2 diabetes mellitus: comparative pathophysiology and
histopathology. Int J Physiol Pathophysiol Pharmacol. 4:51–58.
2012.PubMed/NCBI
|
|
14
|
Islam MS and Choi H: Nongenetic model of
type 2 diabetes: a comparative study. Pharmacology. 79:243–249.
2007. View Article : Google Scholar : PubMed/NCBI
|
|
15
|
Zhang L, Zhang Y, Xia Q, et al: Effective
control of blood glucose status and toxicity in
streptozotocin-induced diabetic rats by orally administration of
vanadate in an herbal decoction. Food Chem Toxicol. 46:2996–3002.
2008. View Article : Google Scholar : PubMed/NCBI
|
|
16
|
Chavez M, Seeley RJ, Havel PJ, Friedman
MI, Matson CA, Woods SC and Schwartz MW: Effect of a high-fat diet
on food intake and hypothalamic neuropeptide gene expression in
streptozotocin diabetes. J Clin Invest. 102:340–346. 1998.
View Article : Google Scholar : PubMed/NCBI
|
|
17
|
Schaue D, Jahns J, Hildebrandt G and Trott
KR: Radiation treatment of acute inflammation in mice. Int J Radiat
Biol. 81:657–667. 2005. View Article : Google Scholar : PubMed/NCBI
|
|
18
|
Johansson LH and Borg LA: A
spectrophotometric method for determination of catalase activity in
small tissue samples. Anal Biochem. 174:331–336. 1988. View Article : Google Scholar : PubMed/NCBI
|
|
19
|
Kakkar P, Das B and Viswanathan PN: A
modified spectrophotometric assay of superoxide dismutase. Indian J
Biochem Biophys. 21:130–132. 1984.PubMed/NCBI
|
|
20
|
Tappel AL: Glutathione peroxidase and
hydroperoxides. Methods Enzymol. 52:506–513. 1978. View Article : Google Scholar : PubMed/NCBI
|
|
21
|
Allain CC, Poon LS, Chan CS, Richmond W
and Fu PC: Enzymatic determination of total serum cholesterol. Clin
Chem. 20:470–475. 1974.PubMed/NCBI
|
|
22
|
Cheng ML, Kammerer CM, Lowe WF, Dyke B and
VandeBerg JL: Method for quantitating cholesterol in subfractions
of serum lipoproteins separated by gradient gel electrophoresis.
Biochem Genet. 26:657–681. 1988. View Article : Google Scholar : PubMed/NCBI
|
|
23
|
Rainwater DL, Ludwig MJ, Haffner SM and
VandeBerg JL: Lipid and lipoprotein factors associated with
variation in Lp(a) density. Arterioscler Thromb Vasc Biol.
15:313–319. 1995. View Article : Google Scholar : PubMed/NCBI
|
|
24
|
Lopes-Virella MF, Stone P, Ellis S and
Colwell JA: Cholesterol determination in high-density lipoproteins
separated by three different methods. Clin Chem. 23:882–884.
1977.PubMed/NCBI
|
|
25
|
Friedewald WT, Levy RI and Fredrickson DS:
Estimation of the concentration of low-density lipoprotein
cholesterol in plasma, without use of the preparative
ultracentrifuge. Clin Chem. 18:499–502. 1972.PubMed/NCBI
|
|
26
|
Abdul-Rahman O, Sasvari-Szekely M, Ver A,
Rosta K, Szasz BK, Kereszturi E and Keszler G: Altered gene
expression profiles in the hippocampus and prefrontal cortex of
type 2 diabetic rats. BMC Genomics. 13:812012. View Article : Google Scholar : PubMed/NCBI
|
|
27
|
Baynes JW: Role of oxidative stress in
development of complications in diabetes. Diabetes. 40:405–412.
1991. View Article : Google Scholar : PubMed/NCBI
|
|
28
|
Baynes RD: Transferrin reduces the
production of soluble transferrin receptor. Proc Soc Exp Biol Med.
209:286–294. 1995. View Article : Google Scholar : PubMed/NCBI
|
|
29
|
Furukawa S, Fujita T, Shimabukuro M, et
al: Increased oxidative stress in obesity and its impact on
metabolic syndrome. J Clin Invest. 114:1752–1761. 2004. View Article : Google Scholar : PubMed/NCBI
|
|
30
|
Adewole SO and Ojewole JA: Protective
effects of Annona muricata Linn. (Annonaceae) leaf aqueous
extract on serum lipid profiles and oxidative stress in hepatocytes
of streptozotocin-treated diabetic rats. Afr J Tradit Complement
Altern Med. 6:30–41. 2008.
|
|
31
|
Kamalakkannan N and Stanely Mainzen Prince
P: Rutin improves the antioxidant status in streptozotocin-induced
diabetic rat tissues. Mol Cell Biochem. 293:211–219. 2006.
View Article : Google Scholar : PubMed/NCBI
|
|
32
|
Nazaroglu NK, Sepici-Dincel A and Altan N:
The effects of sulfonylurea glyburide on superoxide dismutase,
catalase and glutathione peroxidase activities in the brain tissue
of streptozotocin-induced diabetic rat. J Diabetes Complications.
23:209–213. 2009. View Article : Google Scholar
|
|
33
|
Ulusu NN, Sahilli M, Avci A, et al:
Pentose phosphate pathway, glutathione-dependent enzymes and
antioxidant defense during oxidative stress in diabetic rodent
brain and peripheral organs: effects of stobadine and vitamin E.
Neurochem Res. 28:815–823. 2003. View Article : Google Scholar
|
|
34
|
Huang WC, Juang SW, Liu IM, Chi TC and
Cheng JT: Changes of superoxide dismutase gene expression and
activity in the brain of streptozotocin-induced diabetic rats.
Neurosci Lett. 275:25–28. 1999. View Article : Google Scholar : PubMed/NCBI
|
|
35
|
Hunkar T, Aktan F, Ceylan A and Karasu C:
Effects of cod liver oil on tissue antioxidant pathways in normal
and streptozotocin-diabetic rats. Cell Biochem Funct. 20:297–302.
2002. View
Article : Google Scholar : PubMed/NCBI
|
|
36
|
Ozkaya YG, Agar A, Yargicoglu P, Hacioglu
G, Bilmen-Sarikcioglu S, Ozen I and Alicigüzel Y: The effect of
exercise on brain antioxidant status of diabetic rats. Diabetes
Metab. 28:377–384. 2002.PubMed/NCBI
|
|
37
|
Sechi LA, Ceriello A, Griffin CA, Catena
C, Amstad P, Schambelan M and Bartoli E: Renal antioxidant enzyme
mRNA levels are increased in rats with experimental diabetes
mellitus. Diabetologia. 40:23–29. 1997. View Article : Google Scholar : PubMed/NCBI
|
|
38
|
Bree AJ, Puente EC, Daphna-Iken D and
Fisher SJ: Diabetes increases brain damage caused by severe
hypoglycemia. Am J Physiol Endocrinol Metab. 297:E194–E201. 2009.
View Article : Google Scholar : PubMed/NCBI
|
|
39
|
Di Naso FC, Simoes Dias A, Porawski M and
Marroni NA: Exogenous superoxide dismutase: action on liver
oxidative stress in animals with streptozotocin-induced diabetes.
Exp Diabetes Res. 2011:7541322011.PubMed/NCBI
|