Introduction
Hepatic fibrosis refers to the excessive
accumulation of extracellular matrix (ECM) components in the liver.
It occurs in most types of chronic liver diseases, including liver
cirrhosis, liver failure, and portal hypertension, and often
requires liver transplantation (1). The activation of hepatic stellate
cells (HSCs) is an important event by which this cell type, which
is otherwise quiescent, expresses α-smooth muscle actin (α-SMA),
assumes a myofibroblastic phenotype and synthesizes fibrillar
collagens (2,3). Therefore, the inhibition of HSC
proliferation, the regulation of the HSC cell cycle, and the
facilitation of HSC apoptosis are important therapeutic approaches
for hepatic fibrosis-related liver diseases.
Taurine (2-aminoethanesulfonic acid) is an organic
acid which is abundant in the human body. Natural taurine (NTau)
has emerged as an alternative candidate for therapeutic
intervention since it is effective in preventing hepatic fibrosis
and reducing cirrhosis (4,5). Supplementation with exogenous taurine
is able to extensively inhibit the deposition of ECM and mitigate
the degree of hepatic fibrosis (2). Several studies have focused on the
specific gene regulation associated with the protective effect of
taurine against hepatic damage (6–8), but
the genome-wide genes, proteins and functional pathways underlying
the hepatic protection have yet to be fully elucidated.
Gene-expression profiling through microarray
analysis may shed light on useful clues to the taurine-mediated
gene regulation. Furthermore, a proteomics approach may also be
used to elucidate global protein expression and facilitate the
discovery of potential drug targets. However, studies using
microarray or proteomic technologies to investigate the molecular
mechanism of taurine treatment for liver diseases have not been
previously been conducted. Therefore, an integrative analysis of
transcriptome and proteome levels was designed to illuminate the
changes of gene and protein expression in human HSCs treated with
NTau.
Materials and methods
NTau extraction
NTau (2-aminoethanesulfonic acid) was extracted from
black clams (Meretrix meretrix L.). Briefly, the clam meats
were weighed and minced in an electrical blender (4000 rpm), for
~10 sec. The mince was further homogenized for 30 min after adding
distilled water (1 liter). The mixture was boiled in water for 30
min, followed by filtering through 4 layers of gauze. The residue
on the top of the gauze was discarded, and the filtrate was then
centrifuged (3000 rpm) to obtain the supernatant, which was then
de-acidified with HCl (HCl:H2O=3). After centrifuging,
the proteins were adjusted to a pH of 10 with a NaOH (20%) aqueous
solution to yield the de-alkalinated protein. Following adjustment
of the pH value to 5, the supernatant was further condensed. The
other unwanted amino acids and pigments were removed by column
chromatography using strong-acid cation-exchange resin as the solid
phase and eluting with distilled water. The resultant NTau was
quantitatively measured by high-performance liquid chromatography
(HPLC), and the purity of the NTau was determined to be 98.8%.
Cell culture
LX-2 human HSCs (purchased from the Cell Bank at
Xiangya Central Experiment Laboratory of Central South University,
Changsha, China) were cultivated at 37°C in Dulbecco’s modified
Eagle’s medium (DMEM; Gibco-BRL, Carlsbad, CA, USA), and were
supplemented with 10% fetal bovine serum (FBS) and
penicillin-streptomycin in a 5% CO2 humidified
incubator. Cells (1×10⁴ or 5×10⁵) were seeded
in 96-well plates or 35-mm dishes. The cells were cultured in
serum-free medium for 24 h and then treated with 40 mM NTau for 48
h.
Cell proliferation analysis
The proliferation activity of the LX-2 cells was
measured by a microculture tetrazolium (MTT) colorimetric assay.
LX-2 cells (1×10⁴ cells/ml) were cultured in 96-well
plates in DMEM with 10% FBS medium and then tranferred to
serum-free medium for an additional 24 h, and triplicate wells of
cells were incubated for 48 h in the presence 0–50 mM NTau. Cells
in the various treatment groups were then incubated with MTT [5
mg/ml in phosphate-buffered solution (PBS)] for 4 h before
harvesting. The optical density was measured using an ELISA reader
at 570 nm with a reference wavelength of 630 nm.
Cell cycle analysis
The LX-2 cells were incubated for 24 h in a 5-ml
cell culture flask in DMEM with 10% FBS medium and then cultured in
serum-free medium for an additional 24 h. The cells were treated
with 40 mM NTau for 48 h and then fixed with 70% ice-cold ethanol.
The fixed cells were permeabilized with PBST (137 mM NaCl, 3 mM
KCl, 8 mM NA2HPO4 and 0.1% Tween-20; pH 7.4)
and then stained with 100 mg/l RNase A and 50 mg/l propidium iodide
(PI) in the dark for cell cycle analysis. Cell cycle analysis was
performed on a Coulter ELITE flow cytometer (BD Biosciences,
Franklin Lakes, NJ, USA) through a 488-nm (LP) filter. The data
were analyzed using the MultiCycle AV software (Phoenix Flow
Systems, San Diego, CA, USA) for cell cycle distribution.
Apoptosis detection
LX-2 cells were incubated for 48 h in the presence
40 mM NTau and then re-suspended in 100 μl buffer containing
calcium ions. The cells were treated with 5 μl Annexin V-FITC dye
for 20–30 min and then with 5 μl PI dye for 5 min. The cell
concentration was adjusted to ~1×10⁵/ml by adding the
appropriate amount of calcium ion-containing buffer. The cells were
loaded on a flow cytometer (Coulter® Elite) within 1 h.
Apoptotic analysis was performed using a Coulter® Elite
flow cytometer (Beckman Coulter, Miami, FL, USA) with excitation
and emission wavelengths of 488 and 530 nm, respectively.
Two-dimensional electrophoresis
(2DE)
LX-2 cell lysates were collected and centrifuged at
14,000 rpm for 10 min at 4°C. The supernatants were analyzed by
2DE, and isoelectric focusing (IEF) was performed using an IPGphor
IEF system (Bio-Rad, Hercules, CA, USA). The protein extract (200
μg) was mixed with rehydration buffer to 350 μl and loaded onto
17-cm, immobilized, nonlinear pH gradient (IPG) dry strips (pH 4–7;
Bio-Rad). The IPG strips were equilibrated for 15 min in an
equilibration buffer (6 M urea, 30% glycerol, 2% SDS and 50 mM
Tris-HCl) containing 10 mg/ml dithiothreitol (DTT), followed by 15
min in an equilibration buffer containing 40 mg/ml iodoacetamide.
Following equilibration, strips were applied to 12% sodium dodecyl
sulphate-polyacrylamide gel electrophoresis (SDS-PAGE) gels and
sealed with agarose sealing solution. Following electrophoresis,
the SDS-PAGE gels were silver stained. Stained gels were scanned
using an image scanner (Amersham Biosciences, Piscataway, NJ, USA)
in transmission mode. Analysis of the gels was accomplished using
the PDQuest analysis software (Bio-Rad) including background
subtraction, spots detection and the establishment of a reference
gel. Protein spots were selected based on the criterion of
>2-fold variation of expression between NTau-treated and control
samples.
Mass spectrometry (MS) analysis
MS was performed on a UPLC-ESI-MS/MS
(Waters/Micromass, Manchester, UK) equipped with an electrospray
ionization (ESI) source. Data-dependent analysis was employed (the
3 most abundant ions in each cycle): 1 sec MS m/z 350-1,600, and
max 5 sec MS/MS m/z 50-2,000 (continuum mode), with 50 sec dynamic
exclusion. The positive-ion mode was employed, and the capillary
voltage was set at 3.0 kV. The cone voltage was set at 35 V to
investigate the intensities and distribution of ions in the mass
spectra of samples. The MS/MS spectra were processed, searched
using ProteinLynx Global SERVER™ (PLGS) v2.3 (Waters/Micromass),
and searched against the NCBInr database by MASCOT (http://www.matrixscience.co.uk) using the
following constraints: only tryptic peptides with up to 2 missed
cleavage sites were allowed and 0.3-Da mass tolerances for MS and
MS/MS fragment ions. The results were filtered by a peptide score
of ≥30.
Western blot analysis
Total proteins in LX-2 cell lysates were quantified
by the Bradford method (9,10) and analyzed on 12% SDS-PAGE gels.
The gels were transferred onto a nitrocellulose membrane using a
Trans-Blot SD apparatus (Bio-Rad). The membrane was incubated with
anti-IgY [dilution 1:1,000 in Tris-buffered saline (TBS)] followed
by incubation with secondary antibody (dilution 1:5,000 in TBS).
Visualization of the protein bands was achieved by the
chemiluminescence method, and the films were developed and fixed.
Glyeraldehyde-3-phosphate dehydrogenase (GAPDH) was used as an
internal reference.
Gene ontology (GO) analysis
GO is a stratified tree structure for the analysis
of the functions of genes and proteins (11). The 3 hierarchical principles of GO
are ‘Biological Process’ (BP), ‘Cellular Component’ (CC) and
‘Molecular Function’ (MF). We analyzed the functional distribution
of differential gene expression and protein production over the 3
principles. To accurately detect significantly over-represented GO
terms, the Database for Annotation, Visualization, and Integrated
Discovery (DAVID) tool (http://david.abcc.ncifcrf.gov) was used by analyzing
into the fourth layers (12). The
threshold value of group membership counts was set at 3, and the
EASE score was set at 0.1. Then, the functional annotation
clustering tool in DAVID was used to cluster functionally related
annotations into groups for a 2D view of the related gene-term
relationship (12). We ranked the
importance of annotation groups with an enrichment score. In
addition, we also used the DAVID tool to map differential gene
expression and protein production into the Kyoto Encyclopedia of
Genes and Genomes (KEGG) pathways database (13) to facilitate the biological
interpretation in a network context. Fisher’s exact test was used
and P<0.05 was considered to indicate a statistically
significant difference.
Microarray analysis
A genome-wide 70-mer oligonucleotide microarray
including 22,000 well-characterized human genes (14) was obtained from CapitalBio
Corporation (Beijing, China) to investigate the expression
profiling of NTau-treated LX-2 cells. The cDNA targets were
prepared from 5 μg total RNA and were labeled with fluorescent dyes
(Cy5 and Cy3-dCTP) by the Eberwine linear RNA amplification method
and a subsequent enzymatic reaction (14). The RNA samples from the
NTau-treated LX-2 cells were labeled with Cy3-dUTP and named as
‘1.’ The RNA samples from the blank control cells were labeled with
Cy5-dUTP and named as ‘2.’ We then prepared the hybridization
solution in hybridization buffer (25% formamide, 3X SSC, 0.2% SDS
and 5X Denhardt’s solution) and hybridized it with sample at 42°C
overnight in a humid environment. The hybridized microarrays were
scanned with a confocal LuxScan™ scanner (CapitalBio Corporation,
Beijing, China) at 2 wavelengths to detect emission from both Cy3
and Cy5. The images obtained were then analyzed using LuxScan™ 3.0
software (CapitalBio Corporation). Then, an intensity-dependent
locally weighted scatterplot-smoothing regression (LOWESS)
algorithm was used to normalize the 2-channel ratio values by an R
package (15).
Gene set enrichment analysis (GSEA)
GSEA is a software (https://www.broad.harvard.edu/gsea/) for searching in
predefined gene sets (ex. pathways) and ranking genes to identify
significant biological changes in microarray data sets (16). First, ratios of filtered genes were
operated by logarithm function to the base 1.5, and the input ‘rnk’
file was made based on the ranked value of
log1.5(ratio). These expression matrices were exported
to GSEA software and searched against the background dataset of
‘c4: computational gene sets’ with ‘GSEA Pre-ranked’ option. All
the default settings except ‘gene set permutation’ with 1,000
iterations were used for the analysis.
RNA extraction and real-time polymerase
chain reaction (PCR)
Total RNA was extracted using TRIzol (Invitrogen,
Gaithersburg, MD, USA) reagent according to the manufacturer’s
instructions. RNA was purified using the NucleoSpin RNA Clean-up
kit (Macherey-Nagel, Düren, Germany). RNA quality from each sample
was assessed by visualization of the 28S/18S ribosomal RNA ratio on
1% agarose gels. First-strand cDNA was synthesized using 1 μg total
RNA in a 20-μl final volume by reverse transcription utilizing
ReverTra Ace® reverse transcriptase (Toyobo, Co., Ltd.,
Osaka, Japan) with random hexamer primers or oligo(dT)18
primers (Invitrogen). PCR was performed using 0.5 μl cDNA, with
specific primers and Ex Taq™ Polymerase (Takara Bio, Inc., Otsu,
Japan) in a volume of 12.5 μl. The PCR products were then separated
on 1.5% agarose gels. The real-time PCR reactions were performed
using iQ™ SYBR®-Green Supermix kit according to the
manufacturer’s instructions (Bio-Rad). RNA was amplified using the
ABI Prism 7500 Sequence Detection system (Applied Biosystems,
Carlsbad, CA, USA). The primers (Invitrogen) are shown in Table I. For all the real-time PCR
experiments, negative controls were a non-reverse transcriptase
reaction, and a non-sample reaction (data not shown). GAPDH was
amplified as an internal standard.
 | Table IPrimers used for real-time PCR of the
cox5a, cox6c, ndufb1, ndufc1 and
tgfβ1|1 genes. |
Table I
Primers used for real-time PCR of the
cox5a, cox6c, ndufb1, ndufc1 and
tgfβ1|1 genes.
| Genes | Primer | Sequence
(5′-3′) | Temperature
(°C) | Product size
(bp) |
|---|
| cox5a | Forward |
TAAACCGCATGGATGGGC | 49 | 177 |
| Reverse |
AGTTCAAACTCATTTCCCTTTTATT | | |
| cox6c | Forward |
GGGGTTGCAGCTTTGTAT3 | 49 | 112 |
| Reverse |
CAGCCTTCCTCATCTCCT | | |
| ndufc1 | Forward |
CCGAATGCCAAACCTGAC | 49 | 127 |
| Reverse |
ATTCCAGCCCATTTCTTC | | |
| ndufb1 | Forward |
TTCCCTGTTGCCCTTGGT | 53.1 | 158 |
| Reverse |
AGCCGTTCATCACTCTTTCTGT | | |
| tgfβ1|1 | Forward |
TTCTGCTGCGTCAGTTGC | 57.4 | 154 |
| Reverse |
TGAGCGCCGAGATGTAGTT | | |
| gapdh | Forward |
GACCTGACCTGCCGTCTA | 56 | 148 |
| Reverse |
AGGAGTGGGTGTCGCTGT | | |
Statistical analysis
All experiments were performed ≥3 times with
triplicate measurements, and data are expressed as the mean ±
standard error of the mean (SEM). Statistical analysis was
performed using the R software (version 2.9.2, http://www.r-project.org/). Student’s t-test was
performed to evaluate the differences of cell proliferation rate
among the groups treated with different concentrations of NTau. The
Student’s t-test was also used to evaluate the gene expression
changes in real-time PCR results between 2 phenotypes. The
Chi-square test was used to assess the effect of NTau on the cell
cycle of HSCs. Fisher’s exact test was used to identify the
significant GO terms of target genes relative to genome
backgrounds. P<0.05 was considered to indicate a statistically
significant difference.
Results
Effect of NTau on cell proliferation and
cell cycle of HSCs
As shown in Fig. 1,
an inverse correlation between the proliferation of LX-2 cells and
the concentration of NTau was detected. Treatment with different
concentrations of NTau significantly inhibited the growth of LX-2
cells when compared with that of the non-treated control cells
(one-way ANOVA, P<0.005). The growth rate of LX-2 cells in the
presence of 30–40 mmol/l NTau was reduced by 43% compared with that
of the non-treated cells. As assessed by cell cycle analysis, the
percentage of LX-2 cells in the G0/G1 phase increased from 43.9 to
50.9% in response to 40 mmol/l NTau, while exposure of the LX-2
cells to 40 mmol/l NTau for 48 h caused a 1- to 3-fold reduction
(P<0.04) of the S- and G2/M-phase cell populations compared with
those in the non-treated control cells.
Detection of NTau-induced apoptosis in
HSCs
To investigate the mechanism underlying the
growth-inhibitory effects of NTau on HSCs, the cell-apoptosis
analysis of NTau-treated LX-2 cells was performed. As shown in
Fig. 2, the increase in apoptotic
cells in the NTau-treated LX-2 cells was comparable to that in the
non-treated control cells (13.6±3.3 vs. 4.65±1.1%, P<0.05).
These findings suggest that the induction of cellular apoptosis
contributed, at least in part, to the HSC growth-inhibiting effects
of NTau.
Identification of differentially
expressed proteins in HSCs following NTau treatment
The protein profiles of HSCs were analyzed by 2DE
and visualized using the PDQuest image analysis software. By
comparing the protein profiles of the NTau-treated and non-treated
control HSCs, 15 differentially expressed proteins were
successfully identified. We picked up protein spots in the 2D gel
image with identified changes and prepared them for MS analysis.
Table II summarizes the code
name, relative molecular weight, isoelectric point, and peptide
fragment coverage for the differentially expressed proteins. The
most significantly upregulated expression was of CAA32649, MYL9,
PSMB6, ANXA1, MDH1, HSPB1, LASP1, LOC100134370, and SOD1, while
ATP5H, BAF82933, ECHS1, PRDX2, HNRNPA2B1, and BAG36698 showed the
most markedly downregulated protein expression.
| Table IIDifferentially expressed proteins in
taurine-treated vs. control HSCs. |
Table II
Differentially expressed proteins in
taurine-treated vs. control HSCs.
| Protein_ID | GI | Gene | Log2 (ratio) | Description | Relative molecular
weight (kDa) | Isoelectric
point | Peptide fragment
coverage (%) |
|---|
| Upregulated |
| Protein 1394 | 28317 | CAA32649 | 4.247 | Unnamed protein
product | 59.5 | 5.17 | 27 |
| Protein 1431 | 29568111 | MYL9 | 3.295 | Myosin regulatory
light chain 9 isoform A | 19.8 | 4.80 | 62 |
| Protein 1380 | 558528 | PSMB6 | 2.621 | Proteasome
(prosome, macropain) subunit, β type, 6 | 25.3 | 4.80 | 26 |
| Protein 6 | 4502101 | ANXA1 | 1.483 | Annexin I | 38.7 | 6.57 | 53 |
| Protein 8 | 5174539 | MDH1 | 1.180 | Cytosolic malate
dehydrogenase | 36.4 | 6.91 | 17 |
| Protein 3 | 4504517 | HSPB1 | 0.989 | Heat shock protein
β-1 | 22.8 | 5.98 | 49 |
| Protein 7 | 5453710 | LASP1 | 0.953 | LIM and SH3 protein
1 | 29.7 | 6.61 | 34 |
| Protein 1 | 169204721 | LOC100134370 | 0.703 | Predicted:
hypothetical protein | 54.2 | 6.32 | 43 |
| Protein 5 | 2982080 | SOD1 | 0.504 | Superoxide
dismutase 1, soluble | 15.9 | 5.87 | 45 |
| Downregulated |
| Protein 10 | 5453559 | ATP5H | −0.663 | ATP synthase,
H+ transporting, mitochondrial F0 complex, subunit d
isoform A | 18.5 | 5.21 | 47 |
| Protein 2 | 158261511 | BAF82933 | −0.704 | Unnamed protein
product | 49.5 | 4.86 | 4 |
| Protein 4 | 194097323 | ECHS1 | −0.825 | Mitochondrial
short-chain enoyl-coenzyme A hydratase 1 precursor | 31.4 | 8.34 | 30 |
| Protein 9 | 9955007 | PRDX2 | −1.135 | Peroxiredoxin
2 | 21.8 | 5.44 | 38 |
| Protein 953 | 14043072 | HNRNPA2B1 | −1.864 | Heterogeneous
nuclear ribonucleoprotein A2/B1 isoform B1 | 37.4 | 8.97 | 15 |
| Protein 1165 | 189054178 | BAG36698 | −2.812 | Unnamed protein
product | 66.0 | 7.62 | 17 |
Functional analysis of differentially
expressed proteins in HSCs following NTau treatment and validation
of proteomic data
We analyzed the functional enrichment of the
differentially expressed proteins using the DAVID tool based on
their annotation keywords from the UniProt database (17). Significant protein functions terms
and corresponding proteins were identified (Fisher’s exact test,
P<0.05). As shown in Table
III, proteins that corresponded to the category of
‘acetylation,’ ‘direct protein sequencing,’ ‘antioxidant,’
‘cytoplasm’ and ‘oxidoreductase’ were significantly affected in the
NTau-treated HSCs.
| Table IIIFunctional enrichment analysis based
on the annotation keywords of proteins. |
Table III
Functional enrichment analysis based
on the annotation keywords of proteins.
| Term | P-value | Proteins | Fold
enrichment |
|---|
| Acetylation | 6.8E-09 | PRDX2, ATP5H, MDH1,
MYL9, HSPB1, LASP1, SOD1, ECHS1 | 20.79 |
| Direct protein
sequencing | 1.0E-06 | PRDX2, PSMB6,
ATP5H, MDH1, HSPB1, HNRNPA2B1, SOD1, ECHS1 | 10.04 |
| Antioxidant | 5.5E-03 | PRDX2, SOD1 | 328.10.. |
| Cytoplasm | 5.9E-03 | PRDX2, PSMB6, MDH1,
LASP1, SOD1, ANXA1 | 4.08 |
| Oxidoreductase | 4.7E-02 | PRDX2, MDH1,
SOD1 | 7.70 |
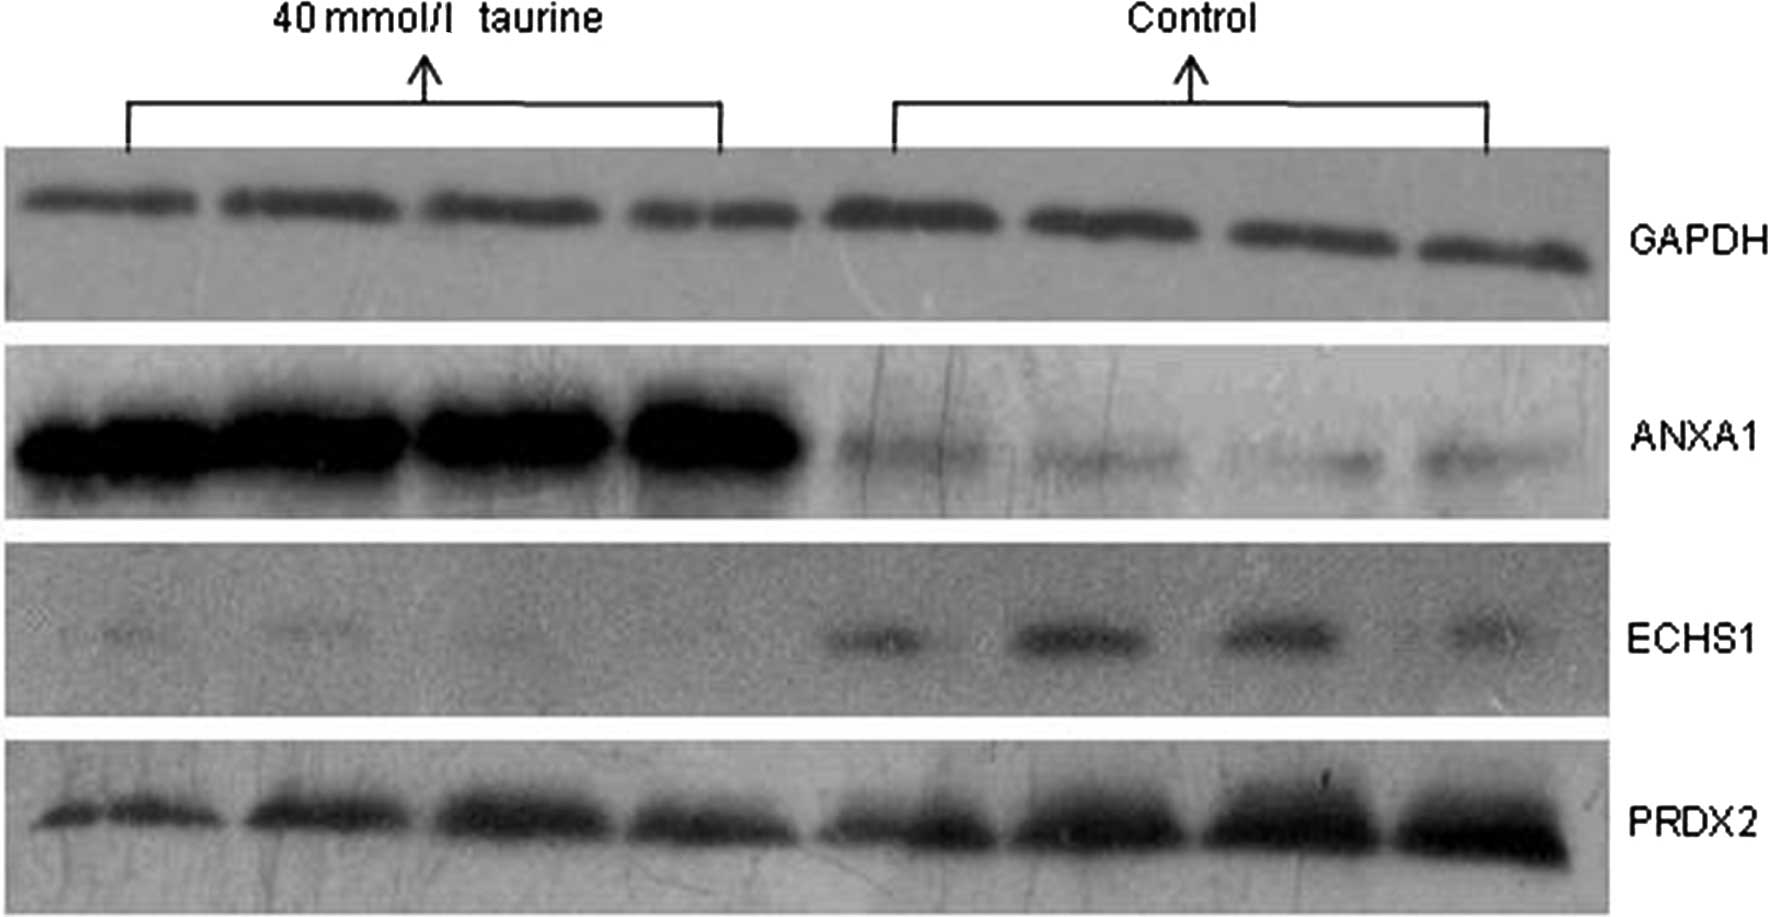
Among the differentially expressed proteins
identified successfully by MS, the upregulated proteins ANXA1 and
PSMB6 and the downregulated proteins ECHS1 and PRDX2 were selected
and subjected to western blot analysis. As shown in Fig. 3, NTau treatment significantly
upregulated the expression of ANXA1 and downregulated the
expression of ECHS1 and PRDX2 in HSCs. The expression of PSMB6 was
not significantly different following NTau treatment. Therefore,
western blot analysis of the differentially expressed proteins
confirmed the reliability and validity of the proteomic high
throughput experiments.
Differential gene expression in HSCs
following NTau treatment
According to the filtering principles described
above, 6,109 normally expressed genes (28.38%) with high confidence
were screened among 21,522 genes. By applying the threshold of
1.5-fold change for an intensity ratio of NTau-treated vs. control
HSCs, 658 genes (3.06%) were shown to be differentially expressed
in NTau-treated HSCs. Among the differentially expressed genes, 241
were upregulated (1.12%) and 417 were downregulated (1.94%). The
top 9 upregulated and the top 10 downregulated genes are presented
in Table IV.
| Table IVTop 9 upregulated and top 10
downregulated genes in taurine-treated vs. control HSCs. |
Table IV
Top 9 upregulated and top 10
downregulated genes in taurine-treated vs. control HSCs.
| Gene | RefSeq_ID | Description |
log1.5(ratio) |
|---|
| Top 9
upregulated |
| hdac3 | NM_003883 | Histone deacetylase
3 | 1.8950 |
|
tgfβ1i1 | NM_015927 | Transforming growth
factor β1-induced transcript 1 | 1.8773 |
|
tmem120a | NM_031925 | Transmembrane
protein induced by tumor necrosis factor-α | 1.8526 |
| cyp2e1 | NM_000773 | Cytochrome P450,
family 2, subfamily E, polypeptide 1 | 1.7893 |
| hrh1 | NM_000861 | Histamine receptor
H1 | 1.7789 |
| selt | NM_016275 | Selenoprotein
T | 1.6962 |
| ccdc86 | NM_024098 | Coiled-coil domain
containing 86 | 1.6648 |
| mif4gd | NM_020679 | MIF4G domain
containing | 1.6570 |
| psap | NM_002778 | Prosaposin (variant
Gaucher disease and variant metachromatic leukodystrophy) | 1.6430 |
| Top 10
downregulated |
| nucb2 | NM_005013 | Nucleobindin 2 | −2.7135 |
| adam9 | NM_003816 | A disintegrin and
metalloproteinase domain 9 (meltrin γ) | −2.7336 |
| tpp2 | NM_003291 | Tripeptidyl
peptidase II | −2.7350 |
| abce1 | NM_002940 | ATP-binding
cassette, sub-family E (OABP), member 1 | −2.7956 |
| mtif2 | NM_002453 | Mitochondrial
translational initiation factor 2 | −2.8257 |
| pkn2 | NM_006256 | Protein kinase
N2 | −3.2762 |
| ndufb1 | NM_004545 | NADH dehydrogenase
(ubiquinone) 1 β subcomplex, 1, 7 kDa | −3.6023 |
| brcc3 | NM_024332 |
BRCA1/BRCA2-containing complex, subunit
3 | −3.6603 |
|
adamtsl3 | NM_207517 | ADAMTS-like 3 | −3.7298 |
| adam9 | NM_003816 | A disintegrin and
metalloproteinase domain 9 (meltrin γ) | −5.9415 |
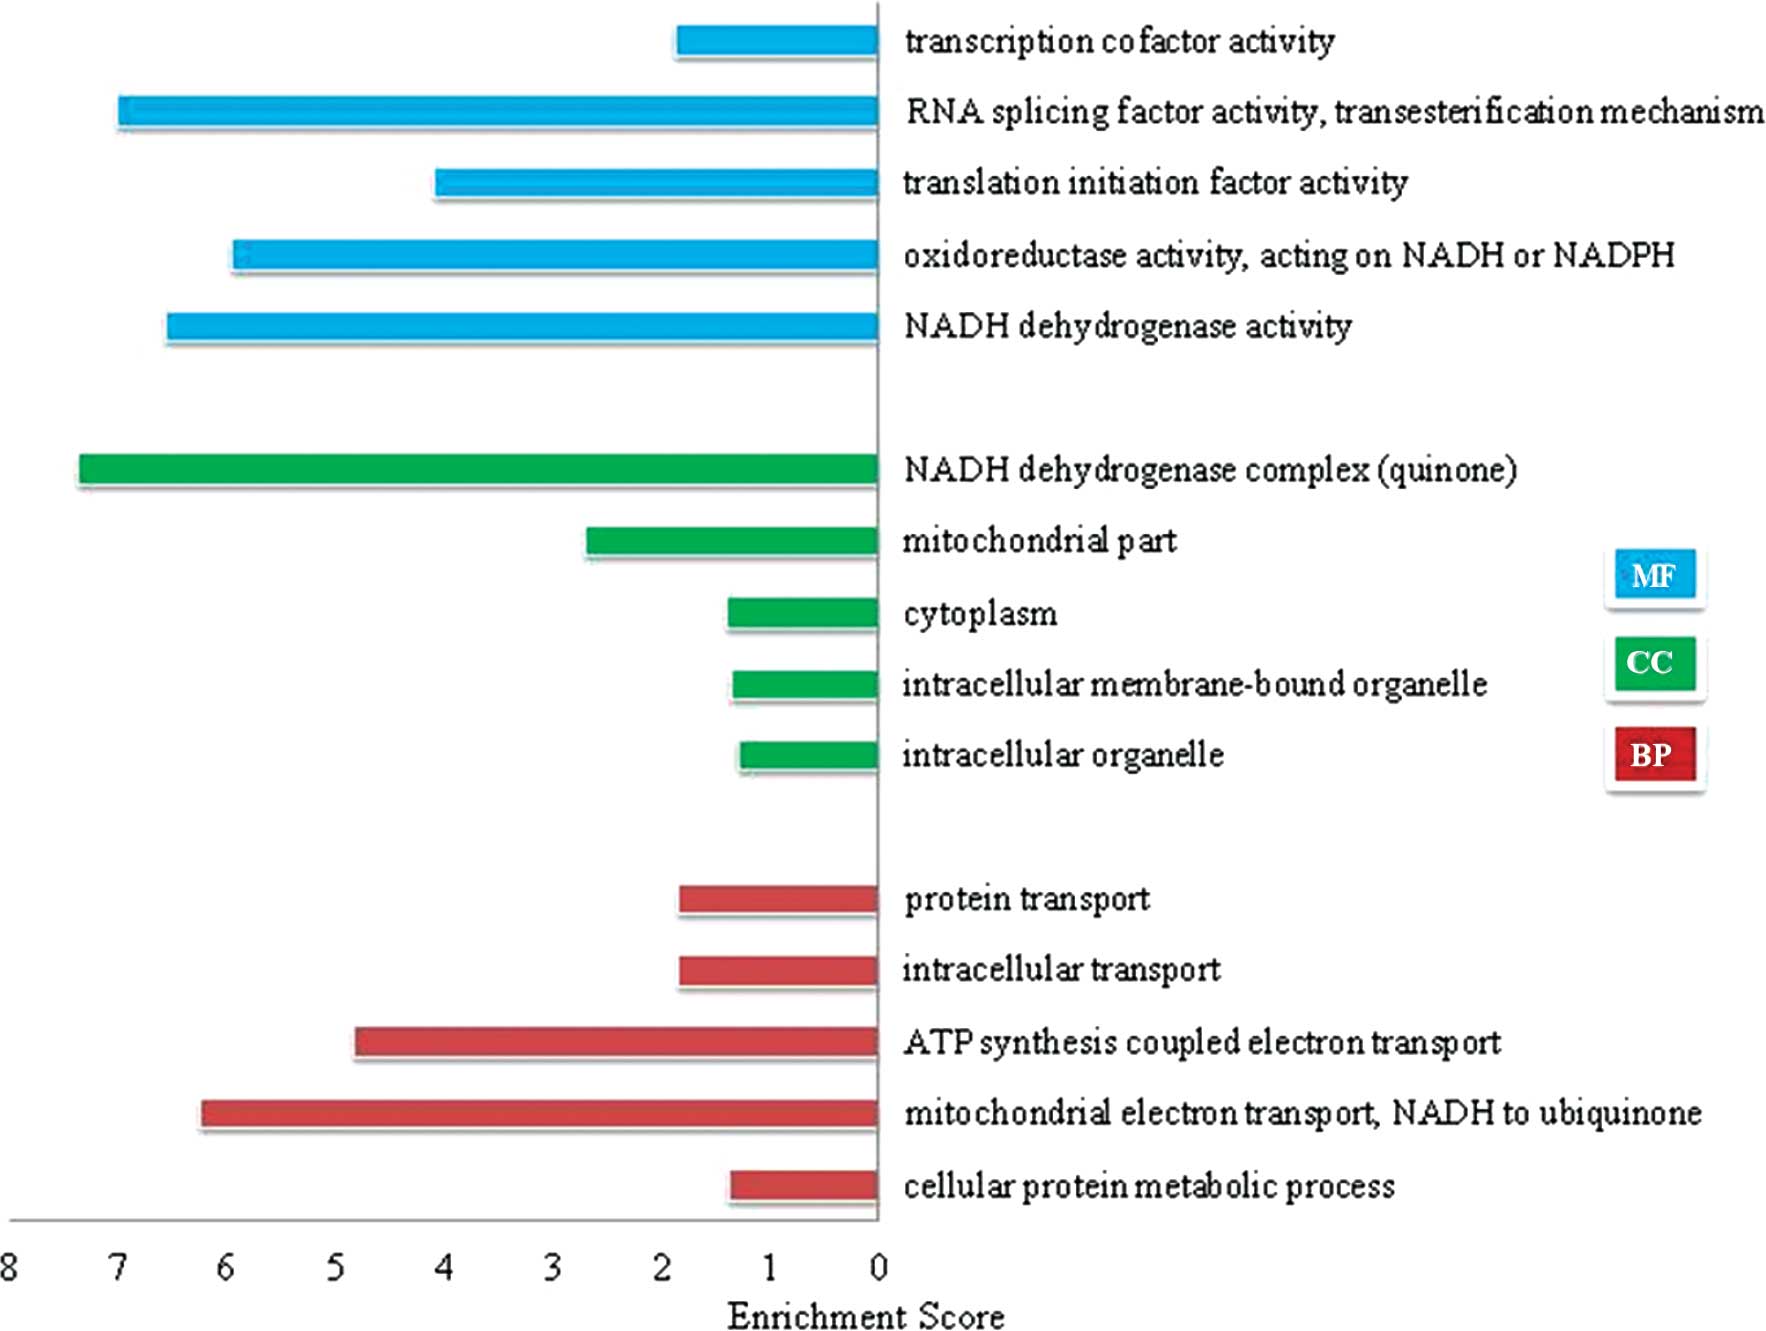
Functional categorization and clustering
for the differentially expressed genes
The differentially expressed genes were then
categorized according to their GO function using the DAVID tool.
Six function categories of ‘Molecular Function’ (MF), 51 function
categories of ‘Cellular Component’ (CC), and 42 function categories
of ‘Biological Process’ (BP) were significantly enriched in the
differentially expressed genes (Fisher’s exact test, P<0.05).
Fig. 4 lists the top 5
significantly enriched GO terms identified after screening with a
threshold of false discovery rate (FDR) of <0.01. Functional
categorization of the GO terms demonstrated that these
differentially expressed genes were strongly associated with
biological processes of ‘NADH reduction and oxidation reaction’ and
‘RNA processing’. Based on the analysis above, the heuristic fuzzy
clustering was used to classify the groups of similar annotations
by the κ statistic values (18).
Table V provides a visualized
network of the 9 significantly enriched GO terms (geometric mean of
member’s P-value, P<0.05). Clusters 1, 2, 3, 4, 7 and 9
correspond to the categories of ‘cellular transport and
translation,’ ‘oxidant reaction’ and ‘mitosis process,’
respectively. This suggests a crucial role of these biological
processes in NTau-treated HSCs.
| Table VFunctional annotation clustering
analysis of the differentially expressed genes. |
Table V
Functional annotation clustering
analysis of the differentially expressed genes.
| Category | Term | Percentage | P-value | Fold
enrichment |
|---|
| Functional group
1 | Geo:
4.6040E-15 | | | |
| GOTERM_CC_4 |
GO:0044424-intracellular part | 0.6873 | 4.45E-22 | 1.2591 |
| GOTERM_CC_4 |
GO:0043229-intracellular organelle | 0.5937 | 7.00E-17 | 1.2999 |
| GOTERM_CC_4 |
GO:0043231-intracellular membrane-bound
organelle | 0.5349 | 5.09E-16 | 1.3499 |
| GOTERM_CC_4 |
GO:0005634-nucleus | 0.3254 | 2.83E-05 | 1.2661 |
| Functional group
2 | Geo: 1.4710E-9 | | | |
| GOTERM_CC_4 |
GO:0019866-organelle inner membrane | 0.0603 | 2.33E-11 | 3.6125 |
| GOTERM_CC_4 |
GO:0031967-organelle envelope | 0.0825 | 2.28E-10 | 2.6796 |
| GOTERM_CC_4 |
GO:0044429-mitochondrial part | 0.0778 | 6.55E-10 | 2.6988 |
| GOTERM_CC_4 |
GO:0005743-mitochondrial inner
membrane | 0.0540 | 9.73E-10 | 3.4607 |
| GOTERM_CC_4 |
GO:0005739-mitochondrion | 0.1127 | 2.203E-09 | 2.1238 |
| GOTERM_CC_4 |
GO:0044455-mitochondrial membrane
part | 0.0333 | 2.326E-09 | 5.26001 |
| GOTERM_CC_4 |
GO:0031966-mitochondrial membrane | 0.0603 | 4.029E-09 | 3.0154 |
| GOTERM_CC_4 |
GO:0005740-mitochondrial envelope | 0.0619 | 4.501E-09 | 2.9486 |
| GOTERM_CC_4 |
GO:0031090-organelle membrane | 0.1429 | 5.406E-09 | 1.8718 |
| GOTERM_CC_4 |
GO:0005746-mitochondrial respiratory
chain | 0.0254 | 2.795E-08 | 6.2282 |
| Functional group
3 | Geo: 5.5926E-7 | | | |
| GOTERM_CC_4 |
GO:0005743-mitochondrial inner
membrane | 0.0540 | 9.73E-10 | 3.4607 |
| GOTERM_CC_4 |
GO:0044455-mitochondrial membrane
part | 0.0333 | 2.33E-09 | 5.2601 |
| GOTERM_CC_4 |
GO:0005746-mitochondrial respiratory
chain | 0.0254 | 2.80E-08 | 6.2282 |
| GOTERM_CC_4 | GO:0030964-NADH
dehydrogenase complex (quinone) | 0.0175 | 1.56E-06 | 7.3688 |
| GOTERM_CC_4 |
GO:0005747-mitochondrial respiratory chain
complex I | 0.0175 | 1.56E-06 | 7.3688 |
| GOTERM_CC_4 |
GO:0045271-respiratory chain complex
I | 0.0175 | 1.56E-06 | 7.3688 |
| GOTERM_MF_4 | GO:0003954-NADH
dehydrogenase activity | 0.0190 | 1.56E-06 | 6.5705 |
| GOTERM_MF_4 |
GO:0016655-oxidoreductase activity, acting
on NADH or NADPH, quinone or similar compound as acceptor | 0.0190 | 4.22E-06 | 5.9640 |
| GOTERM_BP_4 |
GO:0006120-mitochondrial electron
transport, NADH to ubiquinone | 0.0159 | 2.38E-05 | 6.2590 |
| GOTERM_BP_4 | GO:0042773-ATP
synthesis coupled electron transport | 0.0175 | 8.01E-05 | 4.8297 |
| Functional group
4 | Geo: 3.9490E-6 | | | |
| GOTERM_CC_4 | GO:0044428-nuclear
part | 0.1175 | 1.01E-08 | 2.0090 |
| GOTERM_CC_4 |
GO:0044451-nucleoplasm part | 0.0540 | 1.50E-05 | 2.2883 |
| GOTERM_CC_4 |
GO:0005654-nucleoplasm | 0.0587 | 2.47E-05 | 2.1445 |
| GOTERM_CC_4 | GO:0031981-nuclear
lumen | 0.0698 | 6.50E-05 | 1.9002 |
| Functional group
5 | Geo: 1.9522E-4 | | | |
| GOTERM_BP_4 |
GO:0046907-intracellular transport | 0.0714 | 9.11E-05 | 1.8540 |
| GOTERM_BP_4 | GO:0015031-protein
transport | 0.0698 | 0.0001 | 1.8571 |
| GOTERM_BP_4 |
GO:0045184-establishment of protein
localization | 0.0714 | 0.0002 | 1.7769 |
| GOTERM_BP_4 |
GO:0006886-intracellular protein
transport | 0.0460 | 0.0003 | 2.1064 |
| GOTERM_BP_4 |
GO:0051649-establishment of cellular
localization | 0.0794 | 0.0004 | 1.6695 |
| Functional group
6 | Geo: 0.0010 | | | |
| GOTERM_BP_4 |
GO:0051246-regulation of protein metabolic
process | 0.0381 | 0.0003 | 2.2997 |
| GOTERM_BP_4 |
GO:0009889-regulation of biosynthetic
process | 0.0286 | 0.0007 | 2.5580 |
| GOTERM_MF_4 |
GO:0003743-translation initiation factor
activity | 0.0159 | 0.0007 | 4.0893 |
| GOTERM_BP_4 |
GO:0006446-regulation of translational
initiation | 0.0127 | 0.0008 | 5.1161 |
| GOTERM_BP_4 |
GO:0006417-regulation of translation | 0.0254 | 0.0009 | 2.7050 |
| GOTERM_BP_4 |
GO:0022618-protein-RNA complex
assembly | 0.0190 | 0.0019 | 3.0432 |
| GOTERM_BP_4 |
GO:0031326-regulation of cellular
biosynthetic process | 0.0254 | 0.0020 | 2.4904 |
| GOTERM_BP_4 |
GO:0006412-translation | 0.0571 | 0.0028 | 1.6837 |
| Functional group
7 | Geo: 0.0073 | | | |
| GOTERM_CC_4 |
GO:0012505-endomembrane system | 0.0825 | 0.0015 | 1.5603 |
| GOTERM_CC_4 |
GO:0005783-endoplasmic reticulum | 0.0730 | 0.0018 | 1.6022 |
| GOTERM_CC_4 |
GO:0044432-endoplasmic reticulum part | 0.0444 | 0.0131 | 1.6327 |
| GOTERM_CC_4 | GO:0042175-nuclear
envelope-endoplasmic reticulum network | 0.0397 | 0.0208 | 1.6219 |
| GOTERM_CC_4 |
GO:0005789-endoplasmic reticulum
membrane | 0.0381 | 0.0291 | 1.5893 |
| Functional group
8 | Geo: 0.0225 | | | |
| GOTERM_BP_4 |
GO:0007067-mitosis | 0.0254 | 0.0106 | 2.0735 |
| GOTERM_BP_4 | GO:0000087-M phase
of mitotic cell cycle | 0.0254 | 0.0115 | 2.0554 |
| GOTERM_BP_4 | GO:0000279-M
phase | 0.0270 | 0.0359 | 1.7425 |
| GOTERM_BP_4 | GO:0022403-cell
cycle phase | 0.0302 | 0.0588 | 1.5700 |
| Functional group
9 | Geo: 0.0346 | | | |
| GOTERM_CC_4 | GO:0005635-nuclear
envelope | 0.0206 | 0.0247 | 2.0575 |
| GOTERM_CC_4 | GO:0005637-nuclear
inner membrane | 0.0063 | 0.0265 | 6.0643 |
| GOTERM_CC_4 | GO:0044453-nuclear
membrane part | 0.0127 | 0.0467 | 2.4257 |
| GOTERM_CC_4 | GO:0031965-nuclear
membrane | 0.0159 | 0.0469 | 2.1180 |
Pathway-based (GSEA) microarray analysis
of NTau-treated HSCs and validation of microarray analysis
mRNA expression profiling using GSEA microarrays and
quantitative PCR (qPCR) was performed in NTau-treated HSCs.
Analysis of the expression of individual mRNAs demonstrated 2
different patterns of expression. A number of genes including
nucb2, adam9, tpp2, mtif2,
abce1, pkn2, ndufb1, brcc3,
adamtsl3 and gbp1 correlated with reduction and
oxidation of NADH showed a reduced expression in the NTau-treated
HSCs. The second group, consisting of genes related to cell
proliferation and cell cycle regulation including hdac3,
tgfβ1i1 and hrh1, showed an increased expression in
NTau-treated HSCs. We selected 2 of the gene sets ‘Module 62’ and
‘MORF_RAD21’ to illustrate the enrichment scores as shown in
Fig. 5, which was driven by the
group of genes within a gene set that showed the highest
correlation with NTau treatment.
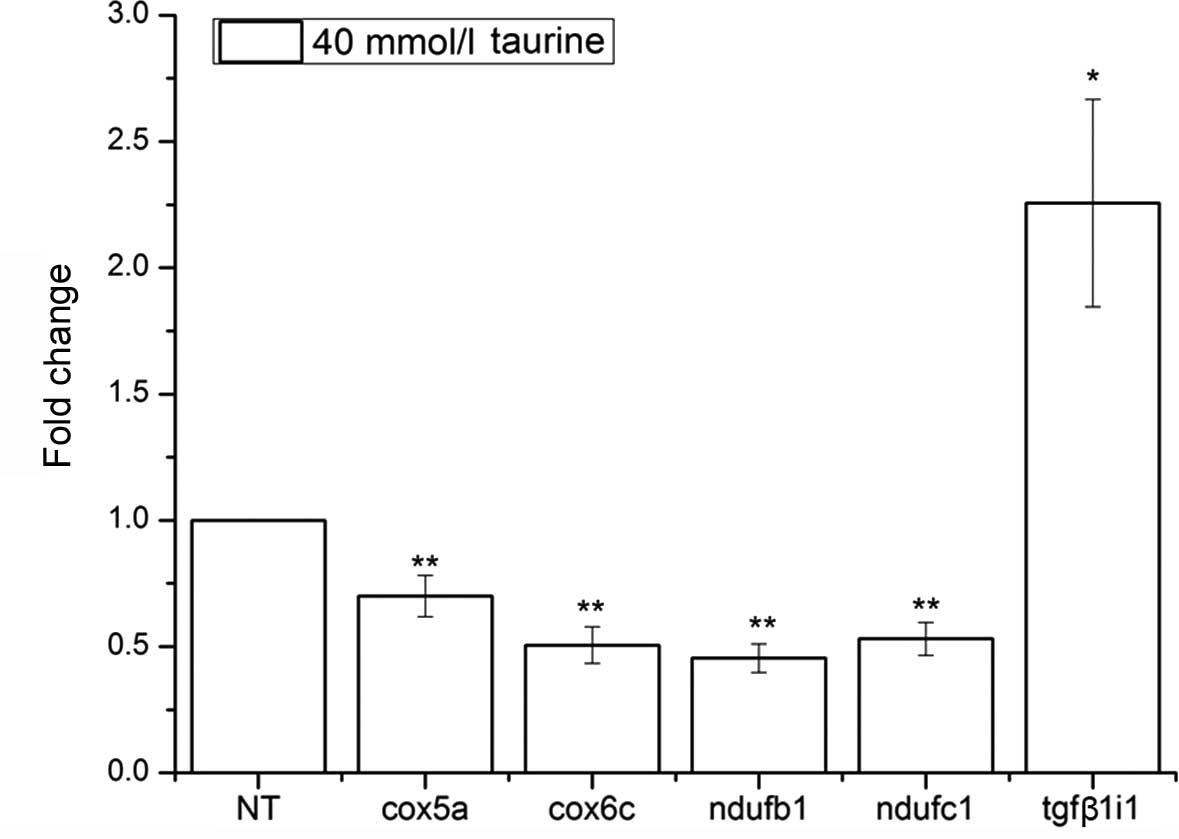
Five selected candidate genes, snrpe,
hnrph3, eif1ay, nucb2 and vim, were
used as reference genes were assayed by qPCR in order to confirm
the expression profiles found using microarray analysis (Fig. 6). Another 5 selected genes,
cox5a, cox6c, ndufb1, ndufc1 and
tgfβ1i1, were assayed to identify the difference between
NTau-treated and control HSCs. The primers designed for real-time
PCR are listed in Table I. As
shown in Fig. 7, tgfβ1i1
mRNA showed a significantly increased expression level (2.26±0.41
vs. 1, P=0.01), which coincided with pathway-based (GSEA)
microarray analysis progression in the regulation of cell
proliferation group. However, cox5a mRNA (0.62±0.03 vs. 1,
P=2×10⁻⁴), cox6c mRNA(0.51±0.07 vs. 1,
P=1.3×10⁻³), ndufb1 mRNA(0.53±0.07 vs. 1,
P=2.7×10⁻⁵), and ndufc1 mRNA (0.45±0.06 vs. 1,
P=1.1×10⁻³) showed a reduced expression in the
NTau-treated HSCs, which are known to play a role in the regulation
of NADH dehydrogenase (ubiquinone) activity, which is involved in
NADH oxidation.
Discussion
Taurine is a sulfur-containing β-amino acid with
several potential therapeutic applications 19,20). Substantial
progress has been made over the last 10–20 years in elucidating the
bio-physiological function of taurine in the treatment of liver
fibrosis. It has been reported that taurine is able to protect
hepatocytes from chemically induced injury and mitigate the
fibrosis of the liver (6,7,21).
Although recent findings suggest that taurine is able to inhibit
the proliferation of HSCs and cause a G0/G1 phase arrest (2), the exact mechanism has not yet been
fully elucidated. During chronic liver injury, HSCs undergo a
phenotypic transformation with the acquisition of
myofibroblast-like features by increased proliferation and
synthesis of ECM components and play a pivotal role in the
formation of fibrosis (22).
Therefore, the inhibition of HSC proliferation, the regulation of
the cell cycle of HSCs, and the facilitation of HSC apoptosis are
important therapeutic approaches for hepatic fibrosis-related liver
diseases. The present study is congruent with the study by Chen
(21), according to which taurine
not only inhibits the proliferation of HSCs, but it is also able to
promote HSC apoptosis.
The process of apoptosis is controlled by a diverse
range of cell signals, which may originate either extracellularly
or intracellularly. A cell initiates intracellular apoptotic
signaling in response to stress, which may cause cell suicide. The
binding of nuclear receptors by glucocorticoids, heat, radiation
increase and intracellular calcium concentration, for example, by
causing damage to the membrane, are all able to trigger the release
of intracellular apoptotic signals by a damaged cell (23,24).
The proteins ANXA1, ECHS1 and PRDX2 were selected
for validation by western blot analysis. Functional analysis showed
that these proteins were related to the biological processes of
‘cellular apoptosis’ and ‘oxidation reaction.’ Since flow
cytometric analysis has shown that taurine-treated HSCs had a
significantly increased apoptosis rate compared to the control
group, the proteomic analysis may reveal the relevant mechanism.
Upregulated protein Annexin I belongs to a family of
Ca2+-dependent phospholipid-binding proteins, which are
able to change the intracellular calcium concentration and cause
apoptosis. Reactive oxygen species (ROS) are closely associated
with apoptotic induction (25) and
downregulate PRDX2 protein, a kind of antioxidant enzyme. Since
altered cellular oxidation-reduction one of the key events in
apoptosis that affects the mitochondria (26), it may be involved in oxidation
reaction and HSC apoptosis.
GO analysis indicated that reduction and oxidation
of NADH had significant functional enrichment. Fuzzy heuristic
clustering of GO categories suggested that intracellular components
of HSCs were influenced by NTau treatment. Furthermore, many
differentially expressed genes were classified into function
clusters relating to reduction-oxidation of mitochondrial NADH and
mitosis. A variety of key events in apoptosis focus on the
mitochondria, including the release of caspase activators, such as
cytochrome c, changes in electron transport and altered
cellular oxidation-reduction (26,27).
Among the validated genes, upregulated
tgfβ1i1, which is transforming growth factor β1-induced
transcript 1, is involved in the negative regulation of cell
proliferation (28). This means
that the higher its expression level, the slower the cell
proliferation. Its upregulated level may indicate taurine’s
function in inhibiting the proliferation of LX-2 cells. The
downregulated genes cox6c, cox5a, ndufb1, and
ndufc1 are components of the electron transport chain in the
mitochondrion. Therefore, we hypothesize that NTau may regulate the
reduction-oxidation of NADH and thereby lead to the inhibition of
HSC proliferation.
The pathogenesis of hepatic fibrosis involves the
activation of HSCs. This procedure is accelerated by HSC
proliferation and the progression of the cell cycle (29). NTau has been demonstrated to
inhibit HSC proliferation and prevent HSCs in the G0/G1 phase from
entering the S and G2/M phases by flow cytometric analysis, which
suggests that NTau is able to modulate hepatic fibrosis. Functional
clustering and GSEA analyses also showed that mitosis, and
especially the M phase of mitotic cell cycle, was regulated by NTau
treatment. Therefore, it was not only demonstrated that NTau was
beneficial to hepatic fibrosis therapy, but valuable evidence to
elucidate the underlying molecular mechanism by investigating
responded genes and proteins was also provided.
It is worth noting that reduction-oxidation of NADH
may play an important role in the protective effect of NTau against
hepatic fibrosis, since GO functional clustering and GSEA analysis
consistently came to the same results. The reduction-oxidation
state is often used to describe the balance of NAD+/NADH
and NADP+/NADPH in a biological system such as a cell
(30). Oxidative stress is
important in the pathogenesis of hepatic fibrosis, which is the
result of deposition of excess ECM proteins produced by activated
HSCs (6). NTau may be able to
attenuate ROS production by modulating the balance of
reduction-oxidation of NADH. Furthermore, the relationship between
the reduction-oxidation of NADH and HSC proliferation or cell cycle
regulation has been previously investigated. Zou et
al(31) have demonstrated that
ROS derived from NAD(P)H oxidases activated the
phosphotidylinositol-3-kinase (PI3K)/Akt pathway, thus promoting
cellular proliferation in HSCs.
Taurine may be synthesized chemically or extracted
from natural sources. However, NTau is superior to synthetic
taurine in promoting HSC apoptosis (32). The advantage of the present study
is reflected in the selection of NTau for investigation of its
mechanism in regulating HSC apoptosis. To the best of our
knowledge, the present study provided for the first time evidence
concerning taurine-mediated transcriptional changes in HSCs by
microarray analysis. Additionally, proteomic approaches were used
to delineate protein expression changes in NTau-treated HSCs. These
variations correspond to biological processes such as ‘oxidant
reaction’ and ‘mitosis process,’ which promote HSC apoptosis. While
these observations systematically investigated the underlying
mechanism of NTau in inhibiting the activation of HSCs, our data
provide strong support for the use of NTau as a potential therapy
for hepatic fibrosis.
Acknowledgements
This study was supported by the National Natural
Science Foundation of China (81160433) and the Guangxi Natural
Science Foundation (2010GXNSFA013217). The authors thank Tiandiyang
Biology Corporation and the SysBiomics Bioinformatics Co., Ltd.
(Beijing, China), for their instructive help with data
analysis.
References
|
1
|
Bataller R and Brenner DA: Liver fibrosis.
J Clin Invest. 115:209–218. 2005. View
Article : Google Scholar
|
|
2
|
Chen YX, Zhang XR, Xie WF and Li S:
Effects of taurine on proliferation and apoptosis of hepatic
stellate cells in vitro. Hepatobiliary Pancreat Dis Int. 3:106–109.
2004.PubMed/NCBI
|
|
3
|
Wu J and Zern MA: Hepatic stellate cells:
a target for the treatment of liver fibrosis. J Gastroenterol.
35:665–672. 2000. View Article : Google Scholar : PubMed/NCBI
|
|
4
|
Kerai MD, Waterfield CJ, Kenyon SH, Asker
DS and Timbrell JA: Taurine: protective properties against
ethanol-induced hepatic steatosis and lipid peroxidation during
chronic ethanol consumption in rats. Amino Acids. 15:53–76. 1998.
View Article : Google Scholar
|
|
5
|
Balkan J, Dogru-Abbasoglu S, Kanbagli O,
Cevikbas U, Aykac-Toker G and Uysal M: Taurine has a protective
effect against thioacetamide-induced liver cirrhosis by decreasing
oxidative stress. Hum Exp Toxicol. 20:251–254. 2001. View Article : Google Scholar : PubMed/NCBI
|
|
6
|
Refik Mas M, Comert B, Oncu K, Vural SA,
Akay C, Tasci I, Ozkomur E, Serdar M, Mas N, Alcigir G and Yener N:
The effect of taurine treatment on oxidative stress in experimental
liver fibrosis. Hepatol Res. 28:207–215. 2004.PubMed/NCBI
|
|
7
|
Ghandforoush-Sattari M and Mashayekhi S:
Evaluation of taurine as a biomarker of liver damage in paracetamol
poisoning. Eur J Pharmacol. 581:171–176. 2008. View Article : Google Scholar : PubMed/NCBI
|
|
8
|
Miyazaki T, Karube M, Matsuzaki Y, Ikegami
T, Doy M, Tanaka N and Bouscarel B: Taurine inhibits oxidative
damage and prevents fibrosis in carbon tetrachloride-induced
hepatic fibrosis. J Hepatol. 43:117–125. 2005. View Article : Google Scholar : PubMed/NCBI
|
|
9
|
Bradford MM: A rapid and sensitive method
for the quantitation of microgram quantities of protein utilizing
the principle of protein-dye binding. Anal Biochem. 72:248–254.
1976. View Article : Google Scholar : PubMed/NCBI
|
|
10
|
Stoscheck CM: Quantitation of protein.
Methods Enzymol. 182:50–68. 1990. View Article : Google Scholar
|
|
11
|
Ashburner M, Ball CA, Blake JA, et al:
Gene ontology: tool for the unification of biology. The Gene
Ontology Consortium. Nat Genet. 25:25–29. 2000. View Article : Google Scholar : PubMed/NCBI
|
|
12
|
Huang da W, Sherman BT and Lempicki RA:
Systematic and integrative analysis of large gene lists using DAVID
bioinformatics resources. Nat Protoc. 4:44–57. 2009.PubMed/NCBI
|
|
13
|
Kanehisa M, Araki M, Goto S, Hattori M,
Hirakawa M, Itoh M, Katayama T, Kawashima S, Okuda S, Tokimatsu T
and Yamanishi Y: KEGG for linking genomes to life and the
environment. Nucleic Acids Res. 36:D480–D484. 2008. View Article : Google Scholar : PubMed/NCBI
|
|
14
|
Patterson TA, Lobenhofer EK,
Fulmer-Smentek SB, et al: Performance comparison of one-color and
two-color platforms within the MicroArray Quality Control (MAQC)
project. Nat Biotechnol. 24:1140–1150. 2006. View Article : Google Scholar : PubMed/NCBI
|
|
15
|
Yang YH, Dudoit S, Luu P, Lin DM, Peng V,
Ngai J and Speed TP: Normalization for cDNA microarray data: a
robust composite method addressing single and multiple slide
systematic variation. Nucleic Acids Res. 30:e152002. View Article : Google Scholar : PubMed/NCBI
|
|
16
|
Subramanian A, Tamayo P, Mootha VK, et al:
Gene set enrichment analysis: a knowledge-based approach for
interpreting genome-wide expression profiles. Proc Natl Acad Sci
USA. 102:15545–15550. 2005. View Article : Google Scholar : PubMed/NCBI
|
|
17
|
Apweiler R, Bairoch A, Wu CH, et al:
UniProt: the Universal Protein knowledgebase. Nucleic Acids Res.
32:D115–D119. 2004. View Article : Google Scholar : PubMed/NCBI
|
|
18
|
Huang da W, Sherman BT, Tan Q, Collins JR,
Alvord WG, Roayaei J, Stephens R, Baseler MW, Lane HC and Lempicki
RA: The DAVID Gene Functional Classification Tool: a novel
biological module-centric algorithm to functionally analyze large
gene lists. Genome Biol. 8:R1832007.PubMed/NCBI
|
|
19
|
Kendler BS: Taurine: an overview of its
role in preventive medicine. Prev Med. 18:79–100. 1989. View Article : Google Scholar : PubMed/NCBI
|
|
20
|
Lourenço R and Camilo ME: Taurine: a
conditionally essential amino acid in humans? An overview in health
and disease. Nutr Hosp. 17:262–270. 2002.PubMed/NCBI
|
|
21
|
Chen YX: Protective action of taurine on
ischemia-reperfusion liver injury in rats and its mechanism.
Zhonghua Yi Xue Za Zhi. 73:276–279. 318–379. 1993.(In Chinese).
|
|
22
|
Friedman SL: Seminars in medicine of the
Beth Israel Hospital, Boston. The cellular basis of hepatic
fibrosis Mechanisms and treatment strategies. N Engl J Med.
328:1828–1835. 1993. View Article : Google Scholar
|
|
23
|
Cotran RS, Kumar V and Collins T: Robbins
Pathologic Basis of Disease. 6th edition. WB Saunders Co;
Philadelphia: 1998
|
|
24
|
Mattson MP and Chan SL: Calcium
orchestrates apoptosis. Nat Cell Biol. 5:1041–1043. 2003.
View Article : Google Scholar : PubMed/NCBI
|
|
25
|
Simon HU, Haj-Yehia A and Levi-Schaffer F:
Role of reactive oxygen species (ROS) in apoptosis induction.
Apoptosis. 5:415–418. 2000. View Article : Google Scholar : PubMed/NCBI
|
|
26
|
Green DR and Reed JC: Mitochondria and
apoptosis. Science. 281:1309–1312. 1998. View Article : Google Scholar : PubMed/NCBI
|
|
27
|
Camilleri-Broët S, Vanderwerff H, Caldwell
E and Hockenbery D: Distinct alterations in mitochondrial mass and
function characterize different models of apoptosis. Exp Cell Res.
239:277–292. 1998.PubMed/NCBI
|
|
28
|
Shibanuma M, Mashimo J, Kuroki T and Nose
K: Characterization of the TGF beta 1-inducible hic-5 gene that
encodes a putative novel zinc finger protein and its possible
involvement in cellular senescence. J Biol Chem. 269:26767–26774.
1994.PubMed/NCBI
|
|
29
|
Wells RG: The role of matrix stiffness in
hepatic stellate cell activation and liver fibrosis. J Clin
Gastroenterol. 39:S158–S161. 2005. View Article : Google Scholar : PubMed/NCBI
|
|
30
|
Ying W: NAD+/NADH and
NADP+/NADPH in cellular functions and cell death:
regulation and biological consequences. Antioxid Redox Signal.
10:179–206. 2008.
|
|
31
|
Zou CG, Gao SY, Zhao YS, Li SD, Cao XZ,
Zhang Y and Zhang KQ: Homocysteine enhances cell proliferation in
hepatic myofibroblastic stellate cells. J Mol Med (Berl). 87:75–84.
2009. View Article : Google Scholar : PubMed/NCBI
|
|
32
|
Liang J, Deng X, Yang GY, Huang RB and
Pang YS: Effect of natural taurine on serology and histology of
hepatic fibrosis in rat. Journal of Guangxi Traditional Chinese
Medical University. 9:3–5. 2006.(In Chinese).
|