Introduction
Cancer is known to be caused by genetic as well as
epigenetic disorders. Cancers often exhibit aberrant methylation of
gene promoter regions in key tumor-suppressor genes, which
consequently results in the loss of gene functions (1). DNA hypomethylating agents, including
decitabine (DAC) and azacitidine (AC), have been approved for the
treatment of myelodysplastic syndromes (MDS) (2). These two drugs are analogs of cytidine,
which trap the DNA methyltransferase 1 (DNMT1) protein via covalent
interactions (3). DNMT1 depletion
results in passive demethylation in dividing cells as well as the
re-expression of critical genes, which were silenced through
aberrant promoter hypermethylation. Prolonged re-expression of
these genes has been reported to be associated with clinical
responses (1). DNMT1 inhibitors,
including DAC and AC, have been demonstrated to disrupt DNA
methylation through inhibiting DNMT1 at low concentrations;
however, these inhibitors were reported to induce cytotoxicity at
high concentrations (3,4).
Resistance to anticancer drugs is a critical problem
that limits the effectiveness of chemotherapy (5). Resistance generally develops with
long-term exposure. Cancer cells that acquire resistance to one
anticancer drug may also become simultaneously resistant to
different drugs; this has been referred to as multidrug-resistance
or cross-resistance (6). Other
epigenetic modifiers, such as histone deacetylase (HDAC)
inhibitors, which include trichostatin A (TSA), vorinostat
(suberoylanilide hydroxamic acid; SAHA) and valproic acid (VPA),
have been reported to induce moderate resistance and
cross-resistance to different HDAC inhibitors in colon cancer cells
(7–9).
By contrast, these colon cancer cells that acquired resistance to
HDAC inhibitors retained their sensitivity to non-HDAC
inhibitor-type anticancer drugs. However, it remains to be
elucidated whether DNMT inhibitors exhibit cross-resistance. It was
reported that a high cytidine deaminase (CDA) to deoxycytidine
kinase (dCK) ratio may be a marker of primary resistance to DAC in
MDS (10). Previous studies have
demonstrated that resistance to DAC in HL60 cells was induced by
exposing these cells to DAC for 14 days and was associated with
attenuated dCK levels due to dCK mutations; however, dCK mutations
were not detected in MDS patients following relapse (10,11). A
concentration of 10 µM DAC was used in a previous study (11), which was markedly higher than that
used to inhibit DNMT1 (~0.2 µM). However, it remains to be
elucidated whether long-term treatment with DAC, at concentrations
that inhibit DNMT1, results in cell resistance. A previous study
demonstrated that resistance to AC was acquired by perturbing its
activation with uridine-cytidine kinase (UCK) 2 gene mutations
following treatment with increasing concentrations of AC (0.2–1.0
µM) (12). CDA, which inactivates
DNMT inhibitors, may also contribute to poorer outcomes with AC or
DAC therapy (13). Previous studies
have reported that human nucleoside transporters, including
equilibrative nucleoside transporters (ENTs) and concentrative
nucleoside transporters (CNTs), had an important role in the uptake
and cytotoxicity of DAC and AC (14–16).
However, the underlying mechanisms for resistance to DAC are poorly
understood in terms of transporters as well as enzymes.
Furthermore, information on the treatment of solid tumors, such as
colorectal cancer (CRC), with DAC is limited and at present, has
only resulted in a limited number of responses (17). By contrast, combination therapy with
DAC and traditional cytotoxic anticancer drugs may be beneficial
for solid tumors (18,19). However, cross-resistance in
DAC-resistant cancer cells has not yet been examined in detail.
In the present study, DAC resistance was established
in HCT116 CRC cells through long-term treatment with increasing
concentrations of DAC. It was previously demonstrated that HCT116
cells were the most sensitive to DAC among four human CRC cell
lines (20). HCT116 cells, classified
as cytosine-phosphate-guanine island methylator phenotype
(CIMP)-positive, are an extensively studied line of human CRC cells
in the field of epigenetics (21,22).
Cancers with CIMP exhibit aberrant DNA methylation, leading to the
concordant promoter hypermethylation of multiple genes (23). The present study aimed to determine
the effects of long-term exposure of HCT116 cells to DAC, at
concentrations that inhibit DNMT1, on the acquisition of resistance
to DAC, in terms of cytotoxicity and gene expression regulated by
DNA methylation. In addition, the present study investigated
whether DAC-resistant HCT116 cells exhibited cross-resistance to
anticancer drugs used for CRC or other epigenetic modifiers.
Materials and methods
Materials
The human HCT116 colon carcinoma cell line was
purchased from DS Pharma Biomedical Co., Ltd (Osaka, Japan).
McCoy's 5A medium, Leibovitz L-15 medium (L-15),
penicillin-streptomycin and fetal bovine serum (FBS) were purchased
from Life Technologies (Carlsbad, CA, USA). Oxaliplatin (L-OHP),
gemcitabine (Gem), DAC, AC, zebularine (Zeb), TSA and SAHA were
purchased from Wako Pure Chemical Industries, Ltd (Osaka, Japan).
5-fluorouracil (5-FU) was purchased from Nacalai Tesque, Inc.
(Kyoto, Japan). Irinotecan (CPT-11), 7-ethyl-10-hydroxycamptothecin
(SN-38) and VPA sodium salt were purchased from Sigma-Aldrich (St.
Louis, MO, USA). Monoclonal mouse anti-β-actin (dilution, 1:1,000;
catalog no. sc-4778), monoclonal mouse anti-CDA (dilution, 1:1,000;
catalog no. sc-365292), goat anti-mouse immunoglobulin
(Ig)G-horseradish peroxidase (HRP; dilution, 1:2,000–5,000; catalog
no. sc-2005) and goat anti-rabbit IgG-HRP antibodies (dilution,
1:2,000; catalog no. sc-2004) were purchased from Santa Cruz
Biotechnology, Inc. (Dallas, TX, USA). Monoclonal mouse anti-DNMT1
(dilution, 1:1,000; catalog no. ab-13537), polyclonal rabbit
anti-ENT1 (dilution, 1:1,000; catalog no. ab-48607) and polyclonal
rabbit anti-dCK (dilution, 1:500; catalog no. ab-91599) antibodies
were purchased from Abcam (Cambridge, UK). All other chemicals were
of the highest grade commercially available.
Cell culture and establishment of
DAC-resistant HCT116 cells
HCT116 cells were grown in McCoy's 5A medium
supplemented with 10% FBS, 100 U/ml penicillin and 100 µg/ml
streptomycin at 37°C in 5% CO2-95% air. DAC-resistant
HCT116 cells were generated through long-term treatment with
increasing concentrations of DAC (10–540 nM) including DAC-free
intervals in order to allow the surviving cells to recover. HCT116
cells were initially seeded at a density of 3×10³
cells/100-mm dish and subcultured every 14 days with DAC treatment
from day 7 to day 12. This protocol was repeated twice (DAC
concentration, cycle 1, 10 nM; cycle 2, 30 nM). After 28 days, the
cells were seeded at a density of 6×10⁵ cells/100-mm
dish and treated with DAC after 24 h. After another 72 h, the cells
were subcultured and cultured in DAC-free medium for 96 h to allow
the surviving cells to recover. This protocol was repeated 9 times
until day 104. The additional DAC-free intervals after DAC
treatment for 72 h were 24 h for cycle 7 and 9, and 72 h for cycle
8. The concentrations of DAC were 60 nM for cycle 1–3, 240 nM for
cycle 4–7, 360 nM for cycle 8 or 540 nM for cycle 9.
Cytotoxicity assay
A cytotoxicity assay was performed using the
water-soluble tetrazolium salt-8 (WST8) assay with a Cell Counting
kit-8 (Dojindo Laboratories, Kumamoto, Japan). Cells
(2×10³/well) were seeded onto a 96-well plate in 100 µl
McCoy's 5A culture medium supplemented with 10% FBS, 100 U/ml
penicillin, and 100 µg/ml streptomycin at 37°C in 5%
CO2-95% air. After 24 h, drugs diluted with the culture
medium were added to each well. The concentrations of the drugs
were as follows: DAC (0.1, 0.4, 1.6, 6.3 or 25.0 µM for control,
day 28 or day 52; 25, 100, 250, 500, 1000 or 2000 µM for day 81,
day 104); AC (3.1, 6.3, 12.5, 25.0, 50.0 or 100.0 µM); Zeb (63,
125, 250, 500, 100, 1333 or 2000 µM); TSA (6.3, 12.5, 16.7, 25.0 or
50.0 nM); SAHA (0.3, 0.4, 0.6, 0.8, 1.3, 2.5, 5.0 or 10.0 µM); VPA
(0.6, 0.8, 1.3, 1.7, 2.5 or 5.0 mM); 5-FU (0.1, 0.4, 1.6, 6.3, 25.0
or 100.0 µM); CPT-11 (0.9, 1.9, 3.8, 7.5, 15.0 or 30.0 µM); SN-38
(0.6, 1.3, 2.5, 5.0, 10.0, 20.0 or 40.0 nM), L-OHP (0.3, 0.4, 0.6,
0.8, 1.3, 2.5, 5.0 or 10.0 µM) or Gem (1.6, 2.4, 3.6, 5.3, 8.0,
12.0 or 36.0 nM for control cells;12, 37, 111, 333, 1000, 3000 nM
for DAC-resistant cells). Following drug treatment for 72 h, cells
were washed with L-15 medium and incubated with 100 µl L-15 medium
(due to the high background absorbance of McCoy's 5A medium) and 10
µl WST-8 solution for 1–2 h at 37°C. The conversion of WST-8 to
formazan by living cells (active mitochondria) was measured at 450
nm for the indicator color and 655 nm for the background using a
Bio-Rad 550 Microplate Reader (Bio-Rad Laboratories, Inc.,
Hercules, CA, USA). In all assays, reactions containing no cells
were used to determine blank values, which were subtracted from
values obtained from the assays with cells. The IC50
values of drugs in cells were calculated according to the sigmoid
inhibitory effect model: E=(Emax
xIC50γ)/(Cγ+IC50γ),
by means of a nonlinear least-squares fitting method (Solver,
Microsoft Excel 2010; Microsoft Corp., Redmond, WA, USA). E
and Emax represent the surviving fraction (% of
control) and the maximum surviving fraction, respectively; C
and γ represent the drug concentration in medium and sigmoid
factor, respectively, as described previously (24).
Reverse transcription quantitative
polymerase chain reaction (RT-qPCR)
Total RNA was extracted from cell lines using RNeasy
Mini kits (Qiagen, Inc., Valencia, CA, USA) according to the
manufacturer's instructions for mammalian cells. Total RNA was
reverse-transcribed into complementary DNA using a ReverTra Ace
qPCR RT Master Mix with gDNA Remover (Toyobo Co., Ltd., Osaka,
Japan). qPCR was performed on a Rotor-Gene Q (Qiagen, Inc.) using
SYBR Green (Toyobo Co., Ltd.). The PCR conditions were as follows:
Initial denaturation for 1 cycle of 1 min at 95°C, followed by 40
cycles of 10 sec at 95°C (denaturation), 10 sec at 60°C (annealing)
and 20 sec at 72°C (extension). Following these cycles, a melting
curve was used to confirm the single product. The expression levels
of each messenger (m)RNA were normalized to that of ribosomal
protein L27 (RPL27), as a housekeeping gene (25). Relative expression levels of the
target genes were expressed as 2−ΔCt (26). The primers used in the present study
were obtained from Life Technologies and the sequences were as
follows: Human RPL27 forward, 5′-ATCGCCAAGAGATCAAAGATAA-3′
and reverse, 5′-TCTGAAGACATCCTTATTGACG-3′; human SFRP1
forward, 5′-AATGCCACCGAAGCCTCCAAGC-3′ and reverse,
5′-TCATCCTCAGTGCAAACTCGCTG-3′; human ENT1 forward, 5′-AGG
AGC CAA GAG CAG GCA AAG AG-3′ and reverse, 5′-ACA GTC ACG GCT GGA
AAC ATC CC-3′; human CDA forward,
5′-ACAGTCACTTTCCTGTGGGGGC-3′ and reverse,
5′-AGCGGTCCGTTCAGCACAGATG-3′; and human dCK forward,
5′-AAGCTGCCCGTCTTTCTCAGCC-3′ and reverse,
5′-TTCCCTGCAGCGATGTTCCCTTC-3′.
Western blot analysis
Nuclear (DNMT1, CDA and dCK) or whole-cell (ENT1)
proteins were isolated using Mammalian Protein Extraction Reagent
(Thermo Scientific, Rockford, IL, USA) or Radioimmunoprecipitation
Assay Buffer (Nacalai Tesque, Inc.), respectively. Protein
concentrations were measured using the Quant-iT Protein Assay kit
(Molecular Probes, Life Technologies). Protein samples (20 µg) were
separated by electrophoresis using 4–12% (DNMT1) or 10% (ENT1, CDA
and dCK) NuPAGE Bis-Tris gel (Invitrogen Life Technologies,
Carlsbad, CA, USA) with 3-propanesulfonic acid or 2-ethanesulfonic
acid buffer (Invitrogen Life Technologies), respectively, and
transferred to a polyvinylidene fluoride membrane using iBlot
(Invitrogen Life Technologies). The membranes were blocked with
Blocking One (Nacalai Tesque, Inc.) at room temperature for 30 min
and incubated with primary antibodies (monoclonal mouse
anti-β-actin, monoclonal mouse anti-DNMT1, polyclonal rabbit
anti-ENT1, monoclonal mouse anti-CDA or polyclonal rabbit anti-dCK,
as aforementioned) for 1 h at room temperature. The membranes were
washed with Tris-buffered saline-0.1% Tween 20 and incubated with
the secondary antibodies (goat anti-mouse IgG-HRP or goat
anti-rabbit IgG-HRP, as aforementioned) for 1 h at room
temperature. The proteins were visualized using Chemi-Lumi One
Super (Nacalai Tesque, Inc.). Relative band intensities were
estimated using Image J software, version 1.48 (National Institute
of Health, Bethesda, MD, USA).
Statistical analysis
All values are expressed as the mean ± standard
error of the mean. Differences between two groups were evaluated
using the unpaired Student's t-test. One way analysis of
variance followed by post-hoc analysis was used for data with >2
groups. P<0.05 was considered to indicate a statistically
significant difference between values.
Results
Acquired DAC resistance following
long-term treatment of HCT116 cells with DAC
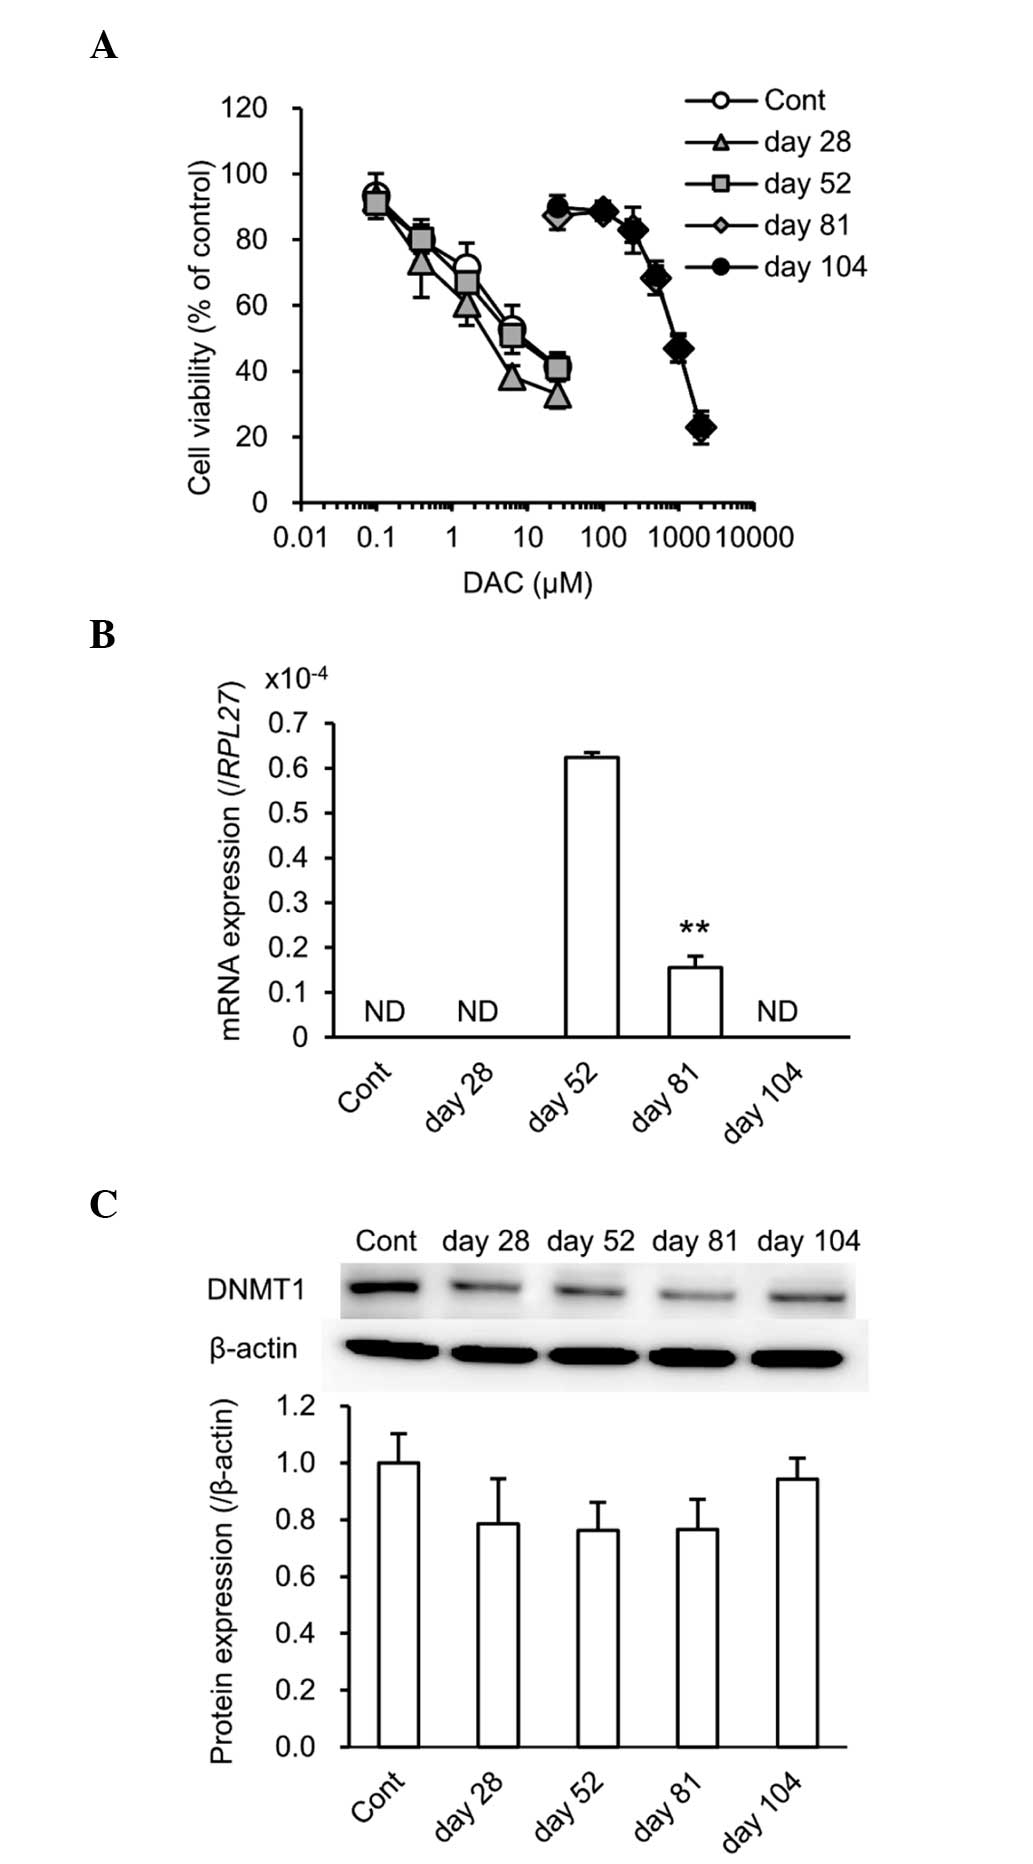
HCT116 cells were treated with increasing
concentrations of DAC for 104 days. The sensitivity of HCT116 cells
to DAC was then examined (Fig. 1A;
Table I). The cell viability of
HCT116 cells treated with DAC for 81 or 104 days was markedly
increased compared with the control cells. The growth curve of
HCT116 cells treated with DAC for 81 or 104 days shifted to higher
concentration of DAC compared with the control cells (Fig. 1A). As presented in Table I, IC50 values in HCT116
cells increased ~100-fold following treatment with DAC for >80
days compared with the control group, indicating that HCT116 cells
became resistant to DAC. This resistance was stable over a period
of 4 weeks even when the cells were cultured in the absence of DAC
(data not shown). In addition, mRNA expression levels of
secreted frizzed-related protein 1 (SFRP1), which is
known to be regulated by DNA methylation, were determined (21,27). As
shown in Fig. 1B, mRNA expression of
SFRP1 was not detected in control HCT116 cells; however, its
expression was present following treatment with DAC for 52 days,
indicating that DAC exhibited a DNA demethylation effect by day 52.
However, this effect was attenuated following subsequent treatment
with DAC, as SFRP1 mRNA expression levels were decreased
significantly by day 81 (P<0.01) and were absent by day 104. The
protein expression of DNMT1, the target of DAC, is shown in
Fig. 1C (3). DNMT1 protein levels were decreased until
day 81 and then returned to control levels by day 104; however, no
significant differences were observed (P>0.05; Fig. 1C). HCT116 cells treated with DAC for
104 days were used as DAC-resistant HCT116 cells for all subsequent
experiments.
 | Table I.IC50 values of DAC in
HCT116 cells following long-term treatment with DAC. |
Table I.
IC50 values of DAC in
HCT116 cells following long-term treatment with DAC.
| DAC treatment | IC50
(µM) | Relative
resistance |
|---|
| Control |
8.6±2.7 | 1.0 |
| Day 28 |
4.3±1.7 | 0.5 |
| Day 52 |
12.2±3.8 | 1.4 |
| Day 81 |
872.4±152.0 | 101.4 |
| Day 104 |
884.2±85.9 | 102.8 |
Absence of cross-resistance to
epigenetic modifiers in DAC-resistant HCT116 cells
In order to determine whether DAC-resistant HCT116
cells acquired cross-resistance to other epigenetic modifiers,
their sensitivity to various epigenetic modifiers, including AC,
Zeb, TSA, SAHA and VPA, was investigated. Although a significant
difference was observed in the IC50 value of VPA
(P<0.05), the IC50 values of the other epigenetic
modifiers examined did not change markedly, indicating that none of
epigenetic modifiers demonstrated cross-resistance to DAC (Table II).
| Table II.IC50 values of epigenetic
modifiers in control and DAC-resistant HCT116 cells. |
Table II.
IC50 values of epigenetic
modifiers in control and DAC-resistant HCT116 cells.
| Epigenetic
modifiers | AC (µM) | Zeb (µM) | TSA (nM) | SAHA (µM) | VPA (mM) |
|---|
| Control | 18.28±0.56 | 1040.15±73.21 | 23.99±4.92 | 0.64±0.05 | 1.22±0.02 |
| DAC-resistant | 16.36±0.88 | 918.11±85.72 | 17.15±1.70 | 0.48±0.04 | 0.94±0.04 |
| Relative
resistance | 0.89 | 0.88 | 0.71 | 0.75 | 0.77 |
| P-value | 0.14 | 0.34 | 0.26 | 0.05 |
2.30×10⁻³a |
Cross-resistance to anticancer drugs
in DAC-resistant HCT116 cells
In order to investigate whether DAC-resistant HCT116
cells acquired cross-resistance to other anticancer drugs, their
sensitivity to various anticancer drugs used to treat CRC,
including 5-FU, CPT-11, SN-38, L-OHP and Gem, were determined.
Although a significant difference was observed in the
IC50 values of CPT-11 and SN-38 (P<0.05), the
IC50 values of anticancer drugs for CRC, 5-FU, CPT-11,
SN-38 and L-OHP, did not change markedly, indicating that
cross-resistance was not exhibited for these drugs (Table III). By contrast, the
IC50 value of Gem, the transport and metabolic pathways
of which are similar to those of DAC (28), increased 32-fold. This result
indicated that common factors between DAC and Gem, including ENT1,
CDA and dCK, may be involved in the acquired resistance to DAC by
HCT116 cells.
| Table III.IC50 values of anticancer
drugs in control and DAC-resistant HCT116 cells. |
Table III.
IC50 values of anticancer
drugs in control and DAC-resistant HCT116 cells.
| Anticancer
drugs | 5-FU (µM) | CPT-11 (µM) | SN-38 (nM) | L-OHP (µM) | Gem (nM) |
|---|
| Control | 3.34±0.21 | 2.40±0.20 | 2.82±0.14 | 0.71±0.12 | 7.77±0.22 |
| DAC-resistant | 2.79±0.15 | 1.73±0.12 | 1.91±0.28 | 0.64±0.06 | 249.44±8.59 |
| Relative
resistance | 0.84 | 0.72 | 0.68 | 0.90 | 32.10 |
| P-value | 0.10 | 0.05a | 0.04a | 0.63 | 9.5×10⁻⁶
a |
Alterations in CDA and dCK protein
expression levels in DAC-resistant HCT116 cells
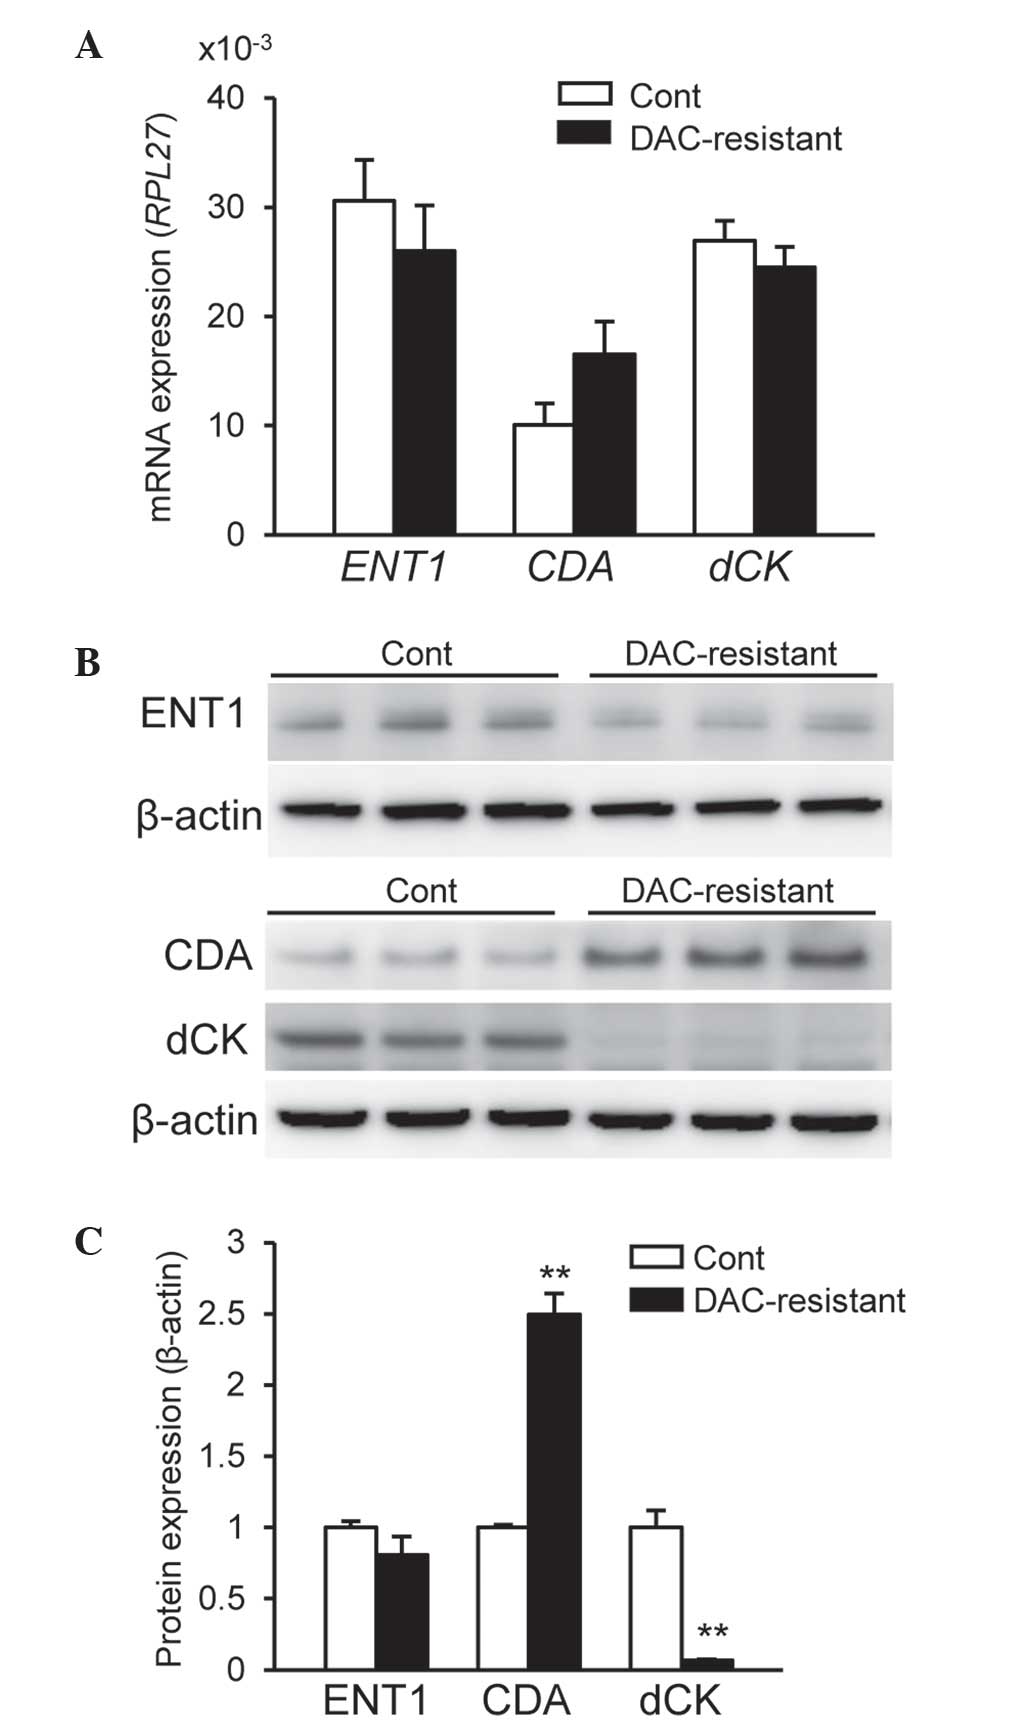
In order to elucidate the mechanisms underlying
acquired resistance to DAC, the mRNA expression levels of
ENT1, CDA and dCK were examined. As shown in
Fig. 2A, no significant differences
were observed in the expression levels of these mRNAs between
control and DAC-resistant HCT116 cells (P>0.05). However, the
expression of ENT2, ENT3 and CNTs mRNA was
markedly reduced compared with that of ENT1 mRNA in HCT116
cells (data not shown). The protein levels of ENT1, CDA and dCK
were subsequently determined. No significant differences were noted
in ENT1 protein expression levels between control and DAC-resistant
HCT116 cells (Fig. 2B and C).
However, CDA protein expression levels were significantly increased
and dCK protein expression levels were significantly attenuated in
DAC-resistant HCT116 cells compared with control HCT116 cells
(P<0.01) (Fig. 2B and C). By
contrast, CDA protein expression levels were markedly reduced in
HT29 cells compared with HCT116 cells, whereas ENT1 and dCK
proteins were expressed in HT29 cells (data not shown). These
results indicate the involvement of CDA and dCK in the acquired
resistance to DAC by HCT116 cells.
Discussion
Numerous clinical trials have demonstrated the
therapeutic potential of DAC in hematological malignancies
(29–31); however, according to clinical trials
using DAC, fewer responses were reported in solid tumors for DAC
compared with AC, indicating a reduced efficacy (17). One difficulty associated with treating
solid tumors over hematological malignancies is due to the lack of
dividing cells in solid tumors, as DAC and AC are S-phase-specific
drugs and DNA incorporation is essential in order to exert their
epigenetic effects (17). However,
previous studies have reported the stable and altered expression of
genes in solid tumors, which supported the activity of DAC and AC
due to the abundance of epigenetic aberrations observed in solid
tumors (17,32). Although the efficacy of DAC for solid
tumors, including CRC, remains controversial, combination therapy
with DAC and cytotoxic anticancer drugs may be beneficial (18,19). It
was previously reported that DAC exhibited a synergic effect on the
cytotoxicity induced by anticancer drugs in human CRC cells
(20). Thus, research using CRC cells
with acquired resistance to DAC may be important for elucidating
the mechanisms underlying resistance to DAC as well as
cross-resistance to other drugs.
The concentration of DAC required to inhibit DNA
methylation in clinical applications was reported to be ~0.3 µM,
which is the maximal plasma concentration in humans (33). This concentration was unchanged during
repeated dosing due to the short terminal phase elimination
t1/2 value, ~35 min (33).
It was previously reported that human HCT116 CRC cells exhibited
the highest sensitivity to DAC among four human CRC cell lines
examined (20). In the present study,
increasing concentrations of DAC (10–540 nM) were used to induce
DAC resistance in HCT116 cells. The results demonstrated an
increased IC50 value of DAC following treatment for 81
days. This result corresponded with the alterations in SFRP1
mRNA and DNMT1 protein expression levels. Thus, long-term treatment
with DAC, at concentrations that inhibited DNMT1, resulted in
acquired DAC resistance in HCT116 cells.
CRC cells that acquired resistance to HDAC
inhibitors, including TSA, SAHA and VPA, were also reported to
exhibit cross-resistance to different HDAC inhibitors (7–9). However,
in the present study, DAC-resistant HCT116 cells demonstrated no
cross-resistance to DNMT inhibitors, AC and Zeb. These results
suggested that the long-term treatment with DAC did not affect UCK,
a key enzyme for the activation of AC and Zeb (12,34).
Furthermore, DAC-resistant HCT116 cells did not exhibit
cross-resistance to any of the HDAC inhibitors, including TSA, SAHA
and VPA. This result implied that the long-term treatment with DAC
did not influence the pathways involved in histone modification. In
addition, long-term treatment with DAC did not alter the
sensitivity of DAC-resistant HCT116 cells to anticancer drugs used
to treat CRC, including 5-FU, CPT-11, SN-38 and L-OHP. These
results indicated that long-term DAC treatment may not affect the
pathways involved in the effects of anticancer drugs, including
apoptosis and the cell cycle as well as the transport and
metabolism of these drugs (35,36). By
contrast, the present study demonstrated that the sensitivity of
Gem was markedly lower in DAC-resistant HCT116 cells compared with
control HCT116 cells. The intracellular uptake of Gem is primarily
mediated by ENT1 (28). Gem is
phosphorylated to its monophosphate form by dCK in cells and this
step is essential for further phosphorylation to its active
triphosphate form (28). Gem is known
to be primarily inactivated by the transformation of CDA into
2′,2′-difluorodeoxyuridine (28). The
mechanisms underlying Gem resistance have been extensively examined
and are known to involve ENT1, CDA and dCK (37,38). The
mechanisms responsible for DAC resistance may be similar to those
for Gem resistance, as DAC-resistant HCT116 cells were more
resistant to Gem compared with control HCT116 cells in the current
study. In addition, increased CDA and decreased dCK protein
expression levels were observed in the present study, whereas the
protein expression of ENT1 was not markedly changed. Only ENT1
protein expression levels were examined in the present study, as
preliminary studies revealed that the expression of ENT1
mRNA was markedly higher than that of ENT2, ENT3 and
CNTs mRNA in HCT116 cells (data not shown). However, the
present study demonstrated that no significant differences were
observed in the mRNA expression of ENT1, CDA and dCK
between DAC-resistant HCT116 cells and control HCT116 cells. A
previous study demonstrated that DAC was able to interact with all
nucleoside transporter proteins with high affinity; however, it was
reported that DAC is not more efficiently transported via
nucleoside transporter-type proteins compared with other
nucleosides and analogs (uridine, adenosine, Gem and AC) (14,16). These
results therefore suggested that the involvement of ENT1 in the
acquisition of resistance to DAC in HCT116 cells may be negligible.
Another previous study reported that the resistance of HL60 cells
to DAC induced by DAC exposure was associated with attenuated dCK
levels due to dCK mutations (11).
Regarding Gem, reduced phosphorylation by dCK was identified to be
a key process for acquiring Gem resistance over other processes via
ENT1 and CDA in a pancreatic cancer cell line (39). In addition, the deaminated metabolite
of Gem by CDA was suggested to modulate the rate of Gem transport
and intracellular phosphorylation via dCK (40). Thus, an increase in the expression of
CDA may partly affect the sensitivity to Gem or DAC. Alterations in
CDA and dCK may therefore contribute to DAC resistance and
cross-resistance to Gem. However, further studies are required in
order to clarify the detailed mechanisms underlying acquired
resistance to DAC, such as differences in the contribution of CDA
and dCK, microRNA expression and gene mutations. It was previously
reported that the IC50 value of DAC in HT29 cells,
another CRC cell line, was ~1,400 µM, which was markedly higher
compared with DAC-resistant HCT116 cells (20). The results of preliminary studies
demonstrated that CDA protein expression levels were markedly lower
in HT29 cells compared with HCT116 cells, whereas ENT1 and dCK
proteins were expressed in HT29 cells (data not shown). Therefore,
mechanisms that do not involve ENT1, CDA and dCK may have
contributed to the low sensitivity of HT29 cells to DAC. Further
studies are required in order to elucidate the differences in the
mechanisms underlying resistance to DAC among cell lines.
In conclusion, the results of the present study
demonstrated that the long-term treatment of HCT116 cells with DAC
increased the expression of CDA and decreased that of dCK, which
indicated the potential role of these proteins in the acquisition
of resistance to DAC. Furthermore, DAC-resistant HCT116 cells
exhibited cross-resistance to Gem; however, cross-resistance was
not observed with other DNMT inhibitors (AC and Zeb), HDAC
inhibitors (TSA, SAHA and VPA) or anticancer drugs (5-FU, CPT-11
and L-OHP).
References
|
1
|
Sarkar S, Horn G, Moulton K, et al: Cancer
development, progression, and therapy: An epigenetic overview. Int
J Mol Sci. 14:21087–21113. 2013. View Article : Google Scholar : PubMed/NCBI
|
|
2
|
Ishikawa T: Novel therapeutic strategies
using hypomethylating agents in the treatment of myelodysplastic
syndrome. Int J Clin Oncol. 19:10–15. 2014. View Article : Google Scholar : PubMed/NCBI
|
|
3
|
Foulks JM, Parnell KM, Nix RN, et al:
Epigenetic drug discovery: Targeting DNA methyltransferases. J
Biomol Screen. 17:2–17. 2012. View Article : Google Scholar : PubMed/NCBI
|
|
4
|
Christman JK: 5-Azacytidine and
5-aza-2′-deoxycytidine as inhibitors of DNA methylation:
Mechanistic studies and their implications for cancer therapy.
Oncogene. 21:5483–5495. 2002. View Article : Google Scholar : PubMed/NCBI
|
|
5
|
Pluchino KM, Hall MD, Goldsborough AS, et
al: Collateral sensitivity as a strategy against cancer multidrug
resistance. Drug Resist Updat. 15:98–105. 2012. View Article : Google Scholar : PubMed/NCBI
|
|
6
|
Stordal B, Pavlakis N and Davey R:
Oxaliplatin for the treatment of cisplatin-resistant cancer: A
systematic review. Cancer Treat Rev. 33:347–357. 2007. View Article : Google Scholar : PubMed/NCBI
|
|
7
|
Fedier A, Dedes KJ, Imesch P, et al: The
histone deacetylase inhibitors suberoylanilide hydroxamic
(Vorinostat) and valproic acid induce irreversible and
MDR1-independent resistance in human colon cancer cells. Int J
Oncol. 31:633–641. 2007.PubMed/NCBI
|
|
8
|
Dedes KJ, Dedes I, Imesch P, et al:
Acquired vorinostat resistance shows partial cross-resistance to
‘second-generation’ HDAC inhibitors and correlates with loss of
histone acetylation and apoptosis but not with altered HDAC and HAT
activities. Anticancer Drugs. 20:321–333. 2009. View Article : Google Scholar : PubMed/NCBI
|
|
9
|
Imesch P, Dedes KJ, Furlato M, Fink D and
Fedier A: MLH1 protects from resistance acquisition by the histone
deacetylase inhibitor trichostatin A in colon tumor cells. Int J
Oncol. 35:631–640. 2009.PubMed/NCBI
|
|
10
|
Qin T, Castoro R, El Ahdab S, Jelinek J,
Wang X, Si J, Shu J, He R, Zhang N, Chung W, Kantarjian HM and Issa
JP: Mechanisms of resistance to decitabine in the myelodysplastic
syndrome. PLoS One. 6:e233722011. View Article : Google Scholar : PubMed/NCBI
|
|
11
|
Qin T, Jelinek J, Si J, Shu J and Issa JP:
Mechanisms of resistance to 5-aza-2′-deoxycytidine in human cancer
cell lines. Blood. 113:659–667. 2009. View Article : Google Scholar : PubMed/NCBI
|
|
12
|
Sripayap P, Nagai T, Uesawa M, Kobayashi
H, Tsukahara T, Ohmine K, Muroi K and Ozawa K: Mechanisms of
resistance to azacitidine in human leukemia cell lines. Exp
Hematol. 42:294–306. 2014. View Article : Google Scholar : PubMed/NCBI
|
|
13
|
Mahfouz RZ, Jankowska A, Ebrahem Q, Gu X,
Visconte V, Tabarroki A, Terse P, Covey J, Chan K, Ling Y, Engelke
KJ, et al: Increased CDA expression/activity in males contributes
to decreased cytidine analog half-life and likely contributes to
worse outcomes with 5-azacytidine or decitabine therapy. Clin
Cancer Res. 19:938–948. 2013. View Article : Google Scholar : PubMed/NCBI
|
|
14
|
Damaraju VL, Mowles D, Yao S, Ng A, Young
JD, Cass CE and Tong Z: Role of human nucleoside transporters in
the uptake and cytotoxicity of azacitidine and decitabine.
Nucleosides Nucleotides Nucleic Acids. 31:236–255. 2012. View Article : Google Scholar : PubMed/NCBI
|
|
15
|
Hummel-Eisenbeiss J, Hascher A, Hals PA,
Sandvold ML, Müller-Tidow C, Lyko F and Rius M: The role of human
equilibrative nucleoside transporter 1 on the cellular transport of
the DNA methyltransferase inhibitors 5-azacytidine and CP-4200 in
human leukemia cells. Mol Pharmacol. 84:438–450. 2013. View Article : Google Scholar : PubMed/NCBI
|
|
16
|
Arimany-Nardi C, Errasti-Murugarren E,
Minuesa G, Martinez-Picado J, Gorboulev V, Koepsell H and
Pastor-Anglada M: Nucleoside transporters and human organic cation
transporter 1 determine the cellular handling of
DNA-methyltransferase inhibitors. Br J Pharmacol. 171:3868–3880.
2014. View Article : Google Scholar : PubMed/NCBI
|
|
17
|
Cowan LA, Talwar S and Yang AS: Will DNA
methylation inhibitors work in solid tumors? A review of the
clinical experience with azacitidine and decitabine in solid
tumors. Epigenomics. 2:71–86. 2010. View Article : Google Scholar : PubMed/NCBI
|
|
18
|
Azad N, Zahnow CA, Rudin CM and Baylin SB:
The future of epigenetic therapy in solid tumours - lessons from
the past. Nat Rev Clin Oncol. 10:256–266. 2013. View Article : Google Scholar : PubMed/NCBI
|
|
19
|
Flis S, Gnyszka A and Flis K: DNA
methyltransferase inhibitors improve the effect of chemotherapeutic
agents in SW48 and HT-29 colorectal cancer cells. PLoS One.
9:e923052014. View Article : Google Scholar : PubMed/NCBI
|
|
20
|
Ikehata M, Ogawa M, Yamada Y, Tanaka S,
Ueda K and Iwakawa S: Different effects of epigenetic modifiers on
the cytotoxicity induced by 5-fluorouracil, irinotecan or
oxaliplatin in colon cancer cells. Biol Pharm Bull. 37:67–73. 2014.
View Article : Google Scholar : PubMed/NCBI
|
|
21
|
Baylin SB and Ohm JE: Epigenetic gene
silencing in cancer - a mechanism for early oncogenic pathway
addiction? Nat Rev Cancer. 6:107–116. 2006. View Article : Google Scholar : PubMed/NCBI
|
|
22
|
Ahmed D, Eide PW, Eilertsen IA, Danielsen
SA, Eknæs M, Hektoen M, Lind GE and Lothe RA: Epigenetic and
genetic features of 24 colon cancer cell lines. Oncogenesis.
2:e712013. View Article : Google Scholar : PubMed/NCBI
|
|
23
|
Issa JP: CpG island methylator phenotype
in cancer. Nat Rev Cancer. 4:988–993. 2004. View Article : Google Scholar : PubMed/NCBI
|
|
24
|
Kakumoto M, Takara K, Sakaeda T,
Tanigawara Y, Kita T and Okumura K: MDR1-mediated interaction of
digoxin with antiarrhythmic or antianginal drugs. Biol Pharm Bull.
25:1604–1607. 2002. View Article : Google Scholar : PubMed/NCBI
|
|
25
|
de Jonge HJ, Fehrmann RS, de Bont ES,
Hofstra RM, Gerbens F, Kamps WA, de Vries EG, van der Zee AG, te
Meerman GJ and ter Elst A: Evidence based selection of housekeeping
genes. PLoS One. 2:e8982007. View Article : Google Scholar : PubMed/NCBI
|
|
26
|
Wong ML and Medrano JF: Real-time PCR for
mRNA quantitation. Biotechniques. 39:75–85. 2005. View Article : Google Scholar : PubMed/NCBI
|
|
27
|
Suzuki H, Watkins DN, Jair KW, Schuebel
KE, Markowitz SD, Chen WD, Pretlow TP, Yang B, Akiyama Y, Van
Engeland M, Toyota M, et al: Epigenetic inactivation of SFRP genes
allows constitutive WNT signaling in colorectal cancer. Nat Genet.
36:417–422. 2004. View
Article : Google Scholar : PubMed/NCBI
|
|
28
|
Ueno H, Kiyosawa K and Kaniwa N:
Pharmacogenomics of gemcitabine: Can genetic studies lead to
tailor-made therapy? Br J Cancer. 97:145–151. 2007. View Article : Google Scholar : PubMed/NCBI
|
|
29
|
Lyons J, Bayar E, Fine G, McCullar M,
Rolens R, Rubinfeld J and Rosenfeld C: Decitabine: Development of a
DNA methyltransferase inhibitor for hematological malignancies.
Curr Opin Investig Drugs. 4:1442–1450. 2003.PubMed/NCBI
|
|
30
|
Kihslinger JE and Godley LA: The use of
hypomethylating agents in the treatment of hematologic
malignancies. Leuk Lymphoma. 48:1676–1695. 2007. View Article : Google Scholar : PubMed/NCBI
|
|
31
|
Robak T: New nucleoside analogs for
patients with hematological malignancies. Expert Opin Investig
Drugs. 20:343–359. 2011. View Article : Google Scholar : PubMed/NCBI
|
|
32
|
Qiu X, Hother C, Ralfkiær UM, Søgaard A,
Lu Q, Workman CT, Liang G, Jones PA and Grønbæk K: Equitoxic doses
of 5-azacytidine and 5-aza-2′deoxycytidine induce diverse immediate
and overlapping heritable changes in the transcriptome. PLoS One.
5:e129942010. View Article : Google Scholar : PubMed/NCBI
|
|
33
|
Cashen AF, Shah AK, Todt L, Fisher N and
DiPersio J: Pharmacokinetics of decitabine administered as a 3-h
infusion to patients with acute myeloid leukemia (AML) or
myelodysplastic syndrome (MDS). Cancer Chemother Pharmacol.
61:759–766. 2008. View Article : Google Scholar : PubMed/NCBI
|
|
34
|
Marquez VE, Kelley JA, Agbaria R,
Ben-Kasus T, Cheng JC, Yoo CB and Jones PA: Zebularine: A unique
molecule for an epigenetically based strategy in cancer
chemotherapy. Ann NY Acad Sci. 1058:246–254. 2005. View Article : Google Scholar : PubMed/NCBI
|
|
35
|
Panczyk M: Pharmacogenetics research on
chemotherapy resistance in colorectal cancer over the last 20
years. World J Gastroenterol. 20:9775–827. 2014. View Article : Google Scholar : PubMed/NCBI
|
|
36
|
Damia G and Broggini M: Cell cycle
checkpoint proteins and cellular response to treatment by
anticancer agents. Cell Cycle. 3:46–50. 2004. View Article : Google Scholar : PubMed/NCBI
|
|
37
|
Mini E, Nobili S, Caciagli B, Landini I
and Mazzei T: Cellular pharmacology of gemcitabine. Ann Oncol.
17:v7–v12. 2006. View Article : Google Scholar : PubMed/NCBI
|
|
38
|
Kahramanoğullari O, Fantaccini G, Lecca P,
Morpurgo D and Priami C: Algorithmic modeling quantifies the
complementary contribution of metabolic inhibitions to gemcitabine
efficacy. PLoS One. 7:e501762012. View Article : Google Scholar : PubMed/NCBI
|
|
39
|
Ohmine K, Kawaguchi K, Ohtsuki S, Motoi F,
Egawa S, Unno M and Terasaki T: Attenuation of phosphorylation by
deoxycytidine kinase is key to acquired gemcitabine resistance in a
pancreatic cancer cell line: Targeted proteomic and metabolomic
analyses in PK9 cells. Pharm Res. 29:2006–2016. 2012. View Article : Google Scholar : PubMed/NCBI
|
|
40
|
Hodge LS, Taub ME and Tracy TS: The
deaminated metabolite of gemcitabine, 2′,2′-difluorodeoxyuridine,
modulates the rate of gemcitabine transport and intracellular
phosphorylation via deoxycytidine kinase. Drug Metab Dispos.
39:2013–2016. 2011. View Article : Google Scholar : PubMed/NCBI
|