Introduction
Lung cancer remains the leading cause of
cancer-related mortality worldwide (1). In the United States this year, an
estimated 224,210 individuals will be diagnosed with lung cancer,
with ~159,260 fatalities anticipated to occur, as reported by the
Surveillance, Epidemiology, and End Results Program at the National
Cancer Institute (2). The same
program also found an average 5-year survival rate of merely 16.8%,
thus demonstrating an extremely unfavorable prognosis for lung
cancer patients. This primarily results from late-stage diagnosis
and a lack of effective late-stage interventions (2). Among the various histological forms of
lung cancer, non-small cell adenocarcinoma constitutes the most
common subtype, and thus presents the greatest challenge for
patients and caregivers.
Lung adenocarcinoma is a malignant tumor of the
glandular cells, a specialized cell type that produces mucus and
supports internal structural integrity. The underlying pathogenic
mechanism leading to bronchial malignancy remains largely elusive.
It has been established that smoking plays a significant role in
the initiation and progression of lung adenocarcinoma (3–6). However,
10–40% of cases occur in patients with no reported smoking history,
suggesting the involvement of other risk factors, including
environmental exposure and genetic susceptibility (7). Patients with a smoking history harbor
10-fold more frequent point mutations compared with never-smokers,
as demonstrated by two elegant system-based genetic studies that
utilized global whole-genome sequencing to provide convincing
evidence that smoking exerts a profound effect on the overall
genomic architecture (8,9). Notably, the spectrum of mutated genes
for smokers compared with never-smokers appears to be largely
distinct. For example, multiple independent studies reported a
significant association of KRAS and epidermal growth factor
receptor (EGFR) mutations with smokers and never-smokers,
respectively (8–11), indicating different oncogene-driven
mechanisms that depend upon smoking status.
Despite these promising findings, the mechanism by
which the expression of cancer-relevant genes dictates the temporal
and dynamic development of lung cancer, particularly in the early
stages, remains to be fully characterized. To address this issue,
the present study aimed to analyze global gene expression profiles
from never-smoker (NS) and current smoker (CS) patients with stage
I and II lung adenocarcinoma. This was greatly facilitated by
public access to Gene Expression Omnibus (GEO; http://www.ncbi.nlm.nih.gov/geo/), an
international repository that encourages the archival and retrieval
of high-throughput datasets for versatile and independent
investigation. Microarray expression profiles (accession number,
GSE10072) that were derived from fresh frozen tumor and paired
normal tissues of lung adenocarcinoma patients were extracted
(12). While the original study
primarily focused on pair-wise comparison between the NS and CS
groups (12), the current study
re-examined the expression dataset by systemically comparing tumor
tissue with normal samples within either the NS or CS group. This
strategy maximized the signal-to-noise ratio by reducing expression
variations due to individual differences, and facilitated more
effective determination of smoking-dependent and -independent
molecular mechanisms involved in lung carcinogenesis. Through
various data mining approaches, gene expression profiles and
biological pathways that are important for initiation and
development of lung cancers were identified.
Materials and methods
Data collection
A search of GEO was conducted, and one microarray
expression dataset (GSE10072) (12)
was downloaded. Fresh frozen tissue samples of lung adenocarcinoma
and paired non-involved lung tissue were obtained from NS patients,
defined as individuals who had smoked ≤100 cigarettes during their
lifetime, and CS patients. All patients were enrolled at East
Hospital of Tongji University School of Medicine between 2012 and
2013. To exclude possible changes in gene expression due to
advanced tumor status, only patients with tumor tissues at the
early stages (stage I and II) were selected as research subjects.
Specifically, 9 normal samples and 10 tumor samples were dissected
from the NS patients, and 13 normal samples and 20 tumor samples
from the CS patients. The Affymetrix Human Genome U133A Array
(Affymetrix, Inc., Santa Clara, CA, USA) was used as the profiling
platform. Unprocessed data (.cel files) were collected, and the
probe annotation files downloaded accordingly for further
investigation.
Data processing and filtering
A number of algorithms were available to quantify
and integrate microarray intensity. GeneChip Robust Multichip
Average (GC-RMA) in the R package gcrma (13) was selected and utilized in the present
study. The normalization process was conducted in three steps:
Model-based background correction, quantile normalization and
summarization. In order to filter out uninformative data (control
probesets, other internal controls and genes with below-background
expression), the genefilter package in R language with nsFilter
function was utilized. However, probesets without Entrez Gene
identifiers or with identical Entrez Gene identifiers were not
removed by the filter.
Differentially-expressed gene (DEG)
analysis
Two physiologically relevant comparisons were
statistically investigated. Comparison 1 was made between tumor
biopsies and matching normal tissues from NS patients, whereas
comparison 2 was made between these tissue types in CS patients. By
means of the R package Limma (14) in
Bioconductor, significantly altered gene expression was determined
in tumor samples compared with normal controls. For probes that had
identical Entrez Gene identifiers, only the probe exhibiting the
largest variance was included for downstream DEG analysis. Genes
with a |log2(fold change)| of >2, and an adjusted
P-value of <0.01 were defined as significantly differentially
expressed between the two groups. The adjusted P-value was
calculated through Benjamini and Hochberg's false discovery rate
correction on the original P-value. Significant DEGs identified in
CS and NS patients were then investigated in parallel to determine
genes for which the altered expression was specific to one group or
common to both groups.
Validation of DEGs by reverse
transcription quantitative polymerase chain reaction (RT-qPCR)
To validate that the expression of the identified
DEGs was significantly altered, the top five genes, which were
identified as those exhibiting the highest degree values, as
determined by Cytoscape (15), where
a higher degree indicates a higher number of connections between
genes, in each comparison were re-evaluated using an independent
collection of tumor biopsies and matching healthy controls. Six
patients with lung adenocarcinoma were recruited from the CS or NS
groups (Table I), and all
participants were duly informed of the procedures and consented to
the use of biological samples. The protocol and consent forms were
approved by the Tongji University School of Medicine Human Subjects
Committee. Tumor samples and adjacent non-involved normal tissues
were collected from each subject, followed by RNA extraction using
TRIzol RNA isolation reagent (Life Technologies, Grand Island, NY,
USA). From each sample, 2 µg RNA was transcribed into cDNA using
M-MLV Reverse Transcriptase (Invitrogen Life Technologies,
Carlsbad, CA, USA) following the manufacturer's instructions. cDNA
was then used as a template for PCR, which was performed using SYBR
green reagent (Applied Biosystems Life Technologies, Foster City,
CA, USA). The total PCR reaction volume was 20 µl (10 µl 2X Master
Mix, 1 µl forward primer, 1 µl reverse primer, 5 µl
ddH2O and 3 µl cDNA). The following gene-specific
primers were used: Forward, 5′-TGG AGG TGT GAA CTC TTC GTC-3′ and
reverse, 5′-TCT GTC CGT GCT TCA TAG TCA for FYN; forward,
5′-TTT GCC TGA AAT GGT GAG TAA GG-3′ and reverse, 5′-TGG TTT GCT
TGA GCT GTG TTC-3′ for FLT1; forward, 5′-CCC GCC AGT CAG AAG
TTG AG-3′ and reverse, 5′-AGT CCC TTC GAG GAA CAC TTG-3′ for
BLNK; forward, 5′-GGG GCA AGG TGG AAC AGT TAT-3′ and
reverse, 5′-GGG GCA AGG TGG AAC AGT TAT-3′ and reverse, 5′-CCG CTT
GGA GTG TAT CAG TCA-3′ for FOS; forward, 5′-AAG GAC TGG TAC
TAT ACC CAC AG-3′ and reverse, 5′-TGT CTG CTT GGT CTT TAT CAA CC-3′
for EFNB2; forward, 5′-GGA TGT GCT TAT GCA GGA TTC C-3′ and
reverse, 5′-CAT GTA CTG ACC AGG AGG GAT AG-3′ for CDK1;
forward, 5′-AAT AAG GCG AAG ATC AAC ATG GC-3′ and reverse, 5′-TTT
GTT ACC AAT GTC CCC AAG AG-3′ for CCNB1; forward, 5′-CGG GGG
GTG AGG TAC TTG GTC ATA ATC TGA ATT TCG GCA CCT-3′ and reverse,
5′-CAG TAA CGA TGA GAG GAC CCT-3′ for STAT1; forward, 5′-GGA
ATA TGC ACC ACT TGG AACA-3′ and reverse, 5′-TAA GAC AGG GCA TTT GCC
AAT-3′ for AURKA; forward, 5′-GAC CAC TCC TAG CAA ACC TGG-3′
and reverse, 5′-GGG CGT CTG GCT GTT TTC A-3′ for CDC20;
forward, 5′-CAT CCC GAT GGC ACT CAT CTG-3′ and reverse, 5′-TGC ACT
GAA TCT CAA TCA GGA AG-3′ for CAV1; forward, 5′-GGG CAG CAG
ACC ACT ATGG-3′ and reverse, 5′-CCA GGG TTG ATG GCC TGA G-3′ for
FGR; forward, 5′-CCT CAG ACG ACA ATG ACA CGG-3′ and reverse,
5′-CTC GCT GGA ATG CTT CGA GAT-3′ for ZBTB16; forward,
5′-GCC TGT GCT GAT CTG GTC AT-3′ and reverse, 5′-AAT GGA AGT CCA
AAA CTC GCA-3′ for ADRB2; and forward, 5′-TGG GCT GGA GTG
TTA CAT TCA-3′ and reverse, 5′-GGG GTG AGG TAC TTG GTC ATA AT-3′
for GRK5. PCR was performed under the following conditions:
Denaturation at 95°C for 50 sec, followed by 40 cycles of 95°C for
30 sec, 58°C for 25 sec, 72°C for 25 sec and extension at 95°C for
30 sec, 55°C for 30 sec and 95°C for 30 sec. Relative gene
expression was normalized to β-actin and calculated using the
2-ΔΔCt method (16). The statistical
data were assessed using GraphPad Prism 5.0 software. Statistical
analysis was performed using a two tailed, paired Student's
t-test. P<0.05 was considered to indicate a statistically
significant difference.
 | Table I.Clinical characteristics of patients
recruited for the validation of differentially expressed genes. |
Table I.
Clinical characteristics of patients
recruited for the validation of differentially expressed genes.
| Patient | Gender | Age, years | Smoking status | Diagnosis | Localization | Stage |
|---|
| 1 | Male | 68 | CS | Adenocarcinoma | Middle lobe of
right lung | I |
| 2 | Female | 59 | NS | Adenocarcinoma | Inferior lobe of
left lung | II |
| 3 | Female | 59 | CS | Adenocarcinoma | Inferior lobe of
right lung | II |
| 4 | Male | 49 | NS | Adenocarcinoma | Upper lobe of right
lung | II |
| 5 | Male | 72 | NS | Adenocarcinoma | Inferior lobe of
left lung | I |
| 6 | Male | 67 | CS | Adenocarcinoma | Inferior lobe of
left lung | II |
Hierarchical clustering
Hierarchical clustering was conducted to classify
analyzed samples according to DEG-based global gene expression
profiles. The DEGs, which were classified in specific biological
processes [Gene Ontology (GO) terms; http://www.geneontology.org] and Kyoto Encyclopedia of
Genes and Genomes (KEGG; http://www.genome.jp/kegg/) pathways, were further
extracted and the expression pattern of those DEGs characterized.
Heat maps were generated for the DEGs classified in targeted
biological processes or KEGG pathways using the R package gplots
(17).
GO and KEGG pathway analysis
Multiple R packages, including GO.db (18), KEGG.d (19) and KEGGREST (20), were utilized to detect GO categories
and KEGG pathways with significant over-representation in DEGs
compared with the whole genome. The significantly enriched
biological processes were identified as those with P<0.01, while
for KEGG pathways, P<0.05 was set as the threshold value.
Construction of biological
network
Protein-protein interaction (PPI) pairs were
downloaded from the Human Protein Reference Database (HPRD;
http://www.hprd.org/), Biological General
Repository for Interaction Datasets (BioGRID; http://thebiogrid.org/) and Human Protein-protein
Interaction Prediction (PIP; http://www.compbio.dundee.ac.uk/www-pips/index.jsp) to
estimate and analyze interactions between genes. As a result,
561,405 pair interactions were included in the present database,
and an interaction network was constructed using Cytoscape
(15). Interacted gene pairs included
in the curated PPI database were imported as stored networks.
Following functional enrichment analysis, the DEGs specified in
markedly altered biological processes (GO terms) and KEGG pathways
were mapped to corresponding networks in order to systemically
analyze interactions.
Results
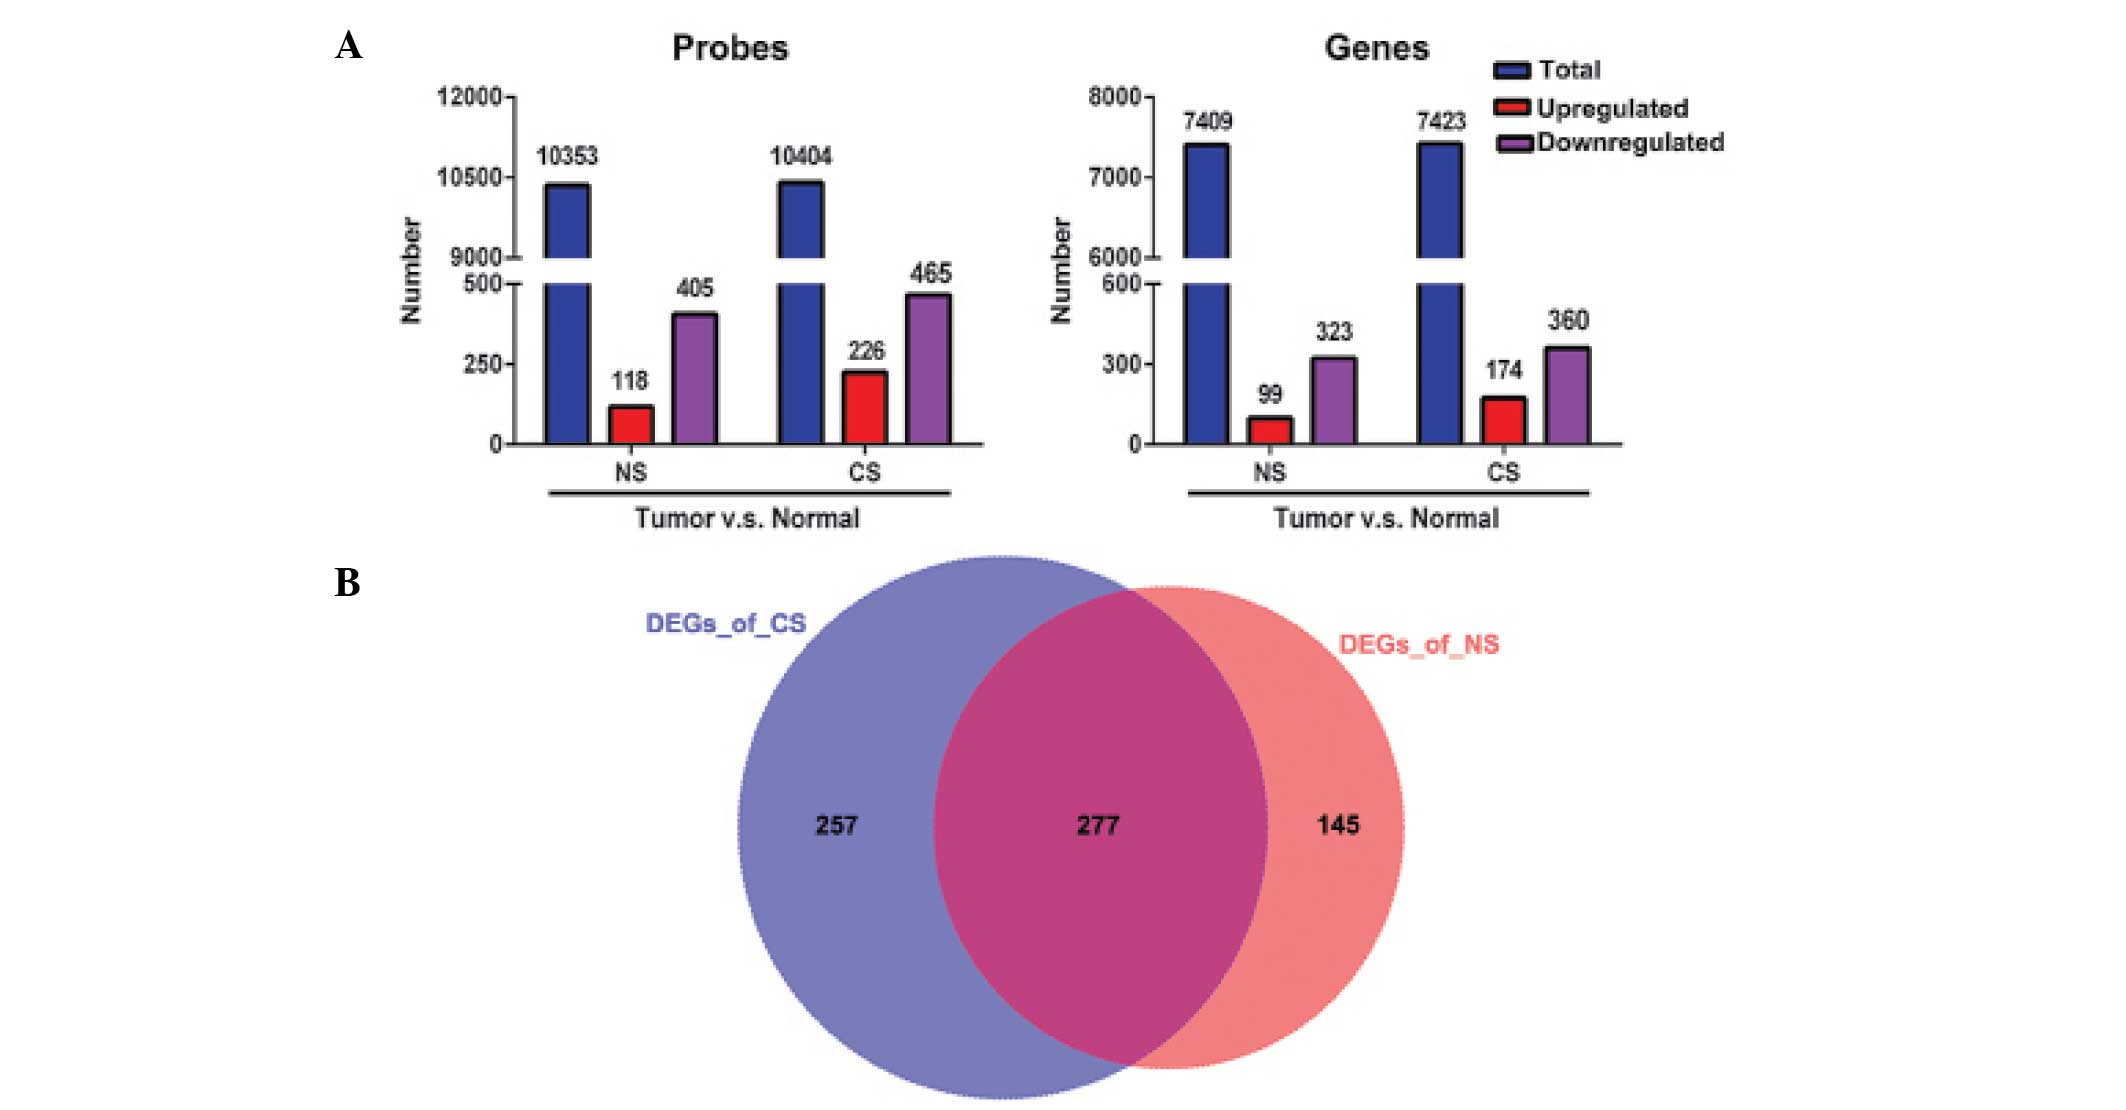
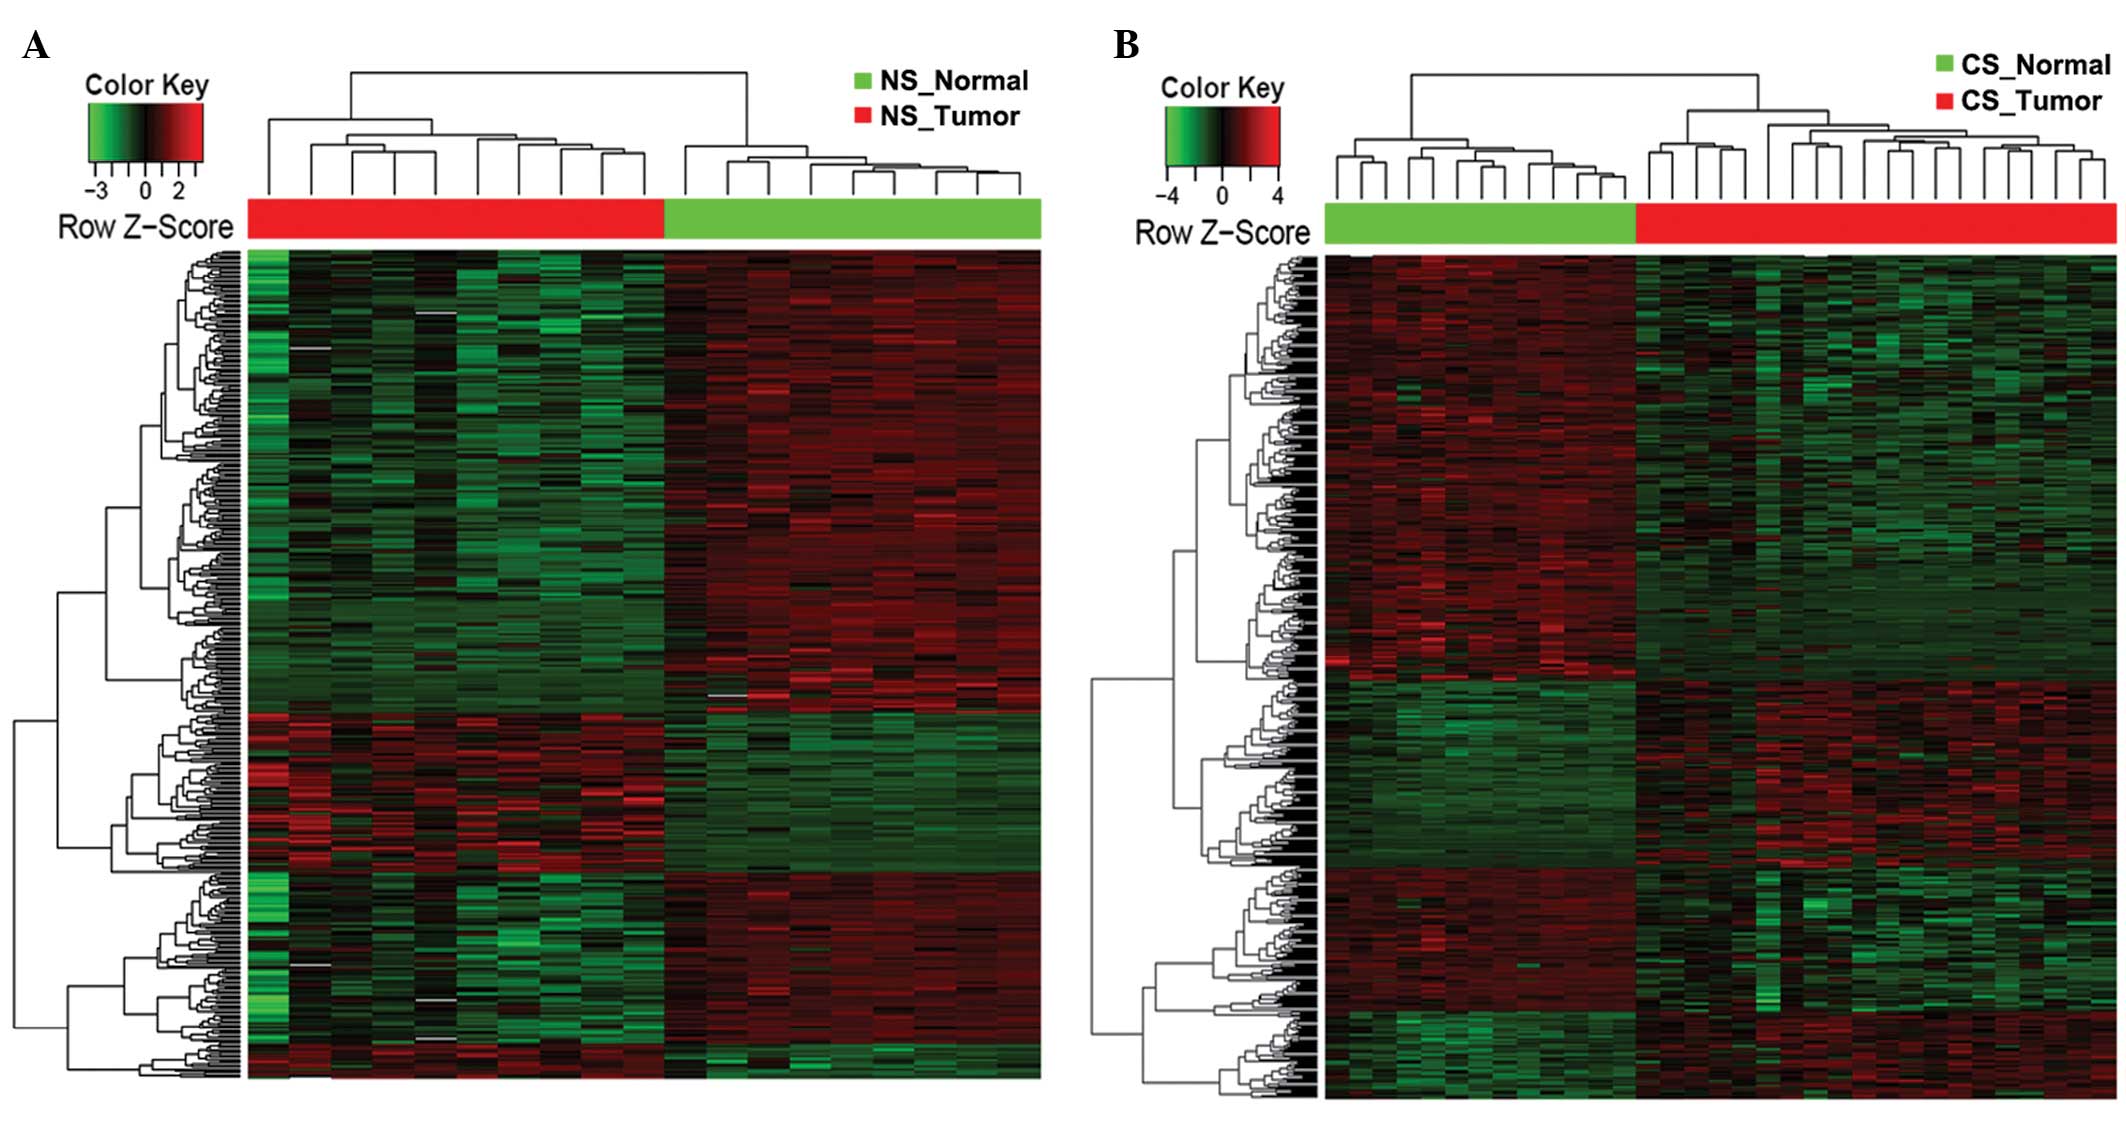
Differential expression analysis
Pair-wise comparison was performed between lung
tumor tissues and adjacent non-involved normal controls within NS
or CS patients, in order to identify DEGs characterized by
|log2 (fold-change)| > 2 and adjusted P-value of
<0.01. A total of 523 and 691 probes were found to be
significantly altered for the NS and CS groups, accounting for 422
(99 upregulated and 323 downregulated) and 534 (174 upregulated and
360 downregulated) DEGs, respectively (Fig. 1A). Among these identified DEGs, 277
altered genes were shared by the CS and NS populations (Fig. 1B), indicating similar genetic
mechanisms of lung adenocarcinoma that are likely to be independent
of smoking status. However, 257 DEGs were identified in the CS
group compared with 145 in the NS group (Fig. 1B), indicating that smoking induces
prominent molecular alterations that contribute to the early stages
of lung cancer.
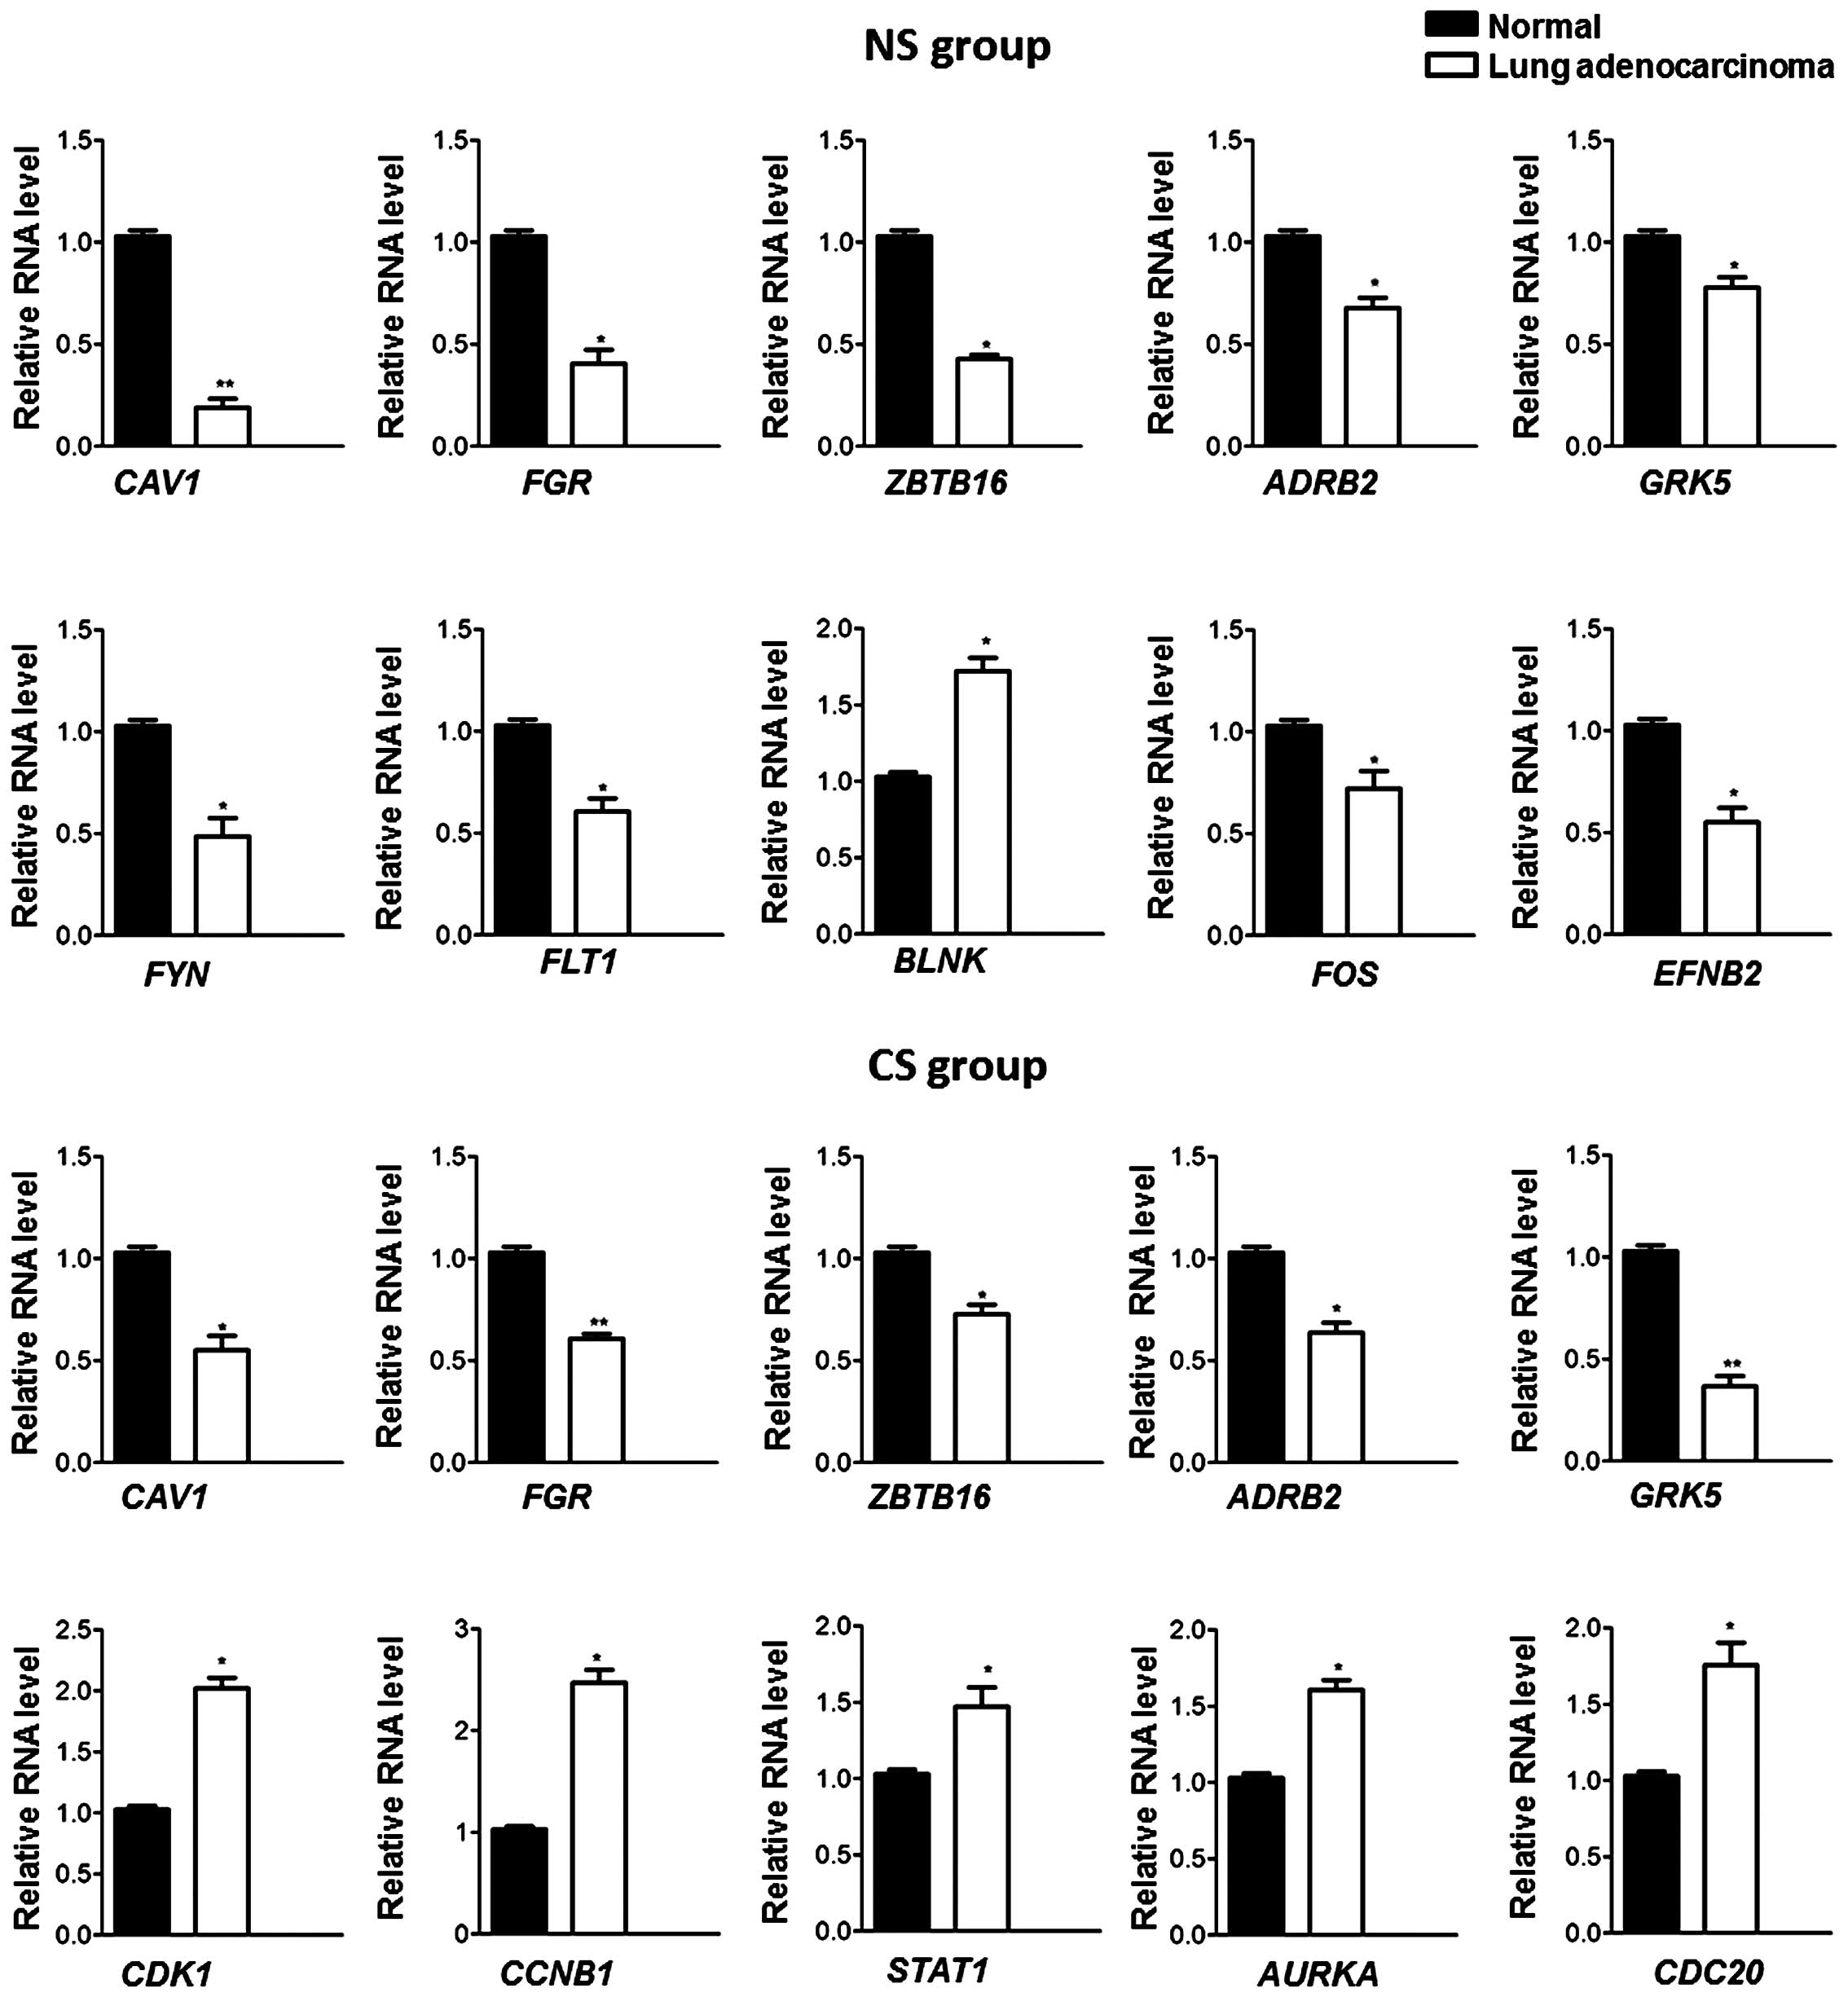
Expression validation of DEGs
To verify the results of the DEG analysis, each of
the top five genes that were commonly shared by the NS and CS
groups (CAV1, FGR, ZBTB16, ADRB2 and
GRK5), specific to the NS group (FYN, FLT1,
BLNK, FOS and EFNB2) or specific to the CS
group (CDK1, CCNB, STAT1, AURKA and
CDC20) were validated using qRT-PCR. As shown in Fig. 2, the results indicated that all these
genes exhibited the same expression patterns, as identified by the
differential expression analysis, thereby corroborating the
validity of the microarray analysis.
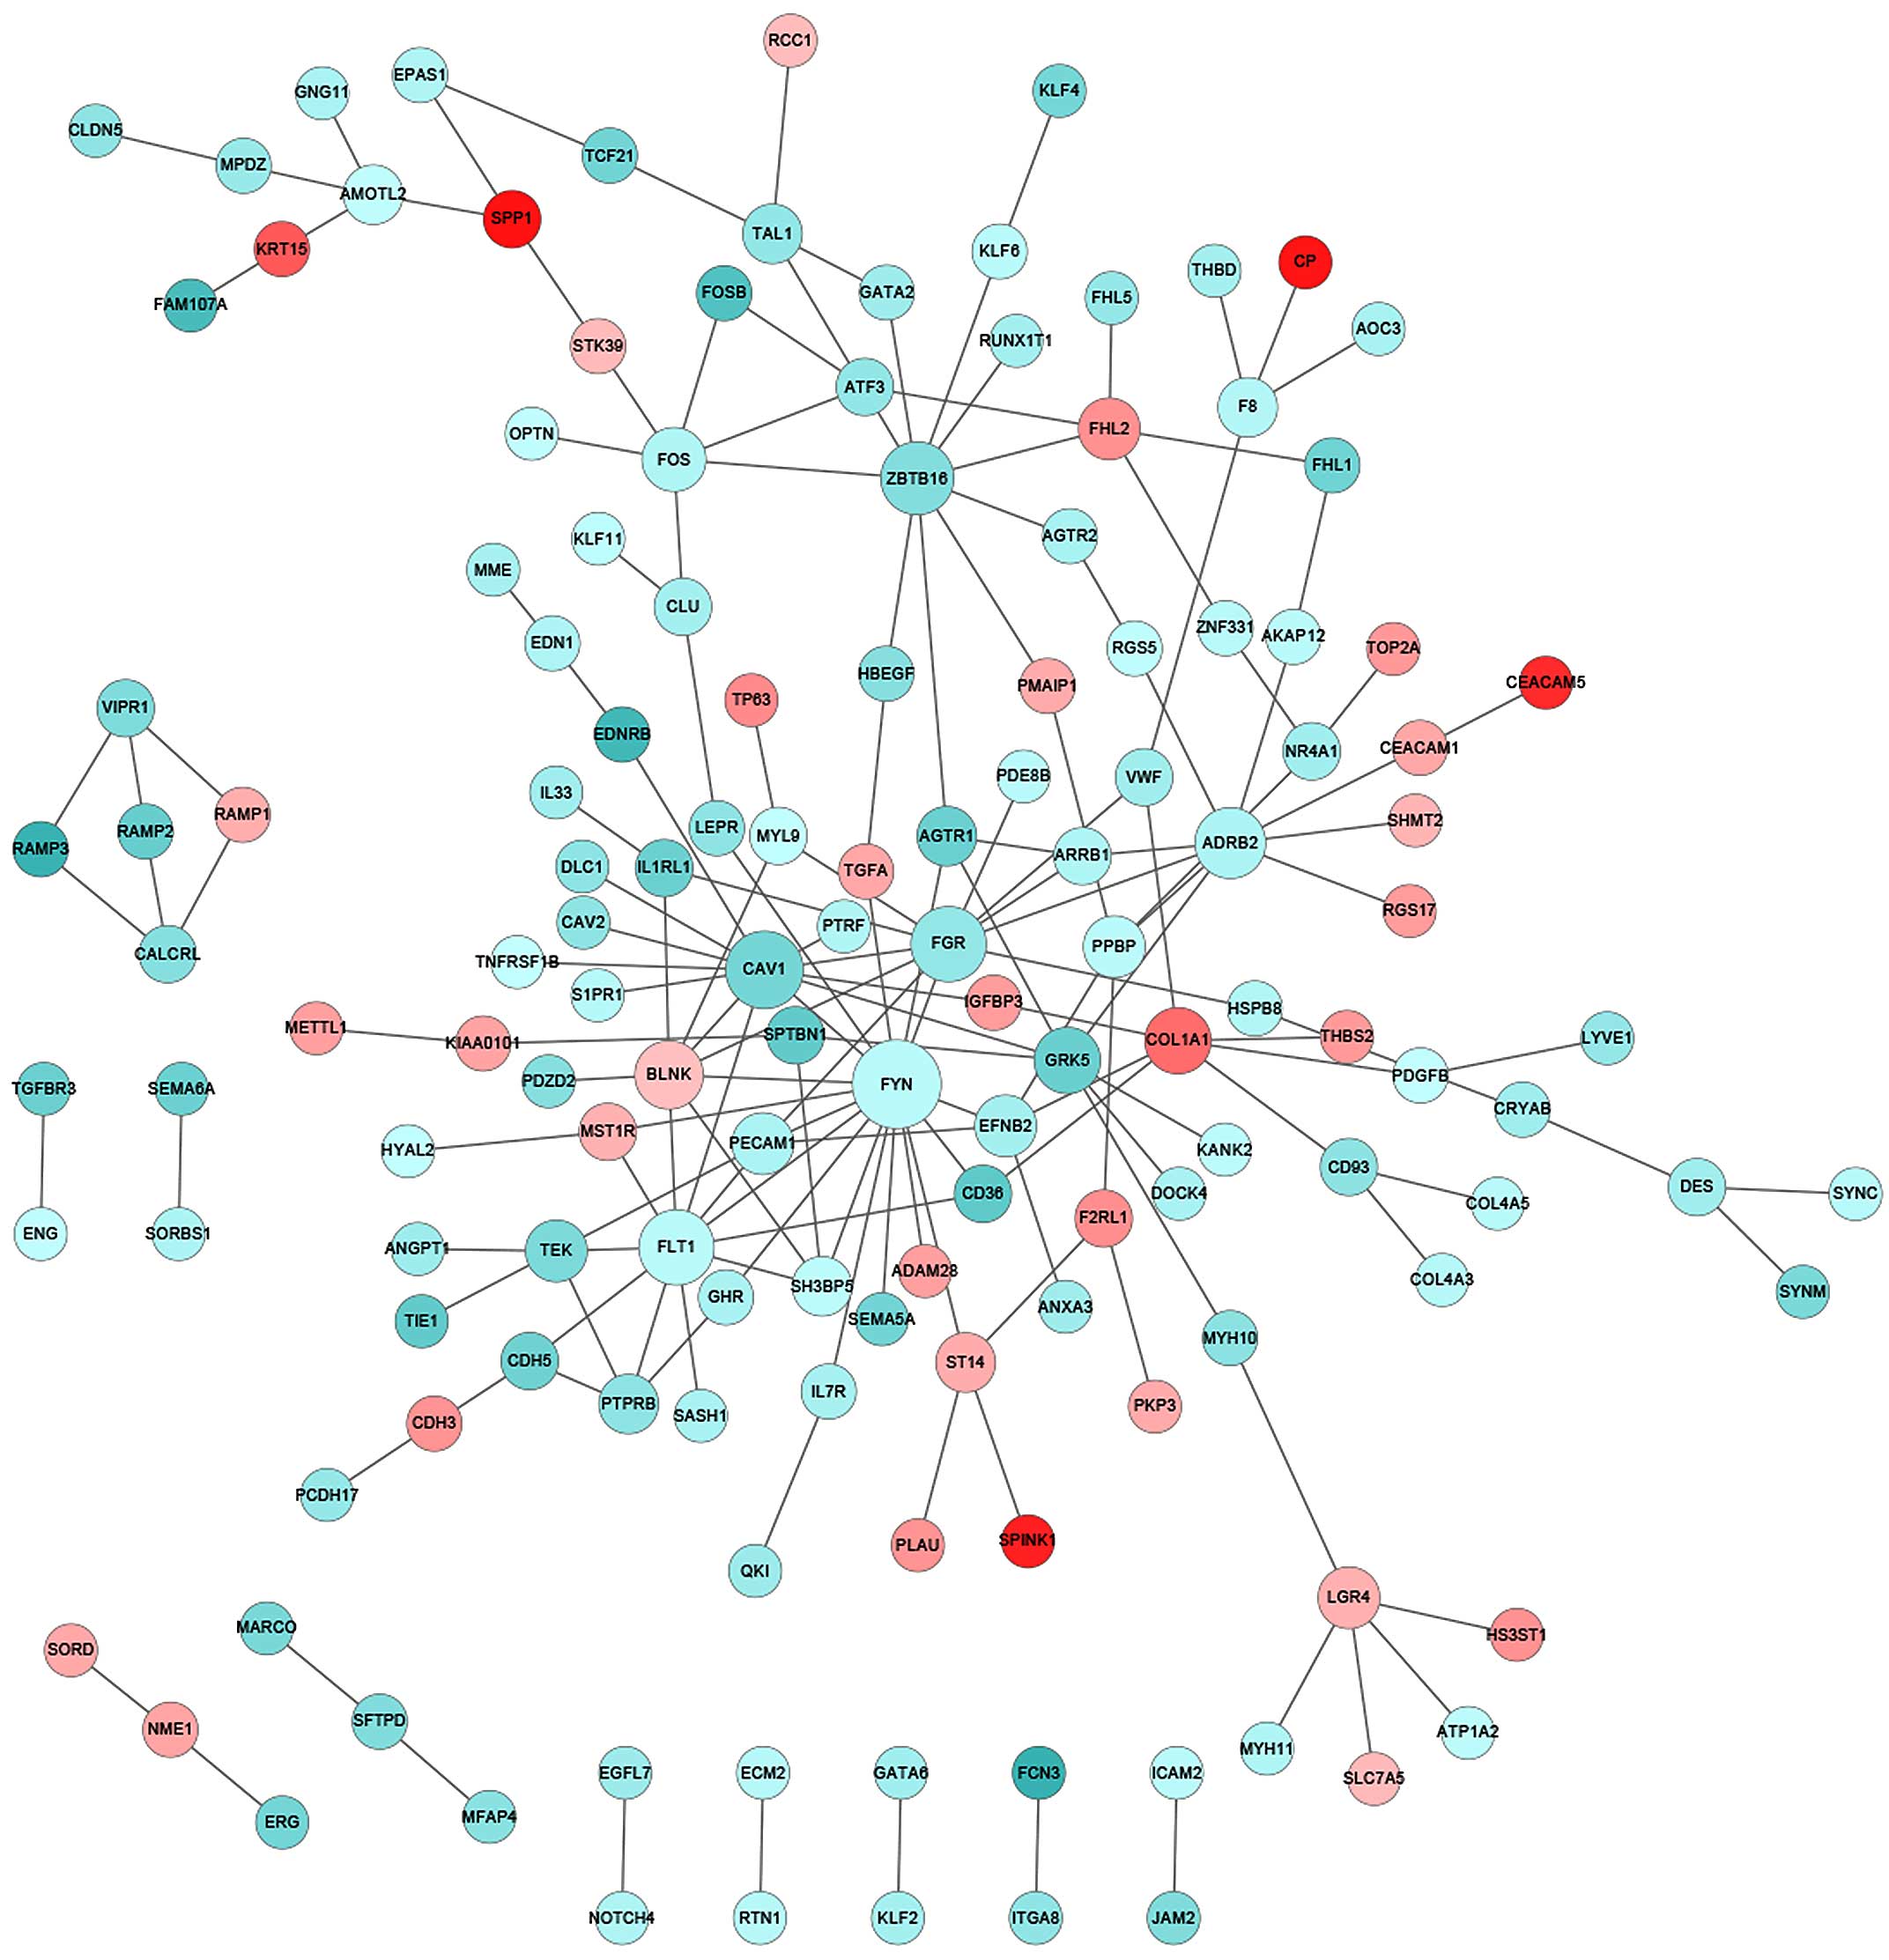
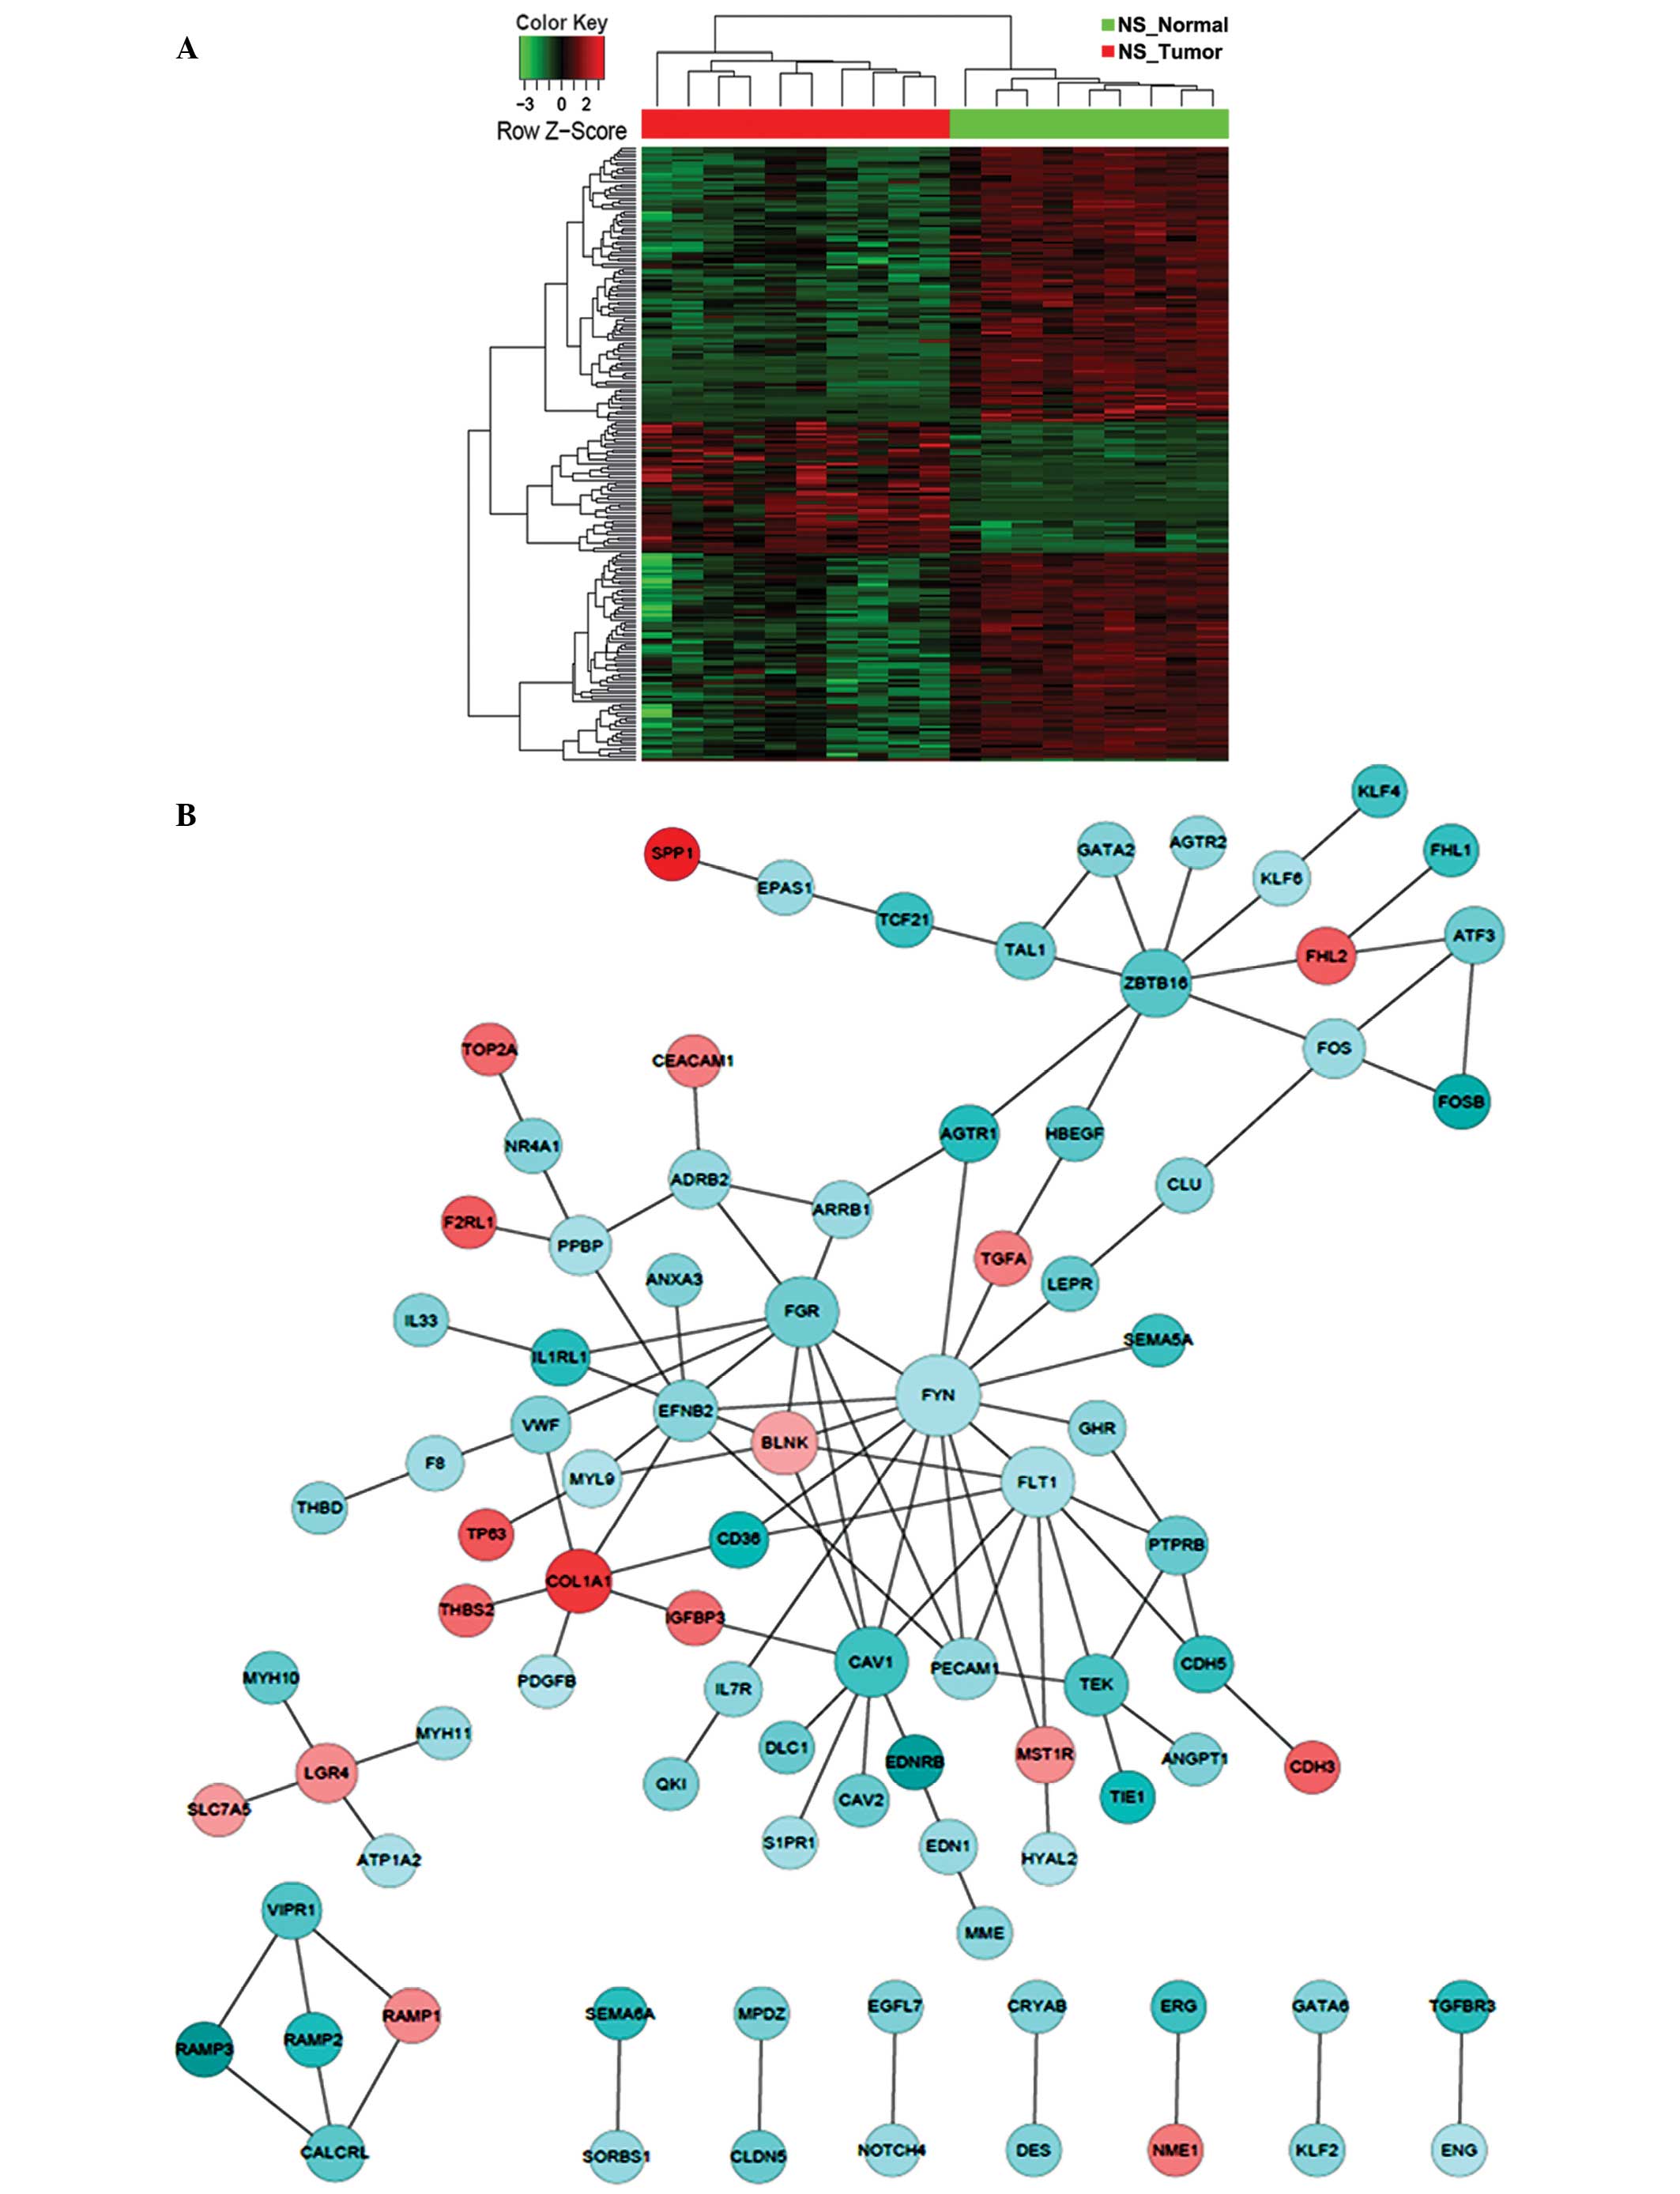
Construction of PPI network
Integrative investigation that combines DEGs into
biologically relevant networks may provide improved mechanistic
insights. Therefore, a large curated PPI database was explored to
identify interactive networks that were significantly altered in
stage I and II lung cancer patients. The PPI database in the
present study included 561,405 pairs of interactions that were
collected cumulatively from the HPRD, BioGRID and PIP databases. In
the tumor biopsies from the NS patients, notable gene participants
in the PPI network with significantly changed expression compared
with that of normal controls included family members of protein
tyrosine kinases (FYN and FGR), vascular endothelial
growth factor (VEGF) receptors (FLT1) and zinc finger
transcription factors (ZBTB16) (Fig. 3). In particular, FYN appeared
to be a critical player, interacting with a total of 17 DEGs and
serving as the center of the PPI network that was significantly
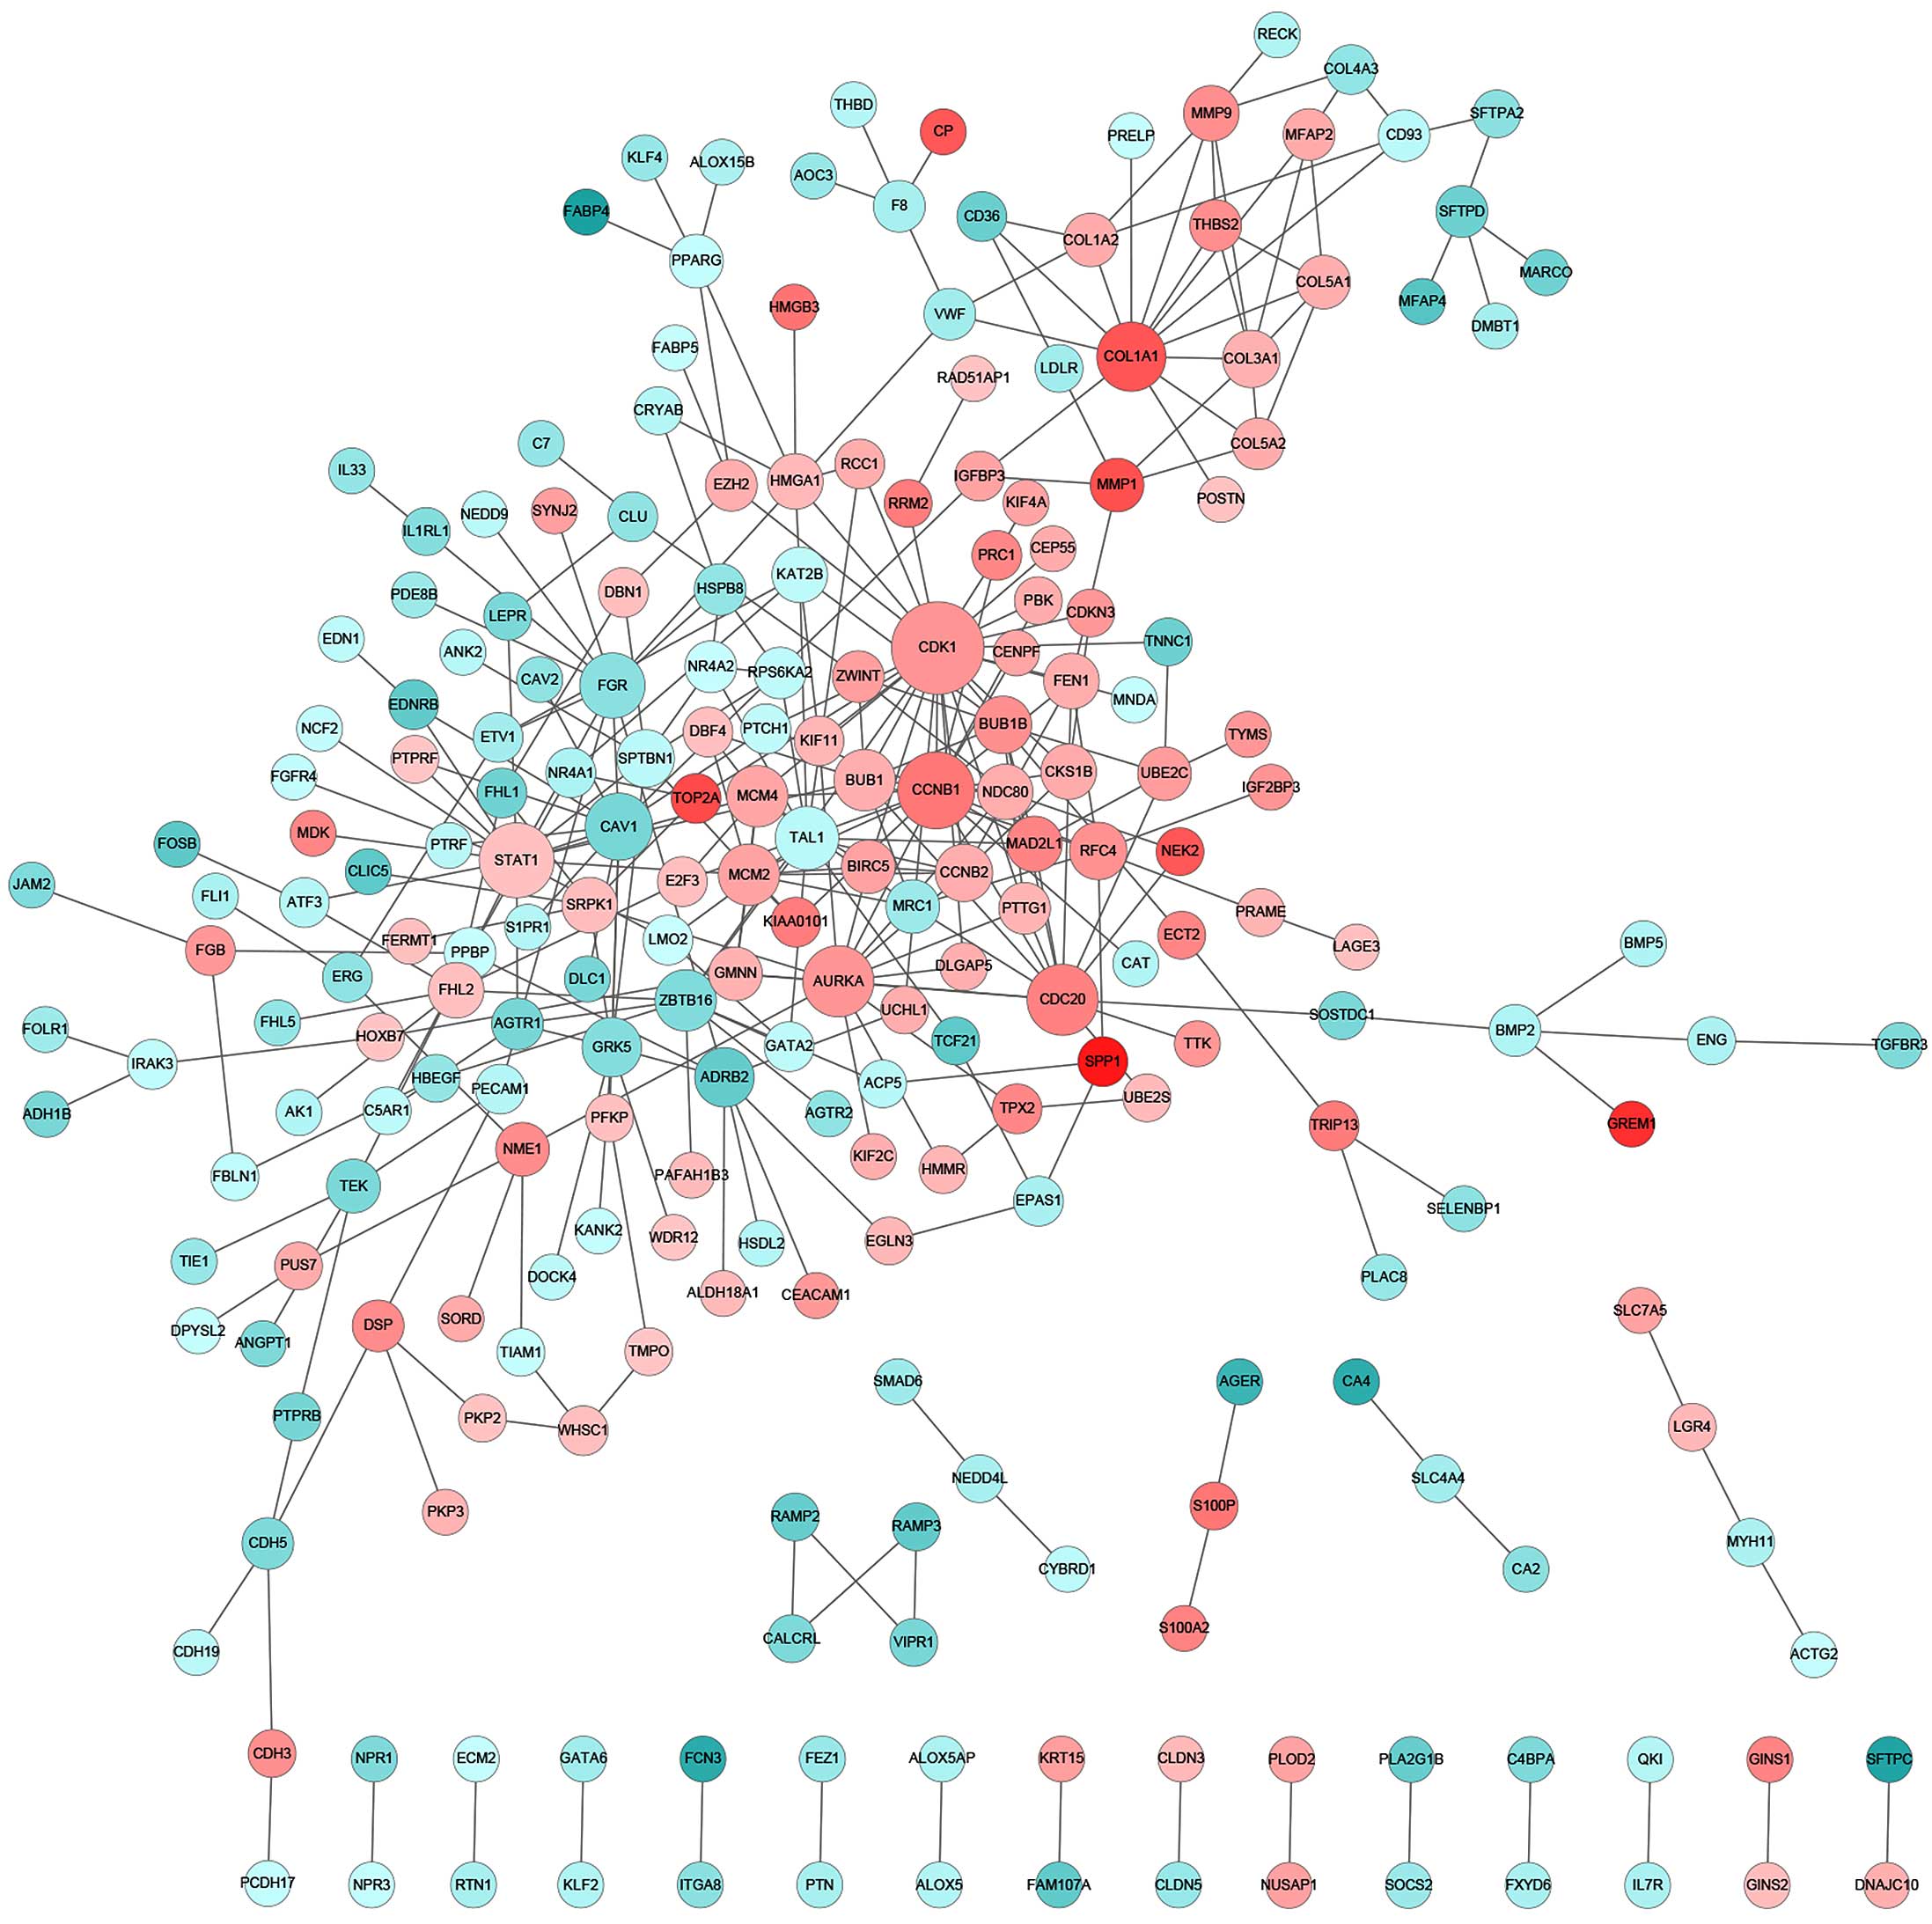
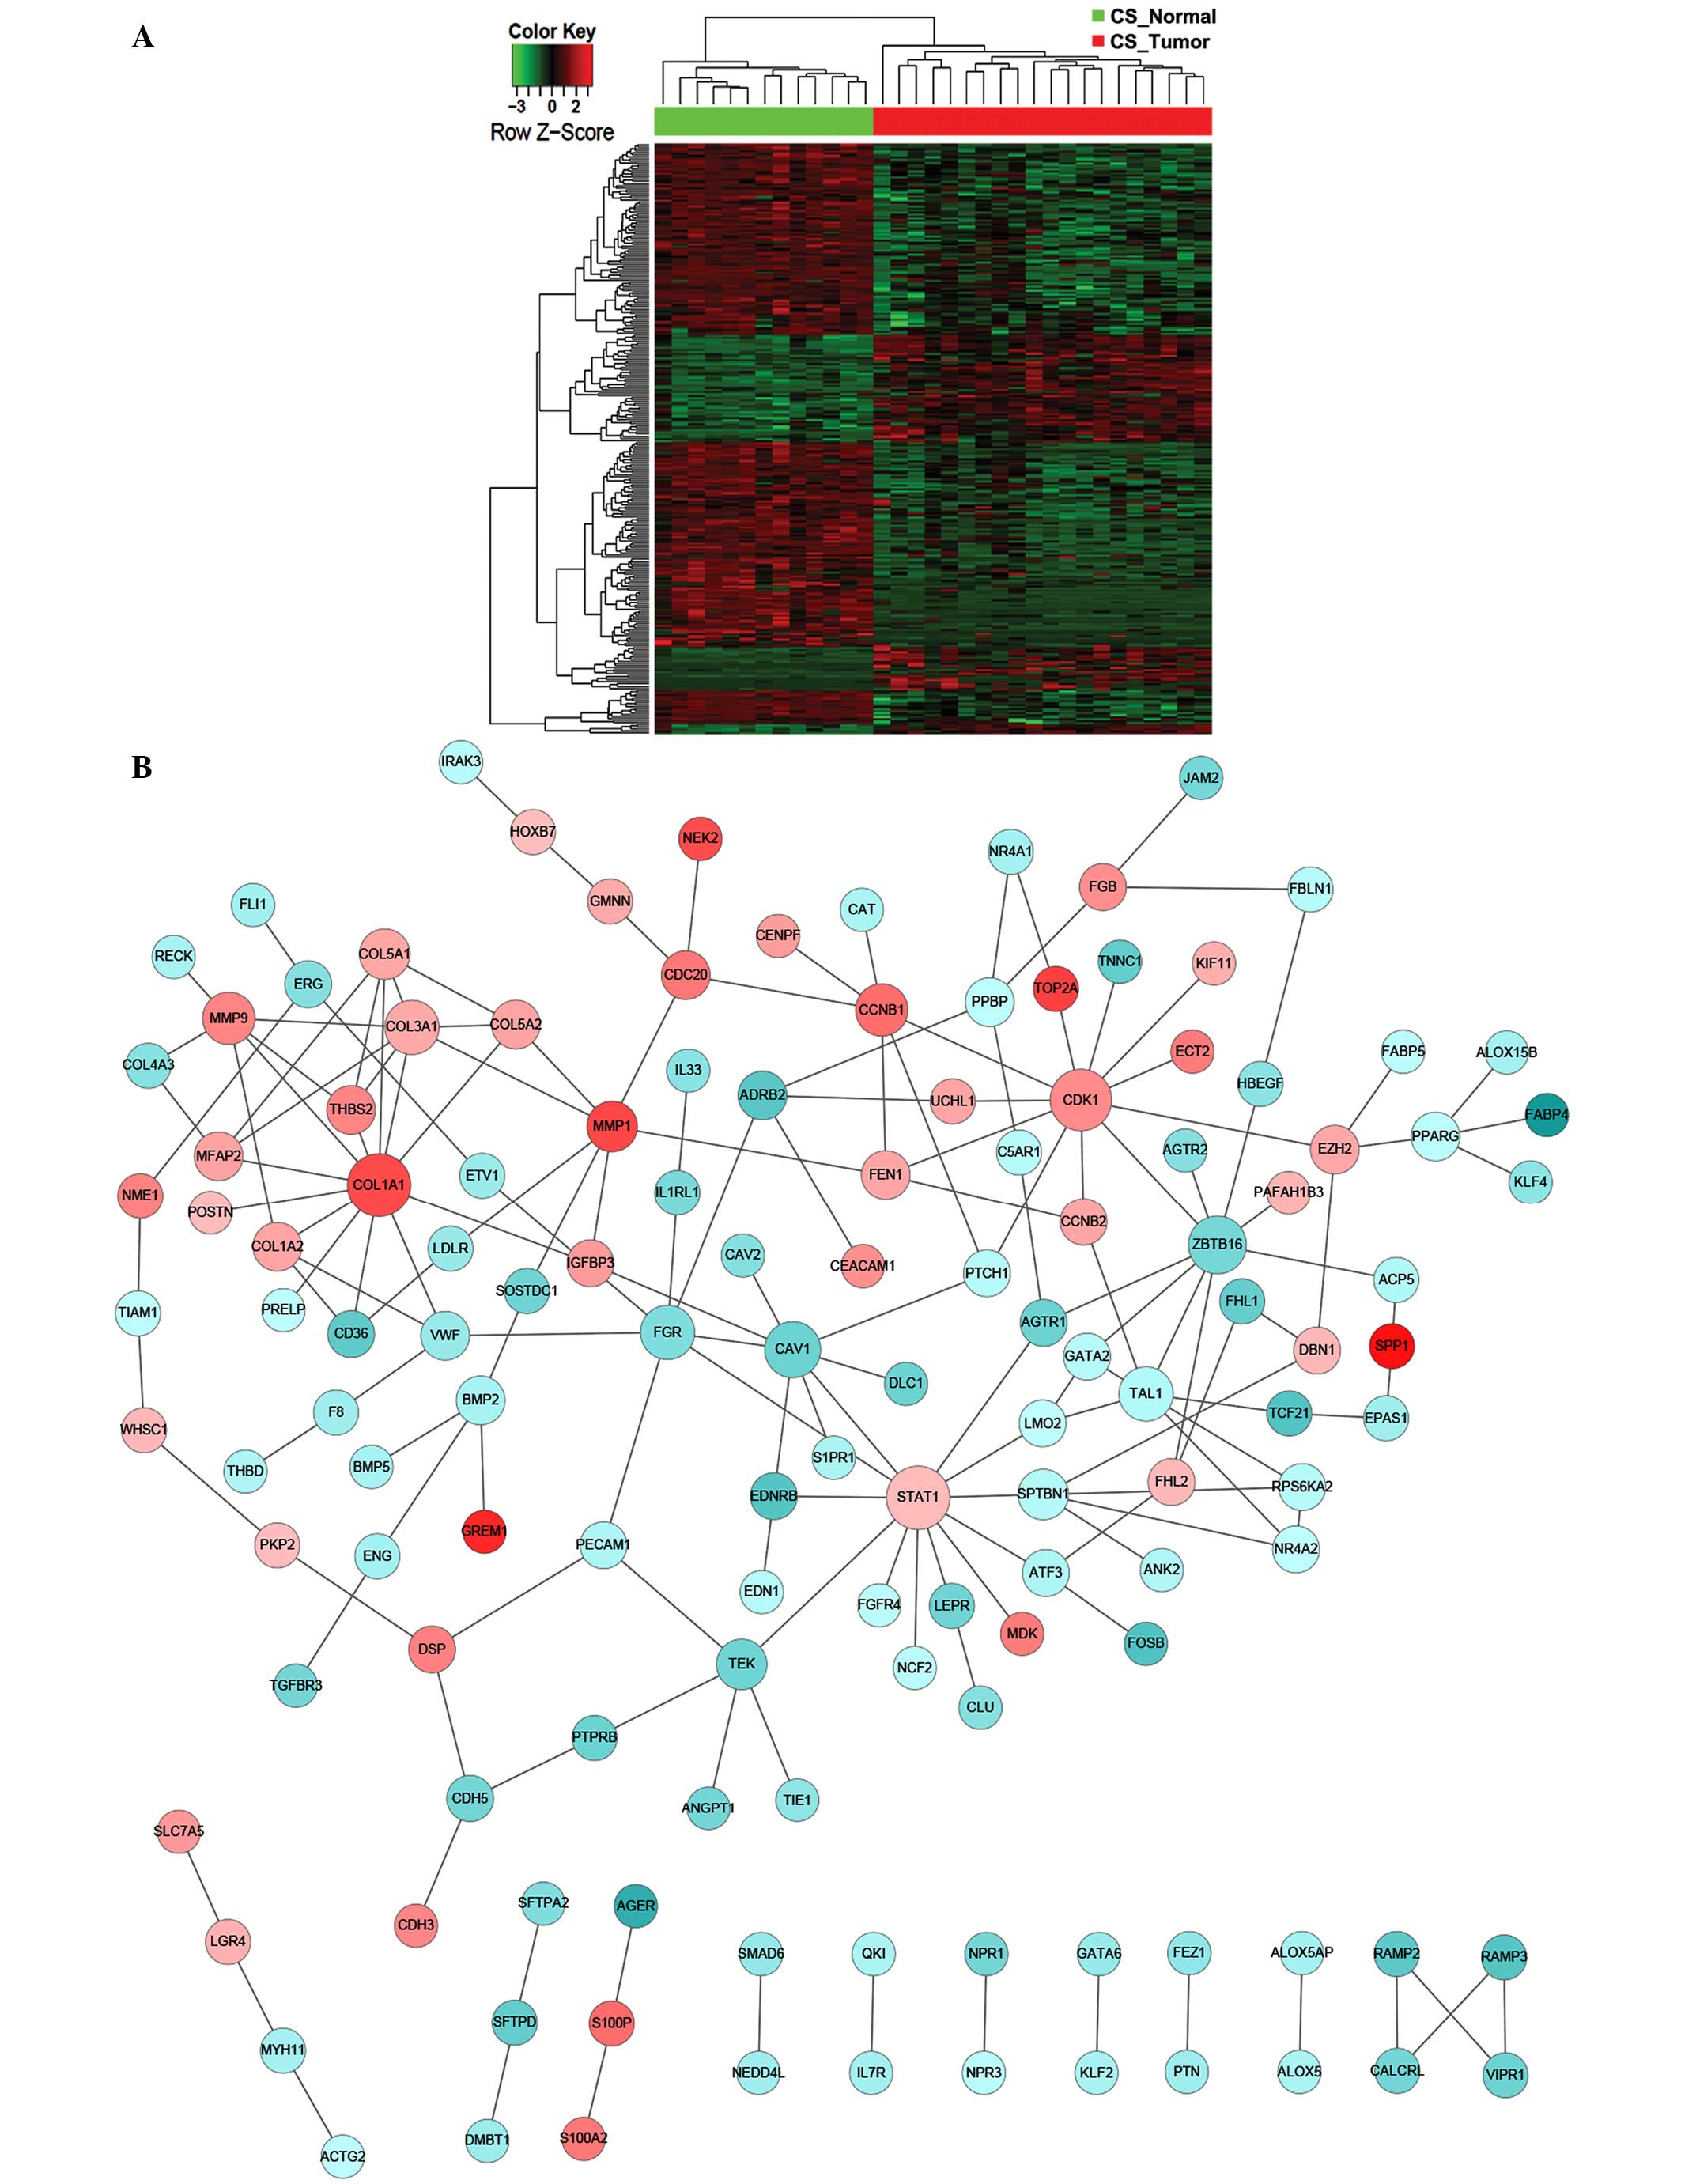
altered (Fig. 3). By contrast, for CS
patients, the key components of significantly altered PPI networks
were largely involved in cell proliferation (CDK1,
CCNB1, AURKA and CDC20), collagen homeostasis
(COL1A1) and growth factor signaling (STAT1)
(Fig. 4). Notably, the Ser/Thr
protein kinase, CDK1, which has previously been reported to be to
associated with lung cancer (21),
was found to be significantly upregulated as a central interactor
with 25 other DEGs, indicating an aberrantly enhanced cell cycle
transition and progression that is likely to contribute to the
pathogenesis of lung adenocarcinoma. Furthermore, distinct lung
tumor biopsies and parallel normal tissues from the NS or CS
patients were clustered together according to the overall DEG
signature (Fig. 5). Among the
participants of the identified PPI networks, FYN and
FLT1 were specific to the NS group, whereas CDK1,
CCNB1, STAT1, AURKA and CDC20 were
unique to the CS patients (Table II
and III). However, numerous PPI
network-relevant DEGs were shared by the NS and CS groups,
including CAV1 and FGR (Table II and III). Indeed, previous studies have
implicated CAV1 as a tumor suppressor that when
downregulated, enhances cancer-endothelium interaction and lung
cancer progression (22,23). Together, these results indicate that
there are smoking-independent and -dependent PPI networks that are
mechanistically responsible for lung carcinogenesis.
| Table II.Top 50 most significant
differentially-expressed genes in the biological network implicated
in lung carcinogenesis for never-smoker patients. |
Table II.
Top 50 most significant
differentially-expressed genes in the biological network implicated
in lung carcinogenesis for never-smoker patients.
| Gene symbol |
Log2(fold change) | P-value | Adjusted
P-value | Degree |
|---|
| FYN | −2.21 |
1.64×10⁻⁵ |
4.07×10⁻⁴ | 17 |
| CAV1* | −4.01 |
1.57×10⁻⁹ |
4.36×10⁻⁷ | 12 |
| FLT1 | −2.19 |
5.43×10⁻⁷ |
2.94×10⁻⁵ | 11 |
| FGR* | −3.20 |
2.69×10⁻⁷ |
1.74×10⁻⁵ | 11 |
|
ZBTB16* | −3.62 |
1.43×10⁻⁵ |
3.69×10⁻⁴ | 10 |
|
ADRB2* | −2.52 |
8.27×10⁻⁵ |
1.34×10⁻³ | 9 |
| BLNK | 2.09 |
1.04×10⁻⁴ |
1.60×10⁻³ | 8 |
| GRK5* | −4.34 |
1.82×10⁻⁷ |
1.33×10⁻⁵ | 7 |
|
COL1A1* | 4.29 |
1.57×10⁻⁵ |
3.95×10⁻⁴ | 7 |
| FOS | −2.42 |
4.96×10⁻⁴ |
5.09×10⁻³ | 6 |
| TEK* | −3.83 |
5.20×10⁻⁹ |
9.78×10⁻⁷ | 5 |
| PPBP* | −2.21 |
9.34×10⁻⁵ |
1.48×10⁻³ | 5 |
|
PECAM1* | −2.55 |
2.02×10⁻⁹ |
5.34×10⁻⁷ | 5 |
| LGR4* | 2.46 |
3.19×10⁻⁶ |
1.19×10⁻⁴ | 5 |
| FHL2* | 3.29 |
4.04×10⁻⁵ |
7.93×10⁻⁴ | 5 |
| EFNB2 | −2.73 |
1.45×10⁻⁴ |
2.07×10⁻³ | 5 |
| TAL1* | −3.22 |
2.31×10⁻⁸ |
2.87×10⁻⁶ | 4 |
| ST14 | 2.55 |
6.68×10⁻⁸ |
6.34×10⁻⁶ | 4 |
| SH3BP5 | −2.15 |
1.51×10⁻⁷ |
1.16×10⁻⁵ | 4 |
|
PTPRB* | −3.33 |
1.84×10⁻⁴ |
2.46×10⁻³ | 4 |
| F8* | −2.36 |
5.14×10⁻⁴ |
5.20×10⁻³ | 4 |
| AMOTL2 | −2.08 |
5.61×10⁻⁵ |
1.01×10⁻³ | 4 |
|
AGTR1* | −4.31 |
3.11×10⁻¹⁰ |
1.38×10⁻⁷ | 4 |
| VWF* | −2.86 |
3.07×10⁻⁸ |
3.58×10⁻⁶ | 3 |
|
VIPR1* | −3.73 |
8.14×10⁻⁶ |
2.49×10⁻⁴ | 3 |
|
SPTBN1* | −4.57 |
1.32×10⁻¹⁰ |
7.45×10⁻⁸ | 3 |
| SPP1* | 7.14 |
1.01×10⁻¹⁰ |
6.60×10⁻⁸ | 3 |
|
NR4A1* | −2.81 |
5.04×10⁻⁴ |
5.14×10⁻³ | 3 |
| MYL9 | −2.04 |
3.14×10⁻⁵ |
6.48×10⁻⁴ | 3 |
| MST1R | 2.44 |
1.32×10⁻⁷ |
1.07×10⁻⁵ | 3 |
|
IL1RL1* | −4.30 |
1.49×10⁻⁴ |
2.11×10⁻³ | 3 |
| F2RL1 | 3.34 |
1.02×10⁻⁶ |
5.13×10⁻⁵ | 3 |
| DES | −2.85 |
3.88×10⁻⁶ |
1.39×10⁻⁴ | 3 |
| CLU* | −2.74 |
3.79×10⁻⁴ |
4.14×10⁻³ | 3 |
| CDH5* | −4.20 |
3.75×10⁻¹⁰ |
1.54×10⁻⁷ | 3 |
| CD93* | −3.36 |
4.01×10⁻⁸ |
4.25×10⁻⁶ | 3 |
| CD36* | −4.65 |
8.07×10⁻¹⁰ |
2.56×10⁻⁷ | 3 |
|
CALCRL* | −3.55 |
7.65×10⁻⁹ |
1.25×10⁻⁶ | 3 |
| ATF3* | −3.23 |
1.09×10⁻³ |
8.99×10⁻³ | 3 |
| ARRB1 | −2.46 |
4.24×10⁻⁷ |
2.46×10⁻⁵ | 3 |
| ZNF331 | −2.25 |
4.75×10⁻⁶ |
1.63×10⁻⁴ | 2 |
| TGFA | 2.70 |
1.30×10⁻⁵ |
3.44×10⁻⁴ | 2 |
|
TCF21* | −4.12 |
3.99×10⁻⁷ |
2.37×10⁻⁵ | 2 |
| STK39 | 2.22 |
8.23×10⁻⁸ |
7.35×10⁻⁶ | 2 |
|
SFTPD* | −3.69 |
3.23×10⁻⁵ |
6.64×10⁻⁴ | 2 |
| RGS5 | −2.09 |
1.02×10⁻⁵ |
2.94×10⁻⁴ | 2 |
|
RAMP3* | −5.81 |
4.17×10⁻¹⁰ |
1.60×10⁻⁷ | 2 |
|
RAMP2* | −4.42 |
8.28×10⁻¹¹ |
6.13×10⁻⁸ | 2 |
| RAMP1 | 2.51 |
1.33×10⁻⁵ |
3.51×10⁻⁴ | 2 |
| PMAIP1 | 2.61 |
1.17×10⁻³ |
9.47×10⁻³ | 2 |
| Table III.Top 50 most significant
differentially-expressed genes in the biological network implicated
in lung carcinogenesis for current smoker patients. |
Table III.
Top 50 most significant
differentially-expressed genes in the biological network implicated
in lung carcinogenesis for current smoker patients.
| Gene symbol |
Log2(fold change) | P-value | Adjusted
P-value | Degree |
|---|
| CDK1 | 3.30 |
4.05×10⁻⁹ |
1.39×10⁻⁷ | 25 |
| CCNB1 | 4.13 |
1.26×10⁻¹¹ |
1.12×10⁻⁹ | 17 |
| STAT1 | 2.13 |
5.52×10⁻⁶ |
6.15×10⁻⁵ | 16 |
| AURKA | 3.28 |
8.81×10⁻¹⁰ |
4.01×10⁻⁸ | 14 |
| CDC20 | 3.85 |
8.04×10⁻⁹ |
2.49×10⁻⁷ | 14 |
|
COL1A1* | 5.12 |
1.49×10⁻¹⁰ |
8.91×10⁻⁹ | 13 |
| CAV1* | −4.11 |
3.74×10⁻¹³ |
6.69×10⁻¹¹ | 12 |
| FGR* | −3.58 |
2.58×10⁻⁸ |
6.96×10⁻⁷ | 11 |
| TAL1* | −2.28 |
2.50×10⁻⁸ |
6.76×10⁻⁷ | 10 |
| MCM2 | 2.94 |
1.01×10⁻⁹ |
4.42×10⁻⁸ | 9 |
| BUB1 | 2.60 |
1.58×10⁻⁷ |
3.18×10⁻⁶ | 9 |
| MCM4 | 2.84 |
1.68×10⁻⁹ |
6.72×10⁻⁸ | 9 |
|
ZBTB16* | −3.85 |
1.84×10⁻⁸ |
5.17×10⁻⁷ | 9 |
| GRK5* | −3.73 |
9.68×10⁻¹³ |
1.38×10⁻¹⁰ | 8 |
|
ADRB2* | −4.67 |
3.52×10⁻¹² |
3.99×10⁻¹⁰ | 8 |
| BUB1B | 3.45 |
4.58×10⁻⁷ |
7.76×10⁻⁶ | 7 |
|
SPTBN1* | −2.26 |
9.16×10⁻¹³ |
1.32×10⁻¹⁰ | 7 |
| CCNB2 | 2.64 |
1.37×10⁻⁸ |
4.02×10⁻⁷ | 7 |
| RFC4 | 3.41 |
1.81×10⁻¹⁰ |
1.03×10⁻⁸ | 7 |
| COL3A1 | 2.56 |
8.70×10⁻⁹ |
2.68×10⁻⁷ | 7 |
| KAT2B | −2.19 |
5.49×10⁻⁵ |
3.92×10⁻⁴ | 6 |
| FEN1 | 2.63 |
4.44×10⁻⁸ |
1.09×10⁻⁶ | 6 |
| FHL2* | 2.18 |
1.22×10⁻⁶ |
1.75×10⁻⁵ | 6 |
| CKS1B | 2.71 |
7.25×10⁻¹² |
7.00×10⁻¹⁰ | 6 |
| MAD2L1 | 3.77 |
2.02×10⁻¹⁰ |
1.13×10⁻⁸ | 6 |
| NDC80 | 2.63 |
1.18×10⁻⁶ |
1.68×10⁻⁵ | 6 |
| MMP9 | 3.48 |
1.93×10⁻⁸ |
5.40×10⁻⁷ | 6 |
| HMGA1 | 2.35 |
1.76×10⁻⁹ |
7.00×10⁻⁸ | 6 |
| SRPK1 | 2.24 |
9.91×10⁻¹⁰ |
4.33×10⁻⁸ | 6 |
| TEK* | −3.99 |
9.85×10⁻¹⁷ |
7.29×10⁻¹⁴ | 5 |
| GMNN | 2.51 |
1.86×10⁻⁷ |
3.63×10⁻⁶ | 5 |
| NME1* | 3.56 |
4.41×10⁻¹¹ |
3.29×10⁻⁹ | 5 |
| UBE2C | 3.10 |
3.06×10⁻⁹ |
1.10×10⁻⁷ | 5 |
| MRC1 | −3.08 |
4.36×10⁻⁶ |
5.04×10⁻⁵ | 5 |
| COL5A1 | 2.62 |
5.15×10⁻⁷ |
8.46×10⁻⁶ | 5 |
| COL1A2 | 2.69 |
1.79×10⁻⁹ |
7.07×10⁻⁸ | 5 |
| MMP1 | 5.25 |
1.51×10⁻⁶ |
2.08×10⁻⁵ | 5 |
| BIRC5 | 2.97 |
1.73×10⁻⁷ |
3.41×10⁻⁶ | 5 |
| PPARG | −2.07 |
1.14×10⁻⁶ |
1.64×10⁻⁵ | 5 |
| CD93* | −2.28 |
2.67×10⁻¹¹ |
2.09×10⁻⁹ | 4 |
| F8* | −2.80 |
1.26×10⁻⁸ |
3.71×10⁻⁷ | 4 |
| NR4A2 | −2.01 |
1.44×10⁻³ |
5.42×10⁻³ | 4 |
|
THBS2* | 3.49 |
3.63×10⁻¹⁰ |
1.87×10⁻⁸ | 4 |
| CDH5* | −3.92 |
3.51×10⁻¹² |
3.99×10⁻¹⁰ | 4 |
| COL5A2 | 2.67 |
5.06×10⁻⁷ |
8.34×10⁻⁶ | 4 |
| BMP2 | −2.58 |
9.42×10⁻⁶ |
9.45×10⁻⁵ | 4 |
|
AGTR1* | −4.10 |
4.77×10⁻¹⁴ |
1.26×10⁻¹¹ | 4 |
| PTTG1 | 2.45 |
1.62×10⁻⁹ |
6.55×10⁻⁸ | 4 |
| MFAP2 | 2.72 |
7.23×10⁻⁶ |
7.65×10⁻⁵ | 4 |
| ZWINT | 3.05 |
1.66×10⁻⁸ |
4.76×10⁻⁷ | 4 |
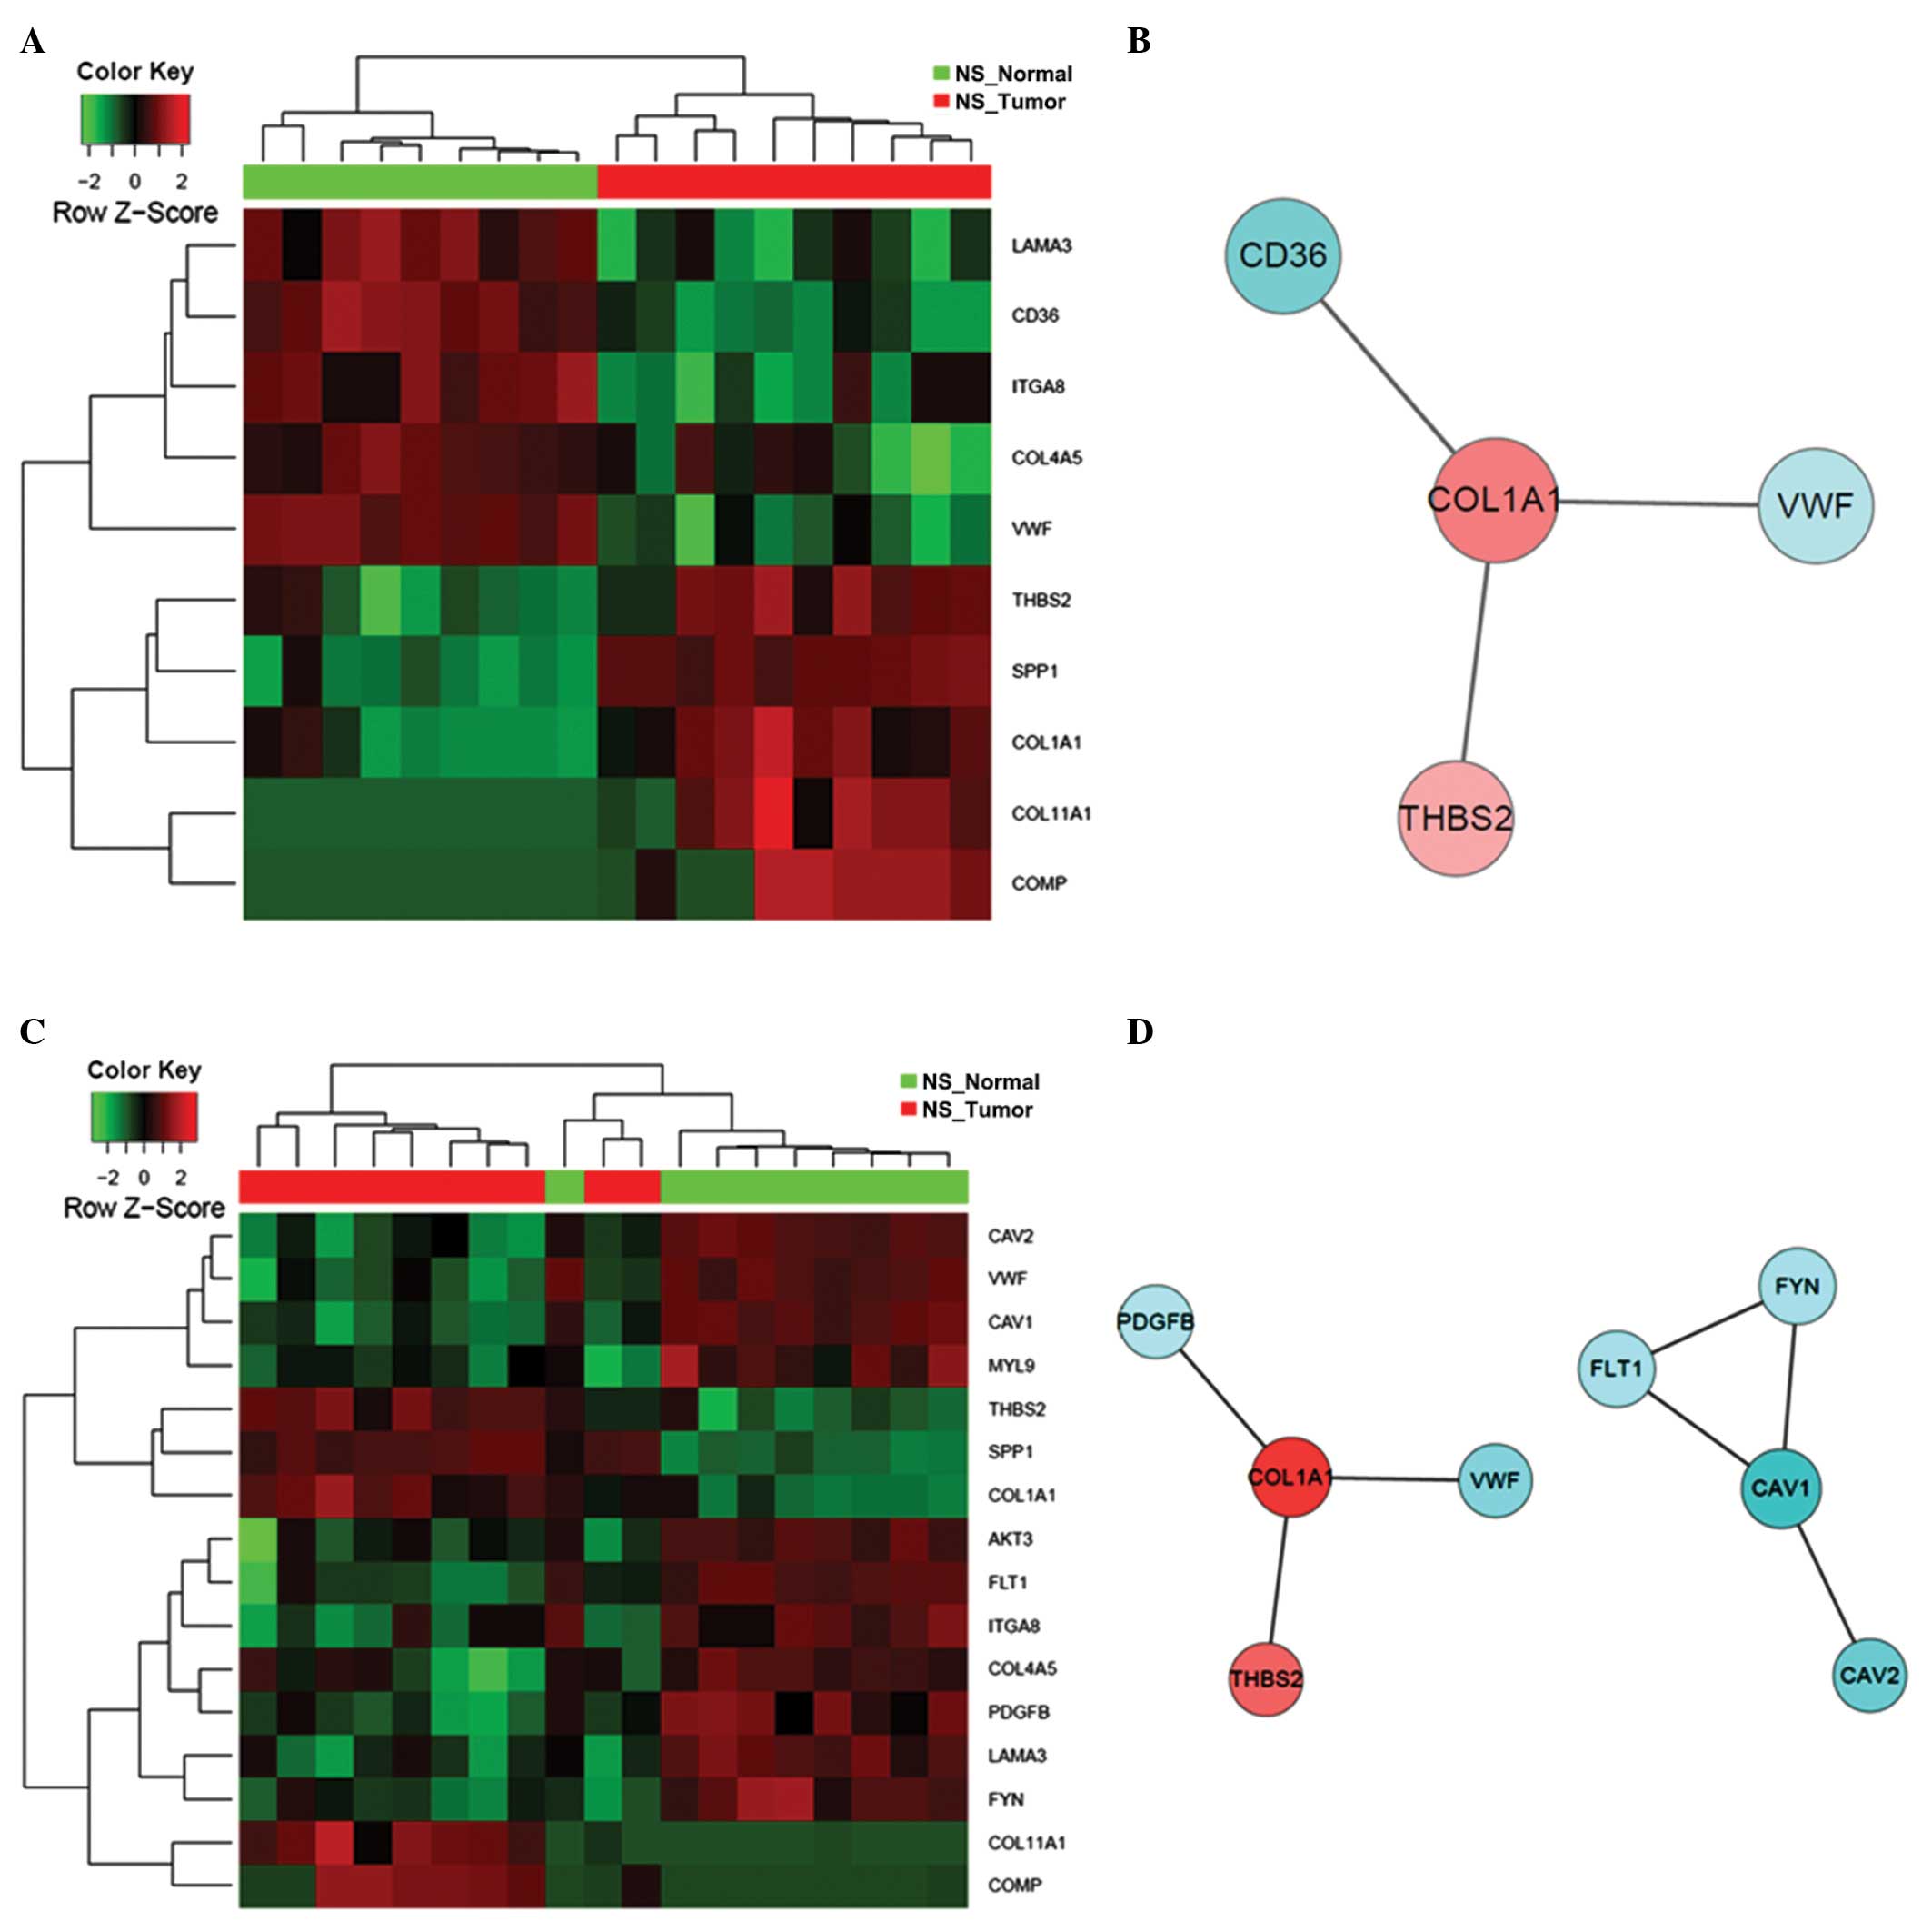
GO and KEGG analysis of DEGs
Systemic integration of cellular functions of the
DEGs into biologically meaningful processes and pathways is greatly
informative, and may reveal underlying mechanistic and therapeutic
targets in lung carcinogenesis. Given the list of DEGs identified
from tumor samples compared with normal tissues in NS and CS
patients, over-representation analysis was performed to uncover
enriched terms based on curated GO and KEGG vocabularies, which are
two similar biological function-focused databases with distinct
infrastructures (24,25). In the lung tumor biopsies from NS
patients, a total of 676 GO biological processes and 17 KEGG
pathways were revealed to be significantly affected (Table IV). The top three GO terms were
‘single-multicellular organism process’, ‘cell migration’ and ‘cell
proliferation’ (Table V), whilst the
most significantly enriched KEGG pathways included ‘extracellular
matrix (ECM)-receptor interaction’ and ‘focal adhesion’ (Table VI). Interaction between FYN,
CAV1 and FLT1 constitutes the central hub of these
relevant PPI networks, further indicating their potential
contributing roles in the early stages of lung carcinogenesis. In
addition, the expression patterns of DEGs that constitute these
significantly altered GO and KEGG terms differed markedly between
the tumor tissues and normal controls from the NS patients, as
demonstrated by the hierarchical clustering of samples in the heat
maps (Figs. 6–9).
| Table IV.GO biological processes and KEGG
pathways significantly altered in lung adenocarcinoma compared with
normal controls for NS and CS patients. |
Table IV.
GO biological processes and KEGG
pathways significantly altered in lung adenocarcinoma compared with
normal controls for NS and CS patients.
|
|
| Altered in
adenocarcinoma, n |
|---|
|
|
|
|
|---|
| Item | Threshold
P-value | NS group | CS group |
|---|
| GO biological
processes | <0.01 | 676 | 854 |
| KEGG pathways | <0.05 | 17 | 19 |
| Table V.Significantly altered GO biological
processes in tumor samples from never-smoker patients. |
Table V.
Significantly altered GO biological
processes in tumor samples from never-smoker patients.
| GO-BP-ID | P-value | Count | Term |
|---|
| GO:0044707 |
1.66×10⁻¹⁷ | 224 |
Single-multicellular organism process |
| GO:0016477 |
7.43×10⁻¹⁶ | 70 | Cell migration |
| GO:0008283 |
3.07×10⁻¹¹ | 88 | Cell
proliferation |
| Table VI.Significantly altered KEGG pathways
in tumor samples from never-smoker patients. |
Table VI.
Significantly altered KEGG pathways
in tumor samples from never-smoker patients.
| KEGG-ID | P-value | Count | Term |
|---|
| 4512 |
1.32×10⁻⁴ | 10 | ECM-receptor
interaction |
| 4510 |
1.61×10⁻⁴ | 16 | Focal adhesion |
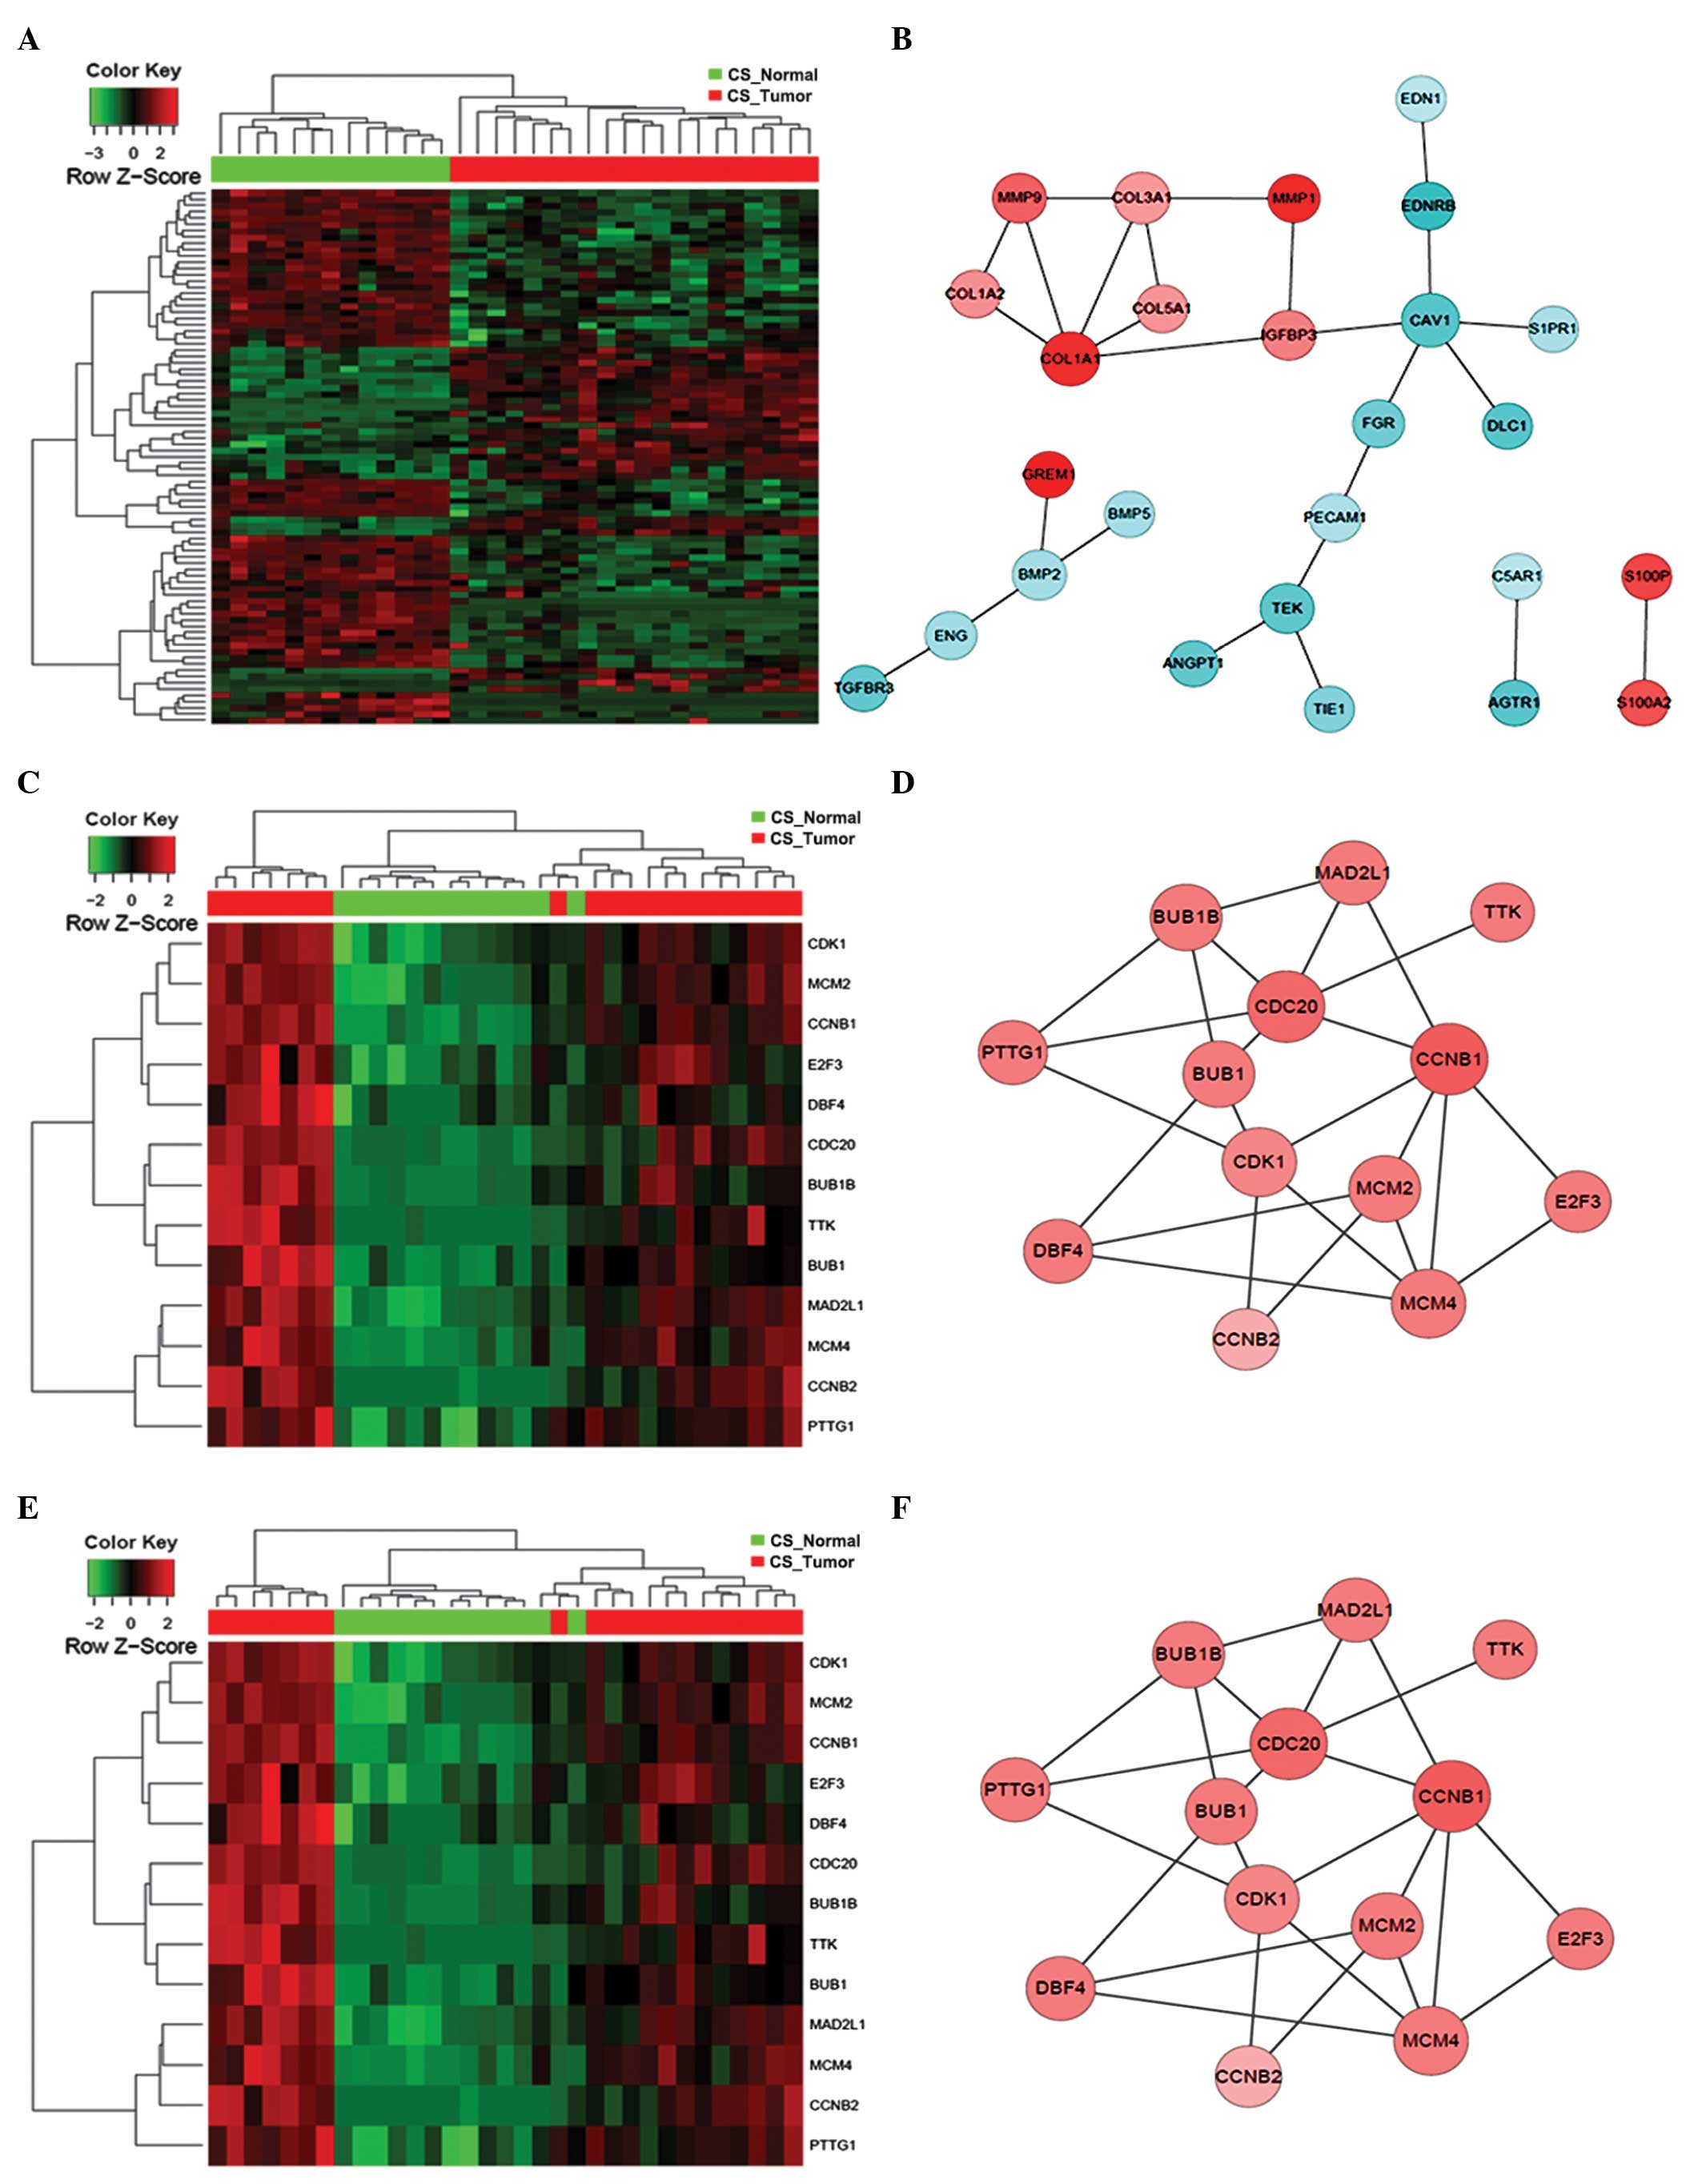
For lung tumor samples from CS patients, a total of
854 GO biological processes and 19 KEGG pathways were identified to
be relevant (Table IV). Among these,
‘single-multicellular organism process’, ‘cell proliferation’ and
‘cell migration’ were identified to be over-represented GO terms,
and ‘ECM-receptor interaction’ an over-represented KEGG pathway
(Table VII and VIII). By contrast, ‘cell cycle’ and ‘p53
signaling pathways’ were exclusively enriched in CS patients
(Table VIII). The expression
profile of DEGs involved in these biological processes and pathways
may also be utilized to distinguish lung tumor samples from normal
controls, as shown by the constructed heat maps (Figs. 10–13).
In contrast to that in the NS patients, the core interaction
network of the enriched terms for CS patients was established on
two central players: CDK1 and COL1A1 (Figs. 10–13),
which dictate cell cycle control and collagen metabolism,
respectively. Taken together, these results indicate that the
cellular machinery of single-multicellular organism processes, cell
proliferation, cell migration and ECM-receptor interaction may
contribute to smoking-independent early stages of lung
adenocarcinoma, whereas dysregulated cell cycle control and p53
signaling cascades are associated with smoking-induced lung
carcinogenesis.
| Table VII.Significantly altered GO biological
processes in tumor samples from current smoker patients. |
Table VII.
Significantly altered GO biological
processes in tumor samples from current smoker patients.
| GO-BP-ID | P-value | Count | Term |
|---|
| GO:0044707 |
5.90×10⁻²³ | 292 |
Single-multicellular organism process |
| GO:0008283 |
2.37×10⁻¹⁸ | 124 | Cell
proliferation |
| GO:0016477 |
3.29×10⁻¹⁷ | 85 | Cell migration |
| Table VIII.Significantly altered KEGG pathways
in tumor samples from current smoker patients. |
Table VIII.
Significantly altered KEGG pathways
in tumor samples from current smoker patients.
| KEGG-ID | P-value | Count | Term |
|---|
| 4512 |
1.58×10⁻⁵ | 13 | ECM-receptor
interaction |
| 4110 |
7.88×10⁻⁴ | 13 | Cell cycle |
| 4115 |
4.35×10⁻² | 6 | p53 signaling
pathway |
Discussion
The systemic molecular expression signature induced
by smoking in lung cancer patients remains incompletely
characterized. In the present study, publicly available microarray
expression datasets derived from NS and CS patients with stage I or
II lung adenocarcinoma were utilized. Despite a number of previous
studies that have molecularly characterized genetic profiles in
lung cancer patients with or without smoking history (26–30), the
present investigation focused on a relatively larger cohort that
comprised 107 tumor samples from 74 patients, thereby providing a
more powerful analysis. In contrast to a previous study, in which
this dataset was analyzed by comparing gene expression profiles
between different individuals (that is, tumor samples from smokers
versus non-smokers) (12), the
approach adopted in the current study aimed to address questions
regarding the smoking-dependent and -independent molecular
mechanisms involved in lung carcinogenesis by systemically
comparing tumors and adjacent normal tissues within the same
individuals, which is likely to produce a better signal-to-noise
readout. In addition, although the dataset has previously been
analyzed almost exclusively at the gene level (12), the present approach was designed to
uncover smoking-induced gene expression patterns and also, more
importantly, reveal significantly altered gene sets and biological
pathways. Specifically, GC-RMA was utilized, followed by the
construction of gene networks to allow the identification of
potential targets that may be translatable to therapeutic benefits
in the clinical setting. This may explain why novel targets and
altered pathways were identified in the current study that were
largely distinct from those of the previous study (12).
In the present study, among the genes queried on the
platform of the Affymetrix Human Genome U133A microarray, a total
of 422 and 534 DEGs were identified in NS and CS patients,
respectively, for which significant alteration between tumor
biopsies and normal tissues was identified. Notably, the NS and CS
groups shared 277 common DEGs, indicating similar pathogenic
mechanisms that contribute to lung carcinogenesis independently of
smoking status. To confirm the differential expression of DEGs,
RT-qPCR was conducted using samples from tumor biopsies and
matching healthy controls that were independently collected from
lung cancer patients with or without smoking history. The results
were highly consistent with the DEG analysis, supporting the
utility and validity of this analytical approach. The results also
revealed that multiple biological processes and pathways, including
single-multicellular organism process, cell migration, cell
proliferation and ECM-receptor interaction, were significantly
affected in lung tumor tissues from the NS and CS patients.
However, smoking specifically induced altered expression of 257
DEGs that were not identified in the NS patients, suggesting unique
downstream molecular and genetic networks that are associated with
smoking. Consistently, cell cycle and p53 signaling pathways were
significantly altered in lung tumor samples from CS and not NS
patients.
One of the most noteworthy DEGs identified in NS and
CS patients is caveolin-1 (CAV1), which encodes a
scaffolding component of the caveolae plasma membranes. Multiple
independent studies have indicated that CAV1 has a
tumor-suppressor role in lung cancer and other types of malignancy
(22,23,31–33), which
is consistent with the current findings, which revealed that the
expression of CAV1 was significantly attenuated in lung
cancer patients compared with healthy individuals. With regard to
the mechanism, studies have demonstrated that CAV1
suppresses vascular cell adhesion protein 1-mediated adhesion
between human lung cancer cells and endothelial cells by
attenuating the production of hydrogen peroxide and hydroxyl
radicals (32). In addition,
CAV1 interacts with the StAR-related lipid transfer domain
of deleted in liver cancer 1, another tumor suppressor that is
frequently mutated in non-small cell lung cancer patients, and
forms a complex to inhibit cancer cell migration and neoplastic
development (31). However, despite
these studies revealing a tumor-reducing role for CAV1,
other investigations have revealed that CAV1 also possesses
a contradictory tumor-promoting function (34–36). In
particular, Pancotti et al demonstrated that siRNA-induced
CAV1-knockdown resulted in cell cycle arrest in vitro
in cell lines derived from metastatic lesions of lung
adenocarcinoma and small cell lung carcinoma, and that this was
associated with the reduced expression of cyclin D1 and
CDK4 and the attenuated phosphorylation of Akt (34). Taken together, these studies indicate
a multifaceted tumor-regulatory role for CAV1 that is likely
to be context-dependent; future investigations are required prior
to CAV1 being targeted for therapeutic purposes to treat
lung cancer and other malignancies.
The present analysis also identified a unique
pattern of gene expression exclusively in lung cancer patients with
smoking history, including CDK1, CCNB1, STAT1,
AURKA and CDC20. Notably, all of these upregulated
DEGs encode essential regulators that dictate cell cycle control
and progression, indicating that smoking induces cell
hyperproliferation that contributes to the pathogenesis of lung
adenocarcinoma. Indeed, numerous previous studies have established
a strong association between cigarette smoking and cell
proliferation in various types of malignancies, including lung
cancer (37–42). The mitogenic effect is largely
mediated by nicotine and its derivatives (the major components of
cigarettes) through multiple distinct molecular mechanisms
(39). For example, it has been
demonstrated that smoking induces production of oxygen radicals
that cause generation of cleaved transmembrane amphiregulin, which
is subsequently detected by EGFR, thereby resulting in aberrant
proliferation of lung epithelial cells (37). In addition, by engaging nicotinic
acetylcholine receptors (nAChRs), nicotine exerts a pleiotropic
cellular function that includes secretion of growth factors (such
as VEGF and platelet-derived growth factor) (43) and initiation of mitogen-activated
protein kinase signaling cascades (44). In particular, in non-small cell lung
cancers, activation of nAChRs induces recruitment of β-arrestin to
the receptor, which further activates Src and enhances binding of
the transcription activators E2F1 and Raf-1 to proliferative
promoters (41). Consequently,
exposure to nicotine in cigarettes induces abnormal mitogenesis
through these various mechanisms that contribute synergistically to
the initiation and development of lung adenocarcinoma.
Additional classes of carcinogens from tobacco
smoking have also been demonstrated to affect lung tumorigenesis,
including polycyclic aromatic hydrocarbons, tobacco-specific
nitrosamines and aldehydes. Their potent carcinogenic capability is
primarily mediated by imposing genotoxic stress and damage in host
cells. For example, formation of DNA adducts is frequently induced,
which results in loss-of-function mutation in tumor suppressor
genes, such as p53 (39,45–48).
p53 is a well-established master regulator for the DNA
repair response, cell cycle checkpoint and apoptosis, and numerous
studies have implicated a long-standing association between the
high incidence of its perturbed expression or function and the
development of various types of cancer (49,50).
Indeed, the mutational frequency of p53 is considerably
higher in smokers (~55%) compared with non-smokers (~25%) in lung
cancer patients, predominantly involving G-to-T transitions
(46,47). Consistently, the present study
identified the p53 signaling pathway as significantly affected only
in CS patients, further supporting a contributing role for smoking
in the molecular initiation and progression of lung cancers.
In summary, the present study systemically
investigated the molecular alterations that are associated with the
pathogenesis of lung adenocarcinoma patients with or without
smoking history. Numerous common gene signatures and biological
pathways were identified as smoking-independent mechanisms,
including the CAV1 gene and pathways that are related to
cell migration and proliferation. By contrast, cigarette smoking
induces a characteristic gene expression profile involved in cell
cycle control and p53 response cascades. Overall, this analysis
provided additional molecular knowledge that furthers our
understanding of lung tumorigenesis, which may provide potential
targets for the therapeutic design of efficacious treatment for
lung cancers and other malignancies.
References
|
1
|
Ferlay J, Shin HR, Bray F, Forman D,
Mathers C and Parkin DM: Estimates of worldwide burden of cancer in
2008: GLOBOCAN 2008. Int J Cancer. 127:2893–2917. 2010. View Article : Google Scholar : PubMed/NCBI
|
|
2
|
Surveillance, Epidemiology, and End
Results Program, . SEER Stat Fact Sheets. Lung and Bronchus Cancer.
National Cancer Institute at the National Institutes of Health.
http://seer.cancer.gov/statfacts/html/lungb.htmlAccessed.
March 24–2015.
|
|
3
|
Peto R, Darby S, Deo H, Silcocks P,
Whitley E and Doll R: Smoking, smoking cessation, and lung cancer
in the UK since 1950: Combination of national statistics with two
case-control studies. BMJ. 321:323–329. 2000. View Article : Google Scholar : PubMed/NCBI
|
|
4
|
Amos CI, Wu X, Broderick P, Gorlov IP, Gu
J, Eisen T, Dong Q, Zhang Q, Gu X, Vijayakrishnan J, et al:
Genome-wide association scan of tag SNPs identifies a
susceptibility locus for lung cancer at 15q25.1. Nat Genet.
40:616–622. 2008. View
Article : Google Scholar : PubMed/NCBI
|
|
5
|
Cornfield J, Haenszel W, Hammond EC, et
al: Smoking and lung cancer: Recent evidence and a discussion of
some questions. 1959. Int J Epidemiol. 38:1175–1191. 2009.
View Article : Google Scholar
|
|
6
|
Shigematsu H, Takahashi T, Nomura M,
Majmudar K, Suzuki M, Lee H, Wistuba II, Fong KM, Toyooka S,
Shimizu N, et al: Somatic mutations of the HER2 kinase domain in
lung adenocarcinomas. Cancer Res. 65:1642–1646. 2005. View Article : Google Scholar : PubMed/NCBI
|
|
7
|
Hecht SS: Tobacco smoke carcinogens and
lung cancer. J Natl Cancer Inst. 91:1194–1210. 1999. View Article : Google Scholar : PubMed/NCBI
|
|
8
|
Imielinski M, Berger AH, Hammerman PS,
Hernandez B, Pugh TJ, Hodis E, Cho J, Suh J, Capelletti M,
Sivachenko A, et al: Mapping the hallmarks of lung adenocarcinoma
with massively parallel sequencing. Cell. 150:1107–1120. 2012.
View Article : Google Scholar : PubMed/NCBI
|
|
9
|
Govindan R, Ding L, Griffith M, et al:
Genomic landscape of non-small cell lung cancer in smokers and
never-smokers. Cell. 150:1121–1134. 2012. View Article : Google Scholar : PubMed/NCBI
|
|
10
|
Le Calvez F, Mukeria A, Hunt JD, Kelm O,
Hung RJ, Tanière P, Brennan P, Boffetta P, Zaridze DG and Hainaut
P: TP53 and KRAS mutation load and types in lung cancers in
relation to tobacco smoke: distinct patterns in never, former, and
current smokers. Cancer Res. 65:5076–5083. 2005. View Article : Google Scholar : PubMed/NCBI
|
|
11
|
Pao W, Miller V, Zakowski M, Doherty J,
Politi K, Sarkaria I, Singh B, Heelan R, Rusch V, Fulton L, et al:
EGF receptor gene mutations are common in lung cancers from ‘never
smokers’ and are associated with sensitivity of tumors to gefitinib
and erlotinib. Proc Natl Acad Sci USA. 101:13306–13311. 2004.
View Article : Google Scholar : PubMed/NCBI
|
|
12
|
Landi MT, Dracheva T, Rotunno M, et al:
Gene expression signature of cigarette smoking and its role in lung
adenocarcinoma development and survival. PLoS One. 3:e16512008.
View Article : Google Scholar : PubMed/NCBI
|
|
13
|
Wu J, Irizarry R, MacDonald J and Gentry
J: RIwcf JMJ. gcrma. Background Adjustment Using Sequence
Information. R package version 2.38.0.
|
|
14
|
Ritchie ME, Phipson B, Wu D, Hu Y, Law CW,
Shi W and Smyth GK: limma powers differential expression analyses
for RNA-sequencing and microarray studies. Nucleic Acids Res.
January 20–2015.(Epub ahead of print). doi: 10.1093/nar/gkv007.
View Article : Google Scholar
|
|
15
|
Shannon P, Markiel A, Ozier O, Baliga NS,
Wang JT, Ramage D, Amin N, Schwikowski B and Ideker T: Cytoscape: A
software environment for integrated models of biomolecular
interaction networks. Genome Res. 13:2498–2504. 2013. View Article : Google Scholar
|
|
16
|
Livak KJ and Schmittgen TD: Analysis of
relative gene expression data using real-time quantitative PCR and
the 2 (-Delta Delta C (T)) Method. Methods. 25:402–408. 2001.
View Article : Google Scholar : PubMed/NCBI
|
|
17
|
Warnes GR, Bolker B, Bonebakker L,
Gentleman R, Liaw WHA, Lumley T, Maechler M, Magnusson A, Moeller
S, Schwartz M and Venables B: gplots: Various R Programming Tools
for Plotting Data. R package version 2.16.0.
|
|
18
|
Carlson M: GO.db: A set of annotation maps
describing the entire Gene Ontology. R package version 3.0.0.
|
|
19
|
Carlson M: KEGG.db: A set of annotation
maps for KEGG. R package version 3.0.0.
|
|
20
|
Tenenbaum D: KEGGREST: Client-side REST
access to KEGG. R package version 1.6.4.
|
|
21
|
Mo YQ, Dai L, Zheng DH, Zhu LJ, Wei XN,
Pessler F, Shen J and Zhang BY: Synovial infiltration with
CD79a-positive B cells, but not other B cell lineage markers,
correlates with joint destruction in rheumatoid arthritis. J
Rheumatol. 38:2301–2308. 2011. View Article : Google Scholar : PubMed/NCBI
|
|
22
|
Han F, Gu D, Chen Q and Zhu H: Caveolin-1
acts as a tumor suppressor by down-regulating epidermal growth
factor receptor-mitogen-activated protein kinase signaling pathway
in pancreatic carcinoma cell lines. Pancreas. 38:766–774. 2009.
View Article : Google Scholar : PubMed/NCBI
|
|
23
|
Lobos-González L, Aguilar L, Diaz J, et
al: E-cadherin determines Caveolin-1 tumor suppression or
metastasis enhancing function in melanoma cells. Pigment Cell
Melanoma Res. 26:555–570. 2013. View Article : Google Scholar : PubMed/NCBI
|
|
24
|
Ashburner M, Ball CA, Blake JA, Botstein
D, Butler H, Cherry JM, Davis AP, Dolinski K, Dwight SS, Eppig JT,
et al: The Gene Ontology Consortium: Gene ontology: Tool for the
unification of biology. Nat Genet. 25:25–29. 2000. View Article : Google Scholar : PubMed/NCBI
|
|
25
|
Kanehisa M and Goto S: KEGG: Kyoto
encyclopedia of genes and genomes. Nucleic Acids Res. 28:27–30.
2000. View Article : Google Scholar : PubMed/NCBI
|
|
26
|
Rudin CM, Avila-Tang E, Harris CC, Herman
JG, Hirsch FR, Pao W, Schwartz AG, Vahakangas KH and Samet JM: Lung
cancer in never smokers: molecular profiles and therapeutic
implications. Clin Cancer Res. 15:5646–5661. 2009. View Article : Google Scholar : PubMed/NCBI
|
|
27
|
Szymanowska-Narloch A, Jassem E, Skrzypski
M, Muley T, Meister M, Dienemann H, Taron M, Rosell R, Rzepko R,
Jarząb M, et al: Molecular profiles of non-small cell lung cancers
in cigarette smoking and never-smoking patients. Adv Med Sci.
58:196–206. 2013. View Article : Google Scholar : PubMed/NCBI
|
|
28
|
Woenckhaus M, Klein-Hitpass L, Grepmeier
U, Merk J, Pfeifer M, Wild P, Bettstetter M, Wuensch P, Blaszyk H,
Hartmann A, et al: Smoking and cancer-related gene expression in
bronchial epithelium and non-small-cell lung cancers. J Pathol.
210:192–204. 2006. View Article : Google Scholar : PubMed/NCBI
|
|
29
|
Spira A, Beane JE, Shah V, Steiling K, Liu
G, Schembri F, Gilman S, Dumas YM, Calner P, Sebastiani P, et al:
Airway epithelial gene expression in the diagnostic evaluation of
smokers with suspect lung cancer. Nat Med. 13:361–366. 2007.
View Article : Google Scholar : PubMed/NCBI
|
|
30
|
Staaf J, Jönsson G, Jönsson M, Karlsson A,
Isaksson S, Salomonsson A, Pettersson HM, Soller M, Ewers SB,
Johansson L, et al: Relation between smoking history and gene
expression profiles in lung adenocarcinomas. BMC Med Genomics.
5:222012. View Article : Google Scholar : PubMed/NCBI
|
|
31
|
Du X, Qian X, Papageorge A, Schetter AJ,
Vass WC, Liu X, Braverman R, Robles AI and Lowy DR: Functional
interaction of tumor suppressor DLC1 and caveolin-1 in cancer
cells. Cancer Res. 72:4405–4416. 2012. View Article : Google Scholar : PubMed/NCBI
|
|
32
|
Chanvorachote P and Chunhacha P:
Caveolin-1 regulates endothelial adhesion of lung cancer cells via
reactive oxygen species-dependent mechanism. PLoS One.
8:e574662013. View Article : Google Scholar : PubMed/NCBI
|
|
33
|
Wang Z, Sokolovska A, Seymour R, Sundberg
JP and Hogenesch H: SHARPIN is essential for cytokine production,
NF-κB signaling, and induction of Th1 differentiation by dendritic
cells. PLoS One. 7:e318092012. View Article : Google Scholar : PubMed/NCBI
|
|
34
|
Pancotti F, Roncuzzi L, Maggiolini M and
Gasperi-Campani A: Caveolin-1 silencing arrests the proliferation
of metastatic lung cancer cells through the inhibition of STAT3
signaling. Cell Signal. 24:1390–1397. 2012. View Article : Google Scholar : PubMed/NCBI
|
|
35
|
Luanpitpong S, Talbott SJ, Rojanasakul Y,
Nimmannit U, Pongrakhananon V, Wang L and Chanvorachote P:
Regulation of lung cancer cell migration and invasion by reactive
oxygen species and caveolin-1. J Biol Chem. 285:38832–38840. 2010.
View Article : Google Scholar : PubMed/NCBI
|
|
36
|
Wang Z, Potter CS, Sundberg JP and
Hogenesch H: SHARPIN is a key regulator of immune and inflammatory
responses. J Cell Mol Med. 16:2271–2279. 2012. View Article : Google Scholar : PubMed/NCBI
|
|
37
|
Lemjabbar H, Li D, Gallup M, Sidhu S,
Drori E and Basbaum C: Tobacco smoke-induced lung cell
proliferation mediated by tumor necrosis factor alpha-converting
enzyme and amphiregulin. J Biol Chem. 278:26202–26207. 2003.
View Article : Google Scholar : PubMed/NCBI
|
|
38
|
Luppi F, Aarbiou J, van Wetering S, et al:
Effects of cigarette smoke condensate on proliferation and wound
closure of bronchial epithelial cells in vitro: Role of
glutathione. Respir Res. 6:1402005. View Article : Google Scholar : PubMed/NCBI
|
|
39
|
Schaal C and Chellappan SP:
Nicotine-mediated cell proliferation and tumor progression in
smoking-related cancers. Mol Cancer Res. 12:14–23. 2014. View Article : Google Scholar : PubMed/NCBI
|
|
40
|
Liu C, Russell RM and Wang XD: Lycopene
supplementation prevents smoke-induced changes in p53, p53
phosphorylation, cell proliferation, and apoptosis in the gastric
mucosa of ferrets. J Nutr. 136:106–111. 2006.PubMed/NCBI
|
|
41
|
Dasgupta P, Rastogi S, Pillai S, et al:
Nicotine induces cell proliferation by beta-arrestin-mediated
activation of Src and Rb-Raf-1 pathways. J Clin Invest.
116:2208–2217. 2006. View Article : Google Scholar : PubMed/NCBI
|
|
42
|
Potter CS, Wang Z, Silva KA, et al:
Chronic proliferative dermatitis in Sharpin null mice: development
of an autoinflammatory disease in the absence of B and T
lymphocytes and IL4/IL13 signaling. PLoS One. 9:e856662014.
View Article : Google Scholar : PubMed/NCBI
|
|
43
|
Conklin BS, Zhao W, Zhong DS and Chen C:
Nicotine and cotinine up-regulate vascular endothelial growth
factor expression in endothelial cells. Am J Pathol. 160:413–418.
2002. View Article : Google Scholar : PubMed/NCBI
|
|
44
|
Jull BA, Plummer HK III and Schuller HM:
Nicotinic receptor-mediated activation by the tobacco-specific
nitrosamine NNK of a Raf-1/MAP kinase pathway, resulting in
phosphorylation of c-myc in human small cell lung carcinoma cells
and pulmonary neuroendocrine cells. J Cancer Res Clin Oncol.
127:707–717. 2001.PubMed/NCBI
|
|
45
|
Furrukh M: Tobacco Smoking and Lung
Cancer: Perception-changing facts. Sultan Qaboos Univ Med J.
13:345–358. 2013. View Article : Google Scholar : PubMed/NCBI
|
|
46
|
Pfeifer GP, Denissenko MF, Olivier M, et
al: Tobacco smoke carcinogens, DNA damage and p53 mutations in
smoking-associated cancers. Oncogene. 21:7435–7451. 2002.
View Article : Google Scholar : PubMed/NCBI
|
|
47
|
Husgafvel-Pursiainen K and Kannio A:
Cigarette smoking and p53 mutations in lung cancer and bladder
cancer. Environ Health Perspect. 104 (Suppl 3):553–556. 1996.
View Article : Google Scholar : PubMed/NCBI
|
|
48
|
Brennan JA, Boyle JO, Koch WM, Goodman SN,
Hruban RH, Eby YJ, Couch MJ, Forastiere AA and Sidransky D:
Association between cigarette smoking and mutation of the p53 gene
in squamous-cell carcinoma of the head and neck. N Engl J Med.
332:712–717. 1995. View Article : Google Scholar : PubMed/NCBI
|
|
49
|
Muller PA and Vousden KH: p53 mutations in
cancer. Nat Cell Biol. 15:2–8. 2013. View Article : Google Scholar : PubMed/NCBI
|
|
50
|
Muller PA and Vousden KH: Mutant p53 in
cancer: new functions and therapeutic opportunities. Cancer Cell.
25:304–317. 2014. View Article : Google Scholar : PubMed/NCBI
|