Introduction
Cancer, also known as malignant tumor, represents a
significant threat to human health. Tumorigenesis occurs as a
result of the activation of oncogenic pathways and/or inactivation
of tumor suppressor pathways (1).
Changes in the DNA sequence, including mutations, amplifications,
gene rearrangements or deletions, were hypothesized to underlie
tumorigenesis (2); however, aberrant
epigenetic modifications also have a important role in cancer
occurrence and progression. For example, DNA methylation, a type of
epigenetic modification, was found to exhibit a distorted pattern
in human cancer cells (3).
Hypomethylation of intergenic regions and hypermethylation within
the promoter regions of numerous CpG island-associated tumor
suppressor genes has been observed in cancer cells (4,5).
Hypomethylation of intergenic regions may result in the activation
of transposable elements and instability of the genome in cancer
cells (6), while hypermethylation of
promoter regions may result in the silencing of tumor suppressor
genes and uncontrolled cancer cell proliferation (7). Therefore, various types of DNA
methyltransferase inhibitors have been used in cancer therapies
(8). Fluorouracil (5-Fu) and
5-azacitidine (5-aza), two types of nucleoside analog, have been
used to treat several types of cancer (8,9). However,
the anticancer mechanisms underlying the effects of these two types
of drug are distinct. Firstly, 5-aza is a type of DNA
methyltransferase inhibitor, which is incorporated into DNA,
leading to inhibition of DNA methylation and restoration of the
expression of silenced tumor suppressor genes (10,11). By
contrast, 5-Fu is a type of antimetabolite drug, which inhibits
essential biosynthetic processes via incorporation into DNA and
RNA, consequently inhibiting the normal function of these
macromolecules in cancer cells (9).
Although these two types of drug have been widely applied to treat
various types of cancer, their effects on the proliferation and DNA
methylation of cancer cells have not previously been compared in a
single study.
In the present study, in vitro cultured human
gastric cancer cells (hGCCs) were studied, following treatment with
various concentrations of 5-Fu or 5-aza. The effects of these two
types of drug on the proliferation and DNA methylation of hGCCs, as
well as their underlying mechanisms, were investigated by cell
counting, MTT assay and methyl-sensitive amplified polymorphism
(MSAP).
Materials and methods
Reagents
Unless otherwise indicated, all chemicals were
purchased from Sigma-Aldrich (St. Louis, MO, USA).
Cell cultured in vitro
The MGC-803 hGCC line (obtained from Inner Mongolia
Medical University, Hohhot, China) was cultured in RPMI-1640
complete medium [RPMI-1640 medium (Gibco Life Technologies,
Carlsbad, CA, USA) supplemented with 10% (v/v) fetal bovine serum
(Gibco Life Technologies), 100 IU/ml penicillin and 100 µg/ml
streptomycin], at 37°C in a humidified atmosphere of 5%
CO2. When hGCCs entered the exponential phase, they were
removed with digestion medium [D-Hanks medium supplemented with
0.25% (m/v) trypsin and 0.05% (m/v) EDTA], washed 2–3 times in
RPMI-1640 complete medium, transplanted into 96-well tissue culture
plates at a density of 2×10⁵ live cells/ml and cultured
in RPMI-1640 complete medium supplemented with various
concentrations of 5-Fu (10, 20, 30 and 40 g/l) or 5-aza (5, 10, 15
and 20 µmol/l). hGCCs were cultured in the conditions described
above, and used for subsequent experiments. The culture medium was
refreshed every 24 h.
Cell counting
Following 24 h of treatment with 5-Fu or 5-aza, the
proliferation of hGCCs was evaluated by cell counting. Briefly,
hGCCs were removed by digestion medium, dyed with 0.4% (m/v) trypan
blue medium (trypan blue was supplemented into RPMI-1640 complete
medium) for 3 min and mounted on an inverted microscope (Eclipse
Ti-U; Nikon Corporation, Tokyo, Japan) for living cell counting.
Cell counting was performed every 24 h from day 1 (following 24 h
of drug treatment) to day 7. Each treatment, as well as the
controls (cultured in RPMI-1640 complete medium alone), was
repeated 3 times.
MTT assay
On days 3 and 6, the proliferation inhibition of
hGCCs was evaluated by MTT assay. Briefly, MTT solution [MTT
dissolved in phosphate-buffered saline (PBS)] was added into each
well at a final concentration of 200 mg/l. Subsequently, plates
were incubated in identical conditions to those described above for
3 h. Following removal of the supernatant, 150 µl dimethyl
sulfoxide was added to each well, plates were slightly oscillated
for 10 min and the absorbance (A) of each well at 490 nm was
recorded using a Microplate Reader (Synergy HT; BioTek Instruments,
Inc., Winooski, VT, USA). Each treatment, as well as the control,
was repeated 4 times.
Extraction of genomic DNA from
hGCCs
On day 3, hGCCs were removed by digestion medium and
washed 2–3 times in PBS medium prior to genomic DNA extraction
using a cell genome DNA extraction kit (TianGen Biochemistry
Technology Co., Ltd, Beijing, China) according to the
manufacturer's instructions, and stored at −20°C for subsequent
experiments.
MSAP assay
Genomic DNA was digested with EcoRI/MspI [Promega
(Beijing) Biotech Co., Ltd, Beijing, China] or EcoRI/HapII [Promega
(Beijing) Biotech Co., Ltd], respectively. The digestion mixture
consisted of 20 µl genomic DNA, 2 µl EcoRI, 2 µl MspI (or HapII), 5
µl 10X buffer and 21 µl double distilled (dd)H2O, in a
total volume of 50 µl. Digestion was performed at 37°C for 6 h.
Two adaptors were designed as described previously
(12). These were
HapII/MspI (H–M) adaptor: H–M(I),
5′-GACGATGTCTAGAA-3′ and H–M(II), 5′-CGTTCTAGACTCATC-3′; and
EcoRI (E) adaptor: E(I), 5′-CTCGTAGACTGCGTACC-3′ and E(II),
5′-AATTGGTACGCAGTCTAC-3′. The connection mixture consisted of 12.5
µl digestion product, 5 µl (10 pmol) H–M adaptor, 5 µl (10 pmol) E
adaptor, 3 µl T4 DNA ligase, 5 µl 10X connection buffer and 19.5 µl
ddH2O in a total volume of 50 µl. Connections were
performed at 16°C overnight, prior to inactivation of T4 DNA ligase
(Takara Biotechnology Co., Ltd., Dalian, China), at 65°C for 8 min.
Subsequently, the connection product was stored at −20°C for
subsequent experiments.
A pair of primers was designed for the
pre-polymerase chain reaction (PCR), as described previously
(12), which were as follows:
Forward, 5′-GATGAGTCTAGAACGGT-3′ and reverse,
5′-GACTGCGTACCAATTCA-3′. The pre-PCR reaction mixture consisted of
0.5 µl connection product, 1 µl forward primer (30 ng/µl), 1 µl
reverse primer (30 ng/µl), 1.6 µl dNTPs (2.5 mM each; Takara
Biotechnology Co., Ltd.), 1.2 µl MgCl2 (25 mM), 1 µl
rTaq (5 U/µl; Takara Biotechnology Co., Ltd.), 2 µl 10X
rTaq buffer and 11.7 µl ddH2O, in a total volume
of 20 µl. Pre-PCR was performed as follows: Holding at 94°C for 5
min, then 30 cycles of denaturation at 94°C for 30 sec, annealing
at 56°C for 1 min and extension at 72°C for 1 min, followed by a
final extension at 72°C for 7 min. The PCR products were loaded
onto 0.8% agarose gel for electrophoresis and stained with ethidium
bromide.
The primers used for selective amplification were as
follows: Forward, 5′-GATGAGTCTAGAACGGTNN-3′ and reverse,
5′-GACTGCGTACCAATTCANN-3′, where N was any one of the A, T, C or G
nucleotides. In the present study, 5 forward primers
(5′-GATGAGTCTAGAACGGTGC-3′, 5′-GATGAGTCTAGAACGGTAT-3′,
5′-GATGAGTCTAGAACGGTCA-3′, 5′-GATGAGTCTAGAACGGTTC-3′ and
5′-GATGAGTCTAGAACGGTAG-3) and 5 reverse primers
(5′-GACTGCGTACCAATTCACT-3′, 5′-GACTGCGTACCAATTCAAG-3′,
5′-GACTGCGTACCAATTCATA-3′, 5′-GACTGCGTACCAATTCAGT-3′ and
5′-GACTGCGTACCAATTCAAC-3′) were randomly matched, so that a total
of 25 pairs were used. The selective amplification reaction mixture
consisted of 0.2 µl pre-PCR products, 1 µl forward primer (30
ng/µl), 1 µl reverse primer (30 ng/µl), 1.6 µl dNTPs (2.5 mM each),
1.2 µl MgCl2 (25 mM), 0.5 µl rTaq (5 U/µl), 2 µl
10X rTaq buffer and 12.5 µl ddH2O in a total
volume of 20 µl. Selective amplification was performed under the
following conditions: Holding at 94°C for 5 min, then 13 cycles of
denaturation at 94°C for 30 sec, annealing at 65°C (each cycle
decreased by 0.7°C) for 30 sec and extension at 72°C for 1 min,
followed by 23 cycles of denaturation at 94°C for 30 sec, annealing
at 56°C for 30 sec and extension at 72°C for 1 min, and further
extension at 72°C for 7 min. The PCR products were loaded onto 10%
polyacrylamide gel for electrophoresis and stained with silver
nitrate, then developed with 1.5% (w/v) sodium hydroxide and 0.4%
(v/v) formaldehyde.
Statistical analysis
Differences in the proliferation and proliferation
inhibition of hGCCs were statistically compared by one-way and
two-way analysis of variance, respectively. Differences in the
levels of DNA methylation were statistically compared by
χ2 analysis. SPSS software version 19.0 (IBM SPSS,
Armonk, NY, USA) was used for statistical analyses, and P<0.05
was considered to indicate a statistically significant
difference.
Results
hGCC proliferation is downregulated
following treatment with 5-Fu or 5-aza
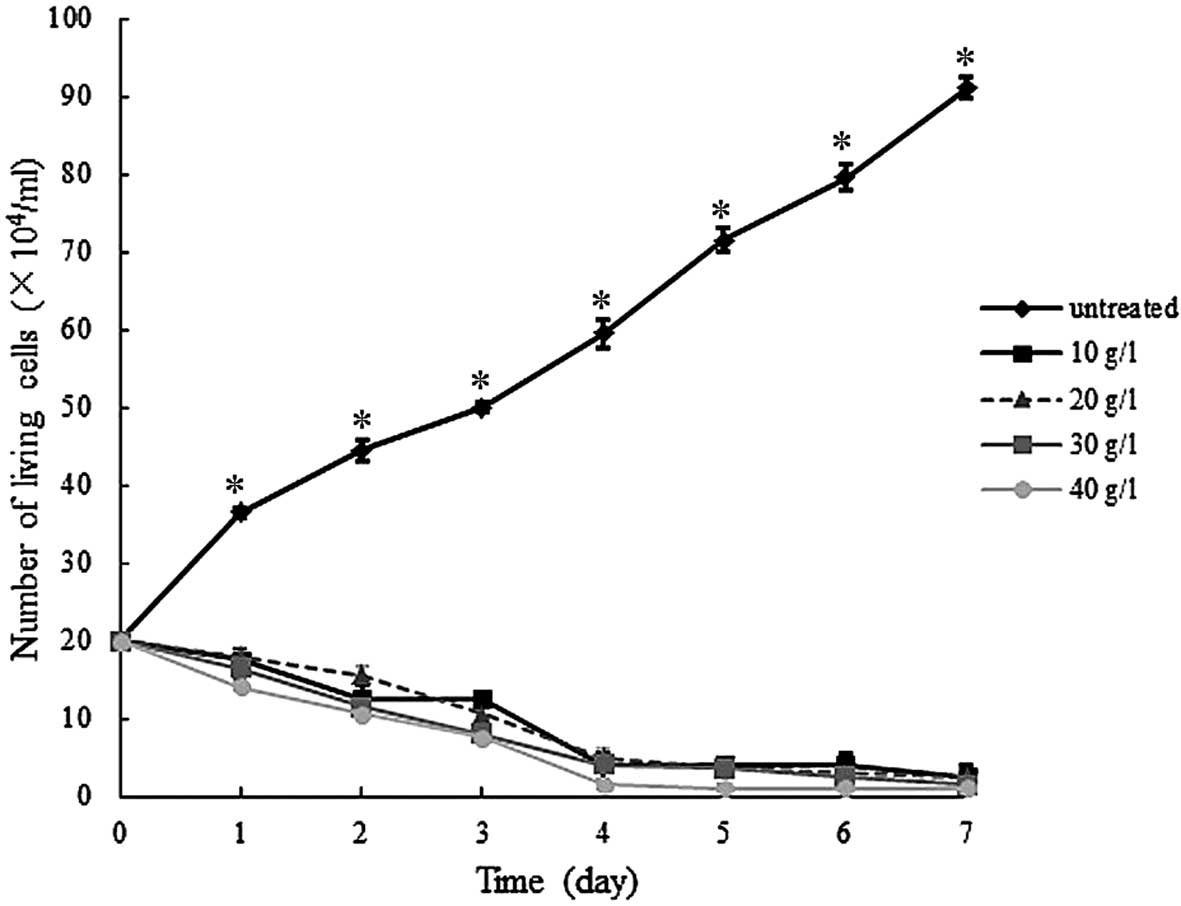
Following treatment with various concentrations of
5-Fu or 5-aza, the proliferation of hGCCs was evaluated by living
cell counting, and the results are presented in Figs. 1 and 2.
As indicated in Fig.
1, following treatment with various concentrations of 5-Fu, the
hGCCs began to die from day 1 to 7, whereas untreated hGCCs were
able to proliferate continuously during this period. The difference
in the number of living cells between the untreated and
5-Fu-treated groups was significant (P<0.05) from day 1 to 7;
however, this difference was not significant (P>0.05) among the
5-Fu-treated groups.
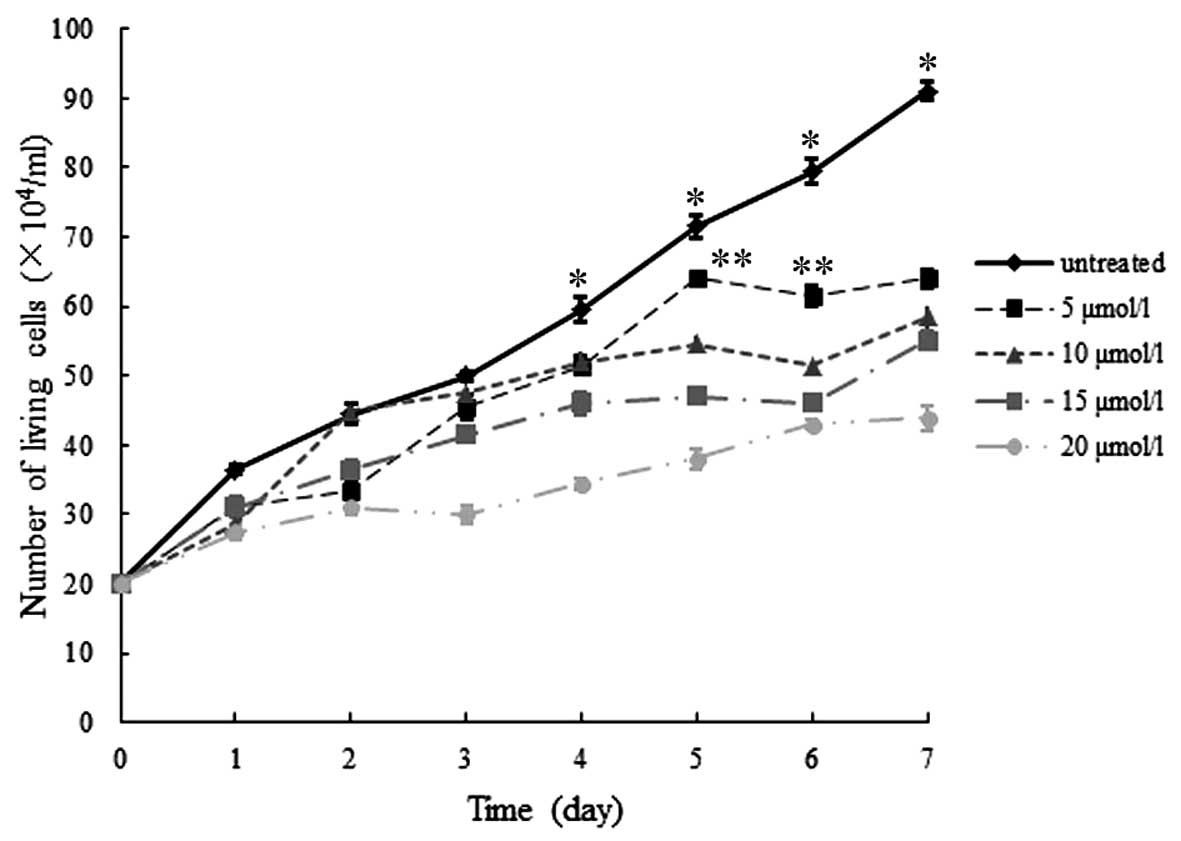
In addition, following treatment with various
concentrations of 5-aza, hGCCs remained able to proliferate;
however, compared with that of the untreated group, the
proliferation rate of the 5-aza-treated groups was markedly slower,
and the difference in the number of living cells between the
untreated and 5-aza-treated groups was significant on days 4–7
(P<0.05). Furthermore, significant differences among each
5-aza-treated group appeared on day 5 and lasted to day 7
(P<0.05). However, on day 7, the difference between the 10 and
15 µmol/l group was not significant (P>0.05; Fig. 2).
Proliferation of hGCCs is inhibited
following treatment with 5-Fu or 5-aza
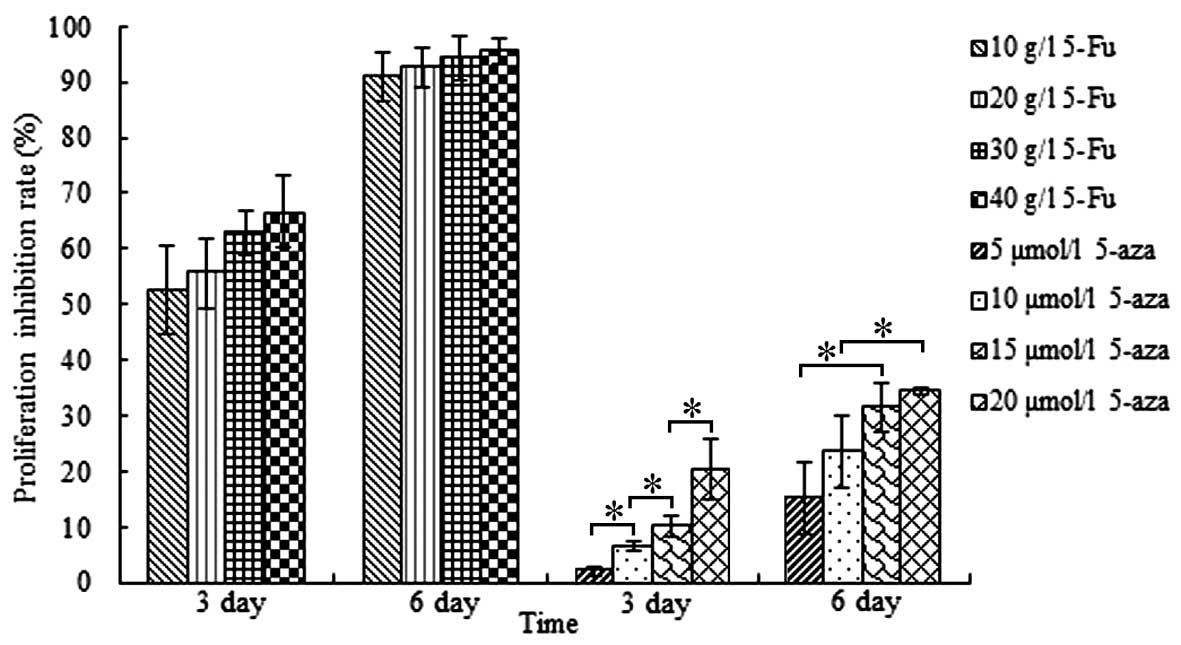
Following 3 and 6 days of treatment with various
concentrations of 5-Fu or 5-aza, the inhibition of hGCC
proliferation was measured by MTT assay and calculated using the
following formula: Cell proliferation inhibition rate
(%)=[1-A490(experimental group)/A490(control
group)]x100, as described previously (11).
As shown in Fig. 3,
5-Fu effectively inhibited the proliferation of hGCCs, and the
inhibition rate was time-dependent, but not concentration-dependent
from 10 to 40 g/l, as no significant differences in inhibition rate
were observed among the various treatment groups. The proliferation
of hGCCs was also inhibited by 5-aza treatment, and the inhibition
rate was time- and concentration-dependent. However, compared with
5-Fu, the inhibitory effect of 5-aza on the proliferation of hGCCs
was weaker. These results were in accordance with the results of
the living cell counting assay.
Treatment with 5-aza decreases DNA
methylation levels in hGCCs
Following 3 days of treatment with various
concentrations of 5-Fu or 5-aza, the levels of DNA methylation were
measured by MSAP assay.
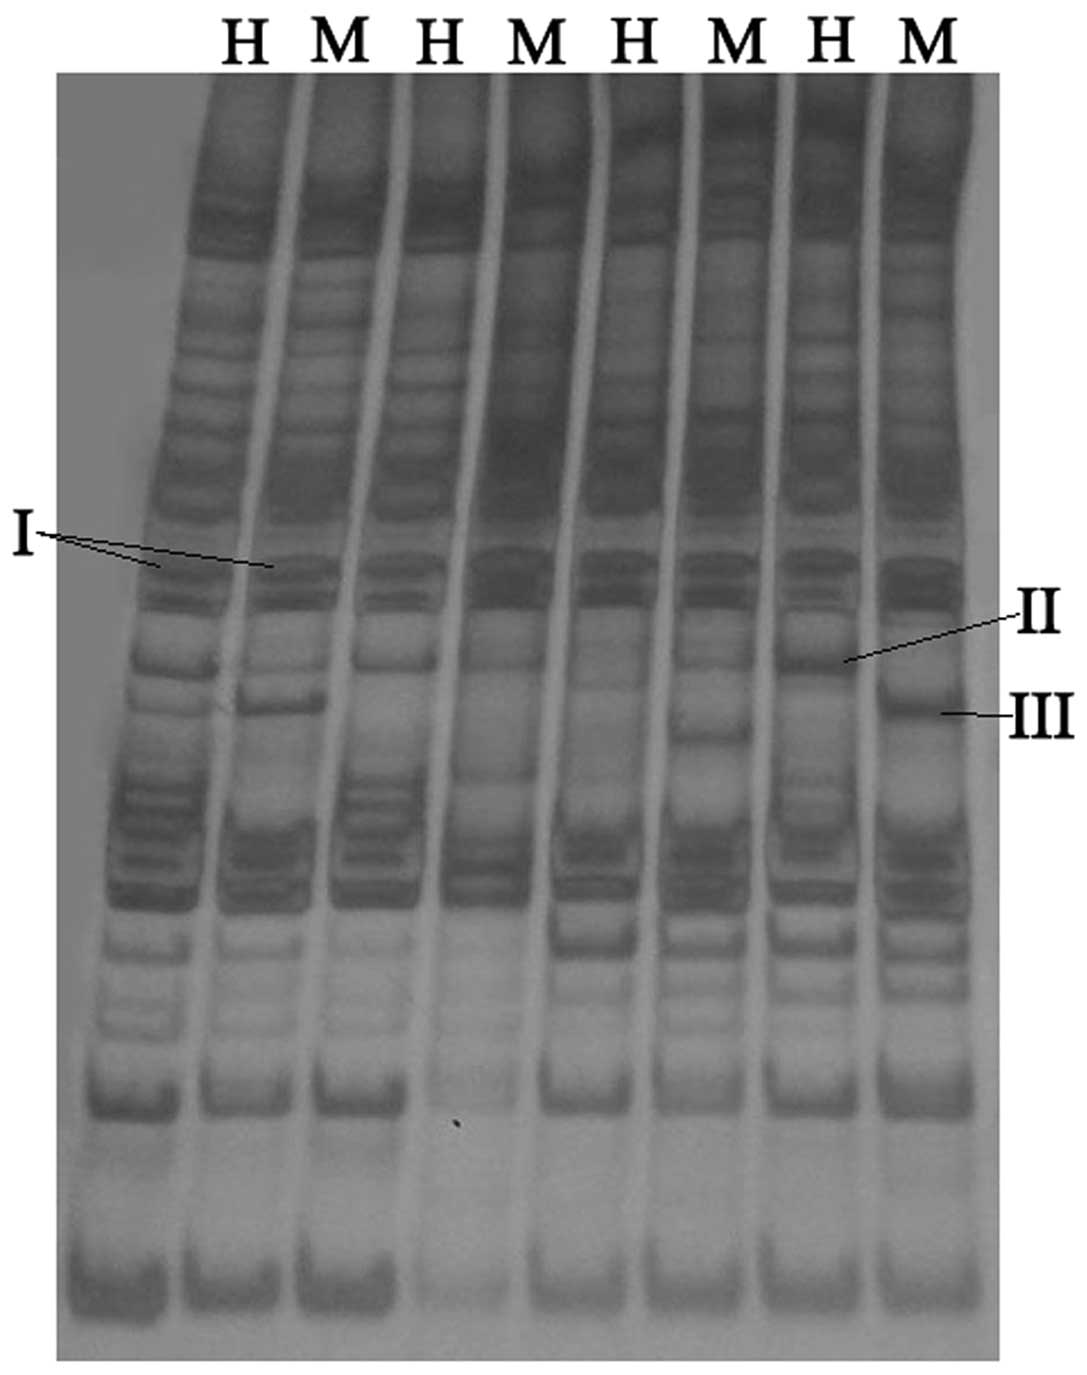
As shown in Fig. 4,
the products of selective amplification were run on polyacrylamide
gel, and each sample of hGCCs genomic DNA displayed an H lane and
an M lane, which corresponded to the products of
EcoRI/HapII and EcoRI/MspI digestion,
respectively. The number of bands in the pairs of lanes indicated
the quantity of products of genomic DNA samples amplified by each
pair of primers. The bands could be divided into three types. If
the band was detected in the H and M lane, this band represented a
non-methylated site (I; Fig. 4); if
the band presented only in the H lane, this band represented a
hemimethylated site (II; Fig. 4); and
if the band presented only in the M lane this band represented a
methylated site (III; Fig. 4). The
number of bands amplified by all the pairs of primers was counted,
and the levels of methylation, hemimethylation and total
methylation were calculated according to the following
formulae:
Level of hemimethylation = (number of hemimethylated
bands)/(total number of bands)
Level of methylation = (number of methylated
bands)/(total number of bands).
As indicated in Table
I, following 3 days of treatment with various concentrations of
5-Fu, the levels of methylation and hemimethylation in hGCC genomic
DNA were not significantly altered (P>0.05). This result
indicated that 5-Fu was unable to markedly alter the level of DNA
methylation in the hGCC genome. However, following 3 days of
treatment with various concentrations of 5-aza, the levels of DNA
methylation and hemimethylation in the hGCC genome were
significantly decreased (P<0.05), compared with those of the
untreated group, and the differences were not significant amongst
each of the 5-aza treatment groups (P>0.05).
 | Table I.Levels of DNA methylation of human
gastric cancer cells following treatment with various
concentrations of fluorouracil or 5-azacitidine. |
Table I.
Levels of DNA methylation of human
gastric cancer cells following treatment with various
concentrations of fluorouracil or 5-azacitidine.
| A, DNA methylation
following fluorouracil treatment |
|
|
|
|---|
|
|---|
| Concentration,
g/l | No. methylated sites,
n (methylation level, %) | No. hemimethylated
sites, n (hemimethylation level, %) | No. non-methylated
sites |
|---|
| Control | 92 (22.2) | 30 (7.2) | 292 |
| 10 | 96 (21.6) | 42 (9.4) | 306 |
| 20 | 87 (20.9) | 38 (9.1) | 292 |
| 30 | 77 (20.6) | 36 (9.7) | 260 |
| 40 | 70 (19.9) | 40
(11.4) | 241 |
|
| B, DNA methylation
following 5-azacitidine treatment |
|
| Concentration,
µmol/l | No. methylated sites,
n (methylation level, %) | No. hemimethylated
sites, n (hemimethylation level, %) | No. non-methylated
sites |
|
| Control | 92 (22.2) | 30 (7.2) | 292 |
| 5 | 91
(18.1)a | 16 (3.2)a | 396 |
| 10 | 85
(17.7)a | 12 (2.5)a | 384 |
| 15 | 77
(17.1)a | 10 (2.2)a | 362 |
| 20 | 60
(15.3)a | 6
(1.5)a | 325 |
Discussion
In the present study, the effects of two nucleoside
antitumor drugs, 5-Fu and 5-aza, on the proliferation of hGCCs were
investigated. The results of living cell counting and MTT assay
revealed that 5-Fu more efficiently inhibited the proliferation of
hGCCs than 5-aza. This may be due to differences in the anticancer
mechanism of these two types of drug. 5-Fu is an antimetabolite
drug, which may be intracellularly converted into several active
metabolites. These metabolites are able to form a stable ternary
complex with thymidylate synthase and
5,10-methylenetetrahydrofolate, or misincorporate into DNA and RNA,
disrupting DNA synthesis and repair or RNA processing and function
(9). Therefore, 5-Fu exerts lethal
effects on cancer cells only in a single cell cycle. By contrast,
5-aza is a type of DNA methyltransferase inhibitor, which is able
to induce degradation of DNA methyltransferase 1 (DNMT1), resulting
in DNA demethylation and the re-expression of certain silenced
tumor suppressor genes, as well as inhibiting the proliferation of
cancer cells (11,13). Therefore, 5-aza is able to inhibit the
uncontrolled proliferation of cancer cells through multiple cell
cycles, which explains why the inhibitory effect of 5-aza on the
proliferation of hGCCs was weaker than that of 5-Fu in the present
study.
Previous studies have indicated that following
treatment of cancer cells with 5-aza, certain tumor suppressor
genes, including p16, DAPK, MGMT, FHIT,
CDKN2B, ESR1 and IGSF4, exhibited DNA
demethylation and were subsequently re-expressed (11,13);
however, changes in the levels of DNA methylation at the genome
scale were not examined in these studies. In the present study, an
MSAP assay was performed to examine the levels of DNA methylation
in the hGCC genome. The results revealed that 5-aza was able to
significantly decrease the levels of DNA methylation and
hemimethylation in the hGCC genome, whereas 5-Fu was not. This
result was consistent with the differences in the anticancer
mechanism of these two types of drugs, and indicated that 5-aza was
able to decrease the activity of DNMT1, a type of maintenance
methyltransferase, which methylates hemimethylated DNA strands
following S phase. MSAP technology may be used to test the
genome-wide levels of DNA methylation, particularly when sequence
information for the genome is unavailable. This technology is
reliable, inexpensive and relatively simple, therefore MSAP has
been widely used to analyze DNA methylation changes in plants and
animals (14–16). Recently, MSAP technology was used to
successfully examine the level of DNA methylation of sheep cloned
embryos at various development stages (12).
In conclusion, the two types of nucleoside antitumor
drug, 5-Fu and 5-aza, inhibited the proliferation of hGCCs;
however, 5-Fu was more efficient than 5-aza. In addition, 5-aza was
able to decrease the levels of DNA methylation in the hGCC genome,
whereas 5-Fu was not. These results reflect the distinct effects
and mechanisms of these two types of drug on the proliferation of
hGCCs. Although epigenetic therapy was previously highly
recommended to treat cancer, the results of the present study
indicate that the slow effect of this type of treatment should be
taken into consideration. Instead, it is proposed that a
combination of metabolic and epigenetic treatment may be a more
favorable therapeutic strategy.
Acknowledgements
The present study was supported by the National
Natural Science Foundation of China (no. 31160245), the Program for
Young Talents of Science and Technology in Universities of Inner
Mongolia Autonomous Region, the Natural Science Foundation of Inner
Mongolia Autonomous Region of China (no. 2012MS0503) and the
Innovation Foundation of Inner Mongolia University of Science &
Technology (no. 2011NCL007).
References
|
1
|
Taby R and Issa JP: Cancer epigenetics. CA
Cancer J Clin. 60:376–392. 2010. View Article : Google Scholar : PubMed/NCBI
|
|
2
|
Vogelstein B and Kinzler KW: Cancer genes
and the pathways they control. Nat Med. 10:789–799. 2004.
View Article : Google Scholar : PubMed/NCBI
|
|
3
|
McCabe MT, Brandes JC and Vertino PM:
Cancer DNA methylation: Molecular mechanisms and clinical
implications. Clin Cancer Res. 15:3927–3937. 2009. View Article : Google Scholar : PubMed/NCBI
|
|
4
|
Antelo M, Balaguer F, Shia J, Shen Y, Hur
K, Moreira L, Cuatrecasas M, Bujanda L, Giraldez MD, Takahashi M,
et al: A high degree of LINE-1 hypomethylation is a unique feature
of early-onset colorectal cancer. PLoS One. 7:e453572012.
View Article : Google Scholar : PubMed/NCBI
|
|
5
|
Rauch TA, Zhong X, Wu X, Wang M, Kernstine
KH, Wang Z, Riggs AD and Pfeifer GP: High-resolution mapping of DNA
hypermethylation and hypomethylation in lung cancer. Proc Natl Acad
Sci USA. 105:252–257. 2008. View Article : Google Scholar : PubMed/NCBI
|
|
6
|
Howard G, Eiges R, Gaudet F, Jaenisch R
and Eden A: Activation and transposition of endogenous retroviral
elements in hypomethylation induced tumors in mice. Oncogene.
27:404–408. 2008. View Article : Google Scholar : PubMed/NCBI
|
|
7
|
Osborne C, Wilson P and Tripathy D:
Oncogenes and tumor suppressor genes in breast cancer: Potential
diagnostic and therapeutic applications. Oncologist. 9:361–377.
2004. View Article : Google Scholar : PubMed/NCBI
|
|
8
|
Stresemann C, Brueckner B, Musch T,
Stopper H and Lyko F: Functional diversity of DNA methyltransferase
inhibitors in human cancer cell lines. Cancer Res. 66:2794–2800.
2006. View Article : Google Scholar : PubMed/NCBI
|
|
9
|
Longley DB, Harkin DP and Johnston PG:
5-fluorouracil: Mechanisms of action and clinical strategies. Nat
Rev Cancer. 3:330–338. 2003. View
Article : Google Scholar : PubMed/NCBI
|
|
10
|
Christman JK: 5-Azacytidine and
5-aza-2′-deoxycytidine as inhibitors of DNA methylation:
Mechanistic studies and their implications for cancer therapy.
Oncogene. 21:5483–5495. 2002. View Article : Google Scholar : PubMed/NCBI
|
|
11
|
Su Y, Xu H, Xu Y, Yu J, Xian Y and Luo Q:
Azacytidine inhibits the proliferation of human promyelocytic
leukemia cells (HL60) by demethylation of MGMT, DAPK and p16 genes.
Hematology. 17:41–46. 2012. View Article : Google Scholar : PubMed/NCBI
|
|
12
|
Ma LB and He XY: The levels of DNA
methylation of sheep cloned embryos in different development
stages. Indian J Anim Res. 48:221–226. 2014. View Article : Google Scholar
|
|
13
|
Tran HT, Kim HN, Lee IK, Kim YK, Ahn JS,
Yang DH, Lee JJ and Kim HJ: DNA methylation changes following
5-azacitidine treatment in patients with myelodysplastic syndrome.
J Korean Med Sci. 26:207–213. 2011. View Article : Google Scholar : PubMed/NCBI
|
|
14
|
Paun O, Bateman RM, Fay MF, Hedrén M,
Civeyrel L and Chase MW: Stable epigenetic effects impact
adaptation in allopolyploid orchids (Dactylorhiza:
Orchidaceae). Mol Biol Evol. 27:2465–2473. 2010. View Article : Google Scholar : PubMed/NCBI
|
|
15
|
Xu Y, Zhao Q, Mei S and Wang J: Genomic
and transcriptomic alterations following hybridisation and genome
doubling in trigenomic allohexaploid Brassica carinata ×
Brassica rapa. Plant Biol (Stuttg). 14:734–744. 2012.
View Article : Google Scholar
|
|
16
|
Yang C, Zhang M, Niu W, Yang R, Zhang Y,
Qiu Z, Sun B and Zhao Z: Analysis of DNA methylation in various
swine tissues. PLoS One. 6:e162292011. View Article : Google Scholar : PubMed/NCBI
|