Introduction
Cancer caused by aneuploidy appears to be
independent of genetic mutations (1).
Spindle checkpoint proteins (SCPs) monitor chromosome separation.
One consequence of checkpoint function loss is genetic instability
that facilitates the cells to become malignant, resulting in
carcinogenesis (2).
Centromere-associated protein E (Cenp-E) is an
important type of centromere-specific protein that is predominantly
located in the outer layer of the centromere. A previous study
revealed that Cenp-E acts as a dynein, effectively connecting
centromeric dots and microtubules (3). Abrieu et al reported that the
intracellular level and location of Cenp-E was tightly restricted
(4). In addition, an increasing
number of studies have demonstrated that Cenp-E is important in the
investigation of SCP mechanisms (5–7). For
instance, one study indicated that specific levels of Cenp-E were
important in the activation of SCPs (5). Another study determined that the
location of Cenp-E on the centromere was influenced by upstream
proteins of centromere assembly, including Homo sapiens NUF2
and Cenp-H (8). In SCP mechanisms,
Cenp-E predominantly exerts its effect on budding uninhibited by
benzimidazoles (Bub) receptor 1 (BubR1) function by altering its
own structure (7).
However, abnormal SCP function has been discovered
in various cancerous cells. For example, reduced mitotic arrest
deficiency 2 expression has been observed in nasopharyngeal
carcinoma, hepatocellular carcinoma, human breast cancer and
ovarian cancer, and was found to be closely associated with SCP
defects (9,10). In addition, a reduced level of Bubl
mRNA expression has been observed in colon cancer and acute
myeloblastic leukemia (11). Enhanced
levels of Bubl, BubR1 and Bub3 expression were also found to be
closely associated with the proliferation of gastric cancer cells
(12). However, the association
between Cenp-E expression and cancer development remains
unclear.
The present study investigated the effect of Cenp-E
expression on the occurrence of numerical chromosomal abnormalities
in HepG-2 and LO2 cells using indirect immunofluorescence and RNA
interference techniques.
Materials and methods
Cells and reagents
HepG-2 human hepatocellular carcinoma and LO2 normal
hepatic cell lines were purchased from the Cell Bank of Shanghai
Institutes for Biological Sciences, Chinese Academy of Sciences
(Shanghai, China). Monoclonal rabbit anti-human Cenp-E (dilution,
1:1,000; cat. no. sc-22790) and monoclonal mouse anti-human tubulin
(dilution, 1:1,000; cat. no. sc-23950) primary antibodies, as well
as monoclonal goat anti-rabbit rhodamine-labeled Cenp-E red
fluorescent (dilution, 1:3,000; cat. no. sc-11291) and monoclonal
goat anti-mouse Alexa Fluor® 350 tubule blue (dilution, 1:3,000;
cat. no. sc-68836) secondary antibodies, were purchased from Santa
Cruz Biotechnology, Inc. (Dallas, TX, USA). In addition,
diisopropanolamine dyes were purchased from Sigma-Aldrich (St.
Louis, MO, USA), and Lipofectamine 2000® and TRIzol reagent were
provided by Invitrogen Life Technologies (Carlsbad, CA, USA). The
PrimeScript™ RT kit was manufactured by Takara Bio, Inc. (Otsu,
Japan) and the plasmid extraction kit was purchased from HuaShun
Biotech Co. Ltd. (Shanghai, China).
Short hairpin RNA (shRNA) design and
plasmid construction
The shRNA primers were designed to target the coding
sequence of the Cenp-E gene (GenBank accession number,
NM001813) using the Invitrogen Life Technologies online design
software (Primer Designer™ Tool). The primer sequences used were as
follows: Sense, 5′-GATCCCGCACCGATGCTGGTGACCTCCAACAGA
GAGCTCACCACCATCCGTGCTA-3′, and antisense, 5′-AGC
TYAAAAAAGCACGCATGCTGGTGACCTCTCTCTFGA AGAGGTCACCAGCATCCGTGCGG-3′.
Next, Basic Local Alignment Search Tool homology analysis
(http://blast.ncbi.nlm.nih.gov/Blast.cgi) was performed
to confirm the identity of the highly conserved region of the
target gene. Subsequently, the sequence was chemically synthesized
into single-stranded oligonucleotides, annealed to form
double-stranded DNA and inserted into the pGenesil-1 plasmid linear
vector. The sequence was then transformed into competent DH5a
Escherichia coli (3). Single
clones were selected for amplification and plasmid extraction. The
identity of the clones was confirmed by performing a double enzyme
digestion and DNA sequencing analysis was conducted. The enzymes
used were BamHI and HindIII (Takara Biotechnology
Co., Ltd., Dalian, China) and the instrument used was ABI 3730X
(Thermo Fisher Scientific, Waltham, MA, USA).
Plasmid DNA transfection
LO2 cells were seeded onto 24-well plates 1 day
before transfection at a density of 1–2×10⁵ cells/well
and cultured for a minimum of 12 h. Transfection was performed when
the cells reached 80% confluence. The cells were divided into the
experimental (plasmid shRNA-Cenp-E plus Lipofectamine 2000®),
control (pGenesil-1 plus Lipofectamine 2000®) and blank
(double-distilled H2O plus Lipofectamine 2000®) groups.
Pilot experiments demonstrated that the expression of Cenp-E
protein in LO2 cells was higher compared with that in HepG-2 cells;
since the present study aimed to observed the transformation from
LO2 to HepG-2 cells, we only interfered LO2 cells to investigate
whether they are able to transform into tumor cells.
Reverse transcription-quantitative
polymerase chain reaction (RT-qPCR)
LO2 cells were collected 48 h after transfection,
and RNA was extracted and converted into complementary DNA by
reverse transcription (High Capacity cDNA Reverse Transcription
kit; Thermo Fisher Scientific). The prepared Cenp-E,
glyceraldehyde-3-phosphate dehydrogenase (GAPDH) standard (used as
an internal control), primers and probes were used to perform qPCR
amplification with an ABI PRISM® 7000 system (Applied Biosystems
Life Technologies, Grand Island, NY, USA). The PCR conditions were
as follows: initial denaturation at 94°C for 5 min, followed by 40
cycles of denaturation at 94°C for 30 sec, and annealing at 51°C
for 30 sec. The PCR mixture included 2.5 µl Taq buffer (10X), 5 µl
MgCl2 (25 mmol/l), 2 µl dNTP (2.5 mmol/l), 0.5 µl Cenp-E
upstream primer (20 µmol/l), 0.5 µl Cenp-E downstream primer (20
µmol/l), 2 µl cDNA template, 0.3 µl Taq (5 U/µl), 0.6 µl TaqMan
probe (10 µmol/l) and double distilled H2O (11.6 µl).
Subsequently, the mRNA copy number ratio of target gene to GAPDH
was calculated to determine the Cenp-E mRNA expression level in
each group of cells. Based on the expression, the effect of the RNA
interference plasmid vector on the expression of the target gene
was then evaluated.
Indirect immunofluorescence assay
Transfected LO2 cells were seeded onto 24-well
plates at a density of 1–2×10⁵ cells/well. After
culturing for 12–18 h, the medium was discarded and the cells were
washed three times in phosphate-buffered saline (PBS) at 37°C prior
to fixing with methanol at −20°C for 20 min. After washing three
times with PBS, the cells were blocked with 10% goat serum (Thermo
Fisher Scientific) for 30 min and the supernatant was discarded
with no additional washing. Monoclonal rabbit anti-human Cenp-E
antibody (dilution, 1:1,000; cat. no. sc-22790; Santa Cruz
Biotechnology, Inc.) was then added and incubated at 37°C for 120
min prior to washing three times with PBS. Next, a goat anti-rabbit
secondary antibody (dilution, 1:3,000; cat. no. sc-45101; Santa
Cruz Biotechnology, Inc.) was added in the dark and incubated at
37°C for 60 min prior to washing three times with PBS. Finally, the
cells were incubated with 4′,6-diamidino-2-phenylindole at 37°C for
5 min. Glycerol (50%) was used to mount the samples for subsequent
investigation by laser scanning confocal microscopy (OLS4100;
Olympus Corporation, Tokyo, Japan).
Cell cycle analysis
HepG-2 and LO2 cells were treated with nocodazole
(100 ng/ml; Sigma-Aldrich) for 6–12 h, trypsinized with 0.25%
trypsin, resuspended in Dulbecco's modified Eagle's medium (Thermo
Fisher Scientific), transferred to 1.5-ml Eppendorf tubes and
washed three times in PBS with centrifugation at 129 × g for 5 min.
Subsequently, 75% alcohol (dissolved in PBS) was added and the
samples were incubated at 4°C overnight. Cell cycle analysis was
performed by the Pediatric Research Institute of Chongqing Medical
University (Chongqing, China).
Flow cytometry
Transfected LO2 cells were treated with 100 ng/ml
nocodazole for 6–12 h, collected, washed twice with PBS and fixed
with 70% ethanol (v/v) overnight at 4°C. Subsequent to rinsing with
PBS, the cells were incubated with 50 µg/ml RNase A and 50 µg/ml
propidium iodide solution (Sigma-Aldrich) in the dark at 4°C.
Following incubation for 30 min, the samples were analyzed using a
flow cytometer (Coulter EPICS Altra HyPerSort™ system; Beckman
Coulter, Brea, CA, USA). The resulting DNA histograms were
quantified using BD CellQuest Pro software (BD Biosciences,
Franklin Lakes, NJ, USA).
Chromosome analysis
LO2 and HepG-2 cells grown to 80% confluence were
incubated in a fridge at 4°C for 6–12 h prior to adding colchicine
(original concentration, 1 mg/100 ml; final concentration, 0.08
µg/ml; Sigma-Aldrich), and then incubated at 37°C for 6–10 h to
obtain a greater number of cells in metaphase. The cells were
collected and centrifuged at 806 × g for 5 min prior to adding 8 ml
KCl (0.075 mol/l) at 37°C, followed by incubation in a water bath
at 37°C for 15 min. Fixing solution (methanol: glacial acetic acid,
3:1; 300 µl) was added with thorough mixing, followed by
centrifugation at 806 × g for 5 min. The cells were then
resuspended and stored at room temperature for 30 min or at 4°C
overnight prior to centrifugation at 514 × g for 5 min. This step
was repeated two times. Next, the supernatant was removed and 500
µl fixing solution was added with mixing. Finally, the mixture (2–3
drops) was dripped onto a cold and clean glass slide from a height
of 30–50 cm, and dried prior to staining with Giemsa (Beijing
Dingguo Changsheng Biotechnology Co., Ltd., Beijing, China) for
5–10 min for microscopy (BX61; Olympus Corporation).
Statistical analysis
Data are expressed as the mean ±standard deviation.
Two groups of mean values were compared using Student's t-test. All
the statistical analyses were performed using SPSS software for
Windows (version 13.0; SPSS, Inc., Chicago, IL, USA). P<0.05 was
considered to indicate a statistically significant difference.
Results
Nocodazole treatment increases the
expression of Cenp-E mRNA in LO2 cells significantly more than in
HepG-2 cells
RT-qPCR was employed to determine the mRNA
expression levels of Cenp-E prior to and following treatment with
nocodazole. The expression of Cenp-E mRNA was presented as the mRNA
copy number ratio of Cenp-E to GAPDH. The results demonstrated that
treatment with nocodazole increased the level of Cenp-E mRNA in
HepG-2 cells from 0.0978±0.0273 (control group) to 0.1082±0.0203
(experimental group; no. of experiments, n=5; P>0.05), and
significantly enhanced the level of Cenp-E mRNA in LO2 cells from
0.0986±0.0261 to 0.1845±0.0345 (n=5; P<0.05). The Cenp-E mRNA
expression levels were not significantly different between the
HepG-2 and LO2 cells prior to treatment (P>0.05); however, a
significant difference was observed in the expression levels of
Cenp-E mRNA in the HepG-2 and LO2 cells subsequent to nocodazole
treatment (P<0.05; Table I). These
results indicated that treatment with nocodazole had a greater
effect in increasing the level of Cenp-E mRNA in LO2 cells compared
with the effect in HepG-2 cells.
 | Table I.Cenp-E mRNA expression levels in
HepG-2 and LO2 cells prior to and following treatment with
nocodazole. |
Table I.
Cenp-E mRNA expression levels in
HepG-2 and LO2 cells prior to and following treatment with
nocodazole.
|
| Cenp-E mRNA
expression levels, mean ± SDa |
|
|---|
|
|
|
|
|---|
| Group | HepG-2 cells
(n=5) | LO2 cells (n=5) | P-valueb |
|---|
| Control | 0.0978±0.0273 | 0.0986±0.0261 | >0.05 |
| Experimental | 0.1082±0.0203 | 0.1845±0.0345 | <0.05 |
shRNA-Cenp-E plasmid vector
specifically inhibits the expression of the Cenp-E gene in LO2
cells at the mRNA level
RT-qPCR was performed to determine the Cenp-E mRNA
expression levels prior to and following shRNA interference in LO2
cells. The assay demonstrated that the Cenp-E to GAPDH ratio of
mRNA copy number in the LO2/shRNA-Cenp-E group was
1.2±0.1×10⁻². This was significantly different from the
ratio in the untransfected LO2 group (8.8±0.1×10⁻²) and
the LO2/pGenesil-1 control group (9.8±0.1×10⁻²; both
P<0.05). These results indicated that the shRNA-Cenp-E plasmid
vector specifically inhibited the expression of the Cenp-E
gene in LO2 cells at the mRNA level.
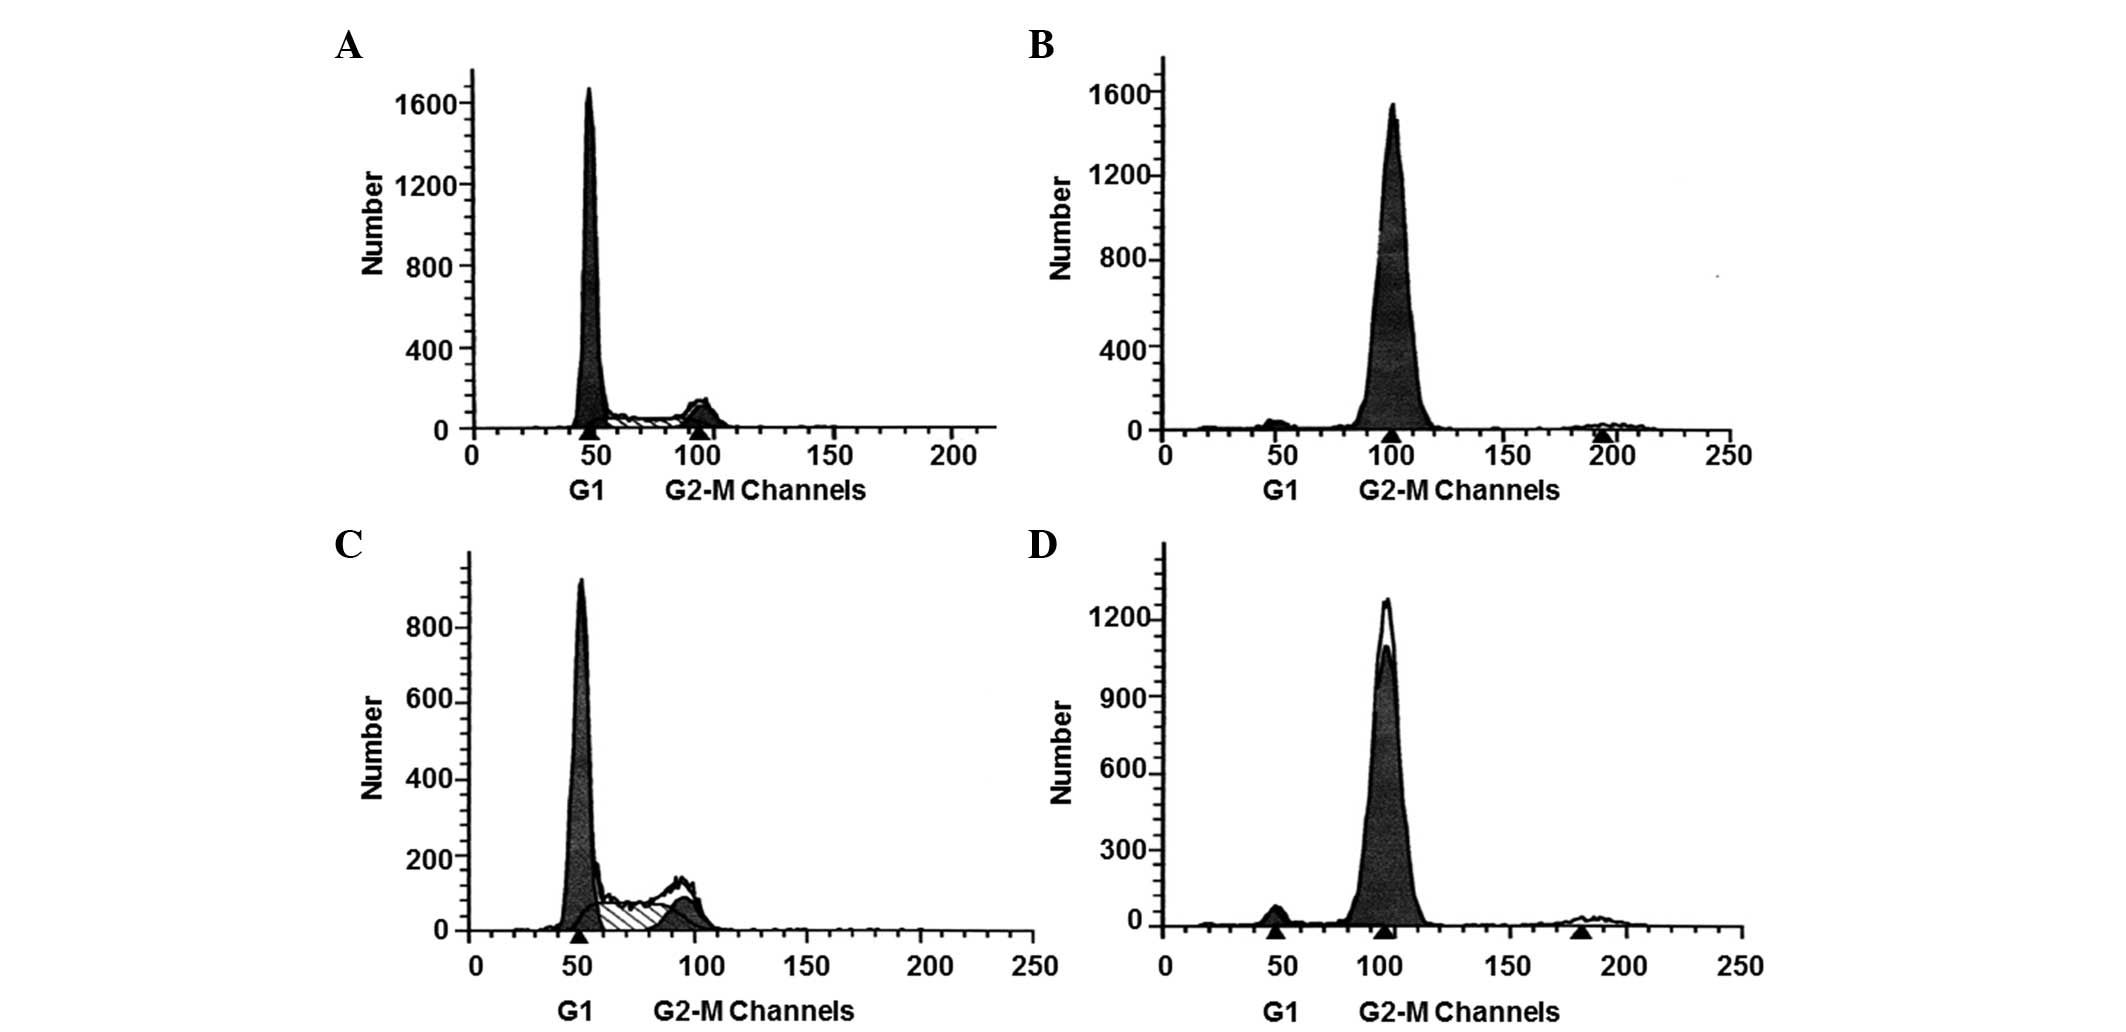
Nocodazole treatment increases the
proportion of LO2 and HepG-2 cells synchronized in mitosis,
resulting in a similar number of cells in the two cell types
An equal number of HepG-2 and LO2 cells, which were
maintained in identical conditions, were compared before and after
treatment with nocodazole. Nocodazole was used to maintain a
similar number of cells in mitosis and the cell phase was
determined by performing flow cytometric analysis (Fig. 1). The results demonstrated that the
percentage of LO2 and HepG-2 cells in the G2-M phase
prior to treatment were 0.0967±0.0241 and 0.1250±0.0287%,
respectively, with no statistically significant difference between
the two cell types (P>0.05; Fig. 1A
and C). Following treatment, the percentage of LO2 and HepG-2
cells in the G2-M phase increased to 0.9543±0.275 and
0.9783±0.218, respectively, with no statistically significant
difference between the two cell types (P>0.05; Fig. 1B and D). These results indicated that
nocodazole treatment increased the number of LO2 and HepG-2 cells
synchronized in mitosis, resulting in a similar number of cells in
the two cell types.
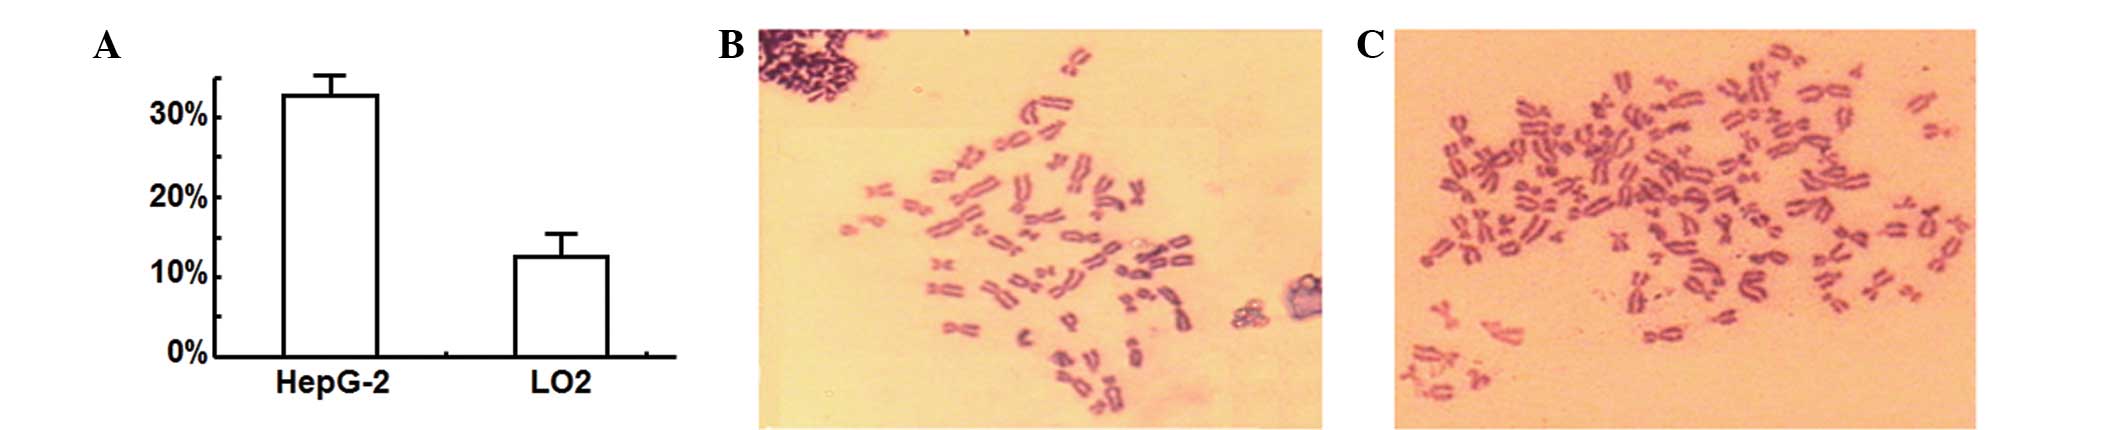
Greater percentage of HepG-2 cells
with abnormal chromosomes compared with LO2 cells
To determine the effect of nocodazole treatment on
the cell karyocyte, chromosomes were observed by microscopy
following staining with Giemsa. Analysis of images of >100
HepG-2 and LO2 cells in metaphase determined that the percentage of
HepG-2 hepatoma cells with abnormal chromosomes was markedly
greater than the proportion of normal LO2 hepatic cells with
abnormal chromosomes (Fig. 2A;
P<0.05). Fig. 2B and C shows
representative images of the normal and abnormal chromosomes
observed in LO2 and HepG-2 cells, respectively. These results
indicated that the percentage of cells with abnormal chromosomes
may be an important indicator for differentiating between normal
hepatic cells and hepatoma cells.
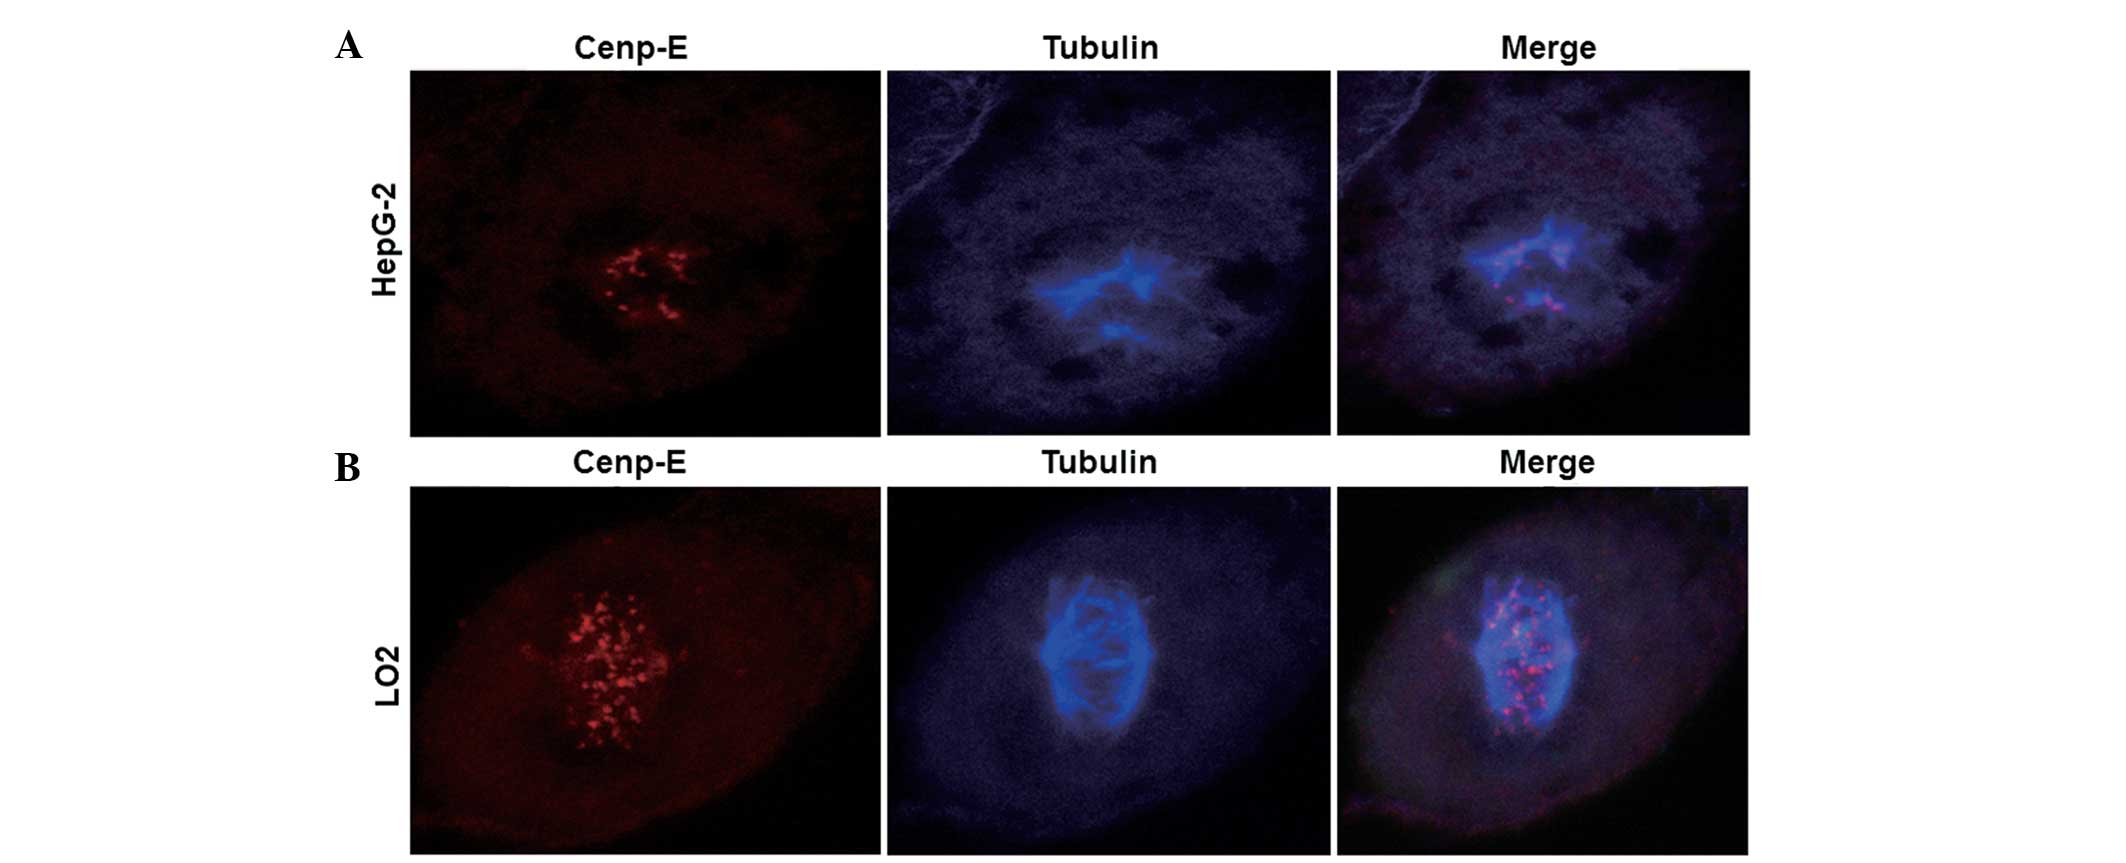
Low expression of Cenp-E protein
results in abnormal karyokinesis
To determine the protein expression levels of
Cenp-E, an indirect immunofluorescence assay using laser scanning
confocal microscopy was performed. Confocal images indicated that
karyokinesis in HepG-2 cells occurred as abnormal tripolar
segregation, while karyokinesis in LO2 cells occurred as normal
bipolar segregation (blue dots; Fig. 3A
and B). In addition, markedly fewer red dots were observed in
the HepG-2 cells compared with in the LO2 cells, indicating lower
expression of Cenp-E protein in HepG-2 cells (Fig. 3A and B). This observation indicated
that low expression of Cenp-E protein may result in abnormal
karyokinesis.
Reduction of Cenp-E protein expression
levels results in abnormal karyokinesis in LO2 normal hepatic
cells
To test whether changes in Cenp-E protein expression
influence the karyokinesis of LO2 normal hepatic cells,
interference plasmids of Cenp-E protein were introduced into LO2
normal hepatic cells and an indirect immunofluorescence assay was
performed by employing laser scanning confocal microscopy. The
images demonstrated that Cenp-E protein expression was reduced
following interference (red dots; Fig. 4A
and B) and karyokinesis in LO2 cells occurred as abnormal
tripolar segregation (blue dots; Fig. 4A
and B). This observation demonstrated that a reduction in
Cenp-E protein expression resulted in abnormal karyokinesis in LO2
normal hepatic cells, which was a key reason for the occurrence of
abnormal chromosome numbers.
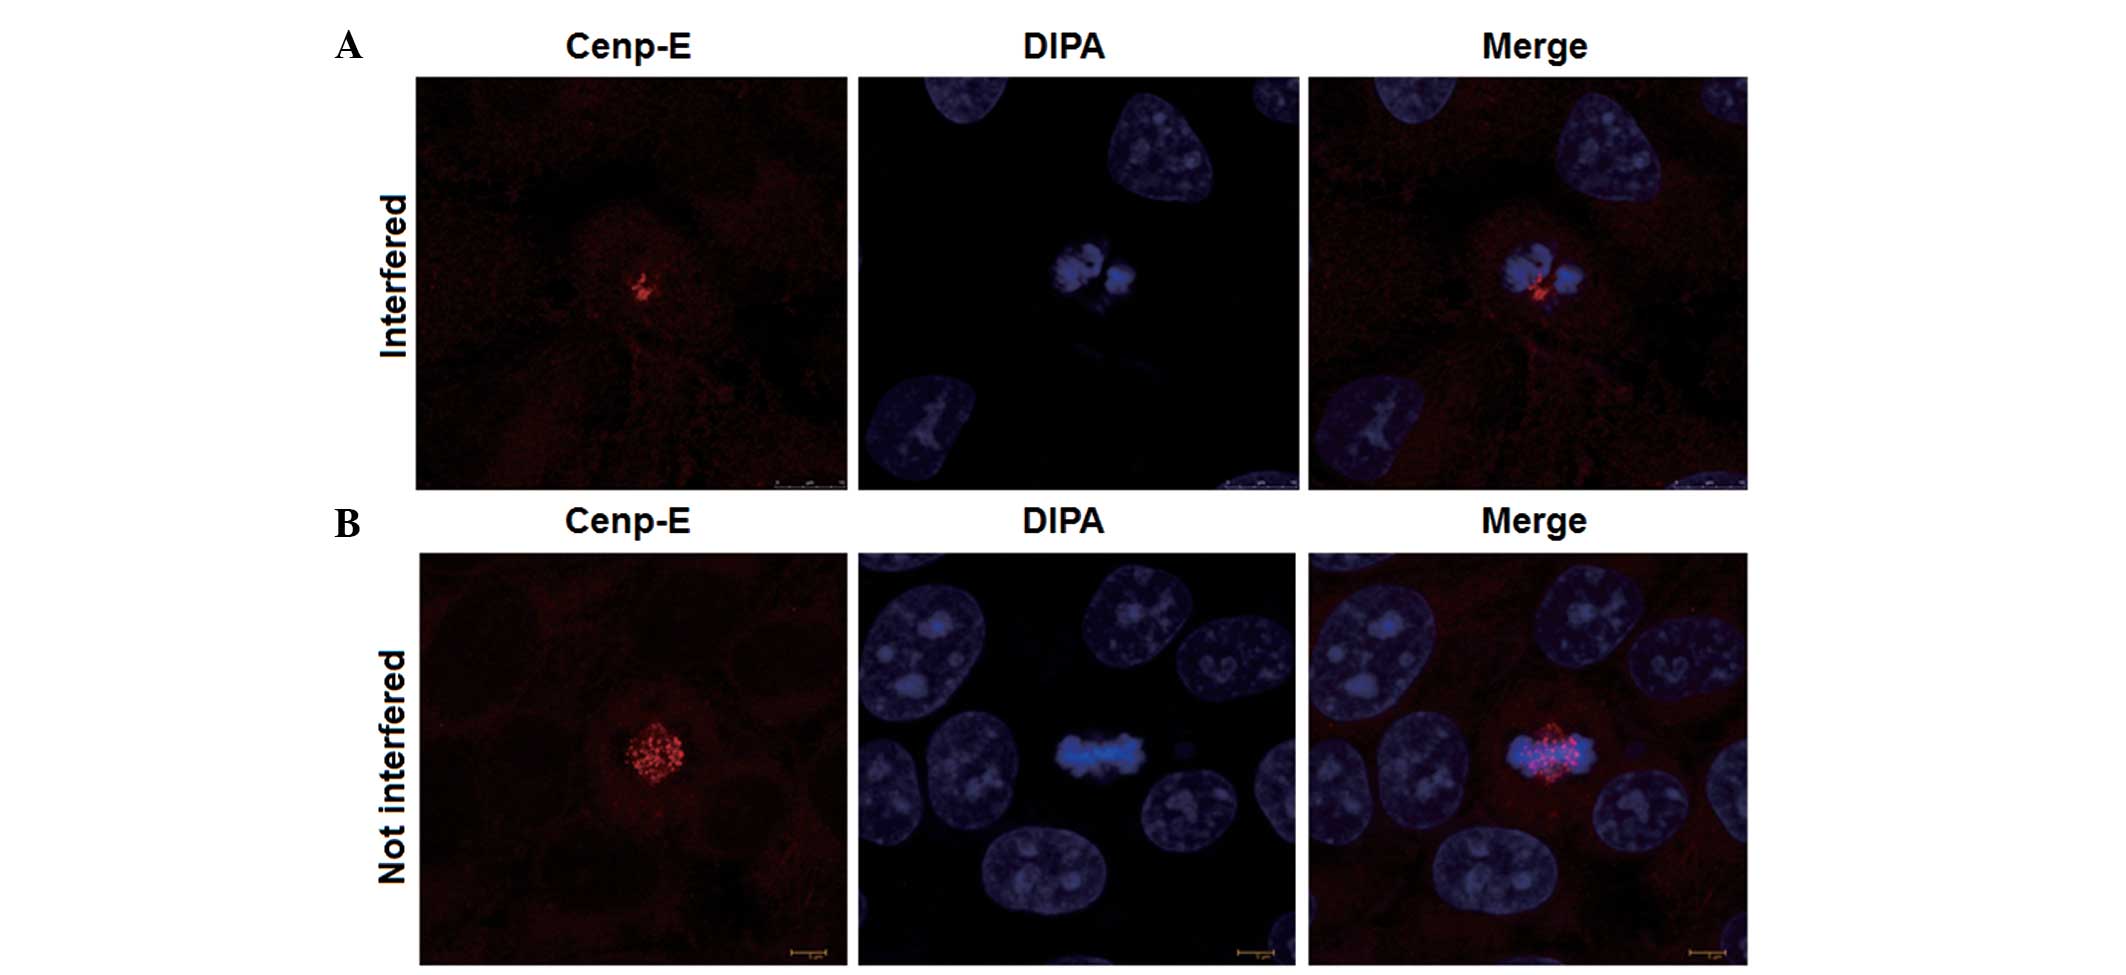 | Figure 4.Indirect immunofluorescence analysis
of LO2 cells after (A) Cenp-E interference or (B) no Cenp-E
interference. After normal culturing, rabbit anti-human Cenp-E
primary antibody was added to LO2 cells and the mixture was
incubated at 37°C for 2 h. Then, goat anti-rabbit secondary
antibody (200 µl; dilution, 1:200) and diisopropanolamine were
added, followed by incubation at 37°C for 1 h. Finally, the samples
were investigated by laser scanning confocal microscopy. Cenp-E,
red dots indicate the distribution of Cenp-E protein in the cell
nucleus; DIPA, blue dots indicate the shape of chromosomes in the
cells; merge, represents the combination of the red and blue dots
in the same field. Cenp-E, centromere-associated protein E; DIPA,
diisopropanolamine dye. |
Discussion
In the present study, it was determined that, prior
to nocodazole treatment, the percentage of mitotic HepG-2 cells
(12.5%) was marginally higher compared with the percentage of
mitotic LO2 cells (9.67%). In addition, Cenp-E mRNA expression in
HepG-2 cells was marginally higher compared with that in LO2 cells.
However, no statistically significant difference in the percentage
of mitotic cells or the level of Cenp-E mRNA expression was
identified between the two cell lines. However, Cenp-E expression
in the mitotic LO2 cells was significantly higher compared with
that in the mitotic HepG-2 cells following nocodazole treatment.
Thus, we propose that the different levels of Cenp-E expression in
the two cell types were magnified after the majority of the cells
were synchronized into the metaphase. In addition, indirect
immunofluorescence data indicated that Cenp-E expression in
abnormal mitotic cells was lower than that in normal mitotic cells.
This observation indicates that the upregulation of Cenp-E
expression in the LO2 cells was stronger compared with that in the
HepG-2 cells. In other words, mitotic HepG-2 cells exhibited
insufficient Cenp-E protein expression, resulting in dysfunctional
SCP monitoring. The HepG-2 cells entered the anaphase despite an
unsuccessful connection between the spindle fibers and the
centromere during the metaphase, causing numerical chromosomal
abnormalities in the cells. In addition, the changes in chromosome
number and cell cycle were also observed in previous studies on Bub
(7,9–12)
A Cenp-E shRNA vector was also constructed in order
to transfect LO2 cells. Indirect immunofluorescence data
demonstrated that the expression of Cenp-E protein in the
interfered cells was significantly reduced. This observation also
indicated that reduced Cenp-E expression affected the correct
assembly of centromeres, directly or indirectly, causing numerical
chromosomal abnormalities and resulting in precancerous lesions of
the cells (13,14). However, the association of Cenp-E with
the abnormal chromosomes observed in the current study remains
unclear and requires further investigation.
In conclusion, the present study indicated that the
ability of hepatoma cells to upregulate mitotic Cenp-E expression
upon stress was reduced compared with that of normal hepatocytes,
indicating that the shortage of Cenp-E SCP may be a cause of the
numerical chromosomal abnormalities observed in hepatoma cells.
Thus, the current study provided a basis for subsequent
investigations into the effect of Cenp-E in tumorigenesis.
Acknowledgements
The present study was supported by a grant provided
by the Education Department of Hunan Province (Changsha, China;
grant no. 13C796).
References
|
1
|
Duesberg P, Rausch C, Rasnick D and
Hehlmann R: Genetic instability of cancer cell is proportional to
their degree of aneuploidy. Proc Natl Acad Sci USA. 95:13692–13697.
1998. View Article : Google Scholar : PubMed/NCBI
|
|
2
|
Wenming Z and Mengchao W: Research of
hepatocellular carcinoma genome instability. Di Er Jun Yi Da Xue
Xue Bao. 23:5–8. 2002.(In Chinese).
|
|
3
|
Pan J and Chen RH: Spindle checkpoint
regulates Cdc20p stability in Saccharomyces cerevisiae. Genes Dev.
18:1439–1451. 2004. View Article : Google Scholar : PubMed/NCBI
|
|
4
|
Abrieu A, Kahana JA, Wood KW and Cleveland
DW: CENP-E as an essential component of the mitotic checkpoint
in vitro. Cell. 102:817–826. 2000. View Article : Google Scholar : PubMed/NCBI
|
|
5
|
Orthaus S, Ohndorf S and Diekmann S: RNAi
knockdown of human kinetochore protein CENP-H. Biochem Biophys Res
Commun. 348:36–46. 2006. View Article : Google Scholar : PubMed/NCBI
|
|
6
|
Maia AF, Lopes CS and Sunkel CE: BubR1 and
CENP-E have antagonistic effects upon the stability of
microtubule-kinetochore attachments in Drosophila S2 cell mitosis.
Cell Cycle. 6:1367–1378. 2007. View Article : Google Scholar : PubMed/NCBI
|
|
7
|
Fraschini R, Beretta A, Sironi L, et al:
Bub3 interaction with Mad2, Mad3 and Cdc20 is mediated by WD40
repeats and does not require intact kinetochores. EMBO J.
20:6648–6659. 2001. View Article : Google Scholar : PubMed/NCBI
|
|
8
|
Liu D, Ding X, Du J, Cai X, Huang Y, Ward
T, Shaw A, Yang Y, Hu R, Jin C and Yao X: Human NUF2 interacts with
centromere-associated protein E and is essential for a stable
spindle microtubule-kinetochore attachment. J Biol Chem.
282:21415–21424. 2007. View Article : Google Scholar : PubMed/NCBI
|
|
9
|
Chung E and Chen RH: Phosphorylation of
Cdc20 is required for its inhibition by the spindle checkpoint. Nat
Cell Biol. 5:748–753. 2003. View
Article : Google Scholar : PubMed/NCBI
|
|
10
|
Tang Z, Shu H, Oncel D, Chen S and Yu H:
Phosphorylation of Cdc20 by Bub1 provides a catalytic mechanism for
APC/C inhibition by the spindle checkpoint. Mol Cell. 16:387–397.
2004. View Article : Google Scholar : PubMed/NCBI
|
|
11
|
Liu D, Zhang N, Du J, Cai X, Zhu M, Jin C,
Dou Z, Feng C, Yang Y, Liu L, et al: Interaction of Skp1 with
CENP-E at the midbody is essential for cytokinesis. Biochem Biophys
Res Commun. 345:394–402. 2006. View Article : Google Scholar : PubMed/NCBI
|
|
12
|
Kim Y, Holland AJ, Lan W and Cleveland DW:
Aurora kinases and protein phosphatase 1 mediate chromosome
congression through regulation of CENP-E. Cell. 142:444–455. 2010.
View Article : Google Scholar : PubMed/NCBI
|
|
13
|
Gudimchuk N, Vitre B, Kim Y, et al:
Kinetochore kinesin CENP-E is a processive bi-directional tracker
of dynamic microtubule tips. Nat Cell Biol. 15:1079–1088. 2013.
View Article : Google Scholar : PubMed/NCBI
|
|
14
|
Shrestha RL and Draviam VM: Lateral to
end-on conversion of chromosome-microtubule attachment requires
kinesins CENP-E and MCAK. Curr Biol. 23:1514–1526. 2013. View Article : Google Scholar : PubMed/NCBI
|