Introduction
Cholangiocarcinoma is a malignant tumor arising from
the tumorigenic transformation of cholangiocytes (1,2).
Cholangiocarcinoma is rare compared with other types of cancer.
However, a high incidence of cholangiocarcinoma has been reported
in Eastern Asia, particularly in Thailand (3). Cholangiocarcinoma is characterized by
slow growth and late-occurring metastases. However, the majority of
patients with cholangiocarcinoma are diagnosed at advanced stages
when curative surgery is not an option. The efficacy of
chemotherapy and radiotherapy on cholangiocarcinoma is modest at
best. Therefore, the prognosis of patients with cholangiocarcinoma
is poor, and effective treatments are lacking (4,5). The
identification of novel molecular therapeutic targets for the
improvement of cholangiocarcinoma treatment efficacy is the focus
of the present study.
Dihydroartemisinin (DHA) is a sesquiterpene lactone
that bears a labile peroxide bridge and is extracted from the
traditional Chinese medicine Artemisia annua (6). It has been widely used in the treatment
of malaria and exhibits remarkably high efficacy against malaria.
Previous studies have demonstrated that DHA and its derivatives
have numerous pharmacological activities, including antibacterial
sepsis, radiotherapy sensitization, antibiotic sensitization and
antitumor effects (7). The antitumor
activities of DHA merit further investigation. Previous studies on
the mechanisms underlying the potential antitumor effects of DHA
have not resulted in major breakthroughs. However, studies have
demonstrated that there are similarities between the mechanisms of
the antitumor and antimalarial activities of DHA and that DHA
exerts an antitumor effect by promoting tumor cell apoptosis
(8–11). The present study determined that DHA
treatment significantly affected the expression of MCL-1 protein
variants in the human cholangiocarcinoma cell line QBC939, and
therefore induced apoptosis in these cells. The results provide key
information for understanding the mechanisms underlying the
antitumor effect of DHA.
Materials and methods
Materials
QBC939 cells were a generous gift from the Cell
Center of Xiangya Medical College (Changsha, China). DHA was
purchased from Shaanxi Sciphar Biotechnology Co., Ltd. (Xi'an,
China). Tetrazolium salt
3-(4,5-Dimethylthiazol-2-yl)-2,5-diphenyltetrazoliumbromide (MTT),
dimethyl sulfoxide (DMSO), Triton-100, and TRIzol were purchased
from Sigma-Aldrich China, Inc. (Shanghai, China). Fetal bovine
serum (FBS) was purchased from Hangzhou Sijiqing Biological
Engineering Materials Co., Ltd. (Hangzhou, China). RPMI-1640 medium
and trypsin were purchased from Gibco Life Technologies (Beijing,
China). The Apoptotic DNA Ladder Extraction kit and Bicinchoninic
Acid (BCA) Protein Assay kit were purchased from Beyotime Institute
of Biotechnology (Haimen, China). Primers and probes for the
MCL-1 and β-actin gene were purchased from Shanghai
Sangon Biological Engineering Technology & Services Co., Ltd.
(Shanghai, China). The rabbit polyclonal anti-human MCL-1 and
β-actin antibodies were purchased from Beijing Biosynthesis
Biotechnology Co, Ltd. (Beijing, China).
Cell culture and treatments
QBC939 cells were maintained in a humidified
incubator at 37°C and 5% CO2 according to the cell
culture instructions provided by the American Type Culture
Collection (Manassas, VA, USA). The cells were cultured until
adherent and passaged every 2–3 days. Once the cells were ready for
passage, the culture medium was aspirated. The cells were washed
twice with phosphate-buffered saline (PBS), digested with 0.25%
trypsin, centrifuged at 208 × g for 7 min, resuspended in
fresh medium, and seeded into tissue culture flasks. Following
recovery, the cells were cultured in RPMI-1640 medium supplemented
with 10% FBS and 100 U/ml penicillin/streptomycin (Sigma-Aldrich
China, Inc.) at 37°C in an incubator with a fully humidified
atmosphere containing 5% CO2. ‘Normal conditions’ is
used throughout to describe the above conditions, which were used
in the proceeding experiments.
Analysis of the inhibitory effect of
DHA on the proliferation of the QBC939 cholangiocarcinoma cells by
MTT assay
QBC939 cholangiocarcinoma cells were divided into
the following groups: The control group, in which the cells were
maintained under normal culture conditions; the DMSO group, in
which the cells were treated with 0.1% DMSO (the solvent DMSO only,
containing 0 µmol/l DHA); and the DHA group, in which the cells
were treated with increasing concentrations of DHA at 10, 20, 40,
80, 160 and 320 µmol/l. Exponentially growing QBC939 cells were
seeded at a density of 2 × 10⁵ cells/ml into 96-well
cell culture plates at a volume of 200 µl per well and cultured
under normal conditions for 24 h. The cells were then grouped and
treated as described above. Each group contained 6 replicate wells.
Following incubation at 37°C, 5% CO2 and 95% saturated
humidity for 6, 12, 24, 48 or 72 h, the cells were mixed with the
MTT reagent (20 µl/well) and further incubated for 4 h. The
supernatant was removed and discarded. DMSO was added to the cells
at 150 µl/well, and the crystals that formed in living cells were
fully dissolved through 10-min oscillation. The absorbance values
at a wavelength of 490 nm (A490) were determined using an ELISA
reader, and the cell proliferation inhibitory rates were
calculated.
Determination of the cell death rates
of DHA-treated QBC939 cells by trypan blue staining
QBC939 cholangiocarcinoma cells were harvested,
seeded uniformly at a density of 2 × 10⁵ cells/ml into
24-well cell culture plates at 1 ml/well, and cultured under normal
conditions for 24 h. The cells were then grouped and treated as
described for the MTT assay; each group contained 6 replicate
wells. Following incubation at 37°C, 5% CO2 and 95%
saturated humidity for 6, 12, 24, 48 and 72 h, the cells in each
group were trypsinized, dispersed into a single cell suspension,
and diluted appropriately. Trypan blue solution (0.4%) was added to
the cell suspension at a ratio of 1:9 (final concentration of
trypan blue was 0.04%) and mixed thoroughly. Following trypan blue
staining, the cells in each group were loaded onto a hemocytometer,
and the number of live and dead cells were counted immediately.
Cell counting was completed within 3 min following the addition of
trypan blue, and the cell death rates were calculated.
Detection of apoptotic DNA degradation
by DNA ladder assay
QBC939 cholangiocarcinoma cells were harvested,
seeded uniformly at a density of 2 × 10⁵ cells/ml into
6-well cell cultured plates (2 ml/well), and cultured for 24 h
under normal conditions. QBC939 cells cultured in the presence of
DMSO (solvent only, prior to the addition of DHA) were used as the
control group. Based on the results of the MTT assay and trypan
blue experiments described above, DHA was added to QBC939 cells in
the experimental group at a concentration of 20 µmol/l. The cells
were then incubated at 37°C, 5% CO2 and 95% saturated
humidity for 12, 24 and 48 h. Each group contained 3 replicate
wells. Following incubation, QBC939 cells were digested with 0.25%
trypsin solution, dispersed into suspension by gentle pipetting and
centrifuged at 208 × g for 5 min. The supernatant was
removed and discarded, and the cells were washed once with PBS (pH
7.4). The total cellular DNA was extracted using the Apoptotic DNA
Ladder Extraction kit according to the manufacturer's instructions.
Agarose gel was prepared by mixing 1.0 g agarose with 40 ml
electrophoresis buffer. The mixture was heated to boiling until the
agarose was dissolved and then cooled to below 60°C. A total of 2.5
µl of 10 mg/ml ethidium bromide was added to the agarose gel
solution and mixed thoroughly by swirling. The agarose gel solution
was poured onto the casting tray with an inserted comb and placed
at room temperature for 30–45 min. Electrophoresis was performed
once the 1.5% agarose gel was solidified. Following electrophoresis
at 5 V/cm for 30 min, gel images were acquired under ultraviolet
light (Gel Doc 1000, Bio-Rad Laboratories, Inc., Hercules, CA,
USA).
Analysis of cell cycle changes and
apoptosis by flow cytometry (FCM)
QBC939 cholangiocarcinoma cells were harvested,
seeded uniformly at a density of 2 × 10⁵ cells/ml into
25-cm2 cell cultured flasks (5 ml/flask), and cultured
under the normal conditions for 24 h. The QBC939 cells were then
grouped as described for the DNA ladder assay. Each group contained
6 replicate wells. DHA was added to the cells in the experimental
group at a concentration of 20 µmol/l. Following incubation at
37°C, 5% CO2 and 95% saturated humidity for 12, 24 and
48 h, QBC939 cells were digested with 0.25% trypsin, dispersed into
suspension by gentle pipetting, and centrifuged for 5 min at 208 ×
g to collect the cells. The supernatant was aspirated. The
cells were washed twice with 0.01 mol/l PBS, fixed in pre-cooled
70% ethanol at 4°C for 1 h, and centrifuged at 208 × g for 5
min. Following removal of the supernatant, the cells were washed
twice with 0.01 mol/l PBS and resuspended in 1 ml of 0.01 mol/l
PBS. RNase A and propidium iodide (both Sigma-Aldrich China, Inc.)
were added to the cells at final concentrations of 50 and 100
µg/ml, respectively, and incubated for 30 min at 4°C in the dark.
Changes in the cell cycle and apoptosis were examined by FCM (BD
FACSCalibur, Becton Dickinson UK Ltd., Oxford, UK).
Examination of MCL-1 mRNA expression
by reverse transcription-polymerase chain reaction (RT-PCR)
amplification
The ACTB gene (encoding β-actin) was used as
an internal reference gene. QBC939 cholangiocarcinoma cells were
grouped and treated as described for the DNA ladder assay, and the
total RNA was extracted from the cells and tissues using TRIzol
according to the manufacturer's instructions. cDNA was synthesized
in reverse transcriptase-mediated RT reactions using mRNAs as
templates and Oligo (dT) as primers. Primers and probes for the
MCL-1-associated genes and the β-actin gene were designed
based on the gene sequences stored in the GenBank database
(www.ncbi.nlm.nih.gov/genbank/). The
primer sequences for the MCL-1-associated genes were as
follows: MCL1-001, F 5′-TTTGGCTACGGAGAAGGAGG-3′ and R
5′-TTCCGAAGCATGCCTTGGAAG-3′ (the size of the PCR amplification
product was 597 bp); MCL1-002, F 5′-CCGCTTGAGGAGATGGAAG-3′
and R 5′-CACAAACCCATCCTTGGAAG-3′ (the size of the PCR amplification
product was 382 bp); MCL1-201, F 5′-GACTTTTGGCTACGGAGATG-3′
and R 5′-GACCCGTCCGTACTGGTGTT-3′ (the size of the PCR amplification
product was 163 bp). The PCR amplification conditions were as
follows: 94°C for 2 min; 94°C for 20 sec, 55°C (variable) for 30
sec, and 60°C for 40 sec for a total of 45 cycles, on a FTC-300 PCR
machine (Shanghai Funglyn Biotech Co.,Ltd., Shanghai, China). The
threshold cycle (Ct) value for each PCR sample was determined using
Sequence Detection software, version 1.2.3 (Thermo Fisher
Scientific, Inc., Waltham, MA, USA). The specificity of the PCR
reaction was verified by melting curves and agarose gel
electrophoresis. The relative quantities were calculated using the
2ΔΔCt method.
Examination of MCL-1 protein
expression by western blot analysis
QBC939 cholangiocarcinoma cells were harvested,
seeded uniformly at a density of 4 × 10⁵ cells/ml onto
75-cm2 cell culture flasks (10 ml/flask), and cultured
under the normal conditions for 24 h. QBC939 cells were then
grouped and treated as described above and incubated at 37°C, 5%
CO2 and 95% saturated humidity for 12, 24 and 48 h.
Following incubation, the old medium was aspirated, and the cells
were washed twice with 0.01 mol/l PBS. The cells in each well were
harvested in 1 ml of 0.01 mol/l PBS solution, centrifuged at 208 ×
g for 5 min, and lysed using the electrophoresis sample buffer. The
cell lysates were centrifuged at 4°C, 15,682 × g for 15 min. The
resulting supernatant was collected, and the protein concentration
in the supernatant was determined using the BCA Protein Assay kit.
Equal amounts of protein preparations (20 µl) were loaded onto 1.5%
agarose protein gels and subjected to separation by electrophoresis
at 5 V/cm for 30 min. Following electrophoresis, the proteins were
transferred to polyvinylidene difluoride membranes (Merck
Millipore, Darmstadt, Germany). The membranes were blocked with the
5% non-fat milk at room temperature for 3 h and incubated overnight
at 4°C. The membranes were then washed with PBS, probed with
primary antibodies (MCL-1 and β-actin, 1:500) at 37°C for 2 h,
blocked again, incubated with horseradish peroxidase-conjugated
goat anti-rabbit secondary antibodies (1:800; Bioscience Co.,
Beijing, China) at 37°C for 2 h, and washed three times for 5 min
each with 1X PBS with agitation. The expression of MCL-1 protein
and the internal reference protein β-actin in each group of cells
was visualized using an EasyBlot ECL kit (Shanghai Sangon
Biological Engineering Technology & Services Co., Ltd.),
imaged, and analyzed using the Quantity One software, version 4.4.0
(Bio-Rad Laboratories, Inc.).
Statistical analysis
Measurement data are presented as the mean ±
standard deviation. Comparison of the means between two groups was
performed using Student's t-test. P<0.05 was considered to
indicate a statistically significant difference.
Results
The inhibitory effect of DHA on QBC939
cell proliferation and the effects of DHA on the cell death rate of
the QBC939 cells
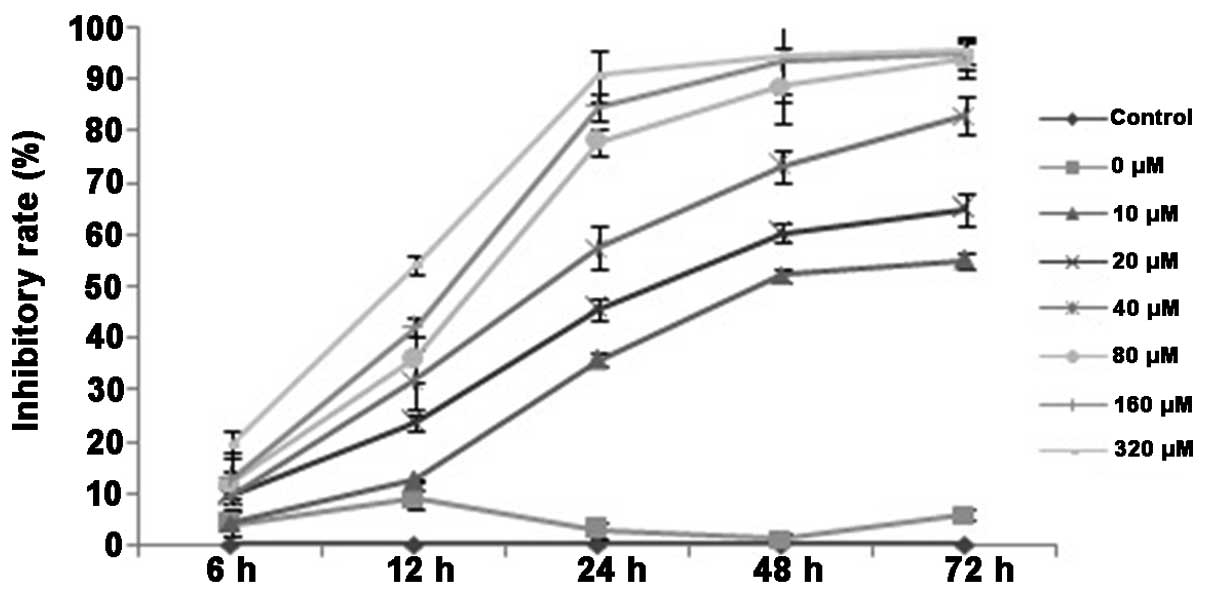
The MTT assay demonstrated that the addition of a
minimum of 10 µmol/l DHA significantly inhibited the proliferation
of QBC939 cells (P<0.05; Fig. 1).
As the concentration of DHA was increased, the inhibitory effect
also increased. No statistically significant differences in cell
proliferation were observed between the DMSO group and the control
group. By contrast, treatment at all the examined DHA
concentrations resulted in statistically significant inhibition of
proliferation compared with the control group (P<0.05).
Furthermore, the half maximal inhibitory concentration
(IC50) of DHA decreased significantly with treatment
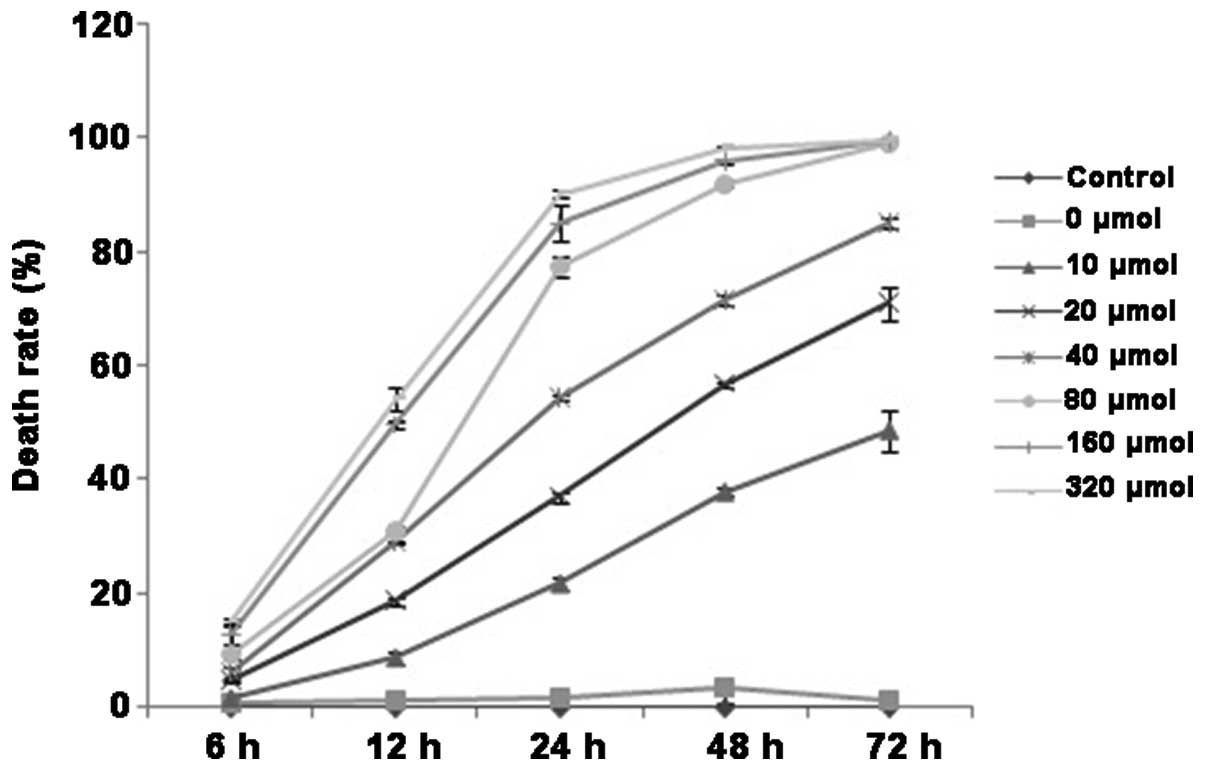
time (P<0.01; Table I). The rate
of cell death of QBC939 cells following DHA treatment was examined
by trypan blue staining, and the results demonstrated similar
trends to the MTT assay result. The addition of a minimum of 20
µmol/l DHA significantly increased the cell death of QBC939 cells.
As the DHA concentration increased, the percentage of cell death
also increased (P<0.05; Fig. 2).
In addition, the proliferation-inhibiting and the death-promoting
effects of DHA on QBC939 cells gradually increased with prolonged
duration of DHA treatment over the observed time points of 12, 24
and 48 h (P<0.05). Therefore, the effects of DHA on QBC939 cells
exhibited an apparent time- and dose-dependence. The above
experiments demonstrated that treatment with 20 µmol/l DHA for 12,
24 and 48 h resulted in significant effects on proliferation and
cell death, however treatment at this concentration did not induce
a high enough degree of cell death that would impede the
examination of additional parameters in subsequent experiments.
 | Table I.Changes in IC50 levels in
DHA-treated cells over time. |
Table I.
Changes in IC50 levels in
DHA-treated cells over time.
| Time/h |
IC50/µmol/l |
|---|
| 6 |
780.20±14.39 |
| 12 |
255.01±7.37a |
| 24 |
22.61±2.17a |
| 48 |
10.12±1.10a |
| 72 |
7.94±0.53a |
The effect of DHA on the apoptosis of
QBC939 cells
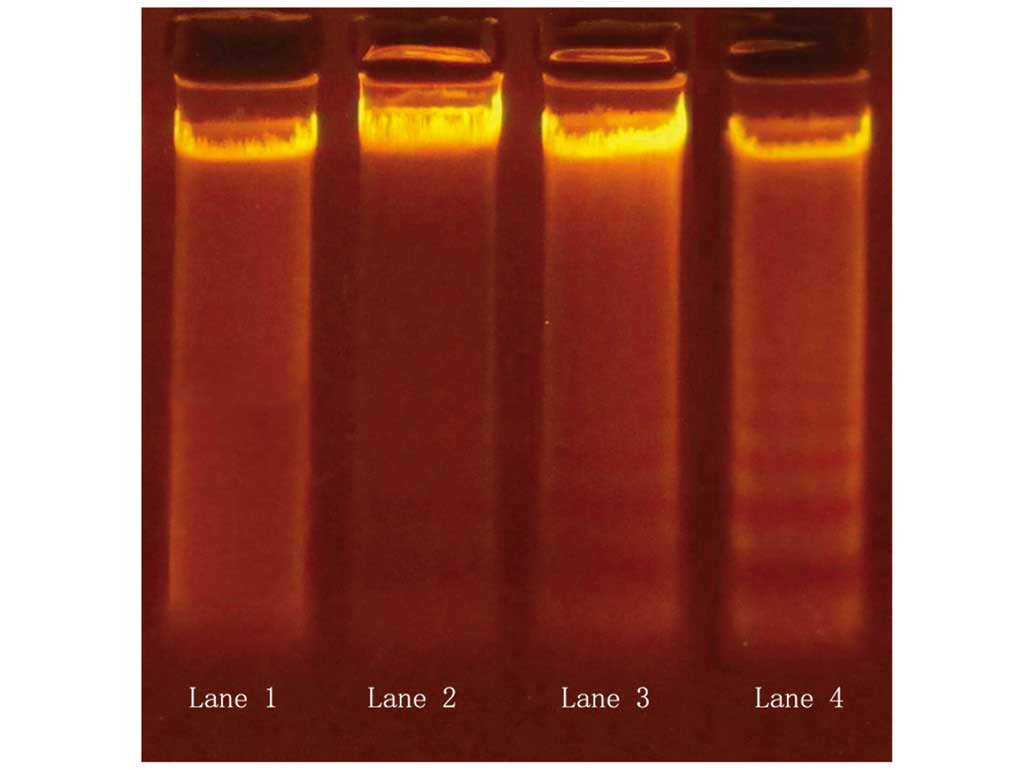
Apoptotic DNA degradation was examined using a DNA
ladder assay. Varying degrees of DNA ladder formation were detected
in QBC939 cells following treatment with 20 µmol/l DHA for various
time periods. In the 24- and 48-h treatment groups, DNA ladder
formation was apparent (Fig. 3);
however, this effect was not evident with 12-h treatment. The
results indicate that DHA treatment induced apoptosis in QBC939
cells, and the apoptosis-promoting effects were apparent following
at least 24 h of DHA treatment (Fig.
3).
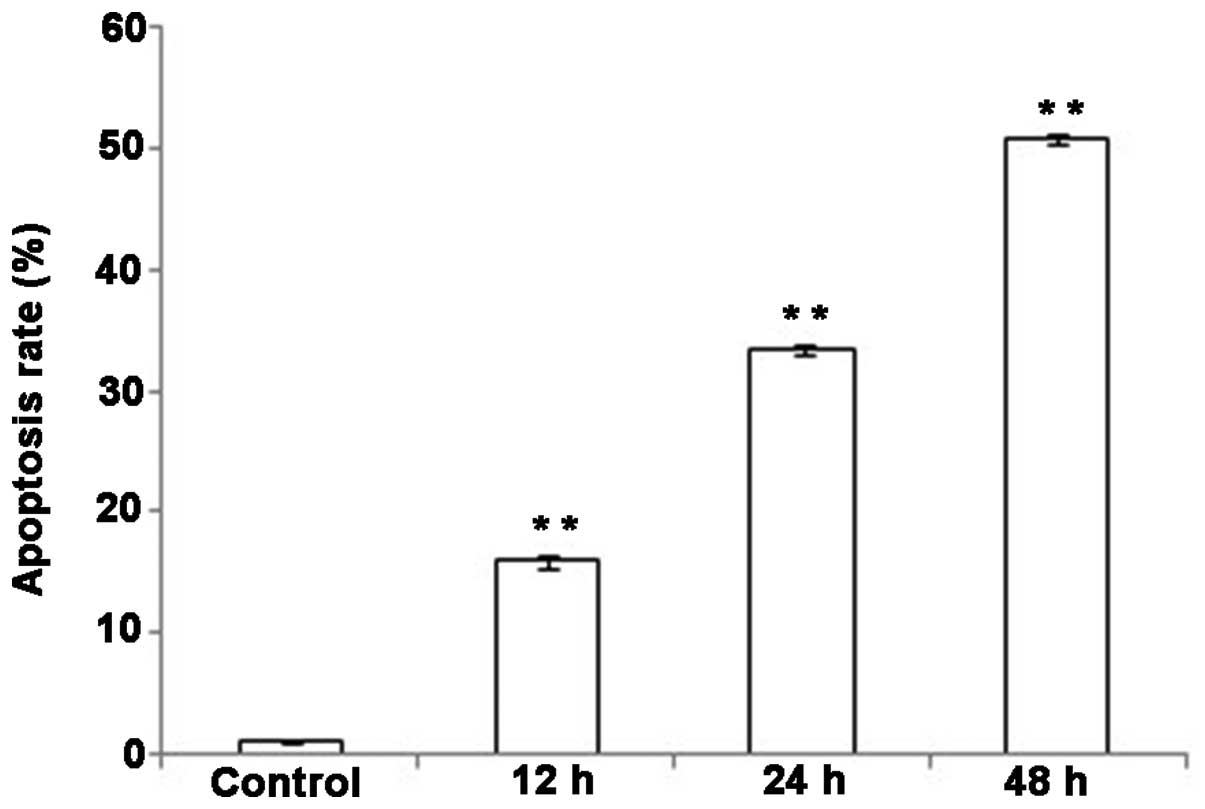
Analysis of the effects of DHA on cell
cycle and apoptosis in QBC939 cells by FCM
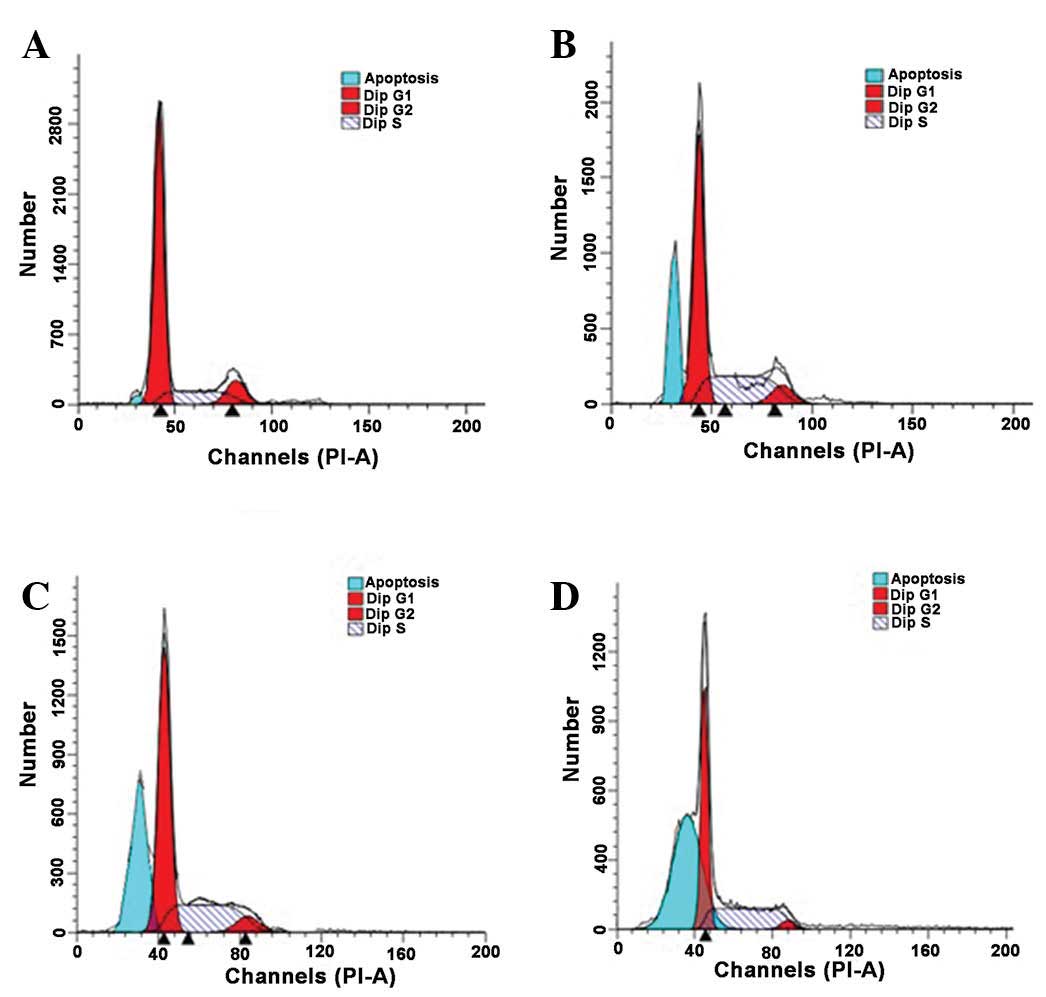
As presented in Fig.
4, typical G1 sub-peaks were detected in the DHA
treatment groups (Fig. 4B-D). DHA
treatment resulted in a reduction in the percentage of QBC939 cells
in the G0/G1 and G2/M phases, and
the number of QBC939 cells in S phase increased significantly
following DHA treatment (P<0.05; Table II). These results indicated that the
QBC939 cells were arrested in the S phase of the cell cycle
following DHA treatment. Thus DHA treatment induced apoptosis in a
proportion of QBC939 cells. As the duration of the DHA treatment
increased, the apoptotic rates of QBC939 cells also increased.
Compared with the control group, the apoptotic rates in the DHA
treatment groups were significantly increased at all the observed
time points (Fig. 5; P<0.01).
| Table II.Analysis of the cell cycle changes (%)
in QBC939 cells by flow cytometry analysis. |
Table II.
Analysis of the cell cycle changes (%)
in QBC939 cells by flow cytometry analysis.
| Groups |
G0/G1 phase | S phase | G2/M
phase |
|---|
| Control |
70.58±1.15 |
18.57±0.52 |
10.84±0.71 |
| 12 h |
56.42±0.66b |
35.33±0.68b |
8.25±0.91a |
| 24 h |
61.68±0.91b |
32.47±0.65b |
5.84±0.81a |
| 48 h |
54.47±0.64b |
41.30±0.72b |
4.23±0.25b |
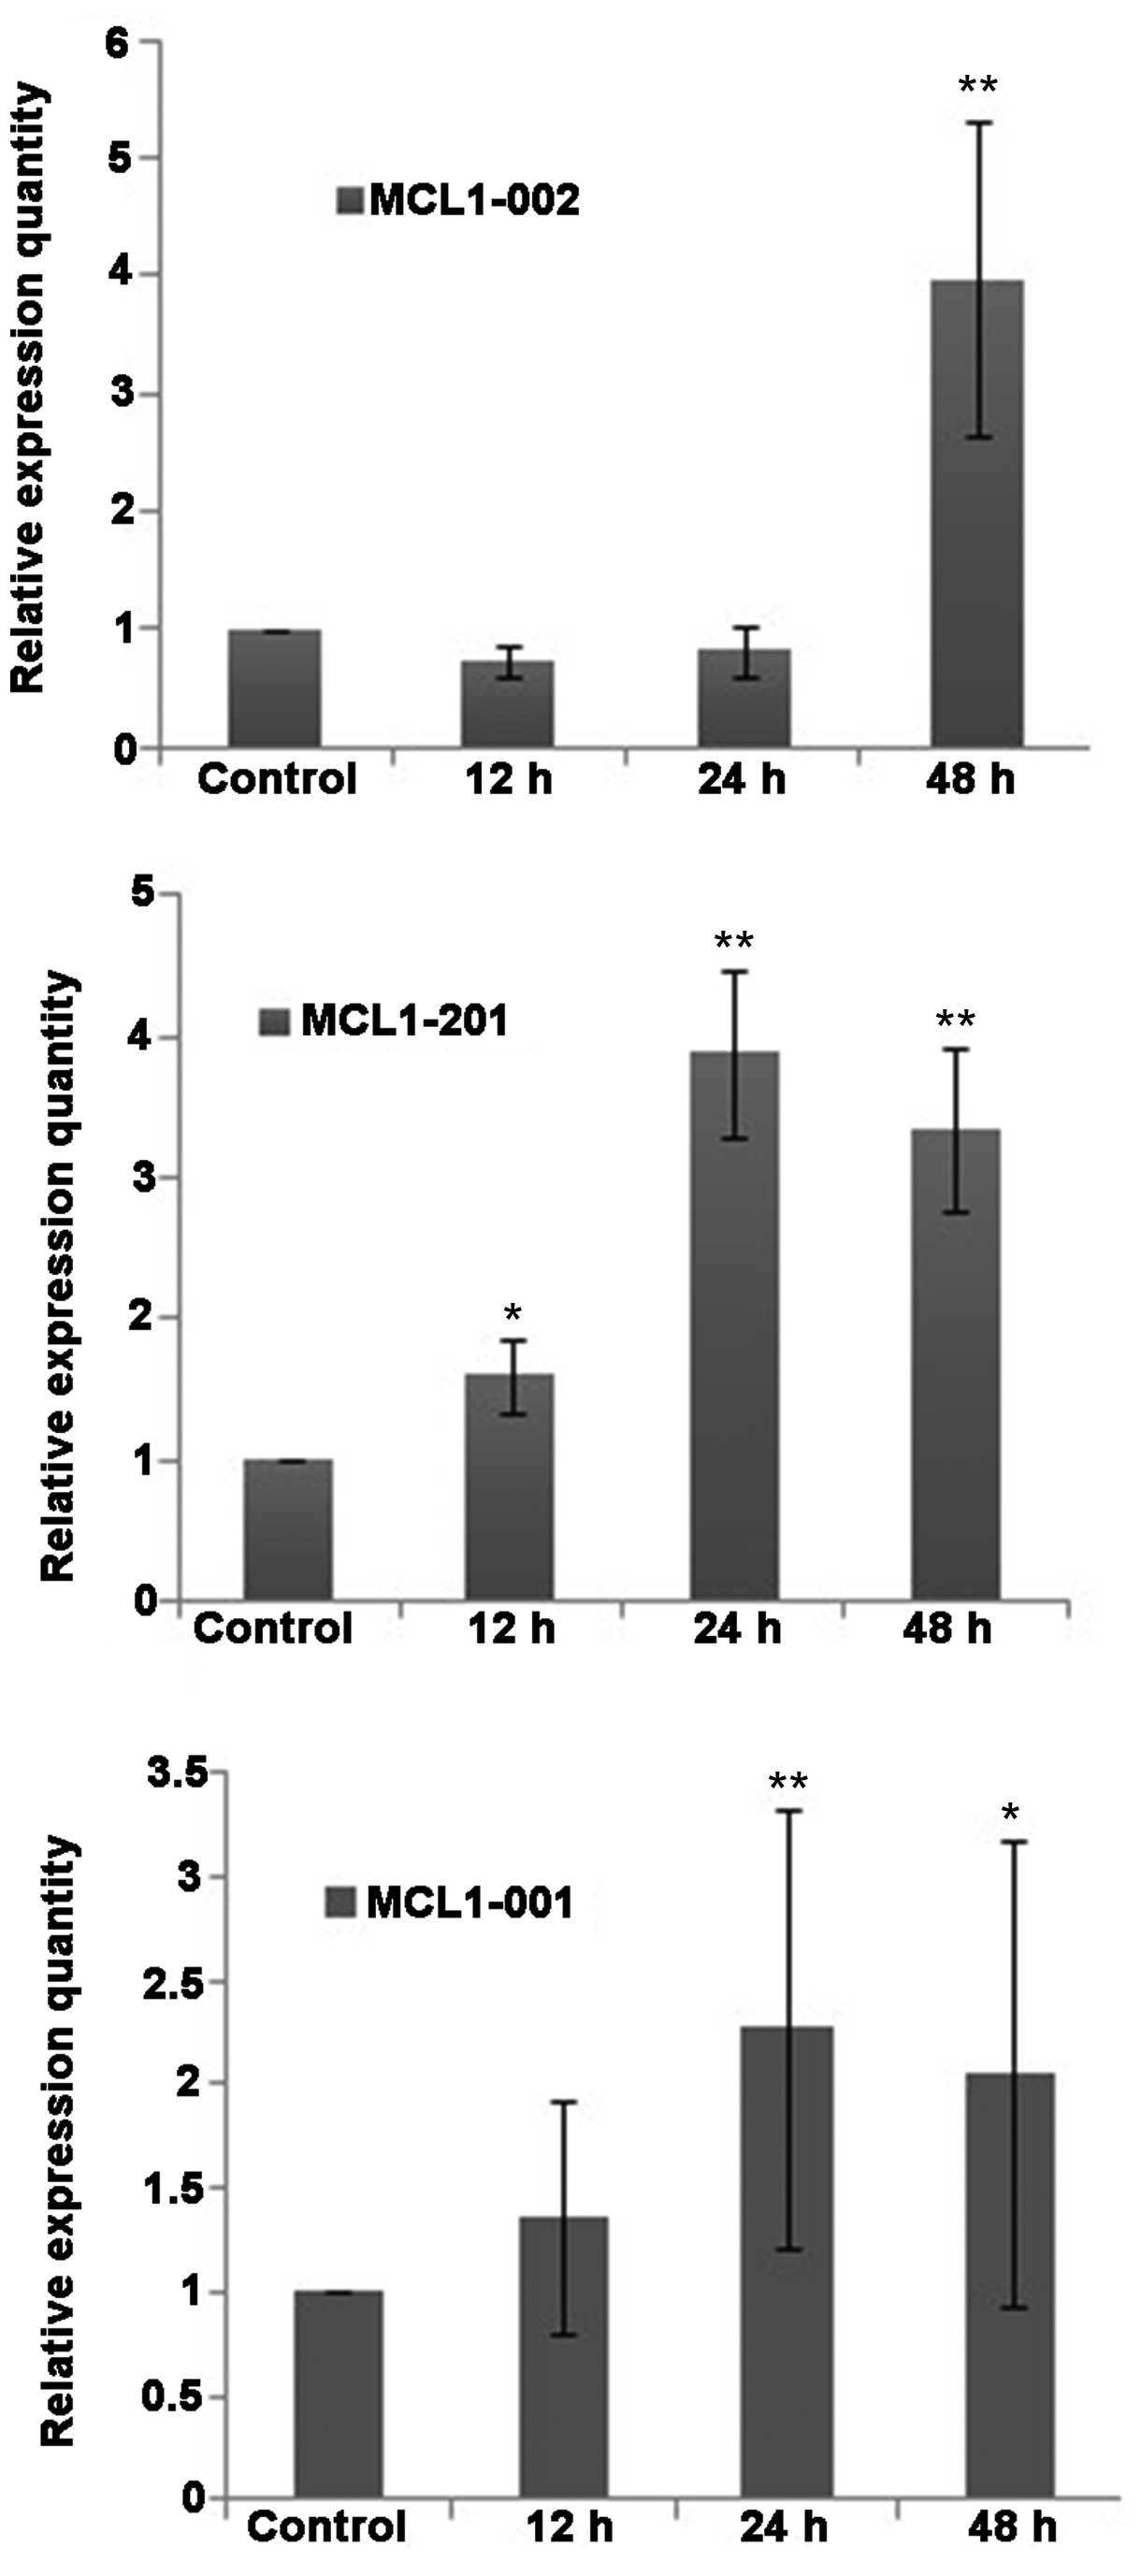
The effect of DHA treatment on the
expression of MCL-1 mRNA and protein in QBC939 cells
Fluorescence-based qPCR analysis demonstrated that
the mRNA transcripts of the apoptosis-associated protein MCL-1 were
expressed in QBC939 cells at various levels (Fig. 6). Compared with the control group, the
expression of the MCL1-001 transcript was slightly increased
in the DHA groups, whereas the expression of MCL1-002 and
MCL1-201 was increased. No statistically significant
differences were detected in the relative expression level
(2ΔΔCt) of MCL1-002 between the DHA group and the
control group at 12 and 24 h. However, the relative expression of
MCL1-002 was significantly increased following 48 h of
treatment (P<0.01). The expression levels of the mRNAs
MCL1-001 and MCL1-201 increased slightly following 12
h of DHA treatment, and were significantly increased following 24
and 48 h of DHA treatment (P<0.01; Fig. 6).
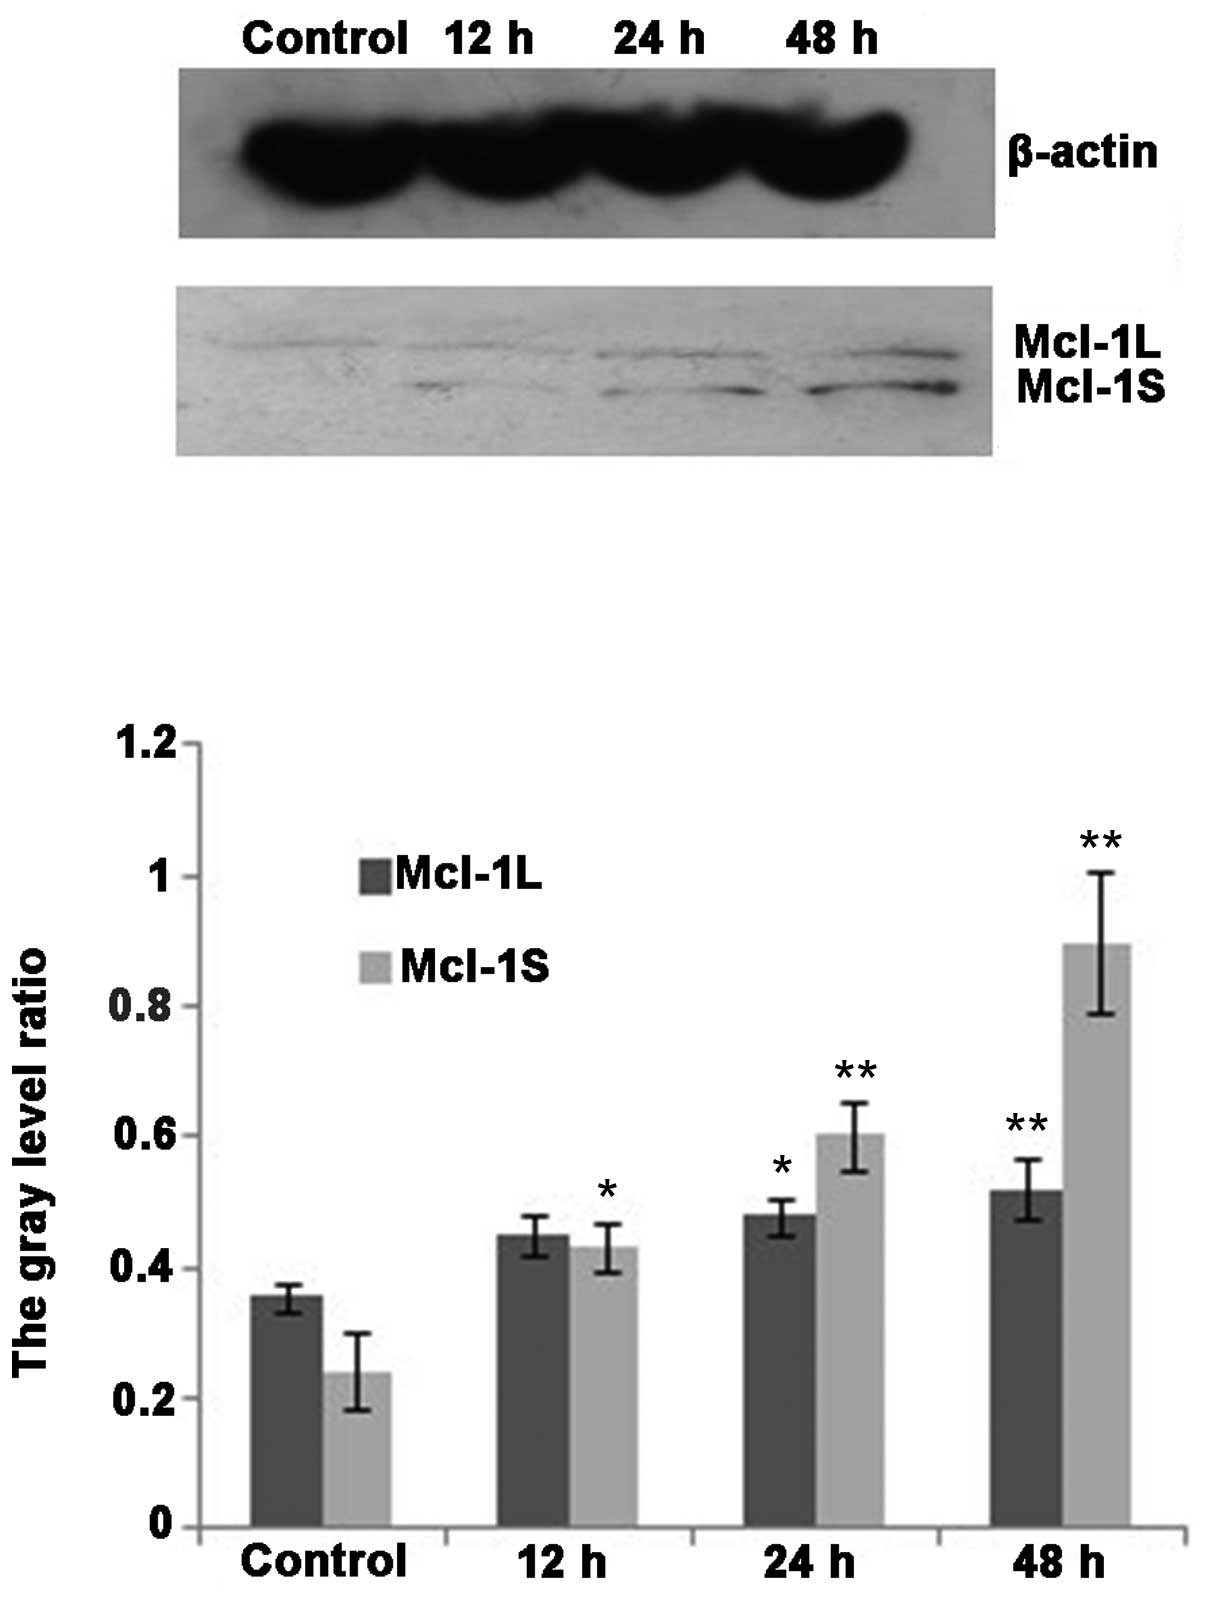
Western blot analysis demonstrated that MCL-1L and
MCL-1S protein variants were expressed in the cholangiocarcinoma
cell line QBC939 (Fig. 7). The
expression of MCL-1L protein increased following DHA treatment
(P<0.05). The expression of MCL-1S protein was markedly
increased following DHA treatment for 12 h, and significantly
increased following 24 and 48 h treatment (P<0.01; Fig. 7).
Discussion
The present study demonstrated that the treatment of
QBC939 cells with various concentrations of DHA resulted in varying
degrees of proliferative activity impairment. As the concentration
of DHA increased, the proliferation inhibitory rate increased
correspondingly. In addition, the proliferative activity of QBC939
cells was negatively correlated with the duration of DHA treatment.
DHA exhibited a significant inhibitory effect on the proliferation
of QBC939 cholangiocarcinoma cells cultured in vitro, and
the IC50 changed significantly with treatment time.
Therefore the experimental results demonstrated that DHA treatment
significantly inhibited the proliferation of QBC939 cells and that
the inhibitory effects of DHA on cell proliferation were dose- and
time-dependent.
In cells undergoing apoptosis, DNA is cleaved by
endogenous endonucleases at the internucleosomal linker sites
between the nucleosomes into oligonucleotide fragments of integer
multiples of 180–200 bp (12).
Agarose gel electrophoresis demonstrated the DNA ladder pattern
characteristic of apoptosis following DHA treatment of QBC939 cells
for a duration of at least 24 h. DNA ladder formation is closely
associated with apoptosis and has been used as one of the most
important criteria for the detection of apoptosis. The detection of
DNA laddering by agarose gel electrophoresis demonstrated that DHA
treatment inhibited QBC939 cell proliferation through the induction
of apoptosis. In addition, FCM analysis demonstrated that prolonged
duration of DHA treatment was associated with an increased
percentage of apoptotic QBC939 cells. The FCM results further
confirmed the apoptosis-promoting effect of DHA on QBC939 cells and
indicated that the effect was dose-dependent. FCM analysis also
demonstrated that the majority of DHA-treated cells arrested in the
S phase of the cell cycle. The results indicated that DHA blocked
genomic DNA synthesis, thereby inhibiting cell division and
proliferation and promoting apoptosis.
The anti-apoptotic gene MCL-1 is a member of
the B-cell lymphoma 2 (BCL-2) family of apoptosis-regulating genes.
The MCL-1 protein shares sequence and functional similarities with
the BCL-2 protein and is important in the process of apoptosis.
MCL-1 pre-mRNA undergoes alternative splicing to produce the
short splice isoform MCL-1S. The unspliced, longest gene
product of MCL-1 is referred to as MCL-1L. A total of
4 transcript variants of MCL-1 gene have been identified,
which are referred to as MCL1-001, −002, −003 and −201.
MCL1-003 does not encode any protein. MCL1-001
encodes the MCL-1L protein. MCL1-002 and MCL1-201
encode the MCL-1S protein. In tumor cells cultured under normal
conditions, MCL-1L protein is expressed at a much higher level than
the MCL-1S protein. MCL-1L is usually referred to as MCL-1.
Although the MCL-1L and MCL-1S proteins are encoded by the same
gene, the two proteins exhibit opposite activities. MCL-1L inhibits
apoptosis, whereas MCL-1S promotes apoptosis. Therefore, the ratio
of MCL-1L/MCL-1S in cells expressing the MCL-1 gene
determines the fate of the cells (13–15).
Cholangiocarcinoma cells express high levels of the anti-apoptotic
protein MCL-1L, indicating that cholangiocarcinoma tumorigenesis is
closely associated with the dysregulation of MCL-1 expression
(16). The findings of the present
study provide valuable information for cholangiocarcinoma research
and for the diagnosis and treatment of cholangiocarcinoma. Compared
with normal cells, cholangiocarcinoma cells express abnormally high
levels of MCL-1 protein, indicating that cholangiocarcinoma
tumorigenesis is closely associated with the dysregulation of MCL-1
expression. In the present study, it was demonstrated that DHA
inhibited the proliferation and promoted apoptosis of QBC939
cholangiocarcinoma cells. Following DHA treatment, QBC939 cells
exhibited significantly increased apoptotic activity; therefore DHA
may induce apoptosis in QBC939 cells through the regulation of
MCL-1 protein expression. Western blot analysis was performed to
examine the expression of MCL-1 proteins. The results demonstrated
that compared with the control group, DHA treatment significantly
increased the expression of MCL-1S protein and increased the ratio
of MCL-1S/MCL-1L in QBC939 cells in the experimental groups.
In summary, the present study demonstrated that DHA
promoted apoptosis in QBC939 cholangiocarcinoma cells. In addition,
the present study demonstrated that DHA induced apoptosis in QBC939
cells through the upregulation of the expression of the
pro-apoptotic protein MCL-1S. These results provide a basis for the
development of effective treatments for cholangiocarcinoma.
References
|
1
|
Mosconi S, Beretta GD, Labianca R, et al:
Cholangiocarcinoma. Crit Rev Oncol Hematol. 69:259–270. 2009.
View Article : Google Scholar : PubMed/NCBI
|
|
2
|
Esposito I and Schirmacher P: Pathological
aspects of cholangiocarcinoma. HPB (Oxford). 10:83–86. 2008.
View Article : Google Scholar : PubMed/NCBI
|
|
3
|
Parkin DM, Ohshima H, Srivatanakul P and
Vatanasapt V: Cholangiocarcinoma: epidemiology, mechanisms of
carcinogenesis and prevention. Cancer Epidemiol Biomarkers Prev.
2:537–544. 1993.PubMed/NCBI
|
|
4
|
Mosconi S, Beretta GD, Labianca R, Zampino
MG, Gatta G and Heinemann V: Cholangiocarcinoma. Crit Rev Oncol
Hematol. 69:259–270. 2009. View Article : Google Scholar : PubMed/NCBI
|
|
5
|
Khan SA, Toledano MB and Taylor-Robinson
SD: Epidemiology, risk factors and pathogenesis of
cholangiocarcinoma. HPB (Oxford). 10:77–82. 2008. View Article : Google Scholar : PubMed/NCBI
|
|
6
|
Eckstein-Ludwig U, Webb RJ, Van Goethem
ID, East JM, Lee AG, Kimura M, O'Neill PM, Bray PG, Ward SA and
Krishna S: Artemisinins target the SERCA of Plasmodium falciparum.
Nature. 424:957–961. 2003. View Article : Google Scholar : PubMed/NCBI
|
|
7
|
Lee S: Artemisinin, promising lead natural
product for various drug developments. Mini Rev Med Chem.
7:411–422. 2007. View Article : Google Scholar : PubMed/NCBI
|
|
8
|
Chen H, Sun B, Pan S, Jiang H and Sun X:
Dihydroartemisinin inhibits growth of pancreatic cancer cells in
vitro and in vivo. Anticancer Drugs. 20:131–140. 2009. View Article : Google Scholar : PubMed/NCBI
|
|
9
|
Lu YY, Chen TS, Qu JL, Pan WL, Sun L and
Wei XB: Dihydroartemisinin (DHA) induces caspase-3-dependent
apoptosis in human lung adenocarcinoma ASTC-a-1cells. J Biomed Sci.
16:162009. View Article : Google Scholar : PubMed/NCBI
|
|
10
|
Gao XL: Mechanism and characteristic of
artemisinins against cancer. J Int Oncol. 34:417–419. 2007.
|
|
11
|
Xie Hong, Chen Lijun, Yao Li, Jin QY and
Hu WL: Human tumor cells apoptosis induced by dihydroartemisinin
and its molecular mechanism. China Pharmacy. 18:1850–1852. 2007.(In
Chinese).
|
|
12
|
Chapman RS, Chresta CM, Herberg AA, Beere
HM, Heer S, Whetton AD, Hickman JA and Dive C: Further
characterisation of the in situ terminal deoxynucleotidyl
transferase (TdT) assay for the flow cytometric analysis of
apoptosis in drug resistant and drug sensitive leukaemic cells.
Cytometry. 20:245–256. 1995. View Article : Google Scholar : PubMed/NCBI
|
|
13
|
Scholzová E, Malík R, Sevcík J and Kleibl
Z: RNA regulation and cancer development. Cancer Lett. 246:12–23.
2007. View Article : Google Scholar : PubMed/NCBI
|
|
14
|
Weng C, Li Y, Xu D, Shi Y and Tang H:
Specific cleavage of Mcl-1 by caspase-3 in tumor necrosis
factorrelated apoptosis-inducing ligand (TRAIL)-induced apoptosis
in Jurkat leukemia T cells. J Biol Chem. 280:10491–10500. 2005.
View Article : Google Scholar : PubMed/NCBI
|
|
15
|
Inoue S, Walewska R, Dyer MJ and Cohen GM:
Down regulation of Mcl-1 potentiates HDACi-mediated apoptosis in
leukemic cells. Leukemia. 22:819–825. 2008. View Article : Google Scholar : PubMed/NCBI
|
|
16
|
Chen S, Dai Y, Pei XY and Grant S: Bim
upregulation by histone deacetylase inhibitors mediates
interactions with the Bcl-2 antagonist ABT-737: Evidence for
distinct roles for Bcl-2, Bcl-xL and Mcl-1. Mol Cell Biol.
29:6149–6169. 2009. View Article : Google Scholar : PubMed/NCBI
|