Introduction
Gallbladder cancer (GBC) is the most common
malignancy of the biliary tract. The major subtype of GBC is
adenocarcinoma (AC), which accounts for >90% of GBC cases
(1), while squamous
cell/adenosquamous carcinoma (SC/ASC) is a rare subtype, comprising
1.4–10.4% of GBC cases (2). Notably,
the 5-year survival of patients with GBC involving these two
subtypes is extremely low. Their nonspecific symptomatology results
in advanced disease at the time of presentation, contributing to
poor prognosis and decreased survival (2). Thus, it is urgent to identify biomarkers
for the diagnosis and prognosis of this disease. However, the
genetic and molecular alterations in GBC are still poorly
understood. In addition, its rarity renders the collection of large
sample cohorts difficult.
Thymus cell antigen 1 (Thy1), also known as cluster
of differentiation (CD)90, is a 25-37-kDa
glycophosphatidylinositol-anchored protein that is expressed in
numerous cell types, including T cells, neurons, endothelial cells,
fibroblasts and numerous tumor cells. Functioning as an important
regulator of cell-cell and cell-matrix interactions (3), Thy1 has also been proposed to be an
important molecule in cancer. It is overexpressed during prostate
cancer progression (4). In
hepatocellular carcinoma, increased Thy1 expression is associated
with the presence of cancer (5). It
is noteworthy that Thy1 tends to be expressed in poorly
differentiated hepatocellular carcinoma and is associated with poor
prognosis (6,7). Consistent with this, male patients with
Thy1-positive breast cancer have significantly poorer survival than
those with Thy1-negative expression (8). In addition, Thy1 promotes migration and
metastasis in melanoma (9). Notably,
it has been suggested that Thy1 has opposite functions in ovarian
(10) and nasopharyngeal cancer
(11), where it functions as a tumor
suppressor. Nonetheless, the significance of Thy1 in the context of
GBC remains undetermined.
Integrin α6 (ITGA6), also known as CD49f, is a
150-kDa transmembrane protein. It associates with integrin β1 chain
(or CD29) to form very late antigen-6, and with integrin β4 chain
(or CD104) to form the α6β4 complex, both of which are important
laminin receptors (12). Laminin
receptors are essential for cell-matrix adhesion and cell-cell
interactions. These activate intracellular signaling pathways
involved in the regulation of various cellular processes, including
cytoskeletal arrangement, growth factor signaling and gene
transcription (13). An emerging
consensus is that ITGA6 dysregulation is associated with
malignancy. An increasing number of studies have revealed that
ITGA6 is abnormally expressed in numerous tumors, including breast
cancer, lung cancer and liver cancer (14,15). In
the majority of these studies, ITGA6 overexpression was
significantly associated with tumor cell metastasis and invasion,
thus implicating its involvement in tumor progression (14,15).
However, no studies have addressed the role of ITGA6 in GBC.
It is worth noting that Thy1 and ITGA6 are putative
markers of various cancer stem cells (CSCs) (6,16–19). The proliferation and differentiation
of CSCs are dysregulated, and they share characteristics necessary
for inducing both tumorigenesis and metastasis. CSCs comprise ~1–5%
of all tumor cells. They are self-renewing and can develop into
different cell types to form tumors again, even when the majority
of tumor cells have been eliminated (20). Therefore, efficient biomarkers are
vital for identifying CSCs. Although the CSC theory is still
controversial, CSCs have been identified in multiple solid tumors,
including breast cancer (21),
hepatocellular carcinoma (22),
glioma (16), prostate cancer
(4), colorectal cancer (23) and pancreatic cancer (24). However, whether there are CSCs in GBC
is not clear. In the present study, the expression of the promising
CSC markers Thy1 and ITGA6 was evaluated in 46 SC/ASC and 80 AC
patients using reverse transcription-quantitative polymerase chain
reaction (RT-qPCR) and immunohistochemical analyses, and Thy1 and
ITGA6 expression was correlated with the clinical outcome and
prognosis of the patients.
Materials and methods
Patients and tissue specimens
A total of 126 GBC (46 SC/ASC and 80 AC) samples and
paired non-tumor tissue samples were obtained from patients that
underwent surgical resection or biopsy between January 1995 and
December 2009. The present study was approved by the Central South
University Ethics Committee for Human Research from Xiangya
Hospital (Changsha, China), The Second Xiangya Hospital (Changsha,
China), The Third Xiangya Hospital (Changsha, China), Hunan
Provincial People Hospital (Changsha, China), Hunan Provincial
Tumor Hospital (Changsha, China), Changde Central Hospital and
Loudi Central Hospital (Loudi, China). Written informed consent was
obtained from the patients. All samples were confirmed
pathologically. The histological grade of GBC was based on the
World Health Organization grading system (25). Tumor stage was based on the
pathological tumor-node-metastasis (TNM) staging system of the
American Joint Committee on Cancer (26). Surgical procedure determination was
mainly based on TNM staging of GBC and patients condition. Radical
surgery included simple cholecystectomy and cholecystectomy
involving a wedge resection of the gallbladder fossa with 2 cm
non-neoplastic liver tissue. Resection of a suprapancreatic segment
of the extrahepatic bile duct and extended portal lymph node
dissection could also be considered based on the patient's
condition. Palliative surgery was cholecystectomy with biliary
drainage. Patients not suitable for surgical resection underwent
surgical biopsy. The clinicopathological data are summarized in
Table I. Survival information of all
patients was obtained through letters and phone calls. The
follow-up time was 2 years. Patients that survived longer than 2
years were included in the analysis as censored cases.
 | Table I.Clinicopathological characteristics
of GBC samples. |
Table I.
Clinicopathological characteristics
of GBC samples.
| Clinicopathological
characteristics | SC/ASC, no.
(%) | AC, no. (%) |
|---|
| Gender |
|
|
|
Male | 19 (41.3) | 26 (32.5) |
|
Female | 27 (58.7) | 54 (67.5) |
| Age, years |
|
|
|
≤45 | 3 (6.5) | 16 (20.0) |
|
>45 | 43 (93.5) | 64 (80.0) |
|
Differentiation |
|
|
|
Well | 16 (34.8) | 27 (33.8) |
|
Moderately | 24 (52.2) | 25 (31.3) |
|
Poorly | 6 (13.0) | 28 (35.0) |
| Maximum diameter of
tumor, cm |
|
|
| ≤3 | 20 (43.5) | 50 (62.5) |
|
>3 | 26 (56.5) | 30 (37.5) |
|
Cholecystolithiasis |
|
|
|
(−) | 18 (39.1) | 42 (52.5) |
|
(+) | 28 (60.9) | 38 (47.5) |
| TNM stage |
|
|
|
I+II | 12 (26.1) | 21 (26.3) |
|
III | 20 (33.5) | 38 (47.5) |
| IV | 14 (30.4) | 21 (26.3) |
| Lymph node
metastasis |
|
|
|
(−) | 17 (37.0) | 30 (37.5) |
|
(+) | 29 (63.0) | 50 (62.5) |
| Locoregional
invasion |
|
|
|
(−) | 16 (34.8) | 31 (38.8) |
|
(+) | 30 (62.5) | 49 (61.3) |
| Surgical
method |
|
|
|
Radical | 14 (30.4) | 26 (32.5) |
|
Palliative | 18 (39.1) | 28 (35.0) |
|
Biopsy | 14 (30.4) | 26 (32.5) |
RNA isolation and RT-qPCR
Total RNA was isolated from fresh frozen tissues
using TRIzol (Invitrogen; Thermo Fisher Scientific, Inc., Waltham,
MA, USA) according to the manufacturer's protocol, and was
quantified using a NanoDrop spectrophotometer (NanoDrop
Technologies; Thermo Fisher Scientific, Inc., Wilmington, DE, USA).
Complementary DNA (cDNA) was synthesized using a cDNA synthesis kit
(Fermentas; Thermo Fisher Scientific, Inc., Pittsburgh, PA, USA).
RT-qPCR was performed using SYBR PCR Green Master Mix (Applied
Biosystems; Thermo Fisher Scientific, Inc.) in an ABI 7300
Real-Time PCR System (Applied Biosystems; Thermo Fisher Scientific,
Inc.) according to the manufacturer's protocol. RT-qPCR was
initiated by incubation for 30 sec at 95°C, followed by 40 cycles
of 95°C for 10 sec and 60°C for 30 sec, and a final dissociation
stage of 95°C for 15 sec, 60°C for 1 min and 95°C for 15 sec.
Analysis of gene relative quantification was performed using the
2−ΔΔCq method (27). For
each gene, RT-qPCR was performed on each sample in triplicate.
Transcript levels were normalized using hydroxymethylbilane
synthase (HMBS) RNA quantification. The RT-qPCR results were
analyzed with SigmaStat software version 3.1 (SPSS, Inc., Chicago,
IL, USA). The primers for Thy1 were as follows: Forward (F),
5′-CACCACTCTGGCCATTCC-3′ and reverse (R),
5′-CTCACACTTGACCAGTTTGTCTCT-3′. The primers for ITGA6 were as
follows: F, 5′-CACATCTCCTCCCTGAGCAC-3′ and R,
5′-TATCTTGCCACCCATCCTTG-3′. The primers for HMBS were as follows:
F, 5′-AGCTATGAAGGATGGGCAAC-3′ and R,
5′-TTGTATGCTATCTGAGCCGTCTA-3′.
Immunohistochemistry
Rabbit anti-Thy1 antibody (HPA003733) and rabbit
anti-ITGA6 antibody (HPA012696) were purchased from Sigma-Aldrich
(Merck Millipore, Darmstadt, Germany). Staining was conducted using
the peroxidase-based EnVision™ Detection System (Dako North
America, Inc., Carpinteria, CA, USA) according to the
manufacturer's protocol. Briefly, formalin-fixed, paraffin-embedded
SC/ASC and AC tissue sections (4-µm thick) on poly-L-lysine-coated
slides were deparaffinized and incubated with 3%
H2O2 for 10 min. Next, the sections were
soaked with PBS for 5 min thrice. After 50-min incubation with the
primary antibody (1:200 rabbit anti-Thy1 or 1:200 rabbit
anti-ITGA6) at room temperature, the samples were incubated with a
goat anti-rabbit secondary antibody conjugated with a horseradish
peroxidase polymer (1:500; ab6721; Abcam, Cambridge, UK) at room
temperature for 30 min, and then developed with
H2O2 and 3,3′-diaminobenzidine
(DakoCytomation; Dako, Glostrup, Denmark). Hematoxylin was used as
a counterstain. Positive controls were positive sections purchased
from Fuzhou Maixin Biotech Co., Ltd. (Fuzhou, China). The negative
control was designed by replacing the primary antibody with 5%
fetal bovine serum (Gibco; Thermo Fisher Scientific, Inc.). The
percentage of positive cells was calculated from 500 cells in 10
random fields. Cases with ≥25% positive cells were considered
positive, while those with <25% positive cells were considered
negative.
Statistics
Data were analyzed using SPSS 14.0 software (SPSS,
Inc.). Paired Student's t-test was used to compare the
messenger RNA (mRNA) levels between the tumor and non-tumor
samples. The association of Thy1 or ITGA6 expression with
histological or clinical factors was analyzed using the
χ2 or Fisher's exact tests. Kaplan-Meier and time series
tests (log-rank test) were used for univariate survival analysis.
The Cox proportional hazards model was used for multivariate
analysis and for determining the 95% confidence interval. P≤0.05
was considered to indicate a statistically significant
difference.
Results
THY1 and ITGA6 mRNA levels in clinical
tissue samples
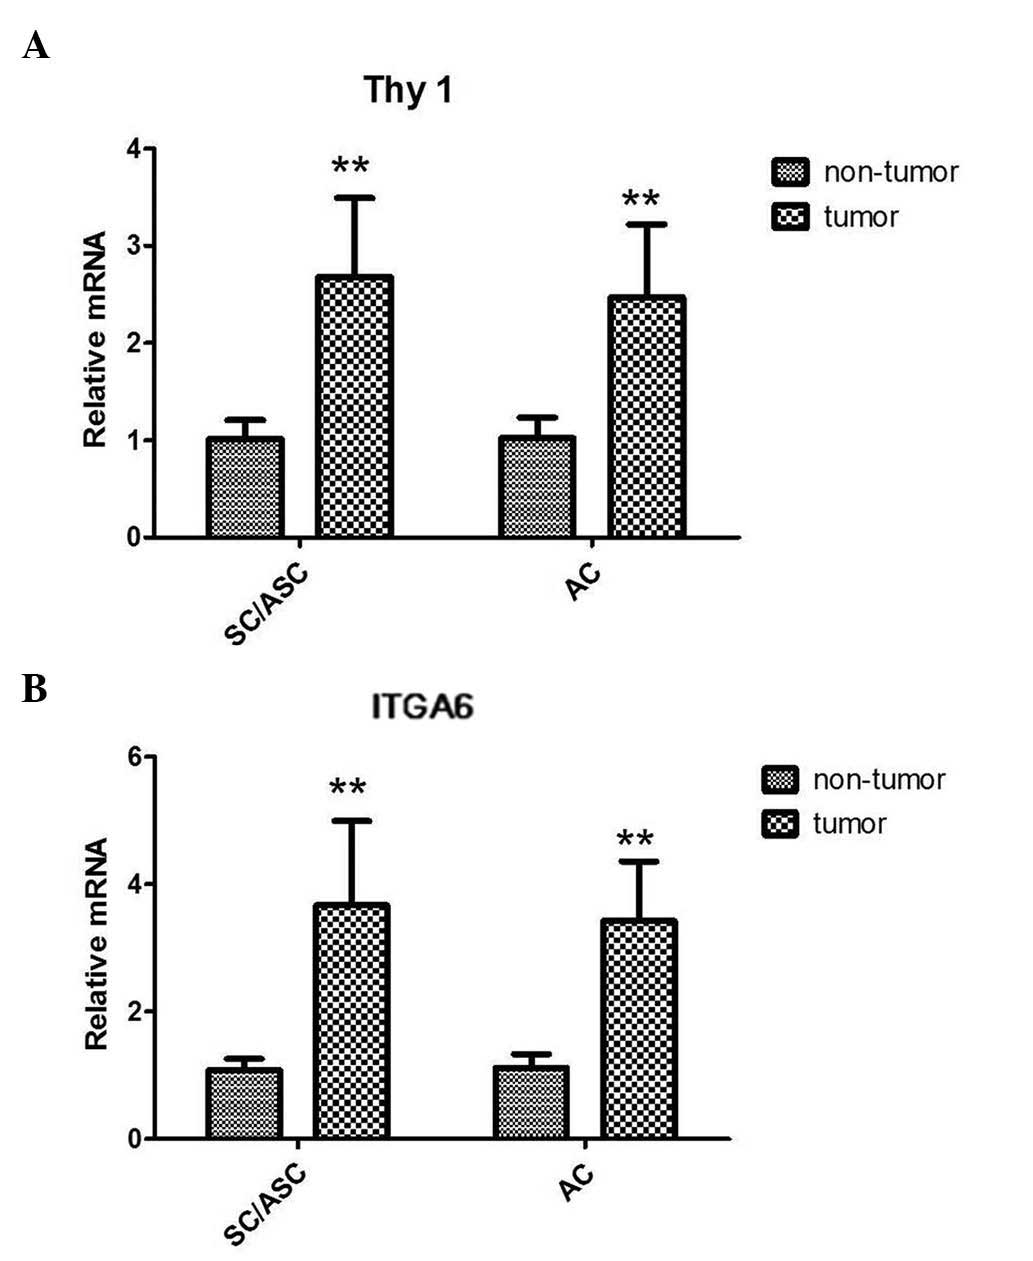
RT-qPCR analyses of the SC/ASC and AC tissues
demonstrated that both the Thy1 and ITGA6 mRNA levels were higher
in tumor tissues than in the corresponding non-tumor tissues. The
results demonstrated that there was a 2.6-fold upregulation in
SC/ASC and a 2.4-fold upregulation in AC of Thy1 mRNA expression
compared with the corresponding non-tumor tissues (both P<0.001;
Fig. 1A). Furthermore, ITGA6 mRNA
levels were increased by ~3.5-fold and 3.2-fold in SC/ASC and AC
tissues, respectively (both P<0.001; Fig. 1B). However, no significant differences
in Thy1 or ITGA6 mRNA levels were observed between SC/ASC and AC
tissues.
Evaluation of Thy1 and ITGA6
expression using immunohistochemical staining
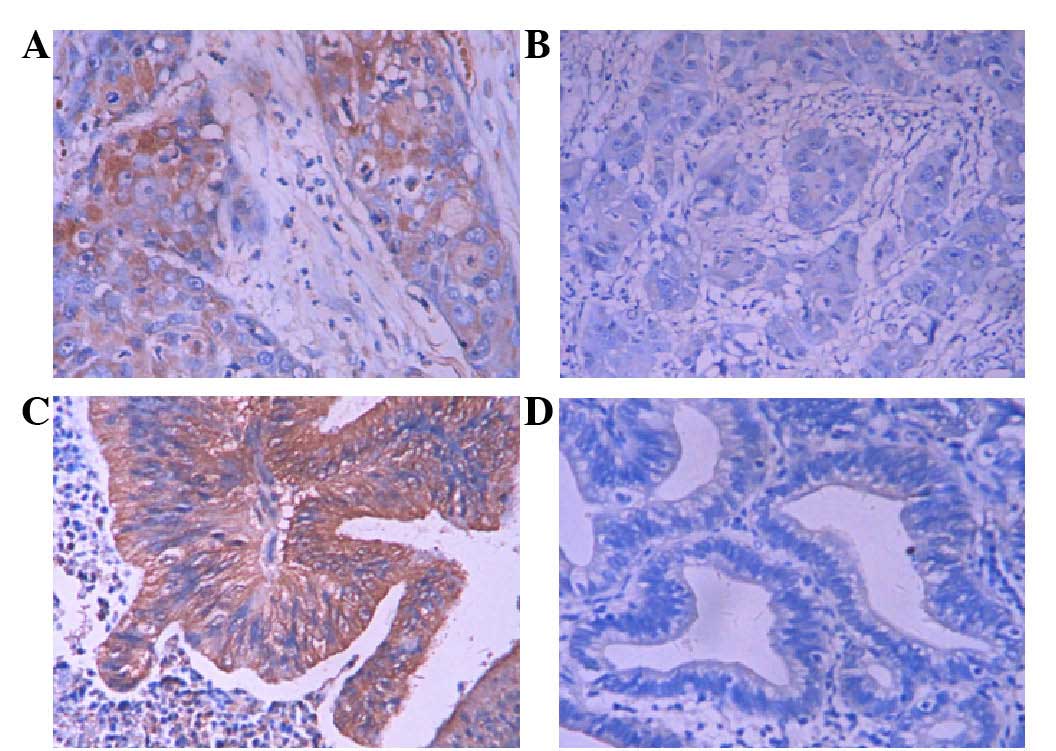
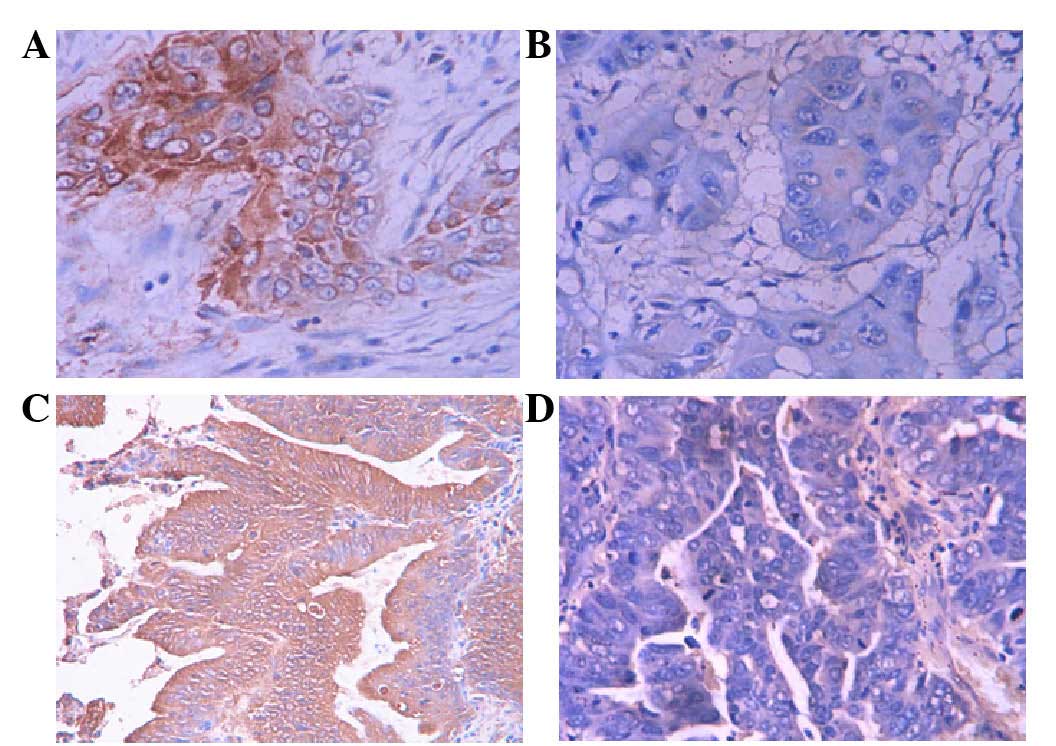
Immunohistochemical staining revealed that Thy1 and
ITGA6 positive staining was mainly localized in the cytoplasm of
GBC cells at different expression levels in different samples,
while the majority of the non-tumor samples had negative staining
(Figs. 2 and 3). The percentages of positive Thy1 and
ITGA6 expression in SC/ASC and AC samples were similar (Table II).
| Table II.Percentage of positive Thy1 and ITGA6
expression in SC/ASC and AC. |
Table II.
Percentage of positive Thy1 and ITGA6
expression in SC/ASC and AC.
| Protein | SC/ASC, no.
(%) | AC, no. (%) | χ2 | P-value |
|---|
| Thy1 |
|
| 0.040 | 0.891 |
|
(−) | 17 (37.0) | 31 (38.7) |
|
|
|
(+) | 29 (63.0) | 49 (61.3) |
|
|
| ITGA6 |
|
| 0.093 | 0.753 |
|
(−) | 16 (34.8) | 30 (37.5) |
|
|
|
(+) | 30 (65.2) | 50 (62.5) |
|
|
Association of Thy1 and ITGA6
expression with clinicopathological characteristics of GBC
To understand the significance of Thy1 and ITGA6
expression in GBC, the correlation of their protein levels with the
major clinicopathological variables of the patients was evaluated.
As shown in Table III, the
percentages of positive Thy1 and ITGA6 expression were much higher
in SC/ASC cases with poor differentiation, large tumor size, lymph
node metastasis and great invasiveness, and those who had undergone
only biopsy, compared with cases with good differentiation, small
tumor mass, no lymph node metastasis and no invasion, and those who
had undergone radical resection (Thy1, P=0.045, P=0.005, P=0.003
and P=0.009 and P=0.032, respectively, and ITGA6, P=0.029, P=0.011,
P=0.009, P=0.004 and P=0.017, respectively). Thy1 and ITGA6
exhibited no significant association with pathological type or
history of gallstones. There was higher Thy1 and ITGA6 expression
in SC/ASC with advanced TNM stage than in SC/ASC with low TNM
stage, although the differences were not statistically significant
(both P=0.056).
| Table III.Association of Thy1 and ITGA6
expression with the clinicopathological characteristics of
SC/ASC. |
Table III.
Association of Thy1 and ITGA6
expression with the clinicopathological characteristics of
SC/ASC.
|
|
| Thy1 | ITGA6 |
|---|
|
|
|
|
|
|---|
| Clinicopathological
characteristics | Total no. | Pos, no. (%) |
χ2 | P-value | Pos, no. (%) |
χ2 | P-value |
|---|
| Pathological
type |
|
| 0.735 | 0.391 |
| 0.001 | 0.978 |
| SC | 26 | 15 (57.5) |
|
| 17 (65.4) |
|
|
|
ASC | 20 | 14 (70.0) |
|
| 13 (65.0) |
|
|
|
Differentiation |
|
| 6.209 | 0.045 |
| 6.785 | 0.029 |
|
Well | 16 | 7 (43.8) |
|
| 7 (43.8) |
|
|
|
Moderately | 24 | 16 (66.7) |
|
| 17 (70.8) |
|
|
|
Poorly | 6 | 6 (100.0) |
|
| 6 (100.0) |
|
|
| Maximum
diameter |
|
| 8.065 | 0.005 |
| 6.376 | 0.011 |
| of tumor, cm |
| ≤3 | 20 | 8 (40.0) |
|
| 9 (45.0) |
|
|
|
>3 | 26 | 21 (80.8) |
|
| 21 (80.8) |
|
|
| Gallstones |
|
| 0.167 | 0.683 |
| 0.027 | 0.869 |
|
(−) | 18 | 12 (66.7) |
|
| 12 (66.7) |
|
|
|
(+) | 28 | 17 (60.7) |
|
| 18 (64.3) |
|
|
| TNM stage |
|
| 5.520 | 0.056 |
| 5.566 | 0.056 |
|
I+II | 12 | 5 (41.7) |
|
| 5 (41.7) |
|
|
|
III | 20 | 12 (60.0) |
|
| 13 (65.0) |
|
|
| IV | 14 | 12 (85.7) |
|
| 12 (85.7) |
|
|
| Lymph
metastasis |
|
| 8.912 | 0.003 |
| 6.870 | 0.009 |
|
(−) | 17 | 6 (35.3) |
|
| 7 (41.2) |
|
|
|
(+) | 29 | 23 (79.3) |
|
| 23 (79.3) |
|
|
| Invasion |
|
| 6.870 | 0.009 |
| 8.309 | 0.004 |
|
(−) | 16 | 6 (37.5) |
|
| 6 (37.5) |
|
|
|
(+) | 30 | 23 (76.7) |
|
| 24 (80.0) |
|
|
| Surgery |
|
| 6.587 | 0.032 |
| 8.354 | 0.017 |
|
Radical | 14 | 5 (35.7) |
|
| 5 (35.7) |
|
|
|
Palliative | 18 | 13 (72.2) |
|
| 13 (72.2) |
|
|
|
Biopsy | 14 | 11 (78.6) |
|
| 12 (85.7) |
|
|
There was significantly higher Thy1 and ITGA6
expression in AC cases with poor differentiation, large tumor size,
advanced TNM stage, lymph node metastasis and great invasiveness,
and those who had undergone only biopsy than in AC cases with good
differentiation, small tumor mass, low TNM stage, no lymph node
metastasis and no invasion, and those who had undergone radical
resection (Thy1, P=0.027, P<0.001, P=0.001, P=0.003, P=0.004 and
P=0.002, respectively, and ITGA6, P=0.002, P=0.003, P=0.018,
P=0.006, P=0.006 and P=0.006, respectively; Table IV).
| Table IV.Association of Thy1 and ITGA6
expression with the clinicopathological characteristics of AC. |
Table IV.
Association of Thy1 and ITGA6
expression with the clinicopathological characteristics of AC.
|
|
| Thy1 | ITGA6 |
|---|
|
|
|
|
|
|---|
| Clinicopathological
characteristics | Total no. | Pos, no. (%) |
χ2 | P-value | Pos, no. (%) |
χ2 | P-value |
|---|
|
Differentiation |
|
| 7.225 | 0.027 |
| 12.401 | 0.002 |
|
Well | 27 | 11 (40.7) |
|
| 10 (37.0) |
|
|
|
Moderately | 25 | 18 (72.0) |
|
| 17 (68.0) |
|
|
|
Poorly | 28 | 20 (71.4) |
|
| 23 (82.1) |
|
|
| Maximum diameter of
tumor, cm |
|
| 13.065 | <0.001 |
| 8.889 | 0.003 |
| ≤3 | 50 | 23 (46.0) |
|
| 25 (50.0) |
|
|
|
>3 | 30 | 26 (86.7) |
|
| 25 (83.3) |
|
|
| Gallstones |
|
| 0.343 | 0.558 |
| 0.013 | 0.908 |
|
(−) | 42 | 27 (64.3) |
|
| 26 (61.9) |
|
|
|
(+) | 38 | 22 (57.9) |
|
| 24 (63.2) |
|
|
| TNM stage |
|
| 14.462 | 0.001 |
| 8.560 | 0.018 |
|
I+II | 21 | 7 (33.3) |
|
| 8 (38.1) |
|
|
|
III | 38 | 23 (60.5) |
|
| 25 (65.8) |
|
|
| IV | 21 | 19 (90.5) |
|
| 17 (80.1) |
|
|
| Lymph
metastasis |
|
| 9.132 | 0.003 |
| 10.368 | 0.006 |
|
(−) | 30 | 12 (40.0) |
|
| 12 (40.0) |
|
|
|
(+) | 50 | 37 (74.0) |
|
| 38 (76.0) |
|
|
| Invasion |
|
| 8.387 | 0.004 |
| 10.834 | 0.006 |
|
(−) | 31 | 12 (38.7) |
|
| 14 (45.2) |
|
|
|
(+) | 49 | 37 (75.5) |
|
| 37 (75.5) |
|
|
| Surgery |
|
| 12.456 | 0.002 |
| 10.376 | 0.006 |
|
Radical | 26 | 9 (34.6) |
|
| 10 (38.5) |
|
|
|
Palliative | 28 | 19 (67.9) |
|
| 19 (67.9) |
|
|
|
Biopsy | 26 | 21 (80.8) |
|
| 21 (80.8) |
|
|
Correlation between Thy1 and ITGA6
expression and prognosis of GBC
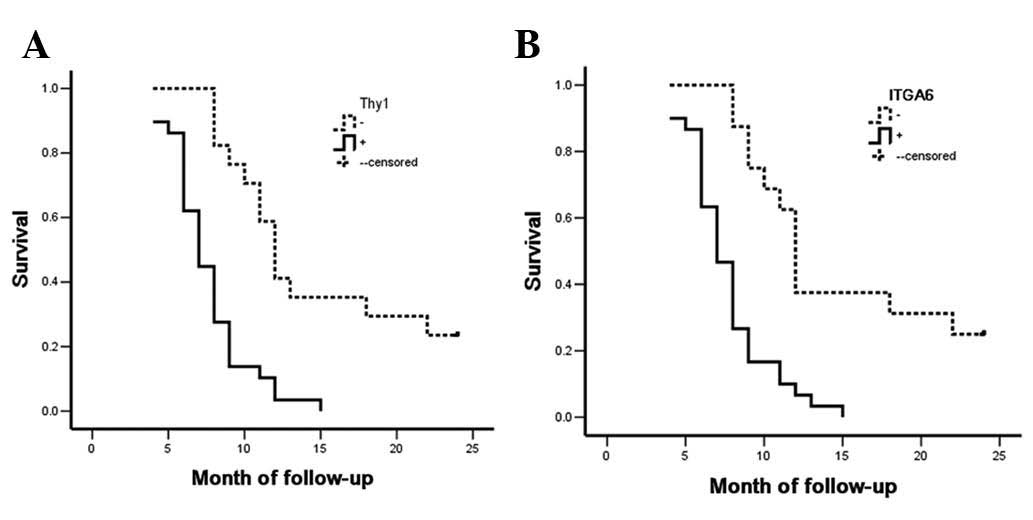
The Kaplan-Meier survival curves for the SC/ASC
patients were categorized according to their Thy1 or ITGA6
expression levels. Survival analysis revealed that the median
survival rate of Thy1-positive (P<0.001) and ITGA6-positive
(P=0.004) patients was significantly lower than that of patients
with Thy1- and ITGA6-negative tumors (Table V and Fig.
4). Cox multivariate analysis revealed that Thy1 and ITGA6
expression, as well as differentiation, tumor size, TNM stage,
invasion and surgical procedure, were negatively correlated with
postoperative survival but positively correlated with mortality,
suggesting that Thy1 and ITGA6 are independent risk factors for
poor survival in SC/ASC (P=0.001 and P=0.003, respectively;
Table VI).
| Table V.Association between Thy1 and ITGA6
expression and median survival rate of SC/ASC patients. |
Table V.
Association between Thy1 and ITGA6
expression and median survival rate of SC/ASC patients.
| Protein | Sample, no. | Median survival,
months (range) | χ2 | P-value |
|---|
| Thy1 |
|
| 15.006 | <0.001 |
|
(−) | 17 | 14.24 (6–24) |
|
|
|
(+) | 29 | 7.86 (4–15) |
|
|
| ITGA6 |
|
| 8.254 |
0.004 |
|
(−) | 18 | 13.33 (5–24) |
|
|
|
(+) | 28 | 8.21 (4–15) |
|
|
| Table VI.Multivariate Cox regression analysis
of survival rate in SC/ASC patients. |
Table VI.
Multivariate Cox regression analysis
of survival rate in SC/ASC patients.
|
| 95% CI |
|---|
|
|
|
|---|
| Groups | Factors | RC | SE | Wald | P-value | RR | Lower | Upper |
|---|
| Pathological
type | SC/ASC | 0.496 | 0.455 | 1.188 | 0.276 | 1.642 | 0.673 | 4.006 |
|
Differentiation | Well, moderately,
poorly | 1.067 | 0.472 | 5.110 | 0.024 | 2.907 | 1.152 | 7.331 |
| Tumor size, cm | ≤3, >3 | 2.312 | 0.637 | 13.173 | <0.001 | 10.095 | 2.869 | 35.181 |
| Gallstones | (−), (+) | 0.645 | 0.441 | 2.139 | 0.144 | 1.906 | 0.803 | 4.524 |
| TNM stage | I+II, III, IV | 1.194 | 0.426 | 7.856 | 0.005 | 3.300 | 1.432 | 7.606 |
| Lymph
metastasis | (−), (+) | 1.269 | 0.583 | 4.738 | 0.030 | 3.557 | 1.135 | 11.153 |
| Invasion | (−), (+) | 2.863 | 0.796 | 12.936 | <0.001 | 17.514 | 3.680 | 83.359 |
| Surgery | Radical,
palliative, biopsy | 1.071 | 0.484 | 4.897 | 0.027 | 2.918 | 1.130 | 7.536 |
| Thy1
expression | (−), (+) | 1.774 | 0.558 | 10.107 | 0.001 | 5.894 | 1.975 | 17.596 |
| ITGA6
expression | (−), (+) | 1.613 | 0.539 | 8.956 | 0.003 | 5.018 | 1.745 | 14.432 |
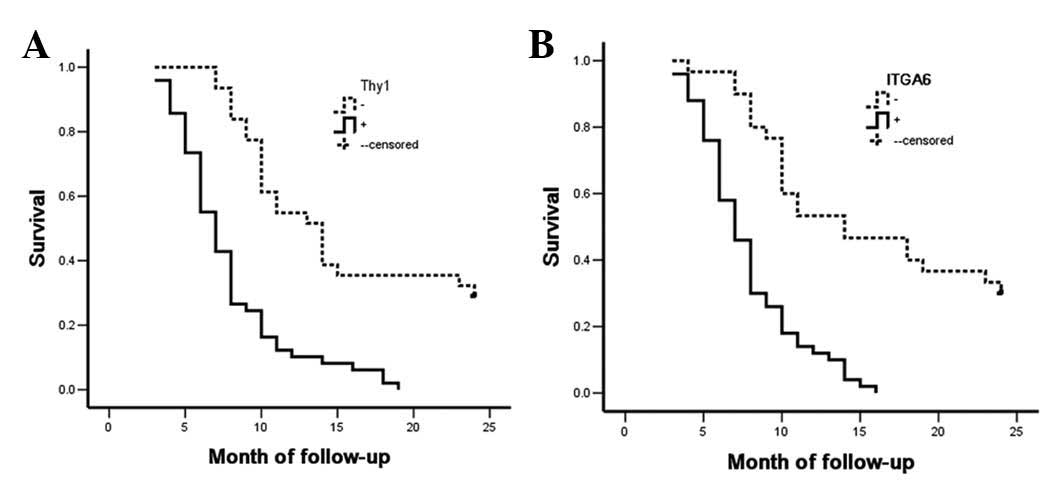
The survival rate of AC patients was similar to that
of SC/ASC patients. Briefly, Thy1- or ITGA6-positive AC patients
had poorer prognosis compared with Thy1- or ITGA6-negative AC
patients (both P<0.001; Table
VII and Fig. 5). Cox multivariate
analysis determined that differentiation, tumor size, TNM stage,
invasion, surgical procedure, and Thy1 and ITGA6 expression had a
significant impact on the prognosis of AC patients (Thy1, P=0.005
and ITGA6, P=0.003; Table
VIII).
| Table VII.Association between Thy1 and ITGA6
expression and median survival rate of AC patients. |
Table VII.
Association between Thy1 and ITGA6
expression and median survival rate of AC patients.
| Protein | Sample, no. | Median survival,
months (range) | χ2 | P-value |
|---|
| Thy1 |
|
| 30.138 | <0.001 |
|
(−) | 31 | 15.32 (7–24) |
|
|
|
(+) | 49 | 7.84 (3–19) |
|
|
| ITGA6 |
|
| 30.992 | <0.001 |
|
(−) | 30 | 15.63 (4–24) |
|
|
|
|
(+) | 50 | 7.80 (3–16) |
|
|
| Table VIII.Multivariate Cox regression analysis
of survival rate in AC patients. |
Table VIII.
Multivariate Cox regression analysis
of survival rate in AC patients.
|
| 95% CI |
|---|
|
|
|
|---|
| Groups | Factors | RC | SE | Wald | P-value | RR | Lower | Upper |
|---|
|
Differentiation | Well, moderately,
poorly | 1.405 | 0.517 | 7.385 | 0.007 | 4.076 | 1.479 | 11.227 |
| Tumor size, cm | ≤3, >3 | 0.994 | 0.383 | 6.736 | 0.009 | 2.702 | 1.275 | 5.724 |
| Gallstones | (−), (+) | 0.325 | 0.316 | 1.058 | 0.304 | 1.384 | 0.745 | 2.571 |
| TNM stage | I+II, III, IV | 1.497 | 0.472 | 10.059 | 0.002 | 4.468 | 1.772 | 11.270 |
| Lymph
metastasis | (−), (+) | 1.311 | 0.486 | 7.277 | 0.007 | 3.710 | 1.431 | 9.617 |
| Invasion | (−), (+) | 1.545 | 0.588 | 6.904 | 0.009 | 4.688 | 1.481 | 14.842 |
| Surgery | Radical,
palliative, biopsy | 1.683 | 0.582 | 8.362 | 0.004 | 5.382 | 1.720 | 16.839 |
| Thy1
expression | (−), (+) | 1.974 | 0.708 | 7.774 | 0.005 | 7.199 | 1.797 | 28.838 |
| ITGA6
expression | (−), (+) | 1.913 | 0.639 | 8.962 | 0.003 | 6.773 | 1.936 | 23.699 |
Discussion
AC is the most common subtype of malignant
gallbladder neoplasm, while SC and ASC are relatively rare
(1,2).
Previous studies revealed that SC/ASC patients are older and have
larger but more differentiated tumors than AC patients (28). In the present study, no significant
differences were observed between AC and SC/ASC in terms of other
clinicopathological characteristics (such as gender, history of
cholecystolithiasis or TNM stage), biological behavior or
post-surgical prognosis. Despite the improvements in the current
understanding of GBC, few biomarkers have been identified that are
associated with the tumorigenesis and prognosis of AC or SC/ASC,
and the differences in terms of molecular markers between AC and
SC/ASC remain to be explored.
The expression of Thy1 and ITGA6 in solid carcinoma
was reported recently. A number of studies have revealed
associations between Thy1 expression and the genesis and metastasis
of various tumors (4–11). Similarly, an increasing number of
studies have suggested that ITGA6 expression is involved in the
progression and invasion of malignant lesions (14,15).
Nonetheless, the expression and significance of Thy1 and ITGA6 in
GBC have not been addressed. The present study demonstrated that
elevated Thy1 and ITGA6 levels are associated with an invasive and
metastatic phenotype, as well as with poor prognosis of SC/ASC and
AC. The present study is, to the best of our knowledge, the first
to investigate the associations between these two important
biomarkers and the characteristics of GBC.
Several studies have suggested that Thy1
participates in multiple signaling cascades involving cellular
adhesion, proliferation, survival and cytokine growth factor
responses (29). THY1, the
gene regulating Thy1 expression, is a driver of invasion that has
been associated with the epithelial-mesenchymal transition in
breast cancer (30). Thy1 also
promotes migration and metastasis in melanoma (9) and hepatocarcinoma (31). Notably, Thy1 has opposite functions in
ovarian (10) and nasopharyngeal
cancer (11). Using an extensive
collection of GBC samples that included SC/ASC and AC subtypes, the
present study determined that Thy1 was overexpressed in GBC tumor
tissues in comparison with non-tumor tissues. It was also noticed
that Thy1 overexpression in both SC/ASC and AC was highly
correlated with poor differentiation, large tumor mass, invasion
and lymph node metastasis, as well as with low rate of radical
resection. Thy1 expression was significantly elevated in AC with
advanced TNM stage. In addition, survival was poor both in AC and
in SC/ASC patients with positive Thy1 expression. Therefore, Thy1
may be a promising novel prognostic marker that could be helpful
for guiding GBC treatment.
ITGA6 is another candidate prognostic biomarker for
GBC. Tumor cell growth, differentiation and progression are greatly
affected by the extracellular matrix (ECM) (17). The α6β4 complex synergizes with
specific molecules such as erythroblastic leukemia viral oncogene
homolog 2, epidermal growth factor receptor, receptor originated
from Nantes, proto-oncogene tyrosine-protein kinase Fyn,
cellular-mesenchymal to epithelial transition factor, protein
kinase C, CD151 and CD9. This activates key signaling pathways
involved in cancer cell invasion and migration by activating
signaling molecules such as phosphatidylinositol 3-kinase (15,32). In
addition, the dysregulation of ITGA6 can trigger a complex cascade
of effects on the expression levels of other cell migration-related
genes, including those coding for ECM and chemokine ligands and
receptors. Although ITGA6 is involved in the invasion and
metastasis of multiple tumors, its biological effects appear to be
tissue type specific (18,19,33–36). The
present study observed that ITGA6 expression was significantly
increased in tumor tissue compared with non-tumor tissue. It was
further demonstrated that positive ITGA6 expression was
significantly correlated with poor differentiation, large tumor
mass, high invasion, lymph node metastasis and low rate of radical
resection in both SC/ASC and AC. The expression of ITGA6 was
significantly higher in AC with advanced TNM stage than in AC with
low TNM stage. The overexpression of ITGA6 and its correlation with
progression and poor survival suggests that ITGA6 is another
candidate biological marker for identifying high-risk GBC patients
who require more aggressive treatment.
Exhibiting stem cell properties, CSCs have
self-renewing capacity, and are able to differentiate into
heterogeneous lineages of neoplastic cells that constitute the
cancer. Apart from initiating the primary tumor, CSCs also serve
crucial roles in metastasis formation and cancer relapse (20). Thus, identifying and characterizing
the putative CSC population in solid tumors will not only
contribute to our understanding of the mechanisms of tumor
initiation, metastasis and recurrence, but will also aid in the
development of novel CSC-targeting therapies. Both Thy1 and ITGA6
have been used for identifying CSCs in tumors of several tissue
types, including the prostate gland (4,37,38), mammary gland (39), brain (23) and colon (40). In the diseased liver, Thy1 is
expressed in hepatic stem cells, hepatic fibroblasts,
myofibroblasts and tumor stroma, and in a small percentage of CSCs
(5,6,41–43). However, the vast majority of these
studies focused on hepatocellular carcinoma. By contrast, the
significance of ITGA6 in CSCs of liver cancer has barely been
addressed. The present study investigated the role of Thy1 and
ITGA6 in GBC, and the results suggested that these proteins act as
tumor oncogenes in both SC/ASC and AC, and are associated with a
highly invasive and metastatic phenotype. Our findings shed light
on the identification of efficient CSC biomarkers in GBC. Of note,
Thy1 and ITGA6 expression was predominantly located in the
cytoplasm. It is possible that intracytoplasmic Thy1 and ITGA6
expression reflects overexpression of these proteins, disruption of
their distribution or their degradation in neoplastic cells.
Various limitations of the present study should be
considered. First, although it was demonstrated that Thy1 and ITGA6
are associated with GBC progression, the underlying mechanisms by
which these proteins regulate cancer behavior were not explored.
This is an area worthy to be explored in the future. Second, the
efficiency of Thy1 and ITGA6 as CSC biomarkers in GBC was not
investigated. A deeper understanding of this could be attained
using an in vitro cell model. Overall, our results
demonstrate that Thy1 and ITGA6 expression is higher in GBC tumor
samples than in non-tumor samples, whereas Thy1 and ITGA6
expression in SC/ASC and AC is similar. Furthermore, overexpression
of Thy1 and ITGA6 can be considered a novel and important risk
factor for SC/ASC and AC invasion, metastasis and poor prognosis.
In conclusion, the results of the present study suggest that Thy1
and ITGA6 function as oncogenes in GBC invasion, metastasis and
prognosis.
Acknowledgements
The authors are grateful to the members of the
Research Laboratory of Hepatobiliary Diseases, The Second Xiangya
Hospital, Central South University (Changsha, China), who have
provided helpful and critical discussions during the preparation
and writing of the present manuscript.
References
|
1
|
Ootani T, Shirai Y, Tsukada K and Muto T:
Relationship between gallbladder carcinoma and the segmental type
of adenomyomatosis of the gallbladder. Cancer. 69:2647–2652. 1992.
View Article : Google Scholar : PubMed/NCBI
|
|
2
|
Kim WS, Jang KT, Choi DW, Choi SH, Heo JS,
You DD and Lee HG: Clinicopathologic analysis of
adenosquamoussquamous cell carcinoma of the gallbladder. J Surg
Oncol. 103:239–242. 2011. View Article : Google Scholar : PubMed/NCBI
|
|
3
|
Rege TA and Hagood JS: Thy-1 as a
regulator of cell-cell and cell-matrix interactions in axon
regeneration, apoptosis, adhesion, migration, cancer, and fibrosis.
FASEB J. 20:1045–1054. 2006. View Article : Google Scholar : PubMed/NCBI
|
|
4
|
True LD, Zhang H, Ye M, Huang CY, Nelson
PS, von Haller PD, Tjoelker LW, Kim JS, Qian WJ, Smith RD, et al:
CD90THY1 is overexpressed in prostate cancer-associated fibroblasts
and could serve as a cancer biomarker. Mod Pathol. 23:1346–1356.
2010. View Article : Google Scholar : PubMed/NCBI
|
|
5
|
Sukowati CH, Anfuso B, Torre G,
Francalanci P, Crocè LS and Tiribelli C: The expression of
CD90Thy-1 in hepatocellular carcinoma: An in vivo and in vitro
study. PLoS One. 8:e768302013. View Article : Google Scholar : PubMed/NCBI
|
|
6
|
Lingala S, Cui YY, Chen X, Ruebner BH,
Qian XF, Zern MA and Wu J: Immunohistochemical staining of cancer
stem cell markers in hepatocellular carcinoma. Exp Mol Pathol.
89:27–35. 2010. View Article : Google Scholar : PubMed/NCBI
|
|
7
|
Lu JW, Chang JG, Yeh KT, Chen RM, Tsai JJ
and Hu RM: Overexpression of Thy1CD90 in human hepatocellular
carcinoma is associated with HBV infection and poor prognosis. Acta
Histochem. 113:833–838. 2011. View Article : Google Scholar : PubMed/NCBI
|
|
8
|
Johansson I, Ringnér M and Hedenfalk I:
The landscape of candidate driver genes differs between male and
female breast cancer. PLoS One. 8:e782992013. View Article : Google Scholar : PubMed/NCBI
|
|
9
|
Saalbach A, Wetzel A, Haustein UF,
Sticherling M, Simon JC and Anderegg U: Interaction of human Thy-1
(CD 90) with the integrin alphavbeta3 (CD51CD61): An important
mechanism mediating melanoma cell adhesion to activated
endothelium. Oncogene. 24:4710–4720. 2005. View Article : Google Scholar : PubMed/NCBI
|
|
10
|
Abeysinghe HR, Pollock SJ, Guckert NL,
Veyberman Y, Keng P, Halterman M, Federoff HJ, Rosenblatt JP and
Wang N: The role of the THY1 gene in human ovarian cancer
suppression based on transfection studies. Cancer Genet Cytogenet.
149:1–10. 2004. View Article : Google Scholar : PubMed/NCBI
|
|
11
|
Lung HL, Cheung AK, Cheng Y, Kwong FM, Lo
PH, Law EW, Chua D, Zabarovsky ER, Wang N, Tsao SW, et al:
Functional characterization of THY1 as a tumor suppressor gene with
antiinvasive activity in nasopharyngeal carcinoma. Int J Cancer.
127:304–312. 2010.PubMed/NCBI
|
|
12
|
Belkin AM and Stepp MA: Integrins as
receptors for laminins. Microsc Res Tech. 51:280–301. 2000.
View Article : Google Scholar : PubMed/NCBI
|
|
13
|
Lowell CA and Mayadas TN: Overview:
Studying integrins in vivo. Methods Mol Biol. 757:369–397. 2012.
View Article : Google Scholar : PubMed/NCBI
|
|
14
|
Carloni V, Mazzocca A, Pantaleo P,
Cordella C, Laffi G and Gentilini P: The integrin, alpha6beta1, is
necessary for the matrix-dependent activation of FAK and MAP kinase
and the migration of human hepatocarcinoma cells. Hepatology.
34:42–49. 2001. View Article : Google Scholar : PubMed/NCBI
|
|
15
|
Yoon SO, Shin S and Lipscomb EA: A novel
mechanism for integrin-mediated ras activation in breast carcinoma
cells: The alpha6beta4 integrin regulates ErbB2 translation and
transactivates epidermal growth factor receptorErbB2 signaling.
Cancer Res. 66:2732–2739. 2006. View Article : Google Scholar : PubMed/NCBI
|
|
16
|
He J, Liu Y, Zhu T, Zhu J, Dimeco F,
Vescovi AL, Heth JA, Muraszko KM, Fan X and Lubman DM: CD90 is
identified as a candidate marker for cancer stem cells in primary
high-grade gliomas using tissue microarrays. Mol Cell Proteomics.
11:M1112012. View Article : Google Scholar
|
|
17
|
Cariati M, Naderi A, Brown JP, Smalley MJ,
Pinder SE, Caldas C and Purushotham AD: Alpha-6 integrin is
necessary for the tumourigenicity of a stem cell-like subpopulation
within the MCF7 breast cancer cell line. Int J Cancer. 122:298–304.
2008. View Article : Google Scholar : PubMed/NCBI
|
|
18
|
Yamamoto H, Masters JR, Dasgupta P,
Chandra A, Popert R, Freeman A and Ahmed A: CD49f is an efficient
marker of monolayer- and spheroid colony-forming cells of the
benign and malignant human prostate. PLoS One. 7:e469792012.
View Article : Google Scholar : PubMed/NCBI
|
|
19
|
Pascal LE, Goo YA, Vêncio RZ, Page LS,
Chambers AA, Liebeskind ES, Takayama TK, True LD and Liu AY: Gene
expression downregulation in CD90+ prostate tumor-associated
stromal cells involves potential organ-specific genes. BMC Cancer.
9:3172009. View Article : Google Scholar : PubMed/NCBI
|
|
20
|
Kopper L and Hajdú M: Tumor stem cells.
Pathol Oncol Res. 10:69–73. 2004. View Article : Google Scholar : PubMed/NCBI
|
|
21
|
Martin TA and Jiang WG: Evaluation of the
expression of stem cell markers in human breast cancer reveals a
correlation with clinical progression and metastatic disease in
ductal carcinoma. Oncol Rep. 31:262–272. 2014.PubMed/NCBI
|
|
22
|
Yang W, Yan HX, Chen L, Liu Q, He YQ, Yu
LX, Zhang SH, Huang DD, Tang L, Kong XN, et al: Wntbeta-catenin
signaling contributes to activation of normal and tumorigenic liver
progenitor cells. Cancer Res. 68:4287–4295. 2008. View Article : Google Scholar : PubMed/NCBI
|
|
23
|
Haraguchi N, Ishii H, Mimori K, Ohta K,
Uemura M, Nishimura J, Hata T, Takemasa I, Mizushima T, Yamamoto H,
et al: CD49f-positive cell population efficiently enriches colon
cancer-initiating cells. Int J Oncol. 43:425–430. 2013.PubMed/NCBI
|
|
24
|
Hermann PC, Huber SL, Herrler T, Aicher A,
Ellwart JW, Guba M, Bruns CJ and Heeschen C: Distinct populations
of cancer stem cells determine tumor growth and metastatic activity
in human pancreatic cancer. Cell Stem Cell. 1:313–323. 2007.
View Article : Google Scholar : PubMed/NCBI
|
|
25
|
Khan SA, Davidson BR, Goldin R, Pereira
SP, Rosenberg WM, Taylor-Robinson SD, Thillainayagam AV, Thomas HC,
Thursz MR and Wasan H: British Society of Gastroenterology:
Guidelines for the diagnosis and treatment of cholangiocarcinoma:
Consensus document. Gut 51 (Suppl 6). 7–9. 2002.
|
|
26
|
Sobin LH, Gospodarowicz MK and Wittekind
C: International Union Against Cancer (UICC) TNM Classification of
Malignant Tumors. 7th. Wiley-Liss; New York, NY: 2009
|
|
27
|
Livak KJ and Schmittgen TD: Analysis of
relative gene expression data using real-time quantitative PCR and
the 2(−Delta Delta C(T)) method. Methods. 25:402–408. 2001.
View Article : Google Scholar : PubMed/NCBI
|
|
28
|
Li QL, Yang ZL, Liu JQ and Miao XY:
Expression of CDX2 and hepatocyte antigen in benign and malignant
lesions of gallbladder and its correlation with histopathologic
type and clinical outcome. Pathol Oncol Res. 17:561–568. 2011.
View Article : Google Scholar : PubMed/NCBI
|
|
29
|
Rege TA and Hagood JS: Thy-1, a versatile
modulator of signaling affecting cellular adhesion, proliferation,
survival, and cytokinegrowth factor responses. Biochim Biophys
Acta. 1763:991–999. 2006. View Article : Google Scholar : PubMed/NCBI
|
|
30
|
Taube JH, Herschkowitz JI, Komurov K, Zhou
AY, Gupta S, Yang J, Hartwell K, Onder TT, Gupta PB, Evans KW, et
al: Core epithelial-to-mesenchymal transition interactome
gene-expression signature is associated with claudin-low and
metaplastic breast cancer subtypes. Proc Natl Acad Sci USA.
107:15449–15454. 2010. View Article : Google Scholar : PubMed/NCBI
|
|
31
|
Cheng BQ, Jiang Y, Li DL, Fan JJ and Ma M:
Upregulation of thy-1 promotes invasion and metastasis of
hepatocarcinomas. Asian Pac J Cancer Prev. 13:1349–1353. 2012.
View Article : Google Scholar : PubMed/NCBI
|
|
32
|
Lu P, Weaver VM and Werb Z: The
extracellular matrix: A dynamic niche in cancer progression. J Cell
Biol. 196:395–406. 2012. View Article : Google Scholar : PubMed/NCBI
|
|
33
|
Guo W and Giancotti FG: Integrin
signalling during tumour progression. Nat Rev Mol Cell Biol.
5:816–826. 2004. View
Article : Google Scholar : PubMed/NCBI
|
|
34
|
Tian B, Li Y, Ji XN, Chen J, Xue Q, Ye SL,
Liu YK and Tang ZY: Basement membrane proteins play an active role
in the invasive process of human hepatocellular carcinoma cells
with high metastasis potential. J Cancer Res Clin Oncol. 131:80–86.
2005. View Article : Google Scholar : PubMed/NCBI
|
|
35
|
Ports MO, Nagle RB, Pond GD and Cress AE:
Extracellular engagement of alpha6 integrin inhibited
urokinase-type plasminogen activator-mediated cleavage and delayed
human prostate bone metastasis. Cancer Res. 69:5007–5014. 2009.
View Article : Google Scholar : PubMed/NCBI
|
|
36
|
Kalogeropoulou M, Voulgari A, Kostourou V,
Sandaltzopoulos R, Dikstein R, Davidson I, Tora L and Pintzas A:
TAF4b and Junactivating protein-1 collaborate to regulate the
expression of integrin alpha6 and cancer cell migration properties.
Mol Cancer Res. 8:554–568. 2010. View Article : Google Scholar : PubMed/NCBI
|
|
37
|
Germain M, De Arcangelis A, Robinson SD,
Baker M, Tavora B, D'Amico G, Silva R, Kostourou V, Reynolds LE,
Watson A, et al: Genetic ablation of the alpha 6-integrin subunit
in Tie1Cre mice enhances tumour angiogenesis. J Pathol.
220:370–381. 2010.PubMed/NCBI
|
|
38
|
Yamakawa N, Kaneda K, Saito Y, Ichihara E
and Morishita K: The increased expression of integrin alpha6
(ITGA6) enhances drug resistance in EVI1 (high) leukemia. PLoS One.
7:e307062012. View Article : Google Scholar : PubMed/NCBI
|
|
39
|
Vassilopoulos A, Chisholm C, Lahusen T,
Zheng H and Deng CX: A critical role of CD29 and CD49f in mediating
metastasis for cancer-initiating cells isolated from a
Brca1-associated mouse model of breast cancer. Oncogene.
33:5477–5482. 2014. View Article : Google Scholar : PubMed/NCBI
|
|
40
|
Lathia JD, Gallagher J, Heddleston JM,
Wang J, Eyler CE, Macswords J, Wu Q, Vasanji A, McLendon RE,
Hjelmeland AB and Rich JN: Integrin alpha 6 regulates glioblastoma
stem cells. Cell Stem Cell. 6:421–432. 2010. View Article : Google Scholar : PubMed/NCBI
|
|
41
|
Herrera MB, Bruno S, Buttiglieri S, Tetta
C, Gatti S, Deregibus MC, Bussolati B and Camussi G: Isolation and
characterization of a stem cell population from adult human liver.
Stem Cells. 24:2840–2850. 2006. View Article : Google Scholar : PubMed/NCBI
|
|
42
|
Dan YY, Riehle KJ, Lazaro C, Teoh N, Haque
J, Campbell JS and Fausto N: Isolation of multipotent progenitor
cells from human fetal liver capable of differentiating into liver
and mesenchymal lineages. Proc Natl Acad Sci USA. 103:9912–9917.
2006. View Article : Google Scholar : PubMed/NCBI
|
|
43
|
Yang ZF, Ngai P, Ho DW, Yu WC, Ng MN, Lau
CK, Li ML, Tam KH, Lam CT, Poon RT and Fan ST: Identification of
local and circulating cancer stem cells in human liver cancer.
Hepatology. 47:919–928. 2008. View Article : Google Scholar : PubMed/NCBI
|