Introduction
Targeted therapy of metastatic colorectal cancer
(mCRC) using monoclonal antibody (moAb) anti-epidermal growth
factor receptors (EGFR) agents, such as cetuximab (CTX) or
panitumumab, is the treatment strategy of choice in patients
characterised by a wild type (wt) KRAS gene status (1–3).
Despite the selection for KRAS-wt patients, only ~25% of
patients demonstrate a response to treatment. Several studies have
attempted to identify additional potential biomarkers for the
selection of patients who are likely to respond to therapy, or to
exclude those who are not likely to respond (4–12).
BRAF and PIK3CA are the most frequently studied
genes, and their mutations have been analysed in association with
CTX response. In particular, a number of studies have demonstrated
that BRAF and PIK3CA mutations were associated with a
worse objective response rate (ORR), progression free survival
(PFS) rate and overall survival (OS) rate, compared with wt
patients, suggesting that the selection of triple-wt patients for
KRAS, BRAF and PIK3CA mutations may be a good
strategy for improving the outcome of patients treated with CTX or
panitumumab (4,5,7–10,12).
Although several studies have revealed a possible role of the two
genes as predictive markers, others have highlighted their role as
prognostic, rather than predictive, factors (13–16).
NRAS mutations have also been added in clinical practice,
together with KRAS, as a discriminating marker for moAb
anti-EGFR drugs, as it has been demonstrated that patients with a
mutated NRAS gene did not respond to therapy (17).
In addition, although the EGFR protein represents
the target of therapy, protein expression does not appear to be a
potential indicator of response (18).
A previous study has demonstrated that EGFR
promoter methylation, an epigenetic event associated with the loss
of EGFR expression, is associated with a poor prognosis for
patients, highlighting the possibility that immunohistochemistry
may not be the optimal method for EGFR expression assessment and
that, EGFR expression may aid in predicting the effect of anti-EGFR
therapies (19). However, the
association between EGFR methylation and the other common
alterations, including KRAS, BRAF and PIK3CA
mutations, was not analysed.
The present study aimed to analyse the correlation
between EGFR methylation and the clinical outcome of
patients in a case series of mCRC patients treated with CTX-based
chemotherapy. The association between EGFR methylation and
KRAS, BRAF and PIK3CA mutations was also
analysed.
Patients and methods
Patients
In total, 64 consecutively enrolled patients with
mCRC treated with a CTX-based regimen at IRST IRCCS (Meldola,
Italy) between March 2004 and October 2010 were retrospectively
analysed for the present study. The clinical-pathological
characteristics of the patients are summarised in Table I. The inclusion criteria were a
pathological diagnosis of stage IV colorectal adenocarcinoma, an
age ≥18 years and an Eastern Cooperative Oncology Group performance
status <3. Patients treated prior to June 2009 were selected for
CTX treatment on the basis of EGFR expression alone, as KRAS
mutational status evaluation had not been made mandatory by the
Italian Regulatory Authority at that time. All patients treated
subsequent to June 2009 possessed tumours that were negative for
KRAS mutations. This study was approved by the IRST Ethics
Committee (Milan, Italy) and written informed consent was obtained
from all patients.
 | Table IBaseline patient characteristics. |
Table I
Baseline patient characteristics.
| Characteristic | Value |
|---|
| Number of patients,
n | 64 |
| Age, years | |
| Median | 61 |
| Range | 34–79 |
| Gender, n (%) | |
| Male | 37 (57.8) |
| Female | 27 (42.2) |
| Performance status,
n (%) | |
| 0 | 38 (59.4) |
| 1–2 | 26 (40.6) |
| Primary tumour
site, n (%) | |
| Colon | 51 (79.7) |
| Rectum | 13 (20.3) |
| Treatment regimen,
n (%) | |
|
CTX+irinotecan/FOLFIRI | 57 (89.1) |
| CTX+FOLFOX4 | 6 (9.4) |
| CTX alone | 1 (1.6) |
| Previous
chemotherapy, n (%) | |
|
Irinotecan-based | 59 (92.2) |
|
Fluoropyrimidine-based | 64 (100.0) |
|
Oxaliplatin-based | 52 (81.3) |
|
Bevacizumab-based | 23 (35.9) |
| Previous cancer
treatments for advanced disease, n (%) | |
| 1 | 14 (21.9) |
| 2 | 26 (40.6) |
| 3 | 15 (23.4) |
| >3 | 9 (14.1) |
| Cutaneous toxicity,
n (%) | |
| 0 | 16 (25.0) |
| 1 | 19 (29.7) |
| 2–3 | 29 (45.3) |
Data were collected regarding patient
characteristics, treatment and outcome. Treatment was continued
until disease progression or toxicity occurred. The clinical
response was assessed every eight weeks by a complete radiological
examination, comprising a computed tomography (CT) or magnetic
resonance imaging (MRI) scan, and it was also evaluated
retrospectively according to the Response Evaluation Criteria in
Solid Tumours guidelines (20).
Objective tumour responses were classified into complete response,
partial response, stable disease (SD) or progressive disease (PD).
Patients with SD or PD were defined as non-responders. The
objective response rate (ORR) was defined as the fraction of
patients with complete or partial response confirmed ≥4 weeks after
the initial response. Toxicity was evaluated according to the
National Cancer Institute Common Terminology Criteria for Adverse
Events v3.0 guidelines (21) for
each patient receiving at least one dose of CTX-based
chemotherapy.
EGFR expression
The expression of EGFR was evaluated by
immunohistochemistry performed on 5 μm-thick tissue sections
obtained from paraffin-embedded tissue specimens, using the EGFR
PharmaDx (Dako, Glostrup, Denmark) according to the manufacturer’s
instructions.
Gene mutation analyses
Formalin-fixed paraffin-embedded (FFPE) tumour
blocks were reviewed for quality and tumour content. DNA was
extracted from 5-μM FFPE sections of primary or metastatic lesions
containing ≥50% tumour cells. Exon 2 of KRAS, exon 15 of
BRAF and exons 9 and 20 of PIK3CA were analysed by
pyrosequencing using the anti-EGFR moAb response kit for
KRAS, BRAF and PIK3CA status (Diatech
Pharmacogenetics, Ancona, Italy), respectively. The reactions were
run on a PyroMark Q96 ID (Qiagen, Milan, Italy).
EGFR methylation analysis
EGFR methylation status was evaluated by
pyrosequencing analysis. In particular, three CpG islands were
analysed using Hs_EGFR_02_PM PyroMark CpG assays (Qiagen). The
analyses were performed on PyroMark Q96 ID (Qiagen).
Statistical analysis
A two-sided Fisher’s exact test was used to evaluate
the association between EGFR methylation, considered to be a
dichotomous variable according to a cut-off of 10%, or the other
gene mutations and ORR. The association between EGFR methylation,
considered to be a continuous variable, and gene mutation was
analysed using the Wilcoxon signed rank test.
The PFS rate was calculated from the first day of
treatment to the date of the first observation of disease
progression or, in the absence of progressive disease, the last
follow-up or mortality. The OS rate was calculated from the first
day of treatment to the date of mortality due to any cause or the
date of the last follow-up. The PFS and OS rates and the 95%
confidence interval (CI) were estimated using the Kaplan-Meier
life-table method and the survival curves were compared using the
log-rank test.
The impact of EGFR methylation on clinical
outcome was evaluated in univariate analysis using a Cox regression
model. All P-values were based on two-sided testing and statistical
analyses were carried out using SAS statistical software (version
9.3; SAS Institute, Cary, NC, USA). P<0.05 was considered to
indicate a statistically significant difference.
Results
EGFR expression
Analysis of EGFR expression was performed on 55
cases. In 34 patients, the analysis was only performed on the
primary lesion, in 10 patients, only the metastatic lesion was
analysed, and in 11 patients, the analysis was performed on each
tumour lesion. Overall, 35 (64%) patients exhibited positivity for
EGFR expression in at least one cell. In particular, EGFR
expression was evident in 29 out of 45 (64%) primary tumours, and
in 10 of the 21 (48%) metastatic lesions. Concordance between EGFR
expression in primary and metastatic lesions was 27%, as only three
cases out of 11 exhibited concordant expression. In all other
cases, the primary tumour was positive for EGFR expression, whereas
the metastatic lesion had lost EGFR expression.
EGFR methylation
EGFR methylation analysis was performed on
three CpG islands in all 64 mCRC patients. For 36 patients, the
analysis was only performed on the primary lesion, for 14 patients,
only the metastatic lesions were analysed, and for 14 patients,
analysis was possible on each lesion. Where the analysis was
performed on the two lesions, the results obtained on the
metastatic lesion were taken into consideration for the overall
statistical analysis.
Only two cases revealed no methylation in all three
CpG islands. Assessment of the mean methylation in the three CpG
islands revealed that 22 cases (34%) possessed a mean percentage of
methylation of <10%, whereas 42 cases (66%) exhibited ≥10%
methylation. In particular, 40 cases (63%) demonstrated a
methylation rate between 10% and 50%, whereas two cases (3%)
demonstrated an average percentage >50% in the primary or
metastatic lesions. Separate analysis of the three CpG islands
revealed that 16 samples (25%) exhibited a methylation level of
<10% in all three islands, 48 cases (75%) exhibited a
methylation level between 10 and 50% in at least one CpG island,
and 13 cases (20%) possessed a methylation level >50% in one or
more CpG islands. Of the 14 tumour samples for which the
EGFR methylation analysis was performed on the primary and
metastatic lesions, the results demonstrated heterogeneity between
the two specimens. In particular, samples three and four clearly
demonstrated an increased methylation level in the three CpG
islands in the metastatic lesions, whereas sample six revealed a
strong decrease at this site (Table
II).
| Table IIMethylation of three EGFR CpG
islands of in the primary tumor and matched metastatic lesions. |
Table II
Methylation of three EGFR CpG
islands of in the primary tumor and matched metastatic lesions.
| Methylation of
primary tumor tissue | Methylation of
metastatic lesion |
|---|
|
|
|
|---|
| Sample | CpG1, % | CpG2, % | CpG3, % | CpG1, % | CpG2, % | CpG3, % |
|---|
| 1 | 5 | 7 | 14 | 0 | 3 | 0 |
| 2 | 7 | 55 | 15 | 18 | 32 | 74 |
| 3 | 0 | 9 | 0 | 4 | 82 | 84 |
| 4 | 7 | 9 | 0 | 48 | 49 | 54 |
| 5 | 5 | 0 | 6 | 10 | 0 | 0 |
| 6 | 65 | 61 | 63 | 0 | 4 | 0 |
| 7 | 9 | 29 | 35 | 14 | 31 | 35 |
| 8 | 8 | 16 | 17 | 16 | 24 | 17 |
| 9 | 0 | 0 | 25 | 0 | 9 | 3 |
| 10 | 2 | 27 | 36 | 0 | 5 | 4 |
| 11 | 1 | 8 | 13 | 25 | 0 | 0 |
| 12 | 27 | 21 | 23 | 2 | 0 | 68 |
| 13 | 65 | 3 | 0 | 2 | 12 | 14 |
| 14 | 17 | 21 | 32 | 40 | 61 | 33 |
KRAS, BRAF and PIK3CA mutation
analyses
It was found that KRAS was mutated in 19
(30%) cases, comprising five G12V, three G12S, two G12D, one G12A,
one G12C and seven G13D mutations. In three cases, a discordant
result was obtained between the primary tumour and the metastatic
lesion. In two of these cases, the primary tumour was wt and the
metastatic lesion was mutated, whereas the remaining case
demonstrated the opposite result, with mutation in the primary
tumour and a wt metastatic lesion.
BRAF was mutated in 11 cases (17.2%). In all
cases, the mutation was a V600E mutation on exon 15 of the gene. In
four cases, a discordant result was observed between the primary
tumour and metastatic lesion. In three of these cases, the mutation
was evident in the metastatic lesion and not in the primary tumour,
whereas in the remaining case, the mutation was evident in the
primary tumour and not in the metastatic lesion. The BRAF
mutation was associated with a shorter OS (6.9 months; 95% CI,
1.7–15.1) when compared with BRAF wt patients (10.0 months;
95% CI, 8.2–13.5) (P=0.09). However, no significant differences in
PFS rate were identified between the two groups.
PIK3CA was mutated in seven cases (10.9%). In
six cases the mutation was in exon 9 of the gene, consisting of one
E545G, one E542K and four E545K mutations, whereas in the remaining
case the mutation was in exon 20, with a H1047L mutation. In one
case, the mutation was detected in the primary tumour and not in
the metastatic lesion, whereas in the other cases, a concordant
result was obtained between the two lesions. The PIK3CA
mutation was associated with a shorter OS (7.0 months; 95% CI,
3.3–9.6) when comapred with PIK3CA wt patients (10.0 months;
95%, CI 8.3–13.7) (P=0.05). However, no significant differences in
PFS rate were identified between the two groups.
Correlation between EGFR
methylation and other molecular alterations
In the primary tumour, no correlations were found
between KRAS, BRAF or PIK3CA mutations and
EGFR methylation, which were assessed in the three CpG
islands separately or as mean value. Conversely, in the metastatic
lesions, a correlation was found between the percentage of mean
EGFR methylation and the presence of KRAS mutation,
or the presence of a BRAF-wt gene. In particular, a mean
EGFR methylation of 41% was observed in KRAS-mutated
patients, compared to a methylation level of 9% in KRAS-wt
patients (P=0.05). Conversely, a high EGFR methylation was
observed in BRAF-wt patients compared with
BRAF-mutated patients (18 vs. 3%, respectively; P=0.07)
(Table III). No correlation was
found between EGFR methylation and EGFR expression, in the
primary and metastatic lesions.
| Table IIICorrelation between EGFR
methylation and KRAS, BRAF and PIK3CA
mutations. |
Table III
Correlation between EGFR
methylation and KRAS, BRAF and PIK3CA
mutations.
| | CpG1
methylation | CpG2
methylation | CpG3
methylation | Mean
methylation |
|---|
| |
|
|
|
|
|---|
| Mutation
status | Number of
patients | Median value
(range) | P-value | Median value
(range) | P-value | Median value
(range) | P-value | Median value
(range) | P-value |
|---|
| Primary tumor
(n=54) |
| KRAS
wt | 39 | 8.0 (0–65) | | 13.0 (0–55) | | 14.0 (0–61) | | 17.0 (0–42) | |
| KRAS
mut | 15 | 7.0 (0–65) | 0.516 | 17.0 (4–61) | 0.077 | 15.0 (0–63) | 0.582 | 13.0 (3–63) | 0.578 |
| BRAF
wt | 46 | 8.5 (0–65) | | 15.0 (0–61) | | 16.5 (0–63) | | 15.5 (0–63) | |
| BRAF
mut | 8 | 6.0 (2–65) | 0.773 | 3.0 (0–37) | 0.217 | 6.0 (0–61) | 0.335 | 17.0 (2–42) | 0.529 |
| PIK3CA
wt | 47 | 9.0 (0–65) | | 15.0 (0–56) | | 14.0 (0–61) | | 17.0 (0–54) | |
| PIK3CA
mut | 7 | 1.5 (0–65) | 0.186 | 10.5 (0–61) | 0.429 | 13.0 (0–63) | 0.791 | 5.5 (0–63) | 0.111 |
| Metastatic lesions
(n=29) |
| KRAS
wt | 18 | 4.0 (0–34) | | 9.0 (0–25) | | 7.0 (0–68) | | 9.0 (0–26) | |
| KRAS
mut | 11 | 18.0 (0–48) | 0.034 | 32.0 (0–82) | 0.072 | 29.0 (0–84) | 0.221 | 41.0 (1–57) | 0.057 |
| BRAF
wt | 23 | 12.5 (0–48) | | 13.5 (0–82) | | 15.5 (0–84) | | 18.0 (0–57) | |
| BRAF
mut | 6 | 5.0 (0–10) | 0.365 | 0.0 (0–5) | 0.051 | 4.0 (0–4) | 0.114 | 3.0 (3–3) | 0.077 |
| PIK3CA
wt | 26 | 12.5 (0–48) | | 11.5 (0–62) | | 12.5 (0–74) | | 14.0 (0–50) | |
| PIK3CA
mut | 3 | 4.0 (0–4) | 0.178 | 10.0 (4–82) | 0.740 | 7.0 (0–84) | 1.000 | 7.0 (1–57) | 0.803 |
EGFR methylation in association with
clinical response
The mean percentage of EGFR methylation in
the three CpG islands demonstrated no correlation with the clinical
response. Conversely, a higher median value of CpG island 2
methylation was observed in responders (22%) compared to
non-responders (11%) (P=0.02), and the univariate analysis of
objective response revealed a significant correlation
(P=0.037).
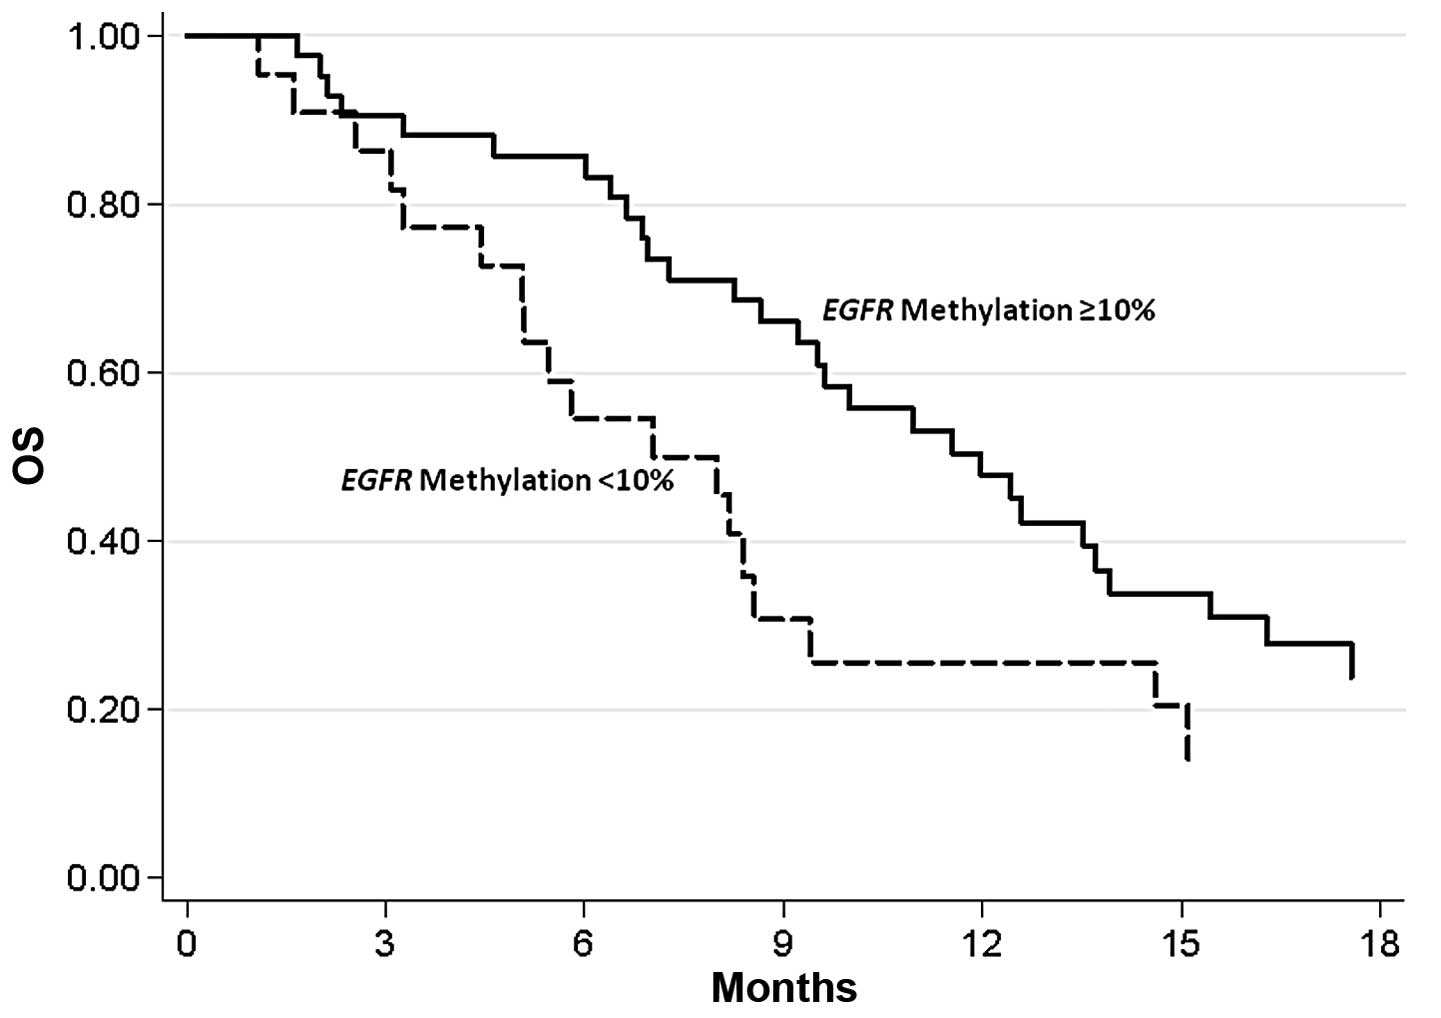
In univariate analyses, with the EGFR methylation
level being considered a continuous variable, the Cox regression
model revealed that EGFR methylation was significantly
correlated with OS rate (hazard ratio, 0.98; 95% CI, 0.96–1.00;
P=0.019), but not with the PFS rate. In particular, the median OS
rate of patients with a methylation rate <10% was 7.5 months
(95% CI, 4.4–9.4 months) and the OS rate was 12.0 months (95% CI,
8.7–13.9 months) in patients with a methylation rate >10%
(P=0.034) (Fig. 1).
Discussion
Despite KRAS mutation being one of the
selection criteria for the use of anti-EGFR therapy in mCRC
patients, only a subgroup of KRAS-wt patients responded to
the treatment. The analysis of other markers, including
NRAS, BRAF and PIK3CA, have also allowed for
the selection of further patients that may be likely to not respond
to therapy (17,22). With a multiple marker selection, the
probability of the selected patients responding to treatment may be
significantly increased (4).
Although the target of moAb anti-EGFR drugs is the
EGFR protein, several studies analysing the correlation between the
expression or amplification of EGFR and clinical response have
reported non-significant results (23–25).
However, it is also likely that immunohistochemical evaluation of
the EGFR protein expression may not be sufficiently accurate to
detect the loss of EGFR protein in cancer tissue, thus compromising
data analysis and interpretation (26). In addition, several biases may
compromise the reproducibility of immunohistochemical analysis,
including the different antibodies used and the varying reaction
conditions that are used between different laboratories.
Gene methylation analysis may be an indirect
approach towards analysing gene expression. It has been
demonstrated that EGFR methylation is detectable in several
types of solid tumour (27), but
its association with EGFR immunohistochemical expression is
unclear.
A previous study has demonstrated a significant
correlation between the absence of EGFR methylation and the
response to CTX-based chemotherapy in colorectal cancer patients.
In particular, patients with a methylated gene were less responsive
to therapy compared with patients without methylation, although no
correlation between EGFR methylation and expression was
identified (19). Conversely, in
the present study, a significant correlation was found between the
methylation of specific CpG islands and response to treatment,
demonstrating that gene methylation was significantly correlated
with ORR and OS rate, but not with PFS rate. The reasons for the
discrepancy between the present study and the study by Scartozzi
et al (19) may lie in the
different CpG islands analysed and the different methodologies
used. In particular, the present study analysed three CpG islands
localised in the promoter region of EGFR (27), but these were upstream of the region
analysed in the study by Scartozzi et al. In addition,
pyrosequencing methodology was used in the present study, whereas
the methylation-specific polymerase chain reaction approach was
used in the aforementioned study.
To the best of our knowledge, the present study
analysed the correlation between EGFR methylation and
mutation in KRAS, BRAF and PIK3CA, which are
genes involved in the resistance mechanisms to CTX, for the first
time. No significant correlation was observed overall between
EGFR methylation and the various gene mutations. However, it
was only in metastatic lesions that gene methylation was found to
be positively correlated with KRAS mutation and negatively
correlated with BRAF mutation. In particular, a
significantly increased percentage of methylation was observed in
KRAS-mutated and BRAF-wt patients. Additionally, a
high level of methylation was observed more frequently in
PIK3CA-wt patients compared with PIK3CA-mutated
patients, although this difference was not significant.
In the present study, the BRAF and
PIK3CA mutations were correlated with a shorter OS rate, and
the correlation identified between these mutations and the absence
of EGFR methylation is consistent with the worse predictive
value observed in patients with an EGFR methylation level
<10%. The present study included patients with KRAS-wt
and -mutated tumours that were treated with CTX prior to June 2009,
and other patients selected for KRAS-wt tumours that were
treated subsequent to June 2009. No significant correlations
between the KRAS mutation status and the ORR, PFS rate and
OS rate were identified, most likely due to the limited number of
KRAS-mutated cases.
The correlations identified in metastatic lesions
between EGFR methylation and KRAS mutation, may be
due to the presence of constitutively activated signalling prompted
by KRAS inducing cells to overcome the role of an EGFR
hyperexpression. The inverse association identified with
BRAF and PIK3CA mutations, by contrast, remains to be
elucidated.
Similar to the study by Scartozzi et al
(19), the present study did not
identify any correlation between EGFR methylation and EGFR
expression, despite the varying results obtained in terms of
methylation.
In conclusion, the present study demonstrated
correlations between EGFR methylation and an improved
response and OS rate in patients treated with CTX-based
chemotherapy. The presence of EGFR methylation was found to
be inversely correlated with BRAF and PIK3CA
mutations, indicating that the prognostic value of gene methylation
requires additional verification in future studies.
Acknowledgements
The authors would like to thank Ms. Ursula Elbling
for editing the original manuscript.
References
|
1
|
Lièvre A, Bachet JB, Le Corre D, et al:
KRAS mutation status is predictive of response to cetuximab therapy
in colorectal cancer. Cancer Res. 66:3992–3995. 2006. View Article : Google Scholar : PubMed/NCBI
|
|
2
|
Benvenuti S, Sartore-Bianchi A, Di
Nicolantonio F, et al: Oncogenic activation of the RAS/RAF
signaling pathway impairs the response of metastatic colorectal
cancers to anti-epidermal growth factor receptor antibody
therapies. Cancer Res. 67:2643–2648. 2007. View Article : Google Scholar : PubMed/NCBI
|
|
3
|
Amado RG, Wolf M, Peeters M, et al:
Wild-type KRAS is required for panitumumab efficacy in patients
with metastatic colorectal cancer. J Clin Oncol. 26:1626–1634.
2008. View Article : Google Scholar : PubMed/NCBI
|
|
4
|
Sartore-Bianchi A, Di Nicolantonio F,
Nichelatti M, et al: Multi-determinants analysis of molecular
alterations for predicting clinical benefit to EGFR-targeted
monoclonal antibodies in colorectal cancer. PLoS One. 4:e72872009.
View Article : Google Scholar : PubMed/NCBI
|
|
5
|
Di Nicolantonio F, Martini M, Molinari F,
et al: Wild-type BRAF is required for response to panitumumab or
cetuximab in metastatic colorectal cancer. J Clin Oncol.
26:5705–5712. 2008. View Article : Google Scholar : PubMed/NCBI
|
|
6
|
Frattini M, Saletti P, Romagnani E, et al:
PTEN loss of expression predicts cetuximab efficacy in metastatic
colorectal cancer patients. Br J Cancer. 97:1139–1145. 2007.
View Article : Google Scholar : PubMed/NCBI
|
|
7
|
Perrone F, Lampis A, Orsenigo M, et al:
PI3KCA/PTEN deregulation contributes to impaired responses to
cetuximab in metastatic colorectal cancer patients. Ann Oncol.
20:84–90. 2009. View Article : Google Scholar
|
|
8
|
Sartore-Bianchi A, Martini M, Molinari F,
et al: PIK3CA mutations in colorectal cancer are associated with
clinical resistance to EGFR-targeted monoclonal antibodies. Cancer
Res. 69:1851–1857. 2009. View Article : Google Scholar : PubMed/NCBI
|
|
9
|
Jhawer M, Goel S, Wilson AJ, et al: PIK3CA
mutation/PTEN expression status predicts response of colon cancer
cells to the epidermal growth factor receptor inhibitor cetuximab.
Cancer Res. 68:1953–1961. 2008. View Article : Google Scholar : PubMed/NCBI
|
|
10
|
Laurent-Puig P, Cayre A, Manceau G, et al:
Analysis of PTEN, BRAF, and EGFR status in determining benefit from
cetuximab therapy in wild-type KRAS metastatic colon cancer. J Clin
Oncol. 27:5924–5930. 2009. View Article : Google Scholar : PubMed/NCBI
|
|
11
|
Razis E, Briasoulis E, Vrettou E, et al:
Potential value of PTEN in predicting cetuximab response in
colorectal cancer: An exploratory study. BMC Cancer. 8:2342008.
View Article : Google Scholar : PubMed/NCBI
|
|
12
|
Ulivi P, Capelli L, Valgiusti M, et al:
Predictive role of multiple gene alterations in response to
cetuximab in metastatic colorectal cancer: A single center study. J
Transl Med. 10:872012. View Article : Google Scholar : PubMed/NCBI
|
|
13
|
Van Cutsem E, Köhne CH, Láng I, et al:
Cetuximab plus irinotecan, fluorouracil, and leucovorin as
first-line treatment for metastatic colorectal cancer: Updated
analysis of overall survival according to tumor KRAS and BRAF
mutation status. J Clin Oncol. 29:2011–2019. 2011. View Article : Google Scholar : PubMed/NCBI
|
|
14
|
Ogino S, Nosho K, Kirkner GJ, et al: CpG
island methylator phenotype, microsatellite instability, BRAF
mutation and clinical outcome in colon cancer. Gut. 58:90–96. 2009.
View Article : Google Scholar :
|
|
15
|
Tol J, Nagtegaal ID and Punt CJ: BRAF
mutation in metastatic colorectal cancer. N Engl J Med. 361:98–99.
2009. View Article : Google Scholar : PubMed/NCBI
|
|
16
|
Ogino S, Nosho K, Kirkner GJ, et al:
PIK3CA mutation is associated with poor prognosis among patients
with curatively resected colon cancer. J Clin Oncol. 27:1477–1484.
2009. View Article : Google Scholar : PubMed/NCBI
|
|
17
|
Douillard JY, Oliner KS, Siena S,
Tabernero J, et al: Panitumumab-FOLFOX4 treatment and RAS mutations
in colorectal cancer. N Engl J Med. 369:1023–1034. 2013. View Article : Google Scholar : PubMed/NCBI
|
|
18
|
Valentini AM, Pirrelli M and Caruso ML:
EGFR-targeted therapy in colorectal cancer: Does
immunohistochemistry deserve a role in predicting the response to
cetuximab? Curr Opin Mol Ther. 10:124–131. 2008.PubMed/NCBI
|
|
19
|
Scartozzi M, Bearzi I, Mandolesi A, et al:
Epidermal growth factor receptor (EGFR) gene promoter methylation
and cetuximab treatment in colorectal cancer patients. Br J Cancer.
104:1786–1790. 2011. View Article : Google Scholar : PubMed/NCBI
|
|
20
|
Therasse P, Arbuck SG, Eisenhauer EA, et
al: New guidelines to evaluate the response to treatment in solid
tumors. European Organization for Research and Treatment of Cancer,
National Cancer Institute of the United States, National Cancer
Institute of Canada. J Natl Cancer Inst. 92:205–216. 2000.
View Article : Google Scholar : PubMed/NCBI
|
|
21
|
National Cancer Institute. Cancer Therapy
Evaluation Program, Common Terminology Criteria for Adverse Events,
Version 3.0. http://ctep.cancer.gov.
Accessed December 17, 2013
|
|
22
|
De Roock W, Claes B, Bernasconi D, et al:
Effects of KRAS, BRAF, NRAS, and PIK3CA mutations on the efficacy
of cetuximab plus chemotherapy in chemotherapy-refractory
metastatic colorectal cancer: A retrospective consortium analysis.
Lancet Oncol. 11:753–762. 2010. View Article : Google Scholar : PubMed/NCBI
|
|
23
|
Cunningham D, Humblet Y, Siena S, et al:
Cetuximab monotherapy and cetuximab plus irinotecan in
irinotecan-refractory metastatic colorectal cancer. N Engl J Med.
351:337–345. 2004. View Article : Google Scholar : PubMed/NCBI
|
|
24
|
Scartozzi M, Bearzi I, Mandolesi A, et al:
Epidermal growth factor receptor (EGFR) gene copy number (GCN)
correlates with clinical activity of irinotecan-cetuximab in K-RAS
wild-type colorectal cancer: A fluorescence in situ (FISH) and
chromogenic in situ hybridization (CISH) analysis. BMC Cancer.
9:3032009. View Article : Google Scholar : PubMed/NCBI
|
|
25
|
Licitra L, Störkel S, Kerr KM, et al:
Predictive value of epidermal growth factor receptor expression for
first-line chemotherapy plus cetuximab in patients with head and
neck and colorectal cancer: Analysis of data from the EXTREME and
CRYSTAL studies. Eur J Cancer. 49:1161–1168. 2013. View Article : Google Scholar
|
|
26
|
Atkins D, Reiffen KA, Tegtmeier CL,
Winther H, Bonato MS and Störkel S: Immunohistochemical detection
of EGFR in paraffin-embedded tumor tissues: Variation in staining
intensity due to choice of fixative and storage time of tissue
sections. J Histochem Cytochem. 52:893–901. 2004. View Article : Google Scholar : PubMed/NCBI
|
|
27
|
Montero AJ, Díaz-Montero CM, Mao L,
Youssef EM, Estecio M, Shen L and Issa JP: Epigenetic inactivation
of EGFR by CpG island hypermethylation in cancer. Cancer Biol Ther.
5:1494–1501. 2006. View Article : Google Scholar
|