Introduction
Breast cancer is a type of cancer that originates
from breast tissue and most commonly from the inner lining of the
milk ducts or from the lobules that supply the ducts (1). Breast cancer affects ~1.2 million women
worldwide and accounts for ~50,000 mortalities every year (2). Despite major advances in surgical and
nonsurgical management of the disease, breast cancer metastasis
remains a significant clinical challenge affecting numerous of
patients (3). The prognosis and
survival rates for breast cancer are highly variable, and depend on
the cancer type, treatment strategy, stage of the disease and
geographical location of the patient (4).
Microarray technology, which may be used to
simultaneously interrogate 10,000–40,000 genes, has provided new
insight into the molecular classification of different cancer types
(5). Many genes involved in the
regulation of cell cycle, invasion, metastasis and angiogenesis
have been indicated to be prognostic biomarkers based on microarray
analyses. Furthermore, numerous researchers have proposed that the
phenotypic diversity of breast tumors may be accompanied by a
corresponding diversity in gene expression patterns (6). Therefore, the systematic investigation
of gene expression patterns in human breast tumors may aid in
understanding the pathogenesis of this disease (7).
The present study aimed to investigate the
differences between breast cancer cells and normal cells, and
examine the possible underlying mechanisms of breast cancer.
Biological microarray analysis was used to analyze the expression
profile of breast cancer and normal cells, and identify the
differentially expressed genes (DEGs). In addition, altered
metabolic pathways in breast cancer were identified using a
bioinformatics approach, while the target sites of potential
transcription factors and miRNAs were screened. Furthermore, the
current study aimed to improve the understanding of the occurrence
and development of breast cancer and facilitate the discovery of
potential novel biomarkers for its treatment.
Materials and methods
Gene expression microarray
In order to investigate the alterations in breast
cancer cells compared with normal cells, DEGs were screened at the
gene level and the possible mechanisms were examined. The gene
expression series, GSE9574 (8), was
downloaded from the Gene Expression Omnibus (GEO; http://www.ncbi.nlm.nih.gov/geo/) of the National
Center for Biotechnology Information (Bethesda, MD, USA), based on
the GPL96 [HG-U133] platform data (Affymetrix Human Genome U133
Array), and included 14 breast cancer and 15 normal samples.
Identification of DEGs
Microarray data were analyzed using R software
v.2.13.0 (9) and further processed
using Geoquery (10) and Limma
(11) packages. Geoquery is used to
rapidly obtain gene expression profiles from the GEO database
(10), while the Limma package is the
most popular method for the analysis of DEGs (11,12). The
preprocessed expression data were obtained using Geoquery, and
subjected to a log2 transformation. The breast cancer
and normal samples were compared using Limma in order to identify
the DEGs between the two tissue types. Gene P-values were
determined by R software using the Student's t-test and
P<0.001 in a Bayesian model was considered to indicate a DEG
(12).
Gene Ontology (GO) analysis of
DEGs
In order to assess the changes in DEGs occurring at
the cellular level and the functional clustering of DEGs, the GO
Enrichment Analysis Software Toolkit (GOEAST) (13) in the GO database (14) was used. Hypergeometric algorithms were
used for statistical analysis, and terms associated with biological
process and molecular function were enriched.
Bio-pathway analysis of DEGs
In order to detect the changes in DEGs at the
molecular level, all the metabolic and nonmetabolic pathways were
obtained from the Kyoto Encyclopedia of Genes and Genomes (KEGG)
database. Pathway enrichment of DEGs was assessed using the Gene
Set Analysis Toolkit v2 (15,16), and the number of genes was counted for
each term. A gene number of ≥2 and P<0.05 were used as the
cut-off values.
Protein-protein interaction (PPI)
network construction
PPI data were integrated and verified using data
obtained from the following databases (all accessed on November 11,
2012): Human Protein Reference Database (http://www.hprd.org/); Biological General Repository
for Interaction Datasets (http://thebiogrid.org/); Biomolecular Object Network
Databank (http://bond.unleashedinformatics.com/); Database of
Interacting Proteins (http://dip.doe-mbi.ucla.edu/); IntAct (http://www.ebi.ac.uk/intact/); Molecular INTeraction
database (http://mint.bio.uniroma2.it/mint/welcome.do); and
Reactome (http://www.reactome.org/).
Subsequently, a PPI network was constructed based on the identified
DEGs. A hypergeometric algorithm was used, and P<0.05 was
considered to indicate statistically significant differences.
Screening the target sites of
potential transcription factors and miRNAs
Based on the gene annotation data from the Molecular
Signatures Database (http://www.broadinstitute.org/gsea/msigdb/index.jsp;
accessed November 11, 2012), the abundance of the gene sets were
analyzed. In addition, hypergeometric algorithms and false
discovery rate (FDR) correction were performed using the Benjamini
& Hochberg method (17).
FDR<0.05 was selected as the statistical significance threshold
to indicate target sites of potential transcription factors and
miRNAs.
Results
Identification of DEGs in breast
cancer
Using P<0.001 as the statistical significance
threshold, a total of 123 probes were identified, which presented
altered expression levels in breast cancer when compared with
normal tissues, and involved 106 DEGs (Table I).
 | Table I.Differentially expressed genes in
breast cancer tissue as compared with normal tissue. |
Table I.
Differentially expressed genes in
breast cancer tissue as compared with normal tissue.
| Gene symbol | P-value |
|---|
| PTP4A1 |
7.48×10⁻⁹ |
| IER2 |
1.10×10⁻⁸ |
| FOSB |
1.23×10⁻⁸ |
| NR4A3 |
4.97×10⁻⁸ |
| ATF3 |
1.36×10⁻⁷ |
| BTG2 |
1.61×10⁻⁷ |
| NOL12 |
2.01×10⁻⁷ |
| FOS |
2.21×10⁻⁷ |
| TACSTD2 |
5.92×10⁻⁷ |
| H3F3B |
9.46×10⁻⁷ |
| JUN |
1.00×10⁻⁶ |
| EIF1 |
1.17×10⁻⁶ |
| NR4A2 |
1.72×10⁻⁶ |
| DUSP1 |
5.29×10⁻⁶ |
| EIF5 |
7.45×10⁻⁶ |
| TGFB2 |
1.13×10⁻⁵ |
| APOH |
1.31×10⁻⁵ |
| ZFP36 |
2.30×10⁻⁵ |
| GPR183 |
2.34×10⁻⁵ |
| JUND |
2.51×10⁻⁵ |
| EXOC7 |
2.71×10⁻⁵ |
| MCL1 |
2.73×10⁻⁵ |
| REXO4 |
3.17×10⁻⁵ |
| CLDN1 |
3.69×10⁻⁵ |
| HEY2 |
4.63×10⁻⁵ |
| KLF6 |
5.98×10⁻⁵ |
| CYLD |
6.32×10⁻⁵ |
| SH3BP2 |
6.76×10⁻⁵ |
| SERPINE1 |
7.88×10⁻⁵ |
| HIST2H2BE |
8.21×10⁻⁵ |
| PRR5-ARHGAP8 /
ARHGAP8 |
8.36×10⁻⁵ |
| EGR1 |
9.68×10⁻⁵ |
| KLF4 |
1.09×10⁻⁴ |
| IL5RA |
1.24×10⁻⁴ |
| PMAIP1 |
1.33×10⁻⁴ |
| FANCG |
1.35×10⁻⁴ |
| NOS1AP |
1.65×10⁻⁴ |
| C1orf50 |
1.69×10⁻⁴ |
| MUM1 |
1.69×10⁻⁴ |
| STK17B |
1.72×10⁻⁴ |
| ILF3 |
1.91×10⁻⁴ |
| CLNS1A |
2.01×10⁻⁴ |
| BHLHE40 |
2.21×10⁻⁴ |
| ATP2B2 |
2.30×10⁻⁴ |
| TSC22D2 |
2.31×10⁻⁴ |
| LAGE3 |
2.35×10⁻⁴ |
| ZNHIT1 |
2.25×10⁻⁴ |
| CXCL2 |
2.60×10⁻⁴ |
| UNC119B |
2.62×10⁻⁴ |
| C9orf3 |
2.78×10⁻⁴ |
| GBAP1 |
2.85×10⁻⁴ |
| TTC38 |
2.86×10⁻⁴ |
| IL8 |
2.86×10⁻⁴ |
| SAFB2 |
2.98×10⁻⁴ |
| SPATS2L |
3.01×10⁻⁴ |
| MST1P9 |
3.12×10⁻⁴ |
| CCL2 |
3.16×10⁻⁴ |
| AKR7A2 |
3.34×10⁻⁴ |
| LSR |
3.35×10⁻⁴ |
| DNAJB4 |
3.38×10⁻⁴ |
| KLF11 |
3.42×10⁻⁴ |
| TP53TG1 |
3.60×10⁻⁴ |
| GNAS |
3.79×10⁻⁴ |
| CD69 |
3.90×10⁻⁴ |
| NR4A1 |
3.92×10⁻⁴ |
| TIMM23 /
TIMM23B |
4.22×10⁻⁴ |
| JUNB |
4.30×10⁻⁴ |
| FGF20 |
4.49×10⁻⁴ |
| HIC2 |
4.51×10⁻⁴ |
| GP6 |
4.53×10⁻⁴ |
| SIK1 |
4.77×10⁻⁴ |
| PGS1 |
4.77×10⁻⁴ |
| SIDT2 |
4.89×10⁻⁴ |
| IL33 |
5.04×10⁻⁴ |
| FLRT2 |
5.05×10⁻⁴ |
| TRAIP |
5.10×10⁻⁴ |
| PLXND1 |
5.21×10⁻⁴ |
| YWHAZ |
5.55×10⁻⁴ |
| LINC00094 |
5.60×10⁻⁴ |
| ZNF451 |
5.90×10⁻⁴ |
| ZNF232 |
6.16×10⁻⁴ |
| DUSP2 |
6.24×10⁻⁴ |
| EBLN2 |
6.31×10⁻⁴ |
| XPNPEP1 |
6.40×10⁻⁴ |
| FAM46C |
6.61×10⁻⁴ |
| PDE4B |
6.77×10⁻⁴ |
| RBM14 |
6.79×10⁻⁴ |
| RGS1 |
6.83×10⁻⁴ |
| SLC33A1 |
7.28×10⁻⁴ |
| SLC35E2 |
7.34×10⁻⁴ |
| CNDP2 |
7.43×10⁻⁴ |
| GTF2H1 |
7.64×10⁻⁴ |
| CARKD |
7.77×10⁻⁴ |
| CCNL1 |
7.78×10⁻⁴ |
| CDC42 |
7.84×10⁻⁴ |
| TAF1D |
8.08×10⁻⁴ |
| CLGN |
8.22×10⁻⁴ |
| SGSM2 |
8.23×10⁻⁴ |
| KIF1A |
8.48×10⁻⁴ |
| NRAS |
8.87×10⁻⁴ |
| KLF10 |
8.96×10⁻⁴ |
| ORC5 |
9.17×10⁻⁴ |
| CCDC170 |
9.41×10⁻⁴ |
| C14orf105 |
9.54×10⁻⁴ |
| MORC2 |
9.74×10⁻⁴ |
| EIF4A1 |
9.99×10⁻⁴ |
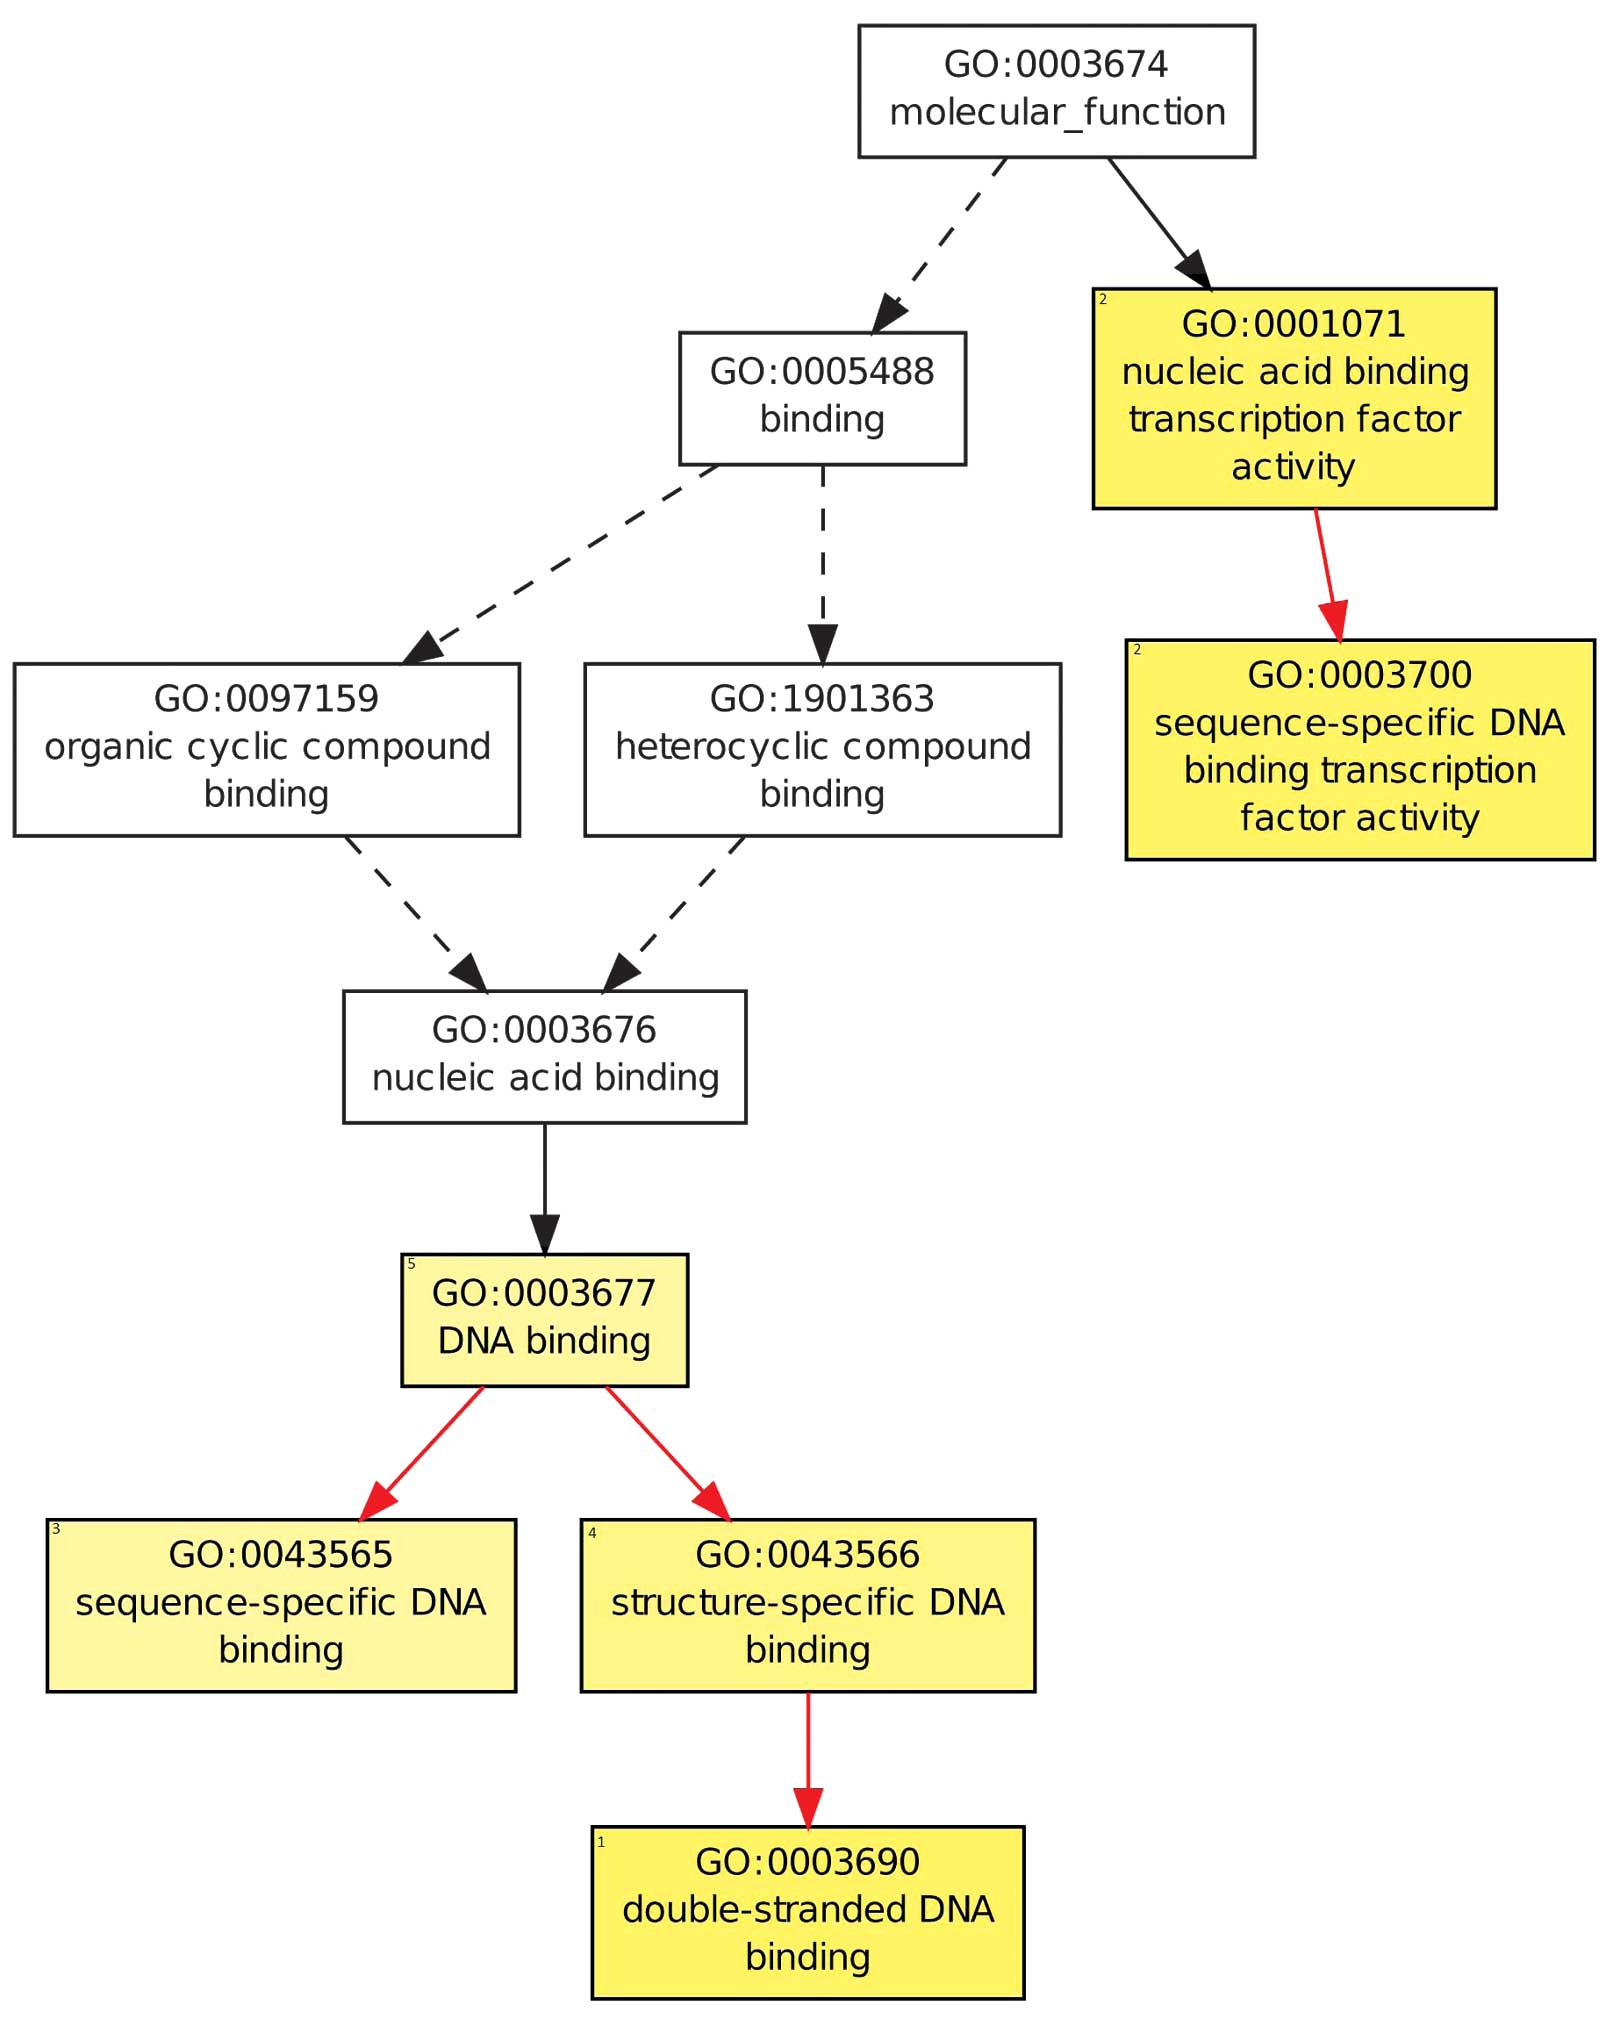
GO cluster of DEGs
The molecular functions enriched in the identified
DEGs included nucleic acid binding transcription factor activity,
sequence-specific DNA binding transcription factor activity and
double-stranded DNA binding (Fig. 1).
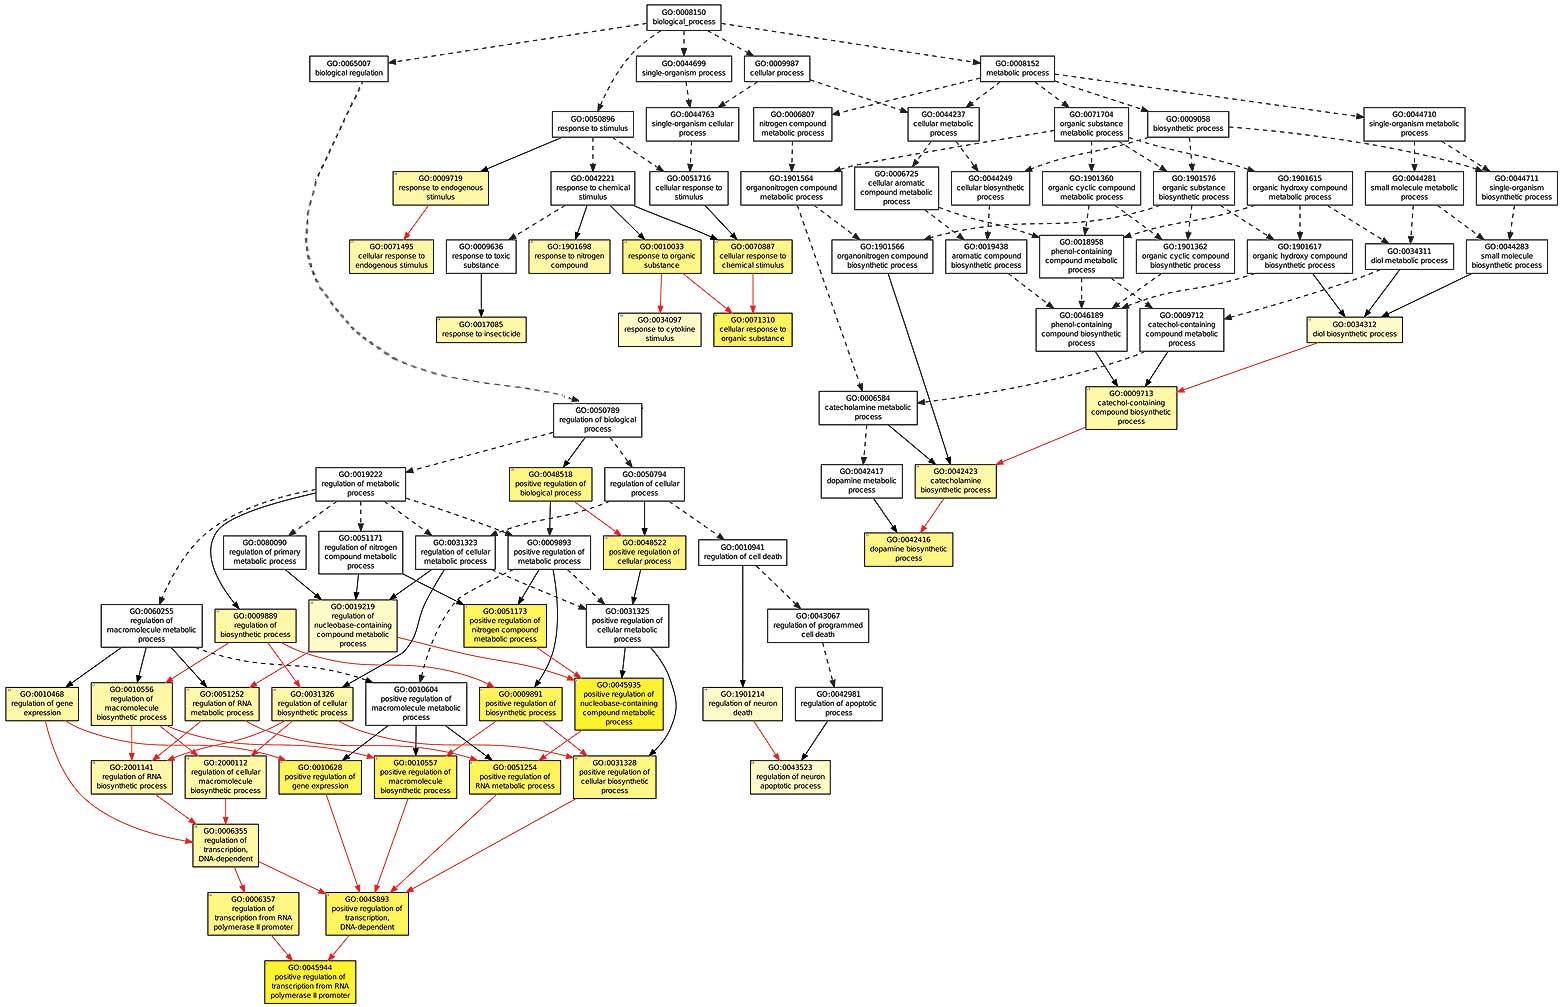
In addition, the biological processes enriched are shown in
Fig. 2, and include positive
regulation of biological process, positive regulation of cellular
process, cellular response to organic substance and positive
regulation of transcription from RNA polymerase II promoter. The GO
clustering results provide a preliminary description of the
potential functions of the DEGs and their effects on cells.
Bio-pathways altered in breast
cancer
To further investigate changes of the biological
pathways within cancer cells in detail, a KEGG pathway enrichment
analysis of the identified DEGs was performed. KEGG clustering
results indicated that a number of bio-pathways were altered in
breast cancer cells, primarily signaling and disease-associated
pathways (Table II). The alteration
of the RNA transport pathway was consistent with the GO clustering
results, suggesting that gene expression in breast cancer cells
differs from that in normal cells. In addition, signaling pathways
in the cell surface were altered, including the nucleotide-binding
oligomerization domain (NOD)-like receptor signaling pathway,
epithelial cell signaling in Helicobacter pylori infection,
chemokine signaling pathway, T cell receptor signaling pathway and
B cell receptor signaling pathway. The latter three are involved in
immune reactions, while the NOD-like receptor signaling pathway is
closely associated with cell differentiation and development.
Alterations in other metabolic pathways were also indicated,
including the mismatch repair pathway, proteasome, metabolic
pathways, glutathione metabolism and glycolysis/gluconeogenesis.
Notably, KEGG clustering results indicated that a number of other
disease pathways may also be altered, including Chagas disease
(American trypanosomiasis), osteoclast differentiation, rheumatoid
arthritis, renal cell carcinoma, pathogenic Escherichia coli
infection, malaria, colorectal cancer, pathways in cancer and
leishmaniasis.
| Table II.Bio-pathways altered in breast
cancer. |
Table II.
Bio-pathways altered in breast
cancer.
| KEGG pathway | P-value |
|---|
| MAPK signaling
pathway | 0.0006 |
| Chagas disease
(American trypanosomiasis) | 0.0006 |
| Osteoclast
differentiation | 0.0009 |
| Rheumatoid
arthritis | 0.0048 |
| Renal cell
carcinoma | 0.0202 |
| NOD-like receptor
signaling pathway | 0.0432 |
| GnRH signaling
pathway | 0.0432 |
| Pathogenic
Escherichia coli infection | 0.0432 |
| Malaria | 0.0432 |
| T cell receptor
signaling pathway | 0.0432 |
| Chemokine signaling
pathway | 0.0441 |
| Colorectal
cancer | 0.0445 |
| Epithelial cell
signaling in Helicobacter pylori infection | 0.0445 |
| Neurotrophin
signaling pathway | 0.0445 |
| Pathways in
cancer | 0.0445 |
| Leishmaniasis | 0.0475 |
| RNA transport | 0.0475 |
| B-cell receptor
signaling pathway | 0.0475 |
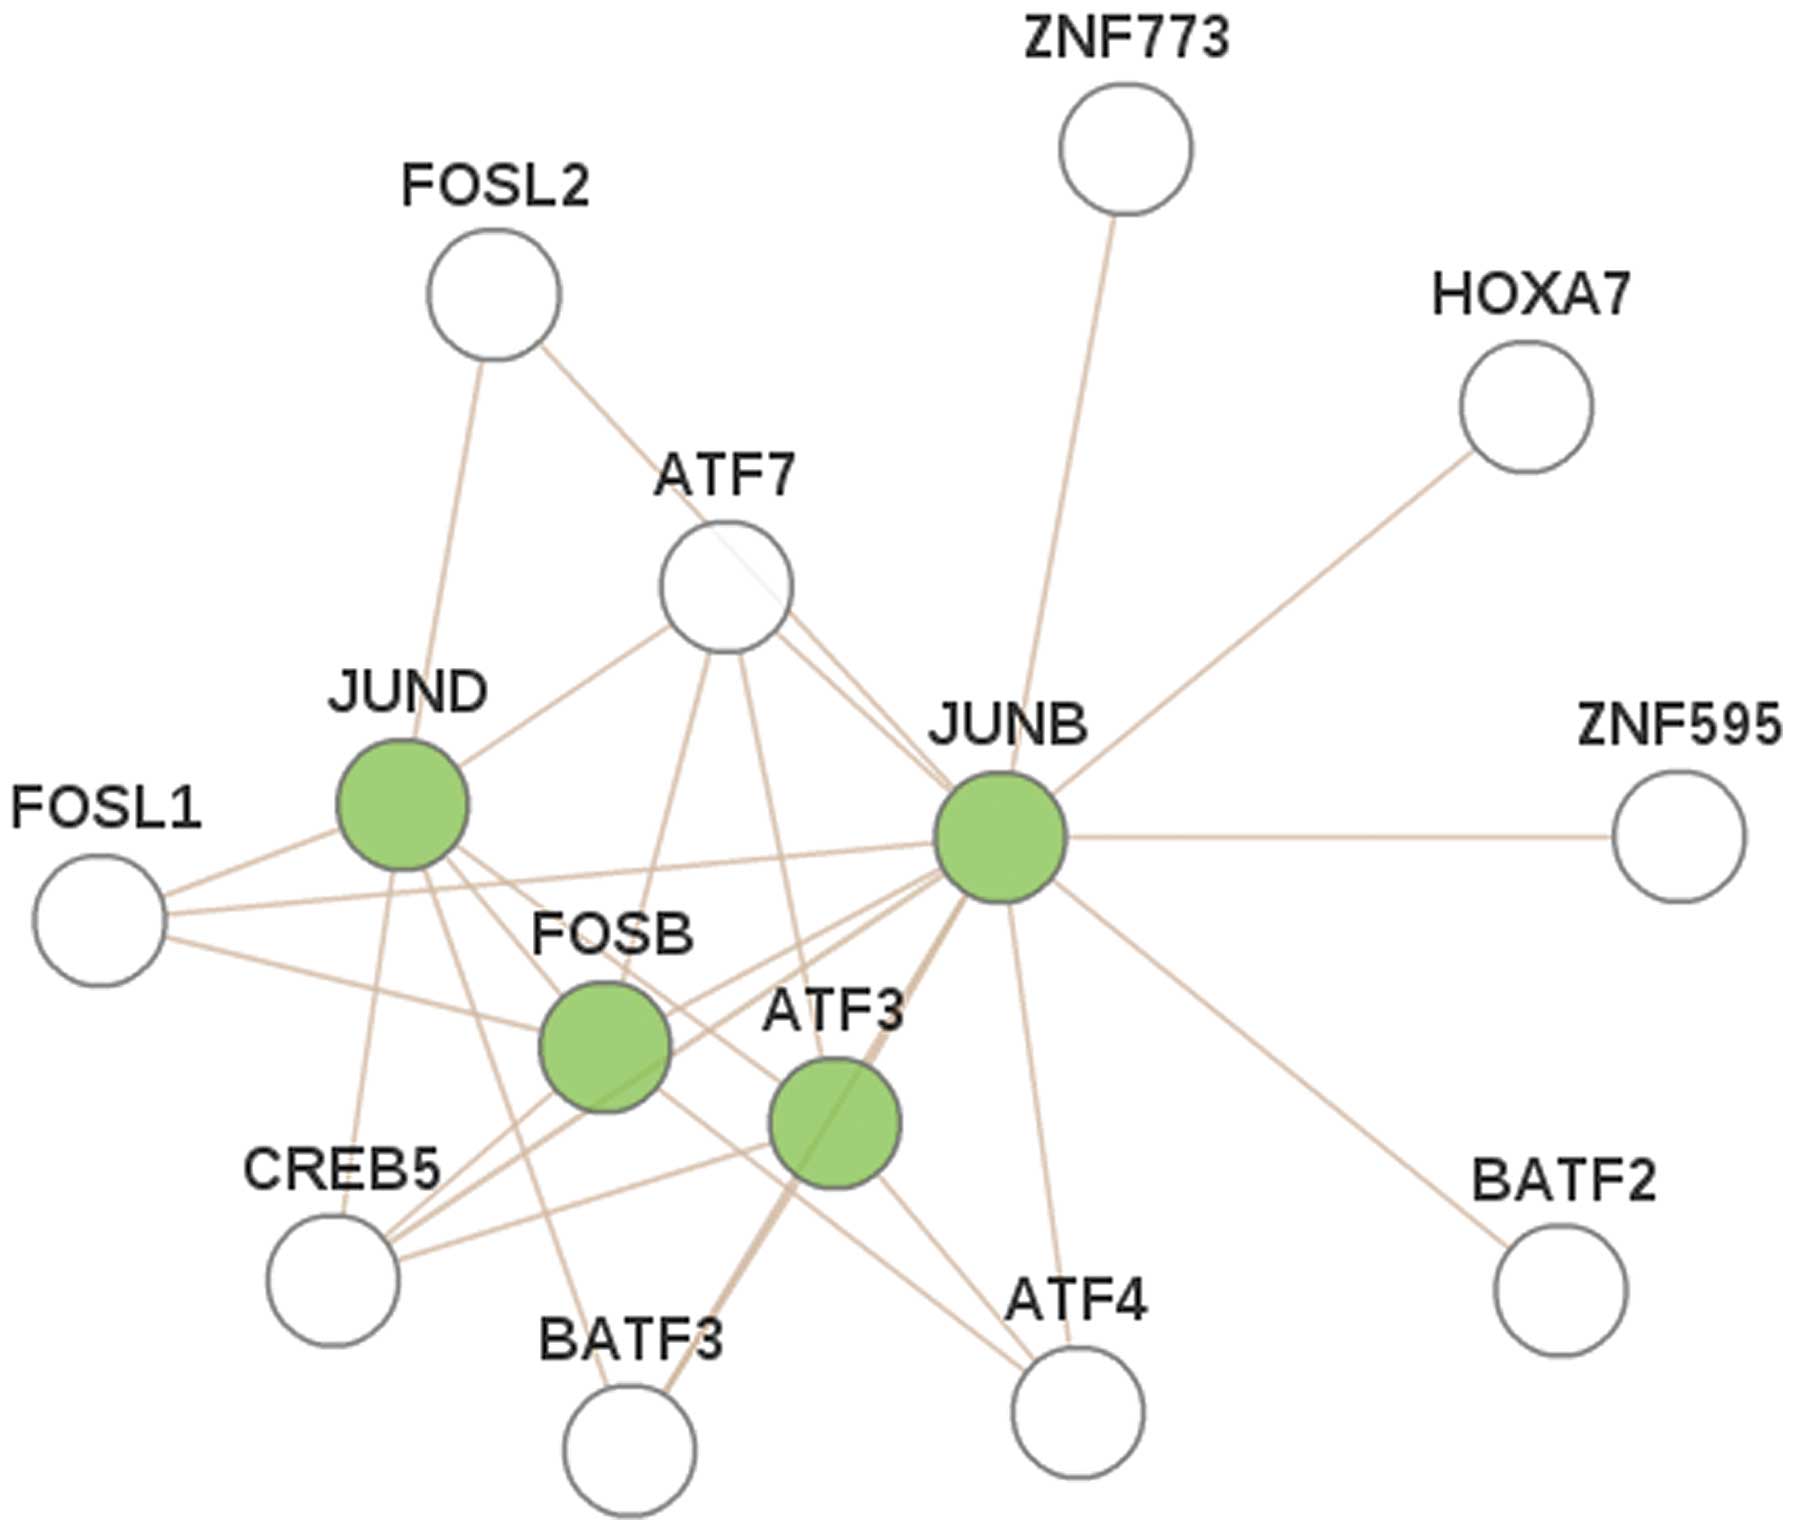
Construction and analysis of PPI
network
Four DEGs (JUND, JUNB, FOSB and
ATF3) were found to exhibit close associations with other
genes, via the proteins identified to construct the PPI network
(Fig. 3). These results show that the
four DEGs interact indirectly, indicating that they may exhibit a
joint role in the pathogenesis of breast cancer.
Screening of target sites of potential
transcription factors
The expression of transcription factors affects the
regulation downstream gene expression. Exploring the target sites
of possible transcription factors is of great importance. The
target sites of potential transcription factors were explored, and
the ten most significant sites are listed in Table III. As shown in Table III, FOSB, ATF3 and
JUND shared the same binding sites [Homo sapiens
(hsa)_V$ATF_01 and hsa_V$ATF3_Q6]. Therefore, the regulation of
these binding sites may present a potential treatment for breast
cancer by controlling the expression of FOSB, ATF3
and JUND.
| Table III.Target sites of potential
transcription factors. |
Table III.
Target sites of potential
transcription factors.
| Target | P-value | Gene count | Gene symbols |
|---|
| hsa_V$CREB_Q2 |
3.51×10⁻⁷ | 20 | GNAS, EGR1,
CDC42, CYLD, FOSB, ATF3, FOS |
| hsa_V$CREB_02 |
1.18×10⁻⁶ | 16 | C9orf3, FOSB,
NR4A2, DUSP1, JUND |
| hsa_V$CREB_Q4 |
9.21×10⁻⁶ | 15 | GNAS, CDC42,
EIF1, NR4A2, ATF3, FOS |
| hsa_V$ATF_01 |
9.21×10⁻⁶ | 15 | EIF1, FOSB,
NR4A2, ATF3, SIK1, FOS, JUND |
| hsa_V$E4F1_Q6 |
1.10×10⁻⁵ | 16 | GNAS, NR4A2,
EIF1, FOSB, EIF4A1, HIC2 |
|
hsa_V$TAXCREB_01 |
1.10×10⁻⁵ | 10 | CYLD, CDC42,
FOSB, FOS, JUND, DUSP1 |
|
hsa_GTGACGY_V$E4F1_Q6 |
2.86×10⁻⁵ | 22 | GNAS, PTP4A1,
NR4A3, EGR1, JUNB, EIF1, JUND |
|
hsa_V$CREB_Q2_01 |
4.56×10⁻⁵ | 16 | JUN, CYLD, EGR1,
FOSB, NR4A1, DUSP1 |
| hsa_V$SRF_C |
4.56×10⁻⁵ | 13 | DUSP2, IER2,
EGR1, JUNB, FOSB, KLF6, FOS |
| hsa_V$ATF3_Q6 |
1.00×10⁻⁴ | 13 | JUN, CYLD,
CDC42, FOSB, ATF3, JUND |
Screening of potential miRNAs
miRNAs regulate gene expression by controlling the
stability of RNA. Therefore, identifying the regulatory miRNAs of
specific DEGs may increase understanding with regard to the
involvement of miRNAs in breast cancer. Potential regulatory miRNAs
were analyzed based on the sequences of the DEGs, and the target
sites with P-values of <0.05 are listed in Table IV. The regulatory miRNAs of two
target sites, hsa_AGCACTT and hsa_ACTTTAT, were collected, which
included miR-93, miR-302A, miR-302B, miR-302C, miR-373 and miR-520.
These miRNAs may present potential therapeutic targets for breast
cancer treatment.
| Table IV.Potential miRNAs of differentially
expressed genes with P<0.05. |
Table IV.
Potential miRNAs of differentially
expressed genes with P<0.05.
| Target
sequence | Potential
miRNAs | P-value |
|---|
| hsa_AGCACTT | miR-93, miR-302A,
miR-302B, miR-302C, miR-302D, miR-372, miR-373 | 0.0182 |
| miR-520E, miR-520A,
miR-526B, miR-520B, miR-520C, miR-520D | |
| hsa_ACTTTAT | miR-142-5P | 0.0182 |
Discussion
Breast cancer, similar to other cancer types, occurs
due to an interaction between the environment and a defective gene
(3). The incidence of breast cancer
is increasing rapidly in the majority of Asian countries (18). Worldwide, breast cancer accounts for
22.9% of all cancer cases (excluding nonmelanoma skin cancers) in
females. In 2008, breast cancer was the cause of 458,503
mortalities worldwide (13.7% of cancer-associated mortalities in
females) (2). Therefore, the study of
breast cancer has important significance for human health. In the
present study, a total of 106 DEGs between breast cancer and normal
cells were identified. With regard to molecular function, the
identified DEGs were predominantly involved in DNA-binding and
regulation of downstream gene expression, as well as in metabolic
and synthetic pathways. In terms of bio-pathways,
signaling-associated pathways and other disease-associated pathways
were found to be altered. ATF3, JUND, FOSB and
JUNB were the only four genes composing the PPI network of
DEGs. Finally, the most significant target sites of potential
transcription factors and miRNAs in breast cancer were
identified.
Functionally, the differential expression of genes
results in a variety of abnormal physiological processes, including
alterations in gene expression regulation, RNA transcription and
protein translation processes (19,20). In
the present study, changes in the RNA transport pathway were
consistent with the GO clustering results, indicating that gene
expression in breast cancer cells differs from that in normal
cells. In addition, by KEGG clustering, a number of bio-pathways
were revealed to be altered in breast cancer. Among the altered
cell surface signaling pathways, alteration of the NOD-like
receptor signaling pathway may be an important mechanism involved
in the abnormal differentiation of breast cancer cells. By
contrast, changes associated with the immune response, including
the T cell receptor, the chemokine and the B-cell receptor
signaling pathways, may be involved in the evasion of autoimmunity
of breast cancer cells. In addition, the MAPK signaling pathway,
which was also enriched, transports extracellular signals into the
intracellular environment, and may affect downstream gene
expression in breast cancer cells (21). Alterations in the aforementioned
pathways may result in changes to a number of other metabolic
signaling pathways, including the GnRH and the neurotrophin
signaling pathways. In addition, differences in the mismatch repair
pathway indicated that the self-repair capacity may be affected.
Changes in proteasome, metabolic pathways, glutathione metabolism
and glycolysis/gluconeogenesis further confirmed the results of the
GO clustering analysis, which indicated that the metabolic
capability of breast cancer cells was altered compared with that of
normal cells.
ATF3 is a member of the mammalian activation
transcription factor/cyclic adenosine monophosphate responsive
element-binding protein family, which is induced by numerous
signals in cancer tissues (22). The
ATF3 product forms the activator protein 1 complex by
interacting with the protein products of JUND, FOSB
and JUNB, thus regulating the expression of downstream genes
in response to cytokines, growth factors and cell stress (23). Certain studies have demonstrated that
it may be involved in the resistance to p53-dependent cellular
senescence and apoptosis (24).
Therefore, the existence of the PPI network formed by ATF3,
JUND, FOSB and JUNB may result in the
inability of the p53 pathway to kill breast cancer cells.
Of the screened transcription factors, the majority
are associated with cylindromatosis, cell division cycle 42,
FOSB, nuclear receptor subfamily 4 and JUND. Among
these genes, JUND has been proposed to protect cells from
p53-dependent senescence and apoptosis (25), while FOSB has been implicated
as a regulator of cell proliferation, differentiation and
transformation (26) These genes are
key factors in the pathogenesis of cancer, and the identification
of associated transcription factors may help to elucidate the
underlying mechanisms of breast cancer.
In the current study, miR-93 was identified as a
potential regulatory miRNA of the DEGs in breast cancer. It has
been reported that miR-93 is the substrate of caspase-3 during
apoptosis (27). In the present
study, miR-93 was found to be a potential tumor suppressor using
bioinformatics. In addition, miR-302A has been strongly linked with
the hypoxia pathway and is upregulated in response to
hypoxia-inducible factors (28).
Furthermore, this miRNA is also overexpressed in breast tumor cells
and was found to be a potential regulatory miRNA of certain DEGs in
breast cancer in the current study. miR-302B, a frequently
amplified miRNA, is associated with intrahepatic metastasis of
hepatocellular carcinoma (29). A
previous study identified that miR-302C suppresses the expression
of the prostate-specific antigen and prostate cancer cell
proliferation (30). The results of
the present study suggested that the role of miR-302C in breast
cancer was consistent with its role in prostate cancer.
Furthermore, a previous study has demonstrated that miR-373 is
involved in the development of normal and cancer cells (31). In breast cancer tissues, miR-373
(31) is downregulated compared with
normal breast tissues, which is consistent with the results of the
current study. miR-520 is a short RNA molecule (32), with only a limited number of studies
investigating its role in cancer; however, the present study
identified that it may be involved in breast cancer.
In conclusion, a large number of DEGs in breast
cancer share the same transcription factors and miRNAs. The target
sites of these molecules may be important in the regulation of DEG
expression. Therefore, regulating the expression of these genes
through the aforementioned target sites may contribute towards the
development of novel treatments for breast cancer.
References
|
1
|
Sariego J: Breast cancer in the young
patient. Am Surg. 76:1397–1400. 2010.PubMed/NCBI
|
|
2
|
Boyle P and Levin B: World Health
Organization: World Cancer Report 2008. IARC Press; Lyon: pp.
42–43. 2008
|
|
3
|
Al-Hajj M, Wicha MS, Benito-Hernandez A,
Morrison SJ and Clarke MF: Prospective identification of
tumorigenic breast cancer cells. Proc Natl Acad Sci USA.
100:3983–3988. 2003. View Article : Google Scholar : PubMed/NCBI
|
|
4
|
Sant M, Allemani C, Capocaccia R,
Hakulinen T, Aareleid T, Coebergh JW, Coleman MP, Grosclaude P,
Martinez C, Bell J, et al: EUROCARE Working Group: Stage at
diagnosis is a key explanation of differences in breast cancer
survival across Europe. Int J Cancer. 106:416–422. 2003. View Article : Google Scholar : PubMed/NCBI
|
|
5
|
Sotiriou C, Neo SY, McShane LM, Korn EL,
Long PM, Jazaeri A, Martiat P, Fox SB, Harris AL and Liu ET: Breast
cancer classification and prognosis based on gene expression
profiles from a population-based study. Proc Natl Acad Sci USA.
100:10393–10398. 2003. View Article : Google Scholar : PubMed/NCBI
|
|
6
|
Perou CM, Sørlie T, Eisen MB, et al:
Molecular portraits of human breast tumours. Nature. 406:747–752.
2000. View
Article : Google Scholar : PubMed/NCBI
|
|
7
|
Hu Z, Fan C, Oh DS, Marron JS, He X,
Qaqish BF, Livasy C, Carey LA, Reynolds E, Dressler L, et al: The
molecular portraits of breast tumors are conserved across
microarray platforms. BMC Genomics. 7:962006. View Article : Google Scholar : PubMed/NCBI
|
|
8
|
Tripathi A, King C, de la Morenas A, Perry
VK, Burke B, Antoine GA, Hirsch EF, Kavanah M, Mendez J, Stone M,
et al: Gene expression abnormalities in histologically normal
breast epithelium of breast cancer patients. Int J Cancer.
122:1557–1566. 2008. View Article : Google Scholar : PubMed/NCBI
|
|
9
|
R Development Core Team, . R: a language
and environment for statistical computing. http://www.R-project.orgThe R Foundation for
Statistical Computing; Vienna, Austria: 2013
|
|
10
|
Davis S and Meltzer PS: GEOquery: a bridge
between the Gene Expression Omnibus (GEO) and BioConductor.
Bioinformatics. 23:1846–1847. 2007. View Article : Google Scholar : PubMed/NCBI
|
|
11
|
Diboun I, Wernisch L, Orengo CA and
Koltzenburg M: Microarray analysis after RNA amplification can
detect pronounced differences in gene expression using limma. BMC
Genomics. 7:2522006. View Article : Google Scholar : PubMed/NCBI
|
|
12
|
Smyth GK: Linear models and empirical
bayes methods for assessing differential expression in microarray
experiments. Stat Appl Genet Mol Biol. 3:e32004.
|
|
13
|
Zheng Q and Wang XJ: GOEAST: a web-based
software toolkit for Gene Ontology enrichment analysis. Nucleic
Acids Res. 36:W358–W363. 2008. View Article : Google Scholar : PubMed/NCBI
|
|
14
|
Ashburner M, Ball CA, Blake JA, Botstein
D, Butler H, Cherry JM, Davis AP, Dolinski K, Dwight SS, Eppig JT,
et al: The Gene Ontology Consortium: Gene ontology: Tool for the
unification of biology. Nat Genet. 25:25–29. 2000. View Article : Google Scholar : PubMed/NCBI
|
|
15
|
Zhang B, Kirov S and Snoddy J: WebGestalt:
an integrated system for exploring gene sets in various biological
contexts. Nucleic Acids Res. 33:W741–W748. 2005. View Article : Google Scholar : PubMed/NCBI
|
|
16
|
Duncan D, Prodduturi N and Zhang B:
WebGestalt2: an updated and expanded version of the Web-based Gene
Set Analysis Toolkit. BMC Bioinformatics. 11:102010. View Article : Google Scholar : PubMed/NCBI
|
|
17
|
Benjamini Y and Hochberg Y: Controlling
the false discovery rate: a practical and powerful approach to
multiple testing. J R Statist Soc B. 57:289–300. 1995.
|
|
18
|
Tavassoli FA and Devilee P: World Health
Organization Classification of Tumours: Pathology and Genetics of
Tumours of the Breast and Female Genital Organs. IARC Press; Lyon,
France: pp. 116–119. 2003
|
|
19
|
Thomas EA, Coppola G, Desplats PA, et al:
The HDAC inhibitor 4b ameliorates the disease phenotype and
transcriptional abnormalities in Huntington's disease transgenic
mice. Proc Natl Acad Sci USA. 105:15564–15569. 2008. View Article : Google Scholar : PubMed/NCBI
|
|
20
|
Greenbaum D, Colangelo C, Williams K and
Gerstein M: Comparing protein abundance and mRNA expression levels
on a genomic scale. Genome Biol. 4:1172003. View Article : Google Scholar : PubMed/NCBI
|
|
21
|
Menendez JA, Vellon L, Mehmi I, Teng PK,
Griggs DW and Lupu R: A novel CYR61-triggered ‘CYR61-alphavbeta3
integrin loop’ regulates breast cancer cell survival and
chemosensitivity through activation of ERK1/ERK2 MAPK signaling
pathway. Oncogene. 24:761–779. 2005. View Article : Google Scholar : PubMed/NCBI
|
|
22
|
Gilchrist M, Thorsson V, Li B, Rust AG,
Korb M, Roach JC, Kennedy K, Hai T, Bolouri H and Aderem A: Systems
biology approaches identify ATF3 as a negative regulator of
Toll-like receptor 4. Nature. 441:173–178. 2006. View Article : Google Scholar : PubMed/NCBI
|
|
23
|
Shaulian E and Karin M: AP-1 as a
regulator of cell life and death. Nat Cell Biol. 4:E131–E136. 2002.
View Article : Google Scholar : PubMed/NCBI
|
|
24
|
Malkin D, Li FP, Strong LC, Fraumeni JF
Jr, Nelson CE, Kim DH, Kassel J, Gryka MA, Bischoff FZ, Tainsky MA,
et al: Germ line p53 mutations in a familial syndrome of breast
cancer, sarcomas, and other neoplasms. Science. 250:1233–1238.
1990. View Article : Google Scholar : PubMed/NCBI
|
|
25
|
Sharma SC and Richards JS: Regulation of
AP1 (Jun/Fos) factor expression and activation in ovarian granulosa
cells. Relation of JunD and Fra2 to terminal differentiation. J
Biol Chem. 275:33718–33728. 2000. View Article : Google Scholar : PubMed/NCBI
|
|
26
|
McClung CA and Nestler EJ: Regulation of
gene expression and cocaine reward by CREB and DeltaFosB. Nat
Neurosci. 6:1208–1215. 2003. View
Article : Google Scholar : PubMed/NCBI
|
|
27
|
Yeung ML, Yasunaga J, Bennasser Y, Dusetti
N, Harris D, Ahmad N, Matsuoka M and Jeang KT: Roles for microRNAs,
miR-93 and miR-130b, and tumor protein 53-induced nuclear protein 1
tumor suppressor in cell growth dysregulation by human T-cell
lymphotrophic virus 1. Cancer Res. 68:8976–8985. 2008. View Article : Google Scholar : PubMed/NCBI
|
|
28
|
Card DAG, Hebbar PB, Li L, Trotter KW,
Komatsu Y, Mishina Y and Archer TK: Oct4/Sox2-regulated miR-302
targets cyclin D1 in human embryonic stem cells. Mol Cell Biol.
28:6426–6438. 2008. View Article : Google Scholar : PubMed/NCBI
|
|
29
|
Suh M-R, Lee Y, Kim JY, Kim SK, Moon SH,
Lee JY, Cha KY, Chung HM, Yoon HS, Moon SY, et al: Human embryonic
stem cells express a unique set of microRNAs. Dev Biol.
270:488–498. 2004. View Article : Google Scholar : PubMed/NCBI
|
|
30
|
Greco SJ and Rameshwar P: MicroRNAs
regulate synthesis of the neurotransmitter substance P in human
mesenchymal stem cell-derived neuronal cells. Proc Natl Acad Sci
USA. 104:15484–15489. 2007. View Article : Google Scholar : PubMed/NCBI
|
|
31
|
Huang Q, Gumireddy K, Schrier M, le Sage
C, Nagel R, Nair S, Egan DA, Li A, Huang G, Klein-Szanto AJ, et al:
The microRNAs miR-373 and miR-520c promote tumour invasion and
metastasis. Nat Cell Biol. 10:202–210. 2008. View Article : Google Scholar : PubMed/NCBI
|
|
32
|
Keklikoglou I, Koerner C, Schmidt C, Zhang
JD, Heckmann D, Shavinskaya A, Allgayer H, Gückel B, Fehm T,
Schneeweiss A, et al: MicroRNA-520/373 family functions as a tumor
suppressor in estrogen receptor negative breast cancer by targeting
NF-κB and TGF-β signaling pathways. Oncogene. 31:4150–4163. 2012.
View Article : Google Scholar : PubMed/NCBI
|