Introduction
Glioblastoma multiforme (GBM), the most frequently
encountered primary malignant tumor of the central nervous system,
has an extremely poor prognosis in spite of treatments including
surgery, radiotherapy, chemotherapy and immunotherapy. GBM is
characterized by uncontrolled cell growth and diffused infiltration
of adjacent normal brain tissues, making complete surgical
resection virtually impossible and relapse inevitable. The 2-year
survival rate of GBM patients is no more than 27% even for those
patients treated with radiotherapy plus temozolomide (1). Therefore, there is an urgent need for
developing novel therapeutic strategies for glioblastomas.
Currently, gene therapy is considered a new possible approach.
The human leucine-rich repeats and
immunoglobulin-like domains (LRIG) gene family consists of 3
homologous genes, LRIG1, LRIG2 and LRIG3, which were observed to be
widely expressed in human tissues (2,3). The
first identified member in this family, the LRIG1 gene, located at
chromosomal band 3p14, a common region where homozygous deletions
often occur in several types of tumors, demonstrated high
expression in the brain relative to other tissues (4–6). When
compared with the corresponding normal tissues, LRIG1 expression
appeared reduced or even absent in several types of tumors
(7–10). It has been reported that LRIG1
enhanced the ubiquitylation and degradation of epidermal growth
factor receptor (EGFR) and was involved as a negative feedback
attenuator of the EGFR-mediated signaling (11). The LRIG1 gene has been proposed as a
tumor suppressor and a prognostic predictor in several types of
tumors (12–14). To date, a survey of public data
demonstrates that LRIG1 gene expression does not reveal a general
downregulation in human tumors. For example, the overexpression of
the LRIG1 gene has been observed in prostate cancers (15,16),
leukemia and astrocytoma (17)
compared to the corresponding normal tissues.
As to the effect of LRIG1 on glioblastoma, our
previous study demonstrated that the upregulation of LRIG1
expression induced apoptosis and suppressed the growth of glioma
cells (18). Moreover, we
discovered that the perinuclear localization of the LRIG1 protein
in astrocytic tumors was associated with low WHO grade and better
survival of the patients (19). The
effect of LRIG1 knockdown on the malignant properties of glioma
cells and the underlying mechanism has yet to be reported. In this
study, we designed two short hairpin RNA (shRNA) plasmids targeting
the LRIG1 gene and successfully transfected them into a human
glioblastoma cell line, GL15. The transfected cells demonstrated a
markedly decreased expression levels of LRIG1 mRNA and protein. The
specific and effective downregulation of LRIG1 resulted in a
significantly increased proliferative rate, decreased apoptosis and
increased invasive capability of GL15 cells. We also explored the
possible underlying mechanisms of the effects of LRIG1 knockdown.
We demonstrated that LRIG1 downregulation notably increased the
activation of EGFR, AKT and c-Myc. These results demonstrated that
LRIG1 downregulation promoted the malignant properties of glioma
cells by enhancing the activation of EGFR/Akt/c-Myc and led to the
proposal that LRIG1 may act as a tumor-suppressor gene in
glioblastoma.
Materials and methods
Cell line and culture
The human glioblastoma GL15 cell line was kindly
donated by Dr Håkan Hedman (Umeå University Hospital). GL15 cells
were maintained in Dulbecco’s modified Eagle’s medium (DMEM)
supplemented with 10% (v/v) fetal bovine serum (FBS) (Hyclone,
Logan, UT, USA) under a humidified atmosphere of 5% CO2
at 37°C. The medium was replaced normally every 3 days. Cells were
passaged every 5 or 6 days and routinely examined.
Vector-based plamid construction for
short hairpin RNAs
The full-length sequence of human LRIG1 mRNA was
obtained from Genbank (accession: NM_015541)(4). Short interfering RNAs (siRNAs)
targeting against LRIG1 were designed by means of a web server
(http://jura.wi.mit.edu/bioc/siRNA)
(20) and according to the
principle of Tuschl (21). Two
target sequences were selected from the screening results and
synthesized as documented in Table
I. One unspecific sequence with no homology to any
human-derived gene was also synthesized as the negative control to
provide a baseline for experiments. The structure of the
oligonucleotides is BamHI + sense chain + loop + antisense
chain + termination signal + SalI + HindIII. The
hairpin siRNA inserts were separately ligated into
BamHI-HindIII linearized pGenesil-2 vector (Genesil
Corp., Wuhan, China) according to the manufacturer’s instructions.
All the inserted sequences were verified by DNA sequencing. Each
constructed plasmid contains the neomycin/kanamycin-resistance gene
to enable the selection of kanamycin-resistant colonies in bacteria
and G418-resistant clones in mammalian cells. The RNA interference
(RNAi) plasmid DNAs for LRIG1 and the negative control were then
prepared for cell transfection.
 | Table IOligonucleotide sequences of
LRIG1-specific siRNA. |
Table I
Oligonucleotide sequences of
LRIG1-specific siRNA.
| Name | siRNA sequences
(5′→3′) | Target nucleotide
sites on LRIG1 cDNA |
|---|
| pGenesil2-negative
control |
ACTACCGTTGTTATAGGTG | |
| pGenesil2-LRIG1
siRNA1 |
ACTCTCTGAGATTGACCCT | 249–267 |
| pGenesil2-LRIG1
siRNA2 |
GGCCTACCTTTCCTTAGAA | 420–438 |
Stable transfection of GL15 cells with
pGenesil2-LRIG1 shRNA
GL15 cells were seeded on 6-well culture plates at
3×10⁵ cell/well, maintained in DMEM containing 10% (v/v)
FBS and grown to 85–95% confluency. Metafectene transfection agents
(Biontex, Munich, Germany) were then used to perform the
transfection strictly according to the manufacturer’s instructions.
After 48 h of transfection, the medium was replaced with complete
medium containing 600 μg/ml G418 (Amresco, Solon, Ohio,
USA). After 2 weeks of selection, the G418-resistant clones that
represented possible stably transfected cells were individually
selected and expanded for further experiments.
Quantitative reverse
transcription-polymerase chain reaction (qRT-PCR)
Total RNAs from cultured cells were isolated using
TRIzol reagent (Invitrogen, Carlsbad, CA, USA) according to the
manufacturer’s instructions. After the amounts of total RNA were
determined by ultraviolet (UV) spectrophotometry, 1 μg of
total RNA was used as a template for reverse transcription using
ReverTra Ace-A (Toyobo, Osaka, Japan). Quantitative real-time PCR
analysis was performed with SYBR-Green PCR Master Mix (Toyobo)
according to the manufacturer’s protocol. DNA primer sequences of
LRIG1 were designed as follows: sense, 5′GGT GAG CCT GGC CTT ATG
TGA ATA3′ and antisense, 5′CAC CAC CAT CCT GCA CCT CC3′. The
real-time PCR program was used as follows: 50°C for 2 min, 95°C for
2 min, followed by 35 cycles of 95°C for 15 sec, 60°C for 30 sec,
72°C for 45 sec and 72°C for 10 min. Each sample was tested in
triplicate and each real-time PCR experiment included a positive
and negative control. The relative gene expression was quantified
by Applied Biosystems and compared using the Ct method. The mRNA
levels of the target gene (2−ΔΔCt) were normalized to
the endogenous 18-sec method reference (ΔΔCt) and related to the
amount of target RNA in the control sample, which was set at 1.0 on
the calibrator.
Western blotting and
immunoprecipitation
Cells were scraped into pre-cold RIPA buffer
(Beyotime Biotech, Nantong, China) for 10 min. All subsequent
manipulations were performed on ice. The supernatant containing the
proteins was collected after centrifugation. The protein
concentrations were determined with a BCA protein assay kit
(Beyotime Biotech). After being mixed with 5X loading buffer, the
protein samples were subjected to heat-denaturation at 100°C for 5
min. Then the protein (70 μg) of each sample was loaded onto
8% SDS-PAGE gels for electrophoresis and transferred to
nitrocellulose membranes, which were blocked with TTBS
(Tween-Tris-buffered saline) containing 5% non-fat milk at room
temperature for 1 h to prevent non-specific binding. Diluted
polyclonal rabbit anti-LRIG1 (1:1,000; Abcam, Cambridge, MA, USA),
monoclonal mouse anti-GAPDH and polyclonal rabbit anti-c-Myc
(1:1,000; Santa Cruz Biotechnology, Inc., Santa Cruz, CA, USA),
polyclonal rabbit anti-phospho-EGFR and anti-EGFR (1:1,000; Upstate
Biotech, Lake Placid, NY, USA), polyclonal rabbit anti-phospho-ERK,
anti-ERK, anti-phospho-AKT and anti-AKT antibodies (1:1,000; Cell
Signaling Technology, Danvers, MA, USA) were added and incubation
was carried out overnight at 4°C, respectively. The membranes were
then washed with TTBS 3 times and incubated with the 1:3,000
diluted corresponding secondary antibodies (goat anti-rabbit IgG,
goat anti-mouse IgG; ProteinTech, Chicago, IL, USA) at 37°C for 1
h. After being washed with TTBS for 3 times, the protein and
antibody conjugations were visualized using a DAB detection system.
Images were captured and analyzed by Quantity One software. For the
immunoprecipitation experiment, 1 mg of cell lysates obtained
through NP-40 lysis buffer (Beyotime Biotech) was subjected to
precipitation with 2 μg of anti-EGFR primary antibody and
protein A Sepharose CL-4B (GE Healthcare, Waukesha, WI, USA).
Precipitates were then assayed using western blotting as previously
described.
MTT assay
The proliferation rates of LRIG1-siRNA1 and control
cells were measured by
3-(4,5-dimethylthiazol-2-yl)-2,5-diphenyltetrazolium bromide (MTT)
assay. Cells were seeded at a density of 5×10³/well in
96-well plates and maintained in complete culture medium containing
300 μg/ml G418 for 0, 3, 6, 8 and 10 days. MTT
(Sigma-Aldrich, St. Louis, MO, USA) was then added to the medium at
a final concentration of 0.5 mg/ml. After 4 h of incubation, cells
of each well were dissolved in 150 μl dimethyl sulfoxide
(DMSO) (Sigma-Aldrich). The optical density (OD) was measured using
ELISA-type plate reader equipment at a wavelength of 490 nm with a
baseline subtraction reading. Each time point was repeated 6
times.
Cell cycle analysis by flow
cytometry
The distribution of different cell cycle phases
(G0/G1, S or G2/M phase) is characterized by DNA content, which is
reflected by varying fluorescent intensities of propidium iodide, a
DNA binding fluorescence dye. In this experiment, cells were
synchronized by serum starvation for 24 h, and then incubated with
complete medium for 48 h. Cells were harvested with trypsin-EDTA,
washed with chilled PBS twice and fixed with 70% ethanol at 4°C
overnight. The fixed cells were collected, re-suspended in 400
μl PBS containing 50 μg/ml propidium iodide and 50
μg/ml Rnase A (Sigma-Aldrich) for 30 min at 37°C in the
dark. Cells (1×10⁶) for each sample were analyzed using
a FACScalibur II sorter and Cell Quest FACS system (BD Biosciences,
Franklin, NJ, USA). The proliferation index (PI) = [(S + G2/M) /
(G0/G1 + S + G2/M)], was calculated according to the percentage of
cells in different phases. The experiment was performed in
triplicate and the results were averaged.
Annexin V-FITC/propidium iodide double
labeling for FCM-assessed apoptosis
The extent of spontaneous apoptosis was determined
with an Annexin V-FITC/propidium iodide kit (KeyGEN Biotech,
Nanjing, China) according to the manufacturer’s instructions. Cells
were synchronized by serum starvation, and then incubated with
complete medium for 48 h. The cells were harvested through
trypsinization, centrifuged at 1,000 rpm and the pellet was
re-suspended in 1X binding buffer at a density of 1×10⁶
cells/ml. The prepared suspensions (100 μl) for each sample
were incubated with 5 μl of FITC-conjugated Annexin V and 10
μl of propidium iodide for 15 min at room temperature in the
dark. Another 400 μl of 1X binding buffer was added to each
sample before analysis. FACScalibur II sorter and Cell Quest
Research Software were used as previously described. The experiment
was performed in triplicate.
Cell invasion assay
The invasive capability of GL15 cells in
vitro was measured by Transwell chamber assay. Diluted ECM
(Sigma-Aldrich) gel solution (50 μl) was added to the upper
chamber of the Transwell insert (6.5 mm, 8-μm pore size;
Costar Inc.). The inserts were incubated at 37°C for 4 h for
gelling and were pretreated with serum-free DMEM medium at 37°C for
1 h before seeding cells at a density of 2×10⁴
cells/well in 100 μl medium with 1% FBS. The lower chambers
were filled with 500 μl DMEM containing 10% FBS. After 24 h
of incubation at 37°C with 5% CO2, the cells on the
upper side of the insert filter were removed with a cotton swab and
cells that had invaded through the ECM-coated filter were fixed in
10% methanol and stained with trypan blue. The number of invaded
cells was counted under a light microscope at a magnification of
×200 in 5 predetermined fields. The experiment was performed in
triplicate.
Gelatin zymography
Equal numbers of cells (2×10⁵/well) were
seeded in 6-well plates and grown in media containing 10% FBS for
24 h. The media were then replaced with fresh DMEM without serum.
After incubation for 24 h, the conditioned media were harvested and
subjected to the analysis for gelatinolytic activities of matrix
metalloproteinase-2 (MMP-2) and MMP-9. Briefly, equal amounts of
conditioned media were separated by 10% SDS-polyacrylamide gels
impregnated with 0.1% gelatin. The gels were washed twice with 2.5%
Triton X-100 for 45 min and incubated with zymogram developing
buffer at 37°C for ~48 h. The gels were then stained with a
staining solution (0.5% Coomassie Blue, 45% methanol and 10% acetic
acid) for 3 h, and destained in 45% methanol and 10% acetic acid.
Zones of gelatinolytic activity were detected as clear bands
against a blue background.
Statistical analysis
The data are expressed as the means ± standard
deviation (SD). Statistical analyses were performed using SPSS
statistical software (SPSS Inc.). For group comparison the
Student’s t-test followed by a least significant difference t-test
(LSD) were used. P<0.05 was considered to indicate a
statistically significant difference.
Results
The vector expressing LRIG1 shRNA causes
specific and effective downregulation of LRIG1 expression
Two shRNA-expressing plasmids (siRNA1 and siRNA2)
and a negative control plasmid were constructed and stably
transfected into GL15 cells. The LRIG1 and housekeeping gene,
glyceraldehyde-3-phosphate dehydrogenase (GAPDH), mRNA and protein
levels were measured by quantitative real-time PCR and western
blotting, respectively (Fig. 1).
Compared with the negative control cells, LRIG1 transcripts were
reduced by 73.5 and 50.4% in the siRNA1- and siRNA2-transfected
cells, respectively (Fig. 1A). In
line with the real-time PCR results, the expression level of the
LRIG1 protein was reduced by 50.5 and 10.1% in the siRNA1 and
siRNA2 cells, respectively (Fig.
1B). The results indicated that the expression of LRIG1 was
downregulated specifically and effectively by LRIG1 shRNA and that
siRNA1 exhibited a stronger knock-down ability compared to siRNA2.
Thus the LRIG1-siRNA1 transfected cells were expanded for further
study.
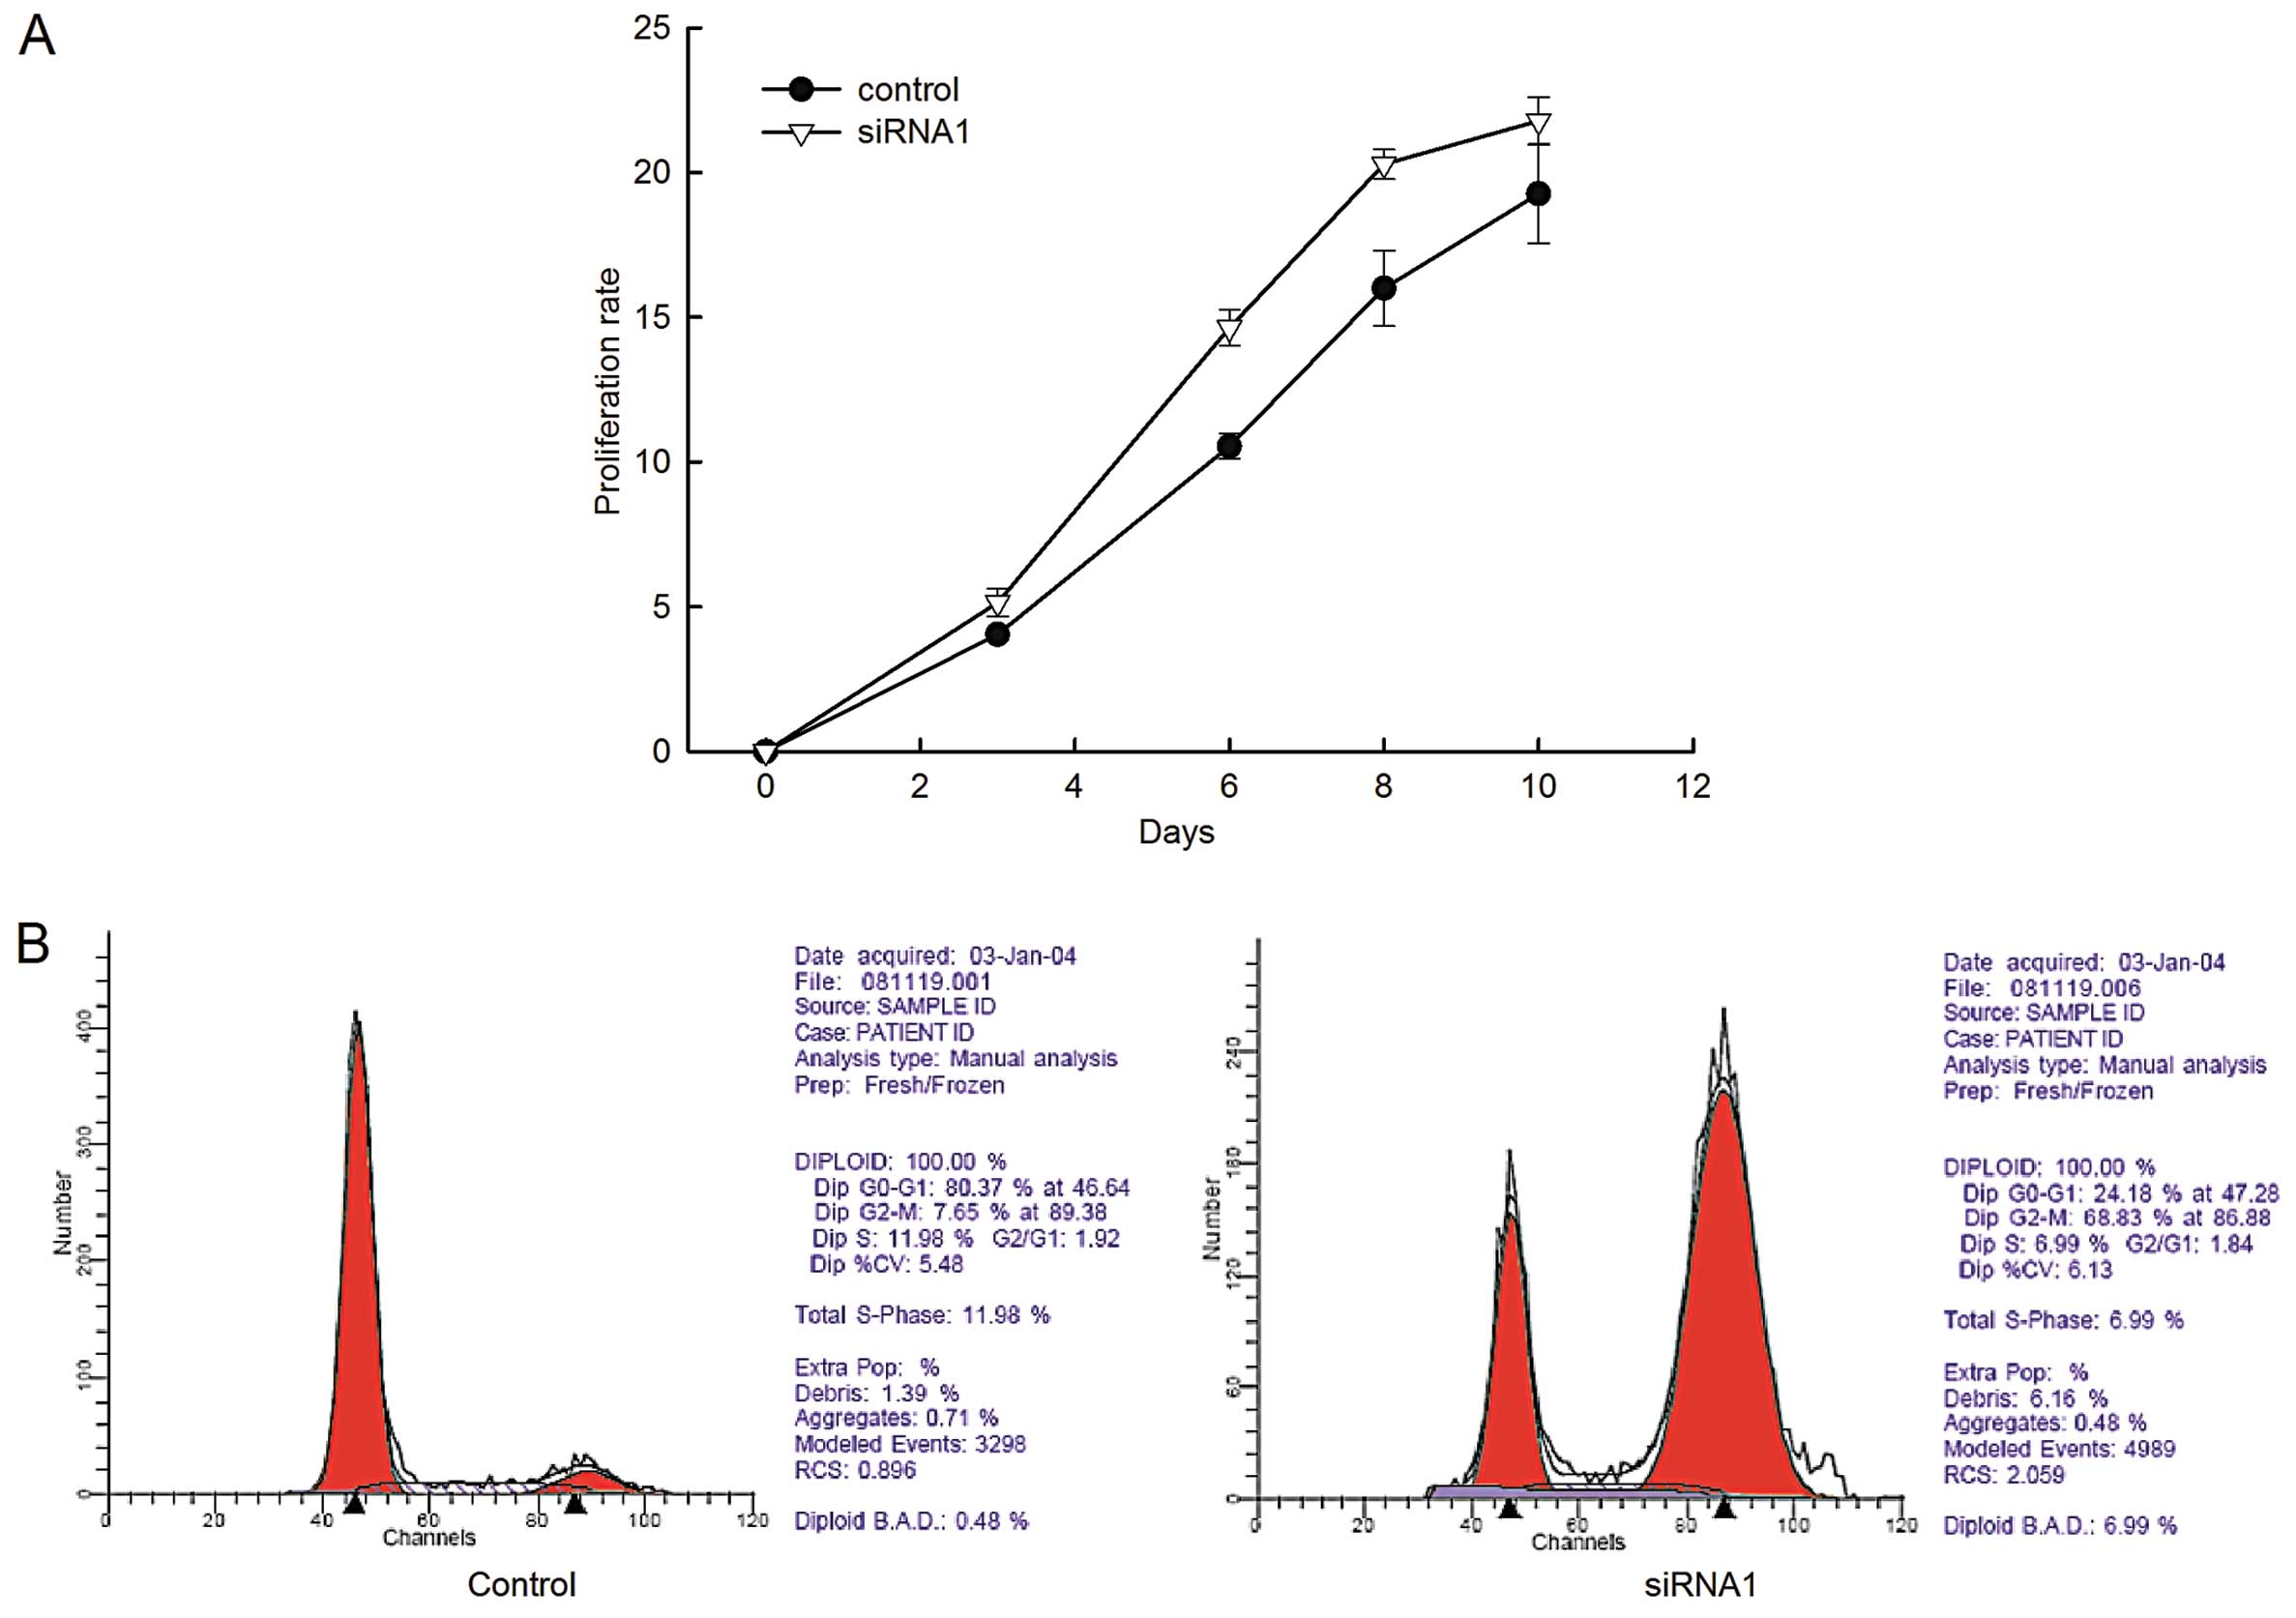
Effects of LRIG1 silencing on cell
proliferation
Having established the effective LRIG1-specific
knockdown transfectant, we used MTT assay to examine th e cell
proliferation of the transfected cells. The proliferation rate of
GL15 cells stably expressing siRNA1 was significantly higher
compared to that of the negative control cells (Fig. 2A).
To investigate whether LRIG1 promotes cell
proliferation by regulating the cell cycle progression,
fluorescence-activated cell sorting following propidium iodide
staining was performed (Fig. 2B).
The number of cells in the G2/M phase significantly increased in
the LRIG1-siRNA1 cells compared to the negative control cells. The
PI was calculated and a marked increase in PI in LRIG1-siRNA1 cells
was observed (Table II). The data
demonstrated that LRIG1 knockdown resulted in an increase of cell
proliferation in GL15 cells.
| Table IIEffects of LRIG1 downregulation on
the distribution of cell cycle phases of GL15 cells. |
Table II
Effects of LRIG1 downregulation on
the distribution of cell cycle phases of GL15 cells.
| Groups | Samples | G0/G1(%) | S (%) | G2/M (%) | PI (%) |
|---|
| Control | 4 | 77.59±4.13 | 15.22±3.71 | 7.19±1.39 | 22.41±4.13 |
| siRNA1 | 4 | 28.79±4.00a | 10.23±2.04b | 60.98±5.22b | 71.21±4.00b |
Effects of LRIG1 silencing on cell
apoptosis
To determine the extent of spontaneous apoptosis, we
analyzed the apoptosis in the LRIG1-siRNA1 and control cells by
double staining with Annexin V-FITC and propidium iodide via flow
cytometry. The percentages of apoptotic cells were 7.05±1.45 and
13.66±2.36% in the LRIG1-siRNA1 and negative control cells,
respectively (P<0.01) (Fig. 3).
The level of spontaneous apoptosis was significantly decreased in
the LRIG1-siRNA1 cells. The percentage of cells that accumulated in
the lower left quadrant was much higher as compared with the
negative control cells, indicating that the number of normal
proliferative cells was increased compared with that of the control
cells, which was in accordance with the results of the cell cycle
analysis by flow cytometry.
Effect of the downregulation of LRIG1 on
the invasive capability of the GL15 cells
Invasive growth pattern is a distinct characteristic
feature of glioblastoma and prevents total tumor resection. ECM
gel-coated Transwell chamber assay was used to investigate the
effect of the knockdown of LRIG1 on invasive capability. The number
of invading cells was 158.2±20.0 in the LRIG1-siRNA1 cells and
65.3±5.4 in the negative control cells (Fig. 4A and B). The downregulation of LRIG1
significantly increased the invasive capability of the GL15
cells.
The MMPs are closely related to the invasive
capability. Using gelatin zymography, we further examined the
gelatinolytic activity of MMPs in LRIG1-siRNA1 cells. The results
revealed that the levels of MMP-2 and MMP-9 expression were both
significantly increased in LRIG1-siRNA1 cells in comparison to the
control cells (Fig. 4C). These data
indicated that LRIG1 knockdown enhanced the invasive capacity of
GL15 cells.
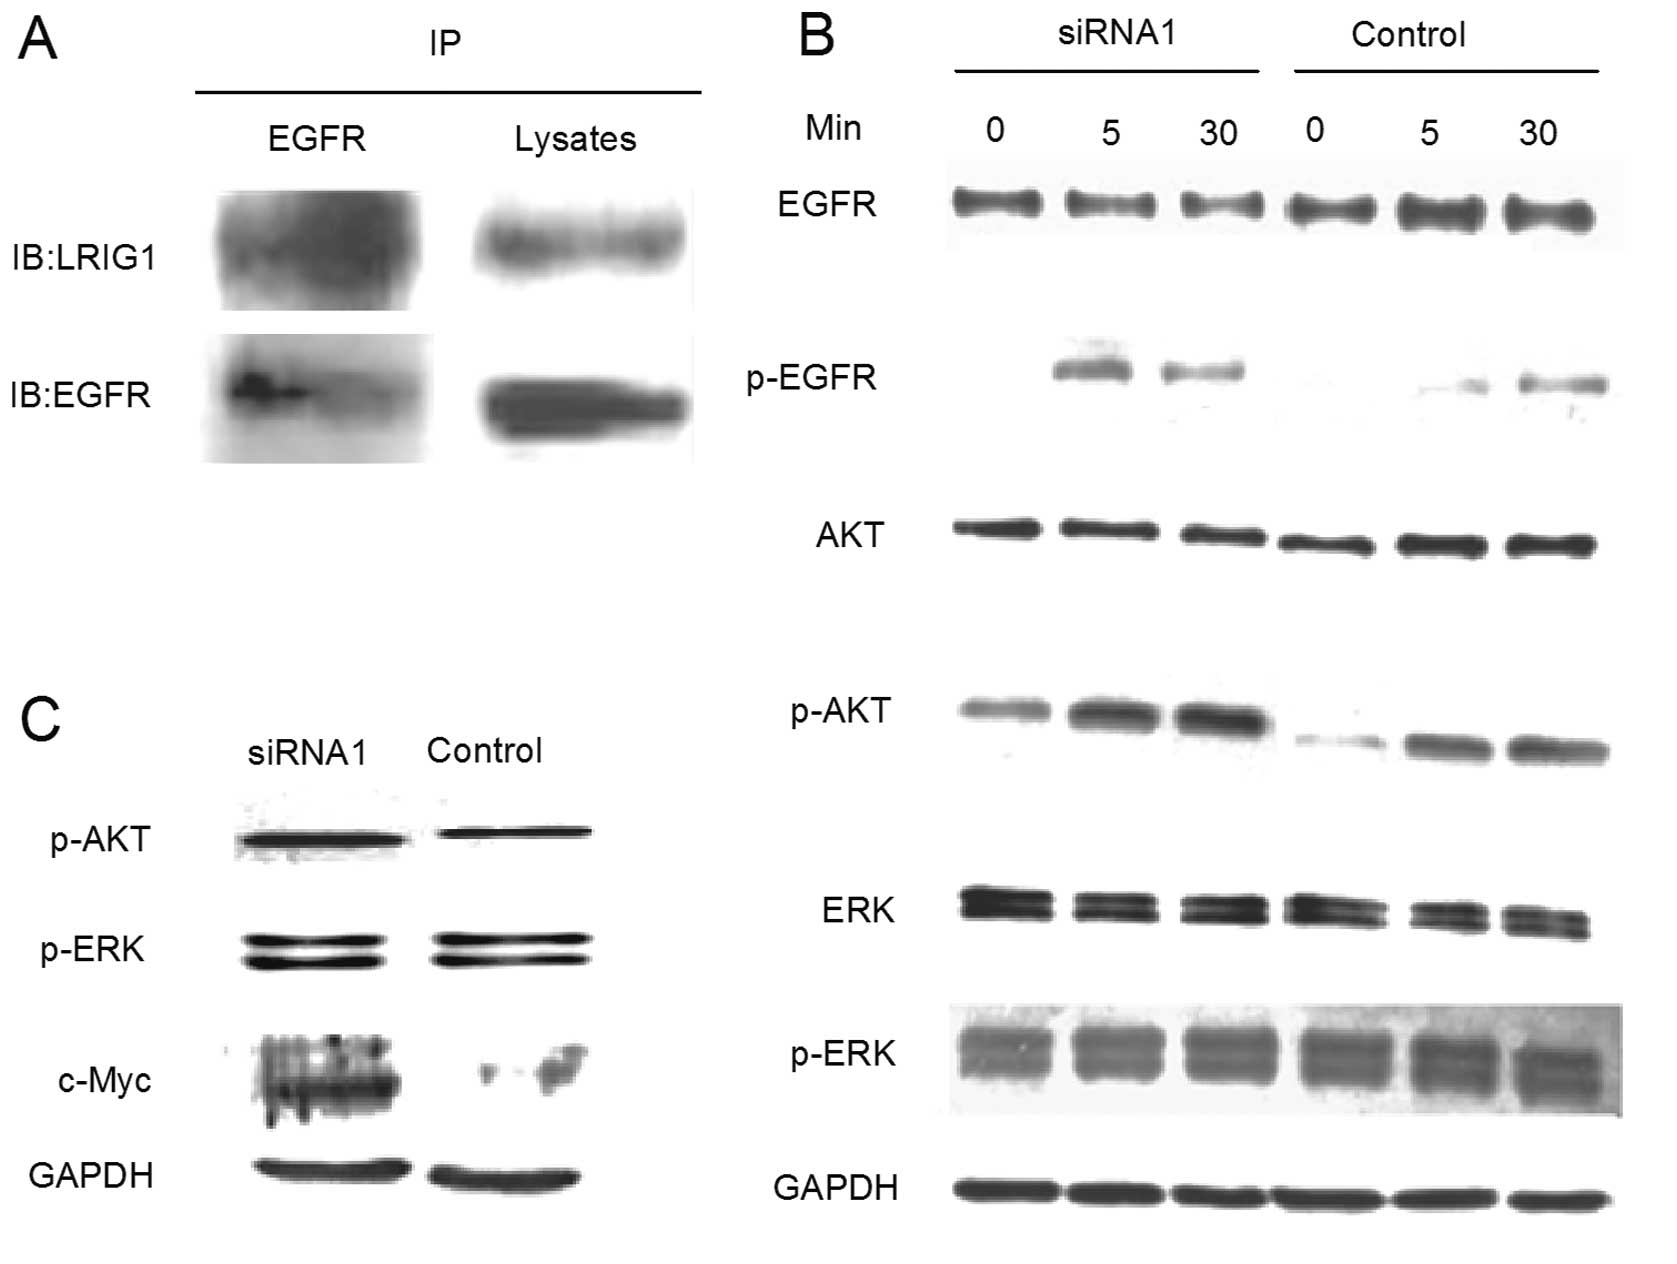
LRIG1 silencing promotes the activation
of EGFR, AKT and c-Myc
Previous studies have demonstrated that LRIG1 forms
a protein complex with EGFR in several non-glioma cell lines. In
the present study, using the co-immunoprecipitation experiment, we
demonstrated that LRIG1 also forms a specific protein complex with
endogenous EGFR in the GL15 cell line (Fig. 5A).
In this study, we further investigated the effect of
LRIG1-siRNA1 on the EGFR-mediated downstream signaling pathways of
PI3K/Akt and MAPK/ERK. When stimulated with EGF, the
phosphorylation of EGFR in the LRIG1-siRNA1 cells was notably
increased particularly under the 5-min stimulation (Fig. 5B). The phosphorylated Akt level was
also observed to be increased in the LRIG1-siRNA1 group for all
three stimulation points, whereas, the ERK phosphorylation in the
LRIG1-siRNA1 group was not significantly different from the control
group. Similar to the results of the treatment with EGF,
LRIG1-siRNA1 cells cultured in complete medium for 48 h after
synchronization demonstrated a markedly increased phosphorylated
Akt level and no significant difference in the expression of ERK
phosphorylation (Fig. 5C). This
data clearly indicated that the EGFR-mediated PI3K/Akt pathway was
dominantly activated by LRIG1 knockdown. In addition, the
oncogene-c-Myc, involved in cell proliferation and cell cycle
regulation demonstrated an increased expression in siRNA1 cells
(Fig. 5C).
Discussion
In the present study, we successfully established
LRIG1 knockdown glioblastoma cells, in which the expression of
LRIG1 was specifically and effectively inhibited by siRNA. The
downregulation of LRIG1 markedly enhanced the malignant properties
of glioblastoma cells, such as increased proliferative and invasive
capabilities and a decreased apoptotic rate. To the best of our
knowledge, for the first time, we demonstrated that LRIG1 silencing
promoted the aggressive capabilities of glioblastoma cells by the
activation of EGFR/AKT/c-Myc.
Glioblastoma multiforme (GBM) is the most common and
devastating malignant tumor in the brain. Traditional therapeutic
modalities are ultimately ineffective in curing this cancer, due to
a diffusive infiltrative growth pattern, which contributes to the
difficulty of achieving complete tumor resection and to the
radio-resistance of glioma cells (22). Based on an ever-increasing
understanding of several key signaling pathways involved in growth,
proliferation, survival and apoptosis, it is critical to explore
novel therapeutic strategies that target these pathways to improve
the treatment of malignant glioma in the future. The overexpression
of EGFR is one of the most frequent signaling mutations in GBM. The
average amplification rate for EGFR in GBM is ~35% (23), suggesting that inhibiting EGFR may
be a possible therapeutic strategy for GBM treatment. The
overexpression of EGFR induces the expression of LRIG1, which, in
turn, interacts with EGFR and attenuates the EGFR-mediated
signaling pathway (11). However,
the exact role of LRIG1 and the underlying mechanism of the
interaction of LRIG1 with EGFR in the tumorigenesis and development
of glioblastoma remain unknown.
LRIG1-siRNA cells exhibited higher proliferative
ability compared with the negative control cells. Consistent with a
previous report that cell cycle progression was involved in the
process of tumor growth (24), our
study revealed a profound effect of LRIG1-knockdown on cell cycle
distribution, evidenced by an accumulation of cells in the G2/M
phase. G2/M-arrested cells were observed to express an increased
amount of survivin to resist chemotherapy (25), indicating that the downregulation of
LRIG1 in glioblastoma cells may enhance the capability of
chemotherapy resistance. Moreover, the apoptosis rate confirmed by
flow cytometry was notably decreased in LRIG1-knockdown cells. From
these results, we suggest that the downregulation of LRIG1 promotes
cell growth and survival of glioblastoma cells by increasing the
proliferative and anti-apoptotic capabilities.
Besides uncontrolled cell growth, cell invasion
through white matter tracts is also recognized as a hallmark of
glioma (26). Adhesion to the
extracellular matrix (ECM) and degradation of the ECM are two
important steps in tumor cell invasion. Aiming at these processes,
we used the ECM-coated Transwell chamber assay to evaluate the
effect of LRIG1 knockdown on the invasive ability of GL15 cells.
The silencing of LRIG1 in GL15 cells promoted the cell invasive
activity in vitro, indicating that LRIG1 may inhibit the
invasive capability of glioblastoma cells. A crucial role in the
process of ECM degradation is attributed to matrix
metalloproteinases (MMPs) especially MMP-2 and MMP-9, which are
considered to be suitable predictors of glioma cell invasion and
demonstrate a positive correlation with the histopathological
malignant grade of glioma (27,28).
Gelatin zymography, which was used to determine the activities of
MMP-2 and MMP-9, demonstrated that levels of both proteins were
increased following LRIG1 knockdown of the GL15 cells, suggesting
that LRIG1 knockdown enhanced the invasive capability of GL15 cells
by increasing MMP-2 and MMP-9 expression.
To further explore the potential mechanisms
promoting aggressive behaviors mediated by LRIG1 knockdown, we
evaluated the active state of EGFR and its downstream signaling
proteins including AKT and MAPK. As mentioned above, EGFR was
overexpressed in multiple GBM cases and played a significant role
in regulating other intracellular signaling pathways including
PI3K/Akt and RAS/MAPK, contributing to cell survival,
proliferation, invasion and angiogenesis (29,30).
A previous study with other cell lines demonstrated
that the upregulation of LRIG1 promoted ubiquitylation and
degradation of EGFR by receptor combination with leucine-rich
repeat (LRR) as well as immunoglobulin-like (Ig) domains of LRIG1
protein (11). Consistent with
previous studies that LRIG1 may form a protein complex with EGFR in
non-glioma cell lines (11,31) our study confirmed that endogenous
LRIG1 interacted with endogenous EGFR and formed a protein complex
in glioblastoma cells. The downregulation of LRIG1 notably
increased the activation of EGFR, which was consistent with our
previous report that LRIG1 suppressed glioma cell growth by
inhibiting EGFR (18). The
increased activation of EGFR induced the activation of the
downstream signaling pathway molecule Akt, demonstrating that the
signaling pathway of PI3K/Akt was enhanced, contributing to the
increased proliferative, anti-apoptotic and invasive capabilities
of LRIG1-siRNA GL15 cells. However, LRIG1 knockdown in GL15 cells
revealed no significant effect on ERK activation. Therefore, we
propose that the EGFR-mediated PI3K/Akt pathway was dominantly
activated by LRIG1 knockdown, at least in the GL15 cell line.
In addition to the two crucial signaling molecules,
we also focused on c-Myc, a proto-oncogene which exhibits a
positive correlation with the malignant grade of tumors and
contributes to the deregulated proliferation and survival of glioma
cells and stem cell self-renewal (32,33).
LRIG1 maintains stem cells in quiescence by EGFR downregulation
(34), suggesting a potential
cross-network between c-Myc and LRIG1 in glioma cells. c-Myc is
also an important factor in cell proliferation by cell cycle
progression from the G1 to the S phase (35). In our study, we observed that c-Myc
expression was markedly increased in LRIG1-siRNA cells, which may
partly explain the G2/M arrest of LRIG1 knockdown in the GL15
cells.
To the best of our knowledge, we demonstrated for
the first time that the downregulation of LRIG1 promoted the
aggressive properties of glioblastoma cells including
proliferative, anti-apoptotic and invasive capabilities via
enhancing the activation of EGFR/Akt/c-Myc. These results provide
profound evidence for the proposal that LRIG1 acts as a tumor
suppressor gene in glioblastoma cells. Further investigation
regarding the underlying mechanisms and biological effects of LRIG1
knockdown in vivo is warranted and the applicability of
amplifying LRIG1 in glioblastoma therapy deserves further
investigation.
The limitation of this research was that this study
was performed in vitro and only focused on one glioblastoma
cell line. Further experiments are required to confirm our results
using other cell lines in vitro and animal models in
vivo.
Acknowledgements
This study was supported by National Natural and
Science Foundation of China (No. 81001116) and the National
Clinical Key Specialty Construction Project. Professor Håkan Hedman
is acknowledged for kindly providing the GL15 cell line.
Abbreviations:
|
LRIG
|
leucine-rich repeats and
immunoglobulin-like domains
|
|
shRNA
|
short hairpin RNA
|
|
RNAi
|
RNA interference
|
|
EGFR
|
epidermal growth factor receptor
|
|
GBM
|
glioblastoma multiforme
|
|
GAPDH
|
glyceraldehydes-3-phosphate
dehydrogenase
|
|
ECM
|
extracellular matrix
|
|
MTT
|
3-(4,5-dimethylthiazol-2-yl)-2,5-diphenyltetrazolium
|
|
DMSO
|
dimethyl sulfoxide
|
|
OD
|
optical density
|
|
PI
|
proliferation index
|
|
MMP
|
matrix metalloproteinase
|
References
|
1
|
Stupp R, Mason WP, van den Bent MJ, et al:
Radiotherapy plus concomitant and adjuvant temozolomide for
glioblastoma. N Engl J Med. 352:987–996. 2005. View Article : Google Scholar : PubMed/NCBI
|
|
2
|
Wang B, Han L, Chen R, et al:
Downregulation of LRIG2 expression by RNA interference inhibits
glioblastoma cell (GL15) growth, causes cell cycle redistribution,
increases cell apoptosis and enhances cell adhesion and invasion in
vitro. Cancer Biol Ther. 8:1018–1023. 2009. View Article : Google Scholar : PubMed/NCBI
|
|
3
|
Guo D, Holmlund C, Henriksson R and Hedman
H: The LRIG gene family has three vertebrate paralogs widely
expressed in human and mouse tissues and a homolog in Ascidiacea.
Genomics. 84:157–165. 2004. View Article : Google Scholar : PubMed/NCBI
|
|
4
|
Nilsson J, Vallbo C, Guo D, et al:
Cloning, characterization, and expression of human LIG1. Biochem
Biophys Res Commun. 284:1155–1161. 2001. View Article : Google Scholar : PubMed/NCBI
|
|
5
|
Ishii H and Furukawa Y: Alterations of
common chromosome fragile sites in hematopoietic malignancies. Int
J Hematol. 79:238–242. 2004. View Article : Google Scholar : PubMed/NCBI
|
|
6
|
Martinez A, Walker RA, Shaw JA, Dearing
SJ, Maher ER and Latif F: Chromosome 3p allele loss in early
invasive breast cancer: detailed mapping and association with
clinicopathological features. Mol Pathol. 54:300–306. 2001.
View Article : Google Scholar : PubMed/NCBI
|
|
7
|
Hedman H, Nilsson J, Guo D and Henriksson
R: Is LRIG1 a tumour suppressor gene at chromosome 3p14.3? Acta
Oncol. 41:352–354. 2002. View Article : Google Scholar : PubMed/NCBI
|
|
8
|
Thomasson M, Hedman H, Guo D, Ljungberg B
and Henriksson R: LRIG1 and epidermal growth factor receptor in
renal cell carcinoma: a quantitative RT-PCR and immunohistochemical
analysis. Br J Cancer. 89:1285–1289. 2003. View Article : Google Scholar : PubMed/NCBI
|
|
9
|
Yang WM, Yan ZJ, Ye ZQ and Guo DS: LRIG1,
a candidate tumour-suppressor gene in human bladder cancer cell
line BIU87. BJU Int. 98:898–902. 2006. View Article : Google Scholar : PubMed/NCBI
|
|
10
|
Tanemura A, Nagasawa T, Inui S and Itami
S: LRIG-1 provides a novel prognostic predictor in squamous cell
carcinoma of the skin: immunohistochemical analysis for 38 cases.
Dermatol Surg. 31:423–430. 2005. View Article : Google Scholar : PubMed/NCBI
|
|
11
|
Gur G, Rubin C, Katz M, et al: LRIG1
restricts growth factor signaling by enhancing receptor
ubiquitylation and degradation. EMBO J. 23:3270–3281. 2004.
View Article : Google Scholar : PubMed/NCBI
|
|
12
|
Lindstrom AK, Ekman K, Stendahl U, et al:
LRIG1 and squamous epithelial uterine cervical cancer: correlation
to prognosis, other tumor markers, sex steroid hormones, and
smoking. Int J Gynecol Cancer. 18:312–317. 2008. View Article : Google Scholar
|
|
13
|
Miller JK, Shattuck DL, Ingalla EQ, et al:
Suppression of the negative regulator LRIG1 contributes to ErbB2
overexpression in breast cancer. Cancer Res. 68:8286–8294. 2008.
View Article : Google Scholar : PubMed/NCBI
|
|
14
|
Li F, Ye ZQ, Guo DS and Yang WM:
Suppression of bladder cancer cell tumorigenicity in an athymic
mouse model by adenoviral vector-mediated transfer of LRIG1. Oncol
Rep. 26:439–446. 2011.PubMed/NCBI
|
|
15
|
Welsh JB, Sapinoso LM, Su AI, et al:
Analysis of gene expression identifies candidate markers and
pharmacological targets in prostate cancer. Cancer Res.
61:5974–5978. 2001.PubMed/NCBI
|
|
16
|
Lapointe J, Li C, Higgins JP, et al: Gene
expression profiling identifies clinically relevant subtypes of
prostate cancer. Proc Natl Acad Sci USA. 101:811–816. 2004.
View Article : Google Scholar : PubMed/NCBI
|
|
17
|
Hedman H and Henriksson R: LRIG inhibitors
of growth factor signalling - double-edged swords in human cancer?
Eur J Cancer. 43:676–682. 2007. View Article : Google Scholar : PubMed/NCBI
|
|
18
|
Ye F, Gao Q, Xu T, et al: Upregulation of
LRIG1 suppresses malignant glioma cell growth by attenuating EGFR
activity. J Neurooncol. 94:183–194. 2009. View Article : Google Scholar : PubMed/NCBI
|
|
19
|
Guo D, Nilsson J, Haapasalo H, et al:
Perinuclear leucine-rich repeats and immunoglobulin-like domain
proteins (LRIG1-3) as prognostic indicators in astrocytic tumors.
Acta Neuropathol. 111:238–246. 2006. View Article : Google Scholar : PubMed/NCBI
|
|
20
|
Yuan B, Latek R, Hossbach M, Tuschl T and
Lewitter F: siRNA Selection Server: an automated siRNA
oligonucleotide prediction server. Nucleic Acids Res. 32:W130–W134.
2004. View Article : Google Scholar : PubMed/NCBI
|
|
21
|
Tuschl T: Expanding small RNA
interference. Nat Biotechnol. 20:446–448. 2002. View Article : Google Scholar : PubMed/NCBI
|
|
22
|
Golding SE, Morgan RN, Adams BR, Hawkins
AJ, Povirk LF and Valerie K: Pro-survival AKT and ERK signaling
from EGFR and mutant EGFRvIII enhances DNA double-strand break
repair in human glioma cells. Cancer Biol Ther. 8:730–738. 2009.
View Article : Google Scholar : PubMed/NCBI
|
|
23
|
Rao SK, Edwards J, Joshi AD, Siu IM and
Riggins GJ: A survey of glioblastoma genomic amplifications and
deletions. J Neurooncol. 96:169–179. 2010. View Article : Google Scholar : PubMed/NCBI
|
|
24
|
Yeh KY, Chang JW, Li YY, Wang CH and Wang
HM: Tumor growth inhibition of metastatic nasopharyngeal carcinoma
cell lines by low dose of arsenic trioxide via alteration of cell
cycle progression and induction of apoptosis. Head Neck.
33:734–742. 2011. View Article : Google Scholar : PubMed/NCBI
|
|
25
|
Chandele A, Prasad V, Jagtap JC, Shukla R
and Shastry PR: Upregulation of survivin in G2/M cells and
inhibition of caspase 9 activity enhances resistance in
staurosporine-induced apoptosis. Neoplasia. 6:29–40. 2004.
View Article : Google Scholar
|
|
26
|
Tate MC and Aghi MK: Biology of
angiogenesis and invasion in glioma. Neurotherapeutics. 6:447–457.
2009. View Article : Google Scholar : PubMed/NCBI
|
|
27
|
Wild-Bode C, Weller M and Wick W:
Molecular determinants of glioma cell migration and invasion. J
Neurosurg. 94:978–984. 2001. View Article : Google Scholar : PubMed/NCBI
|
|
28
|
Rao JS: Molecular mechanisms of glioma
invasiveness: the role of proteases. Nat Rev Cancer. 3:489–501.
2003. View
Article : Google Scholar : PubMed/NCBI
|
|
29
|
Kapoor GS and O’Rourke DM: Receptor
tyrosine kinase signaling in gliomagenesis: pathobiology and
therapeutic approaches. Cancer Biol Ther. 2:330–342. 2003.
View Article : Google Scholar : PubMed/NCBI
|
|
30
|
Fu Y, Zhang Q, Kang C, et al: Inhibitory
effects of adenovirus mediated Akt1 and PIK3R1 shRNA on the growth
of malignant tumor cells in vitro and in vivo. Cancer Biol Ther.
8:1002–1009. 2009. View Article : Google Scholar
|
|
31
|
Laederich MB, Funes-Duran M, Yen L, et al:
The leucine-rich repeat protein LRIG1 is a negative regulator of
ErbB family receptor tyrosine kinases. J Biol Chem.
279:47050–47056. 2004. View Article : Google Scholar : PubMed/NCBI
|
|
32
|
Shindo H, Tani E, Matsumuto T, Hashimoto T
and Furuyama J: Stabilization of c-myc protein in human glioma
cells. Acta Neuropathol. 86:345–352. 1993. View Article : Google Scholar : PubMed/NCBI
|
|
33
|
Wang J, Wang H, Li Z, et al: c-Myc is
required for maintenance of glioma cancer stem cells. PLoS One.
3:e37692008. View Article : Google Scholar : PubMed/NCBI
|
|
34
|
Jensen KB and Watt FM: Single-cell
expression profiling of human epidermal stem and transit-amplifying
cells: LRIG1 is a regulator of stem cell quiescence. Proc Natl Acad
Sci USA. 103:11958–11963. 2006. View Article : Google Scholar : PubMed/NCBI
|
|
35
|
Dang CV: c-Myc target genes involved in
cell growth, apoptosis, and metabolism. Mol Cell Biol. 19:1–11.
1999.PubMed/NCBI
|