Introduction
Etoposide, a DNA topoisomerase II inhibitor, is a
semisynthetic glucosidic derivative of podophyllotoxin (1). Etoposide, one of the most active and
useful antitumor agents, has been widely used for the treatment of
a wide range of malignancies including relapsed or refractory
breast and ovarian cancers (2).
Etoposide is metabolized via the hepatic cytochrome P450 (CYP) to
form O-demethylation based on rat liver microsomes (3) and human liver microsomes (4); CYP3A4 is a main CYP isoform involved
in the 3′-demethylation of etoposide, and CYP1A2 and CYP2E1 are
involved as the minor enzymatic components in this metabolic
pathway based on human liver microsomes and nine recombinant human
CYP isoforms (5). Moreover,
etoposide is a substrate of P-glycoprotein (P-gp) based on the
everted gut sacs prepared from the jejunum and ileum of rats
(6) and its intestinal absorption
is regulated by P-gp (6,7). P-gp was found to restrict the oral
(re)uptake of etoposide and to mediate its intestinal excretion
across the gut wall (8). Higher
plasma concentrations of etoposide by cyclosporine, an inhibitor of
CYP3A4 and P-gp, in patients (9)
and rats (10) were reported. It
has also been reported that protein expression of CYP1A1, CYP2E1
and CYP3A4 was significantly lower in breast cancer tissue when
compared with morphologically adjacent normal tissue in humans
(11), and hepatic mRNA expression
of PXR and its downstream targets, CYP3A4 and
ABCB1, was reduced in breast cancer patients (12). However, the hepatic protein
expression of CYP3A and P-gp in breast tumor patients or mammary
tumor-bearing animals has not been investigated, yet the amount of
etoposide could be affected by protein expression of the CYP3A
subfamily and P-gp in the liver and intestine.
Flavonoids are phytochemicals that are found in
various fruits and vegetables at high quantities and plant-derived
beverages such as tea and red wine (13). Among the flavonoids, morin
(3,5,7,2′,4′-pentahydroxyflavone) exhibits various biological and
biochemical activities including antioxidation, anti-mutagenesis,
anti-inflammation and cardioprotective activities (14–16).
Previous studies have reported that morin modulates the activities
of metabolic enzymes including CYPs (17). Moreover, it has been reported that
morin is a fairly potent P-gp inhibitor (18). Therefore, morin appears to be a dual
inhibitor against the CYP3A subfamily and P-gp. Recently, it has
been reported that morin increased the bioavailability (F)
of etoposide (19), tamoxifen
(20), nicardipine (21), methotrexate (22) and talinolol (23) in rats through the inhibition of
P-gp. However, these studies were conducted using normal rats not
mammary tumor-bearing rats. Studies using mammary tumor-bearing
animal models will provide more data on the disease-related
pharmacokinetic characteristics of absorption and metabolism of
etoposide by morin.
Thus, in the present study, the effects of morin on
the pharmacokinetics and tissue distribution of etoposide were
evaluated using the environmental carcinogen,
7,12-dimethylbenz[a]anthracene (DMBA) to induce mammary tumors in
rats (DMBA rats) as an animal model of human breast cancer. Tumors
that developed in these rats closely mimic those of human breast
cancer (24). Changes in protein
and mRNA expression of CYP3A and P-gp were also evaluated.
Materials and methods
Materials
Etoposide injectable solution (20 mg/ml) was kindly
donated by Korea United Pharmaceutical Company (Seoul, Korea).
Podophyllotoxin [internal standard for high performance liquid
chromatography (HPLC) analysis of etoposide], DMBA, dextran (MW
65,000), olive oil, primary monoclonal antibody for
glyceraldehyde-3-phosphate dehydrogenase (GAPDH) and Kodak X-OMAT
film were all purchased from Sigma-Aldrich Corp. (St. Louis, MO,
USA). Polyclonal anti-rabbit CYP3A antibody was purchased from
Detroit R&D (Detroit, MI, USA) and monoclonal P-gp antibody was
purchased from Calbiochem (EMD Biosciences Inc., San Diego, CA,
USA). Horseradish peroxidase-conjugated goat anti-rabbit and
anti-mouse secondary antibodies and enhanced chemiluminescence
reagents were purchased from Bio-Rad Laboratories (Hercules, CA,
USA) and Amersham Life Science Inc. (Piscataway, NJ, USA),
respectively. Other chemicals were of reagent or HPLC grade.
Animals
The protocols for the animal studies were approved
by the Animal Care and Use Committee of the Institute of Laboratory
Animal Resources of Seoul National University (Seoul, Republic of
Korea). Female Sprague-Dawley rats (ages 6–7 weeks and weighing
160–180 g) were purchased from Charles River Company Korea (Orient,
Seoul, Republic of Korea). The procedures used for housing and
handling of the rats were similar to those reported previously
(25,26).
Induction of mammary tumors in rats
DMBA (dissolved in olive oil) at a dose of 5 mg (in
1 ml) per rat was administered orally using a gastric gavage tube
once a week for 4 weeks as a previously reported method (27). This protocol not only results in
palpable tumors as early as 3 weeks following the last
administration of DMBA but also dramatically increases the number
of tumors for each rat; more than the classic Huggins model
(28). Morphological
characteristics of the tumors induced by this protocol are
identical to those of the Huggins model.
Preliminary study
The serum samples of control rats and DMBA rats
(n=5, each group) were collected from the carotid artery for the
measurement of total proteins, albumin, urea nitrogen, glutamate
oxaloacetate transaminase (GOT), glutamate pyruvate transaminase
(GPT) and creatinine (measured by Green Cross Reference Laboratory,
Seoul, Republic of Korea). The whole liver, kidney and tumor (for
mammary tumor rats) of each rat were excised, rinsed with 0.9%
NaCl-injectable solution, blotted dry with tissue paper and
weighed. Small portions of each organ were fixed in 10% neutral
phosphate-buffered formalin and then processed for routine
histological examination with hematoxylin and eosin staining.
RNA extraction and cDNA synthesis
Liver, intestine and breast tumor samples for
protein and RNA isolation were obtained 30 min after oral
administration of morin (15 mg/kg). Total RNA was isolated from
tissue samples followed by column purification using the RNeasy
Mini kit (Qiagen, Valencia, CA, USA) according to the
manufacturer’s protocols. RNA was eluted from the spin column using
RNase-free dH2O. cDNA was prepared from RNA samples
using High Capacity cDNA Reverse Transcription kit (Applied
Biosystems, Foster City, CA, USA) according to the manufacturer’s
instructions.
Quantitative real-time reverse
transcription-polymerase chain reaction (qRT-PCR)
The qRT-PCR reaction was prepared using Power SYBR
Green qPCR Master Mix (Applied Biosystems), and qRT-PCR was
performed using the StepOne Real-Time PCR system (Applied
Biosystems). Each sample had a final volume of 15 μl containing
~100 ng of cDNA. The appropriate genes in the rat for human CYP3A4
and P-gp proteins were CYP3A3 and ABCB7,
respectively, which were the most homologous corresponding to the
human genes. The oligonucleotide primers for CYP3A3 (83-bp
PCR product) were: 5′-GCAAGAGAAAGGCAAACCTG-3′ (forward) and
5′-CTCCAAATGATGTGCTGGTG-3′ (reverse). The primers for ABCB7
(177-bp PCR product) were: 5′-GGT GCCCTTACTGTTGGAGA-3′ (forward)
and 5′-AGATGCCA TCGCTTTGTCTT-3′ (reverse). GAPDH was used to
normalize the CYP3A3 and ABCB7 qRT-PCR results.
Relative mRNA levels of CYP3A3 and ABCB7 were
assessed using the 2-ΔΔCt method.
Immunoblot analysis
The procedures used were similar to a previously
reported method (29). Hepatic
microsomes were resolved by sodium dodecyl sulfated-polyacrylamide
gel electrophoresis (SDS-PAGE) on a 7.5% gel (10 μg protein per
lane; n=2, each). Proteins were transferred to a nitrocellulose
membrane (Pall Corp., Ann Arbor, MI, USA) and then blocked for 2 h
in Tris-buffered saline containing 0.1% (v/v) Tween-20 (TBS-T). For
immunodetection, blots were incubated overnight (IKA-Labortechnik,
Staufen, Germany) at 4°C with CYP3A or P-gp antibodies (diluted
1:1,000 in TBS-T containing 5% bovine serum albumin) followed by
incubation for 2 h at room temperature with a secondary antibody
conjugated to horseradish peroxidase (diluted 1:10,000 in TBS-T
containing 5% milk powder). The protein expression of CYP3A and
P-gp was detected by enhanced chemiluminescence on Kodak X-OMAT
film. GAPDH was used as a loading control.
Measurement of rat plasma protein binding
of etoposide
Protein binding of etoposide to fresh rat plasma
from the control and DMBA rats (n=4, each) was measured using
equilibrium dialysis at an etoposide concentration of 2 μg/ml
(30,31). After a 24-h incubation, two 100-μl
aliquots were removed from each compartment and stored at −70°C
(Revco ULT 1490 D-N-S; Western Mednics, Asheville, NC, USA) until
being used for HPLC analysis of etoposide (19,32).
Studies of intravenous and oral
administration
The procedures used for the pretreatment of rats
including the cannulation of the carotid artery (for blood
sampling) and the jugular vein (for drug administration in the
intravenous study) of each rat were conducted in a similar manner
to previously reported methods (26,33).
The rats were not restrained in the present study.
Morin was dissolved in distilled water and orally
administered (15 mg/kg) 30 min prior to the intravenous
administration of etoposide using a gastric gavage tube. Etoposide
injectable solution (diluted in 0.9% NaCl-injectable solution) at a
dose of 2 mg/kg (34–36) in 2 ml was manually infused via the
jugular vein over 1 min in the control (n=6), DMBA-WOM (n=7) and
DMBA-WM rats (n=7). Blood samples (~0.22 ml, each) were collected
via the carotid artery at 0 (control), 1 (end of the infusion), 5,
15, 30, 60, 90, 120, 180 and 240 min after the start of the
infusion of etoposide. Each blood sample was centrifuged
immediately, and 100 μl of plasma sample was stored at −70°C until
being used for the HPLC analysis of etoposide (19,32).
At the end of the experiment (24 h), each metabolic cage was rinsed
with 10 ml of distilled water and the rinsings were combined with
the 24-h urine sample. After measuring the exact volume of the
combined urine sample, two 100-μl aliquots of the combined urine
sample were stored at −70°C until being used for the HPLC analysis
of etoposide (19,32). At the same time (24 h), each rat was
exsanguinated and sacrificed by cervical dislocation. Then, the
abdomen was opened and the entire gastrointestinal tract (including
its contents and feces) of each rat was removed, transferred into a
beaker containing 100 ml of methanol (to facilitate the extraction
of etoposide) and cut into small pieces using scissors. After
manual shaking and stirring with a glass rod for 1 min, two 100 μl
portions of the supernatant were collected from each beaker and
stored at −70°C until being used for the HPLC analysis of etoposide
(19,32).
Etoposide (the same solution used in the intravenous
study) at a dose of 10 mg/kg (34–36) in
5 ml was administered orally using a gastric gavage tube to the
control (n=6), DMBA-WOM (n=6) and DMBA-WM (n=5) rats. Blood samples
were collected at 0, 5, 15, 30, 45, 60, 90, 120, 180, 240, 360 and
480 min after the oral administration of etoposide. Other
procedures for the oral study were similar to those for the
intravenous study.
Tissue distribution of etoposide after
its oral administration
Etoposide (the same solution used in the oral study)
at a dose of 10 mg/kg was administered orally using a gastric
gavage tube in control, DMBA-WOM and DMBA-WM rats (n=3; each).
Small portion of liver, small intestine, large intestine and breast
tumor (for DMBA rats) from each rat was quickly excised at 90 min
after oral administration. Each tissue sample was rinsed with cold
0.9% NaCl-injectable solution, blotted dry with tissue paper and
weighed. Each tissue was homogenized with 4 volumes of 0.9%
NaCl-injectable solution in a tissue homogenizer (Ultra-Turrax T25,
Janke and Kunkel, IKA-Labortechnik) and centrifuged. Two 100-μl
aliquots of plasma or supernatant of each tissue homogenate were
stored at −70°C until being used for the HPLC analysis of etoposide
(19,32).
HPLC analysis of etoposide
Concentrations of etoposide in the above biological
samples were determined by a slight modification of a reported HPLC
method (19,32). In brief, 20 μl of methanol
containing 20 μg/ml of podophyllotoxin (internal standard) was
added to 100 μl of a biological sample and extracted with 1 ml of
ethyl acetate. After vortex-mixing and centrifugation (16,000 × g
for 10 min), the organic layer was transferred into a clean
Eppendorf tube and evaporated (Dry Thermobath, Eyela, Tokyo, Japan)
under a gentle stream of nitrogen gas at 50°C. The residue was
reconstituted in 100 μl of the mobile phase and 50 μl was injected
directly onto a reversed-phase (C18) HPLC column
(Inertsil ODS-2; 150 mm, l.0×4.6 mm, i.d.; particle size, 5 μm;
Metachem Technologies, Redondo Beach, CA, USA). The mobile phases,
methanol:water at a ratio of 50:50 (v/v) for rat plasma and
gastrointestinal tract samples and 45:55 (v/v) for the urine
samples, were run at a flow-rate of 1.0 ml/min, and the column
eluent was monitored using an ultraviolet detector at 220 nm at
room temperature. The retention times of etoposide and
podophyllotoxin (internal standard) in rat plasma and
gastrointestinal tract samples were ~6 and 12 min, respectively,
and the corresponding values in rat urine samples were ~10 and 21
min, respectively. The quantitation limits of etoposide in rat
plasma, urine and gastrointestinal tract samples were 0.05, 0.5 and
0.5 μg/ml, respectively. The inter- and intra-day coefficients of
variation were <10.9, 9.61 and 13.2% in the concentration ranges
of 0.05–5,000, 0.5–5,000 and 0.5–5,000 μg/ml for plasma, urine and
gastrointestinal tract samples, respectively.
Pharmacokinetic analysis
Standard methods (37) were used to calculate the following
pharmacokinetic parameters using a non-compartmental analysis
(WinNonlin 2.1; Pharsight Corp., Mountain View, CA, USA): the total
area under the plasma concentration-time curve from time zero to
infinity (AUC) (38), the
time-averaged total body, renal and non-renal clearances (CL,
CLR and CLNR, respectively), the terminal
half-life, the first moment of AUC (AUMC), the mean residence time
(MRT), the apparent volume of distribution at steady state
(Vss) and the extent of absolute
oral bioavailability (F). The peak plasma concentration
(Cmax) and time to reach
Cmax(Tmax)
were obtained directly from the experimental data.
Statistical analysis
A P-value <0.05 was deemed to be statistically
significant using a Duncan’s multiple range test of the Statistical
Package for the Social Sciences (SPSS Inc., Chicago, IL, USA) and
the posteriori analysis of variance (ANOVA) among the three
means for the unpaired data. All data are expressed as mean ± SD
apart from Tmax which was expressed as
median (range).
Results
Rat plasma protein binding of
etoposide
Protein binding values of etoposide to fresh plasma
from the control and DMBA rats were 73.0±6.20% and 60.6±5.56%,
respectively; the values were significantly different (P<0.05)
between the two groups of rats.
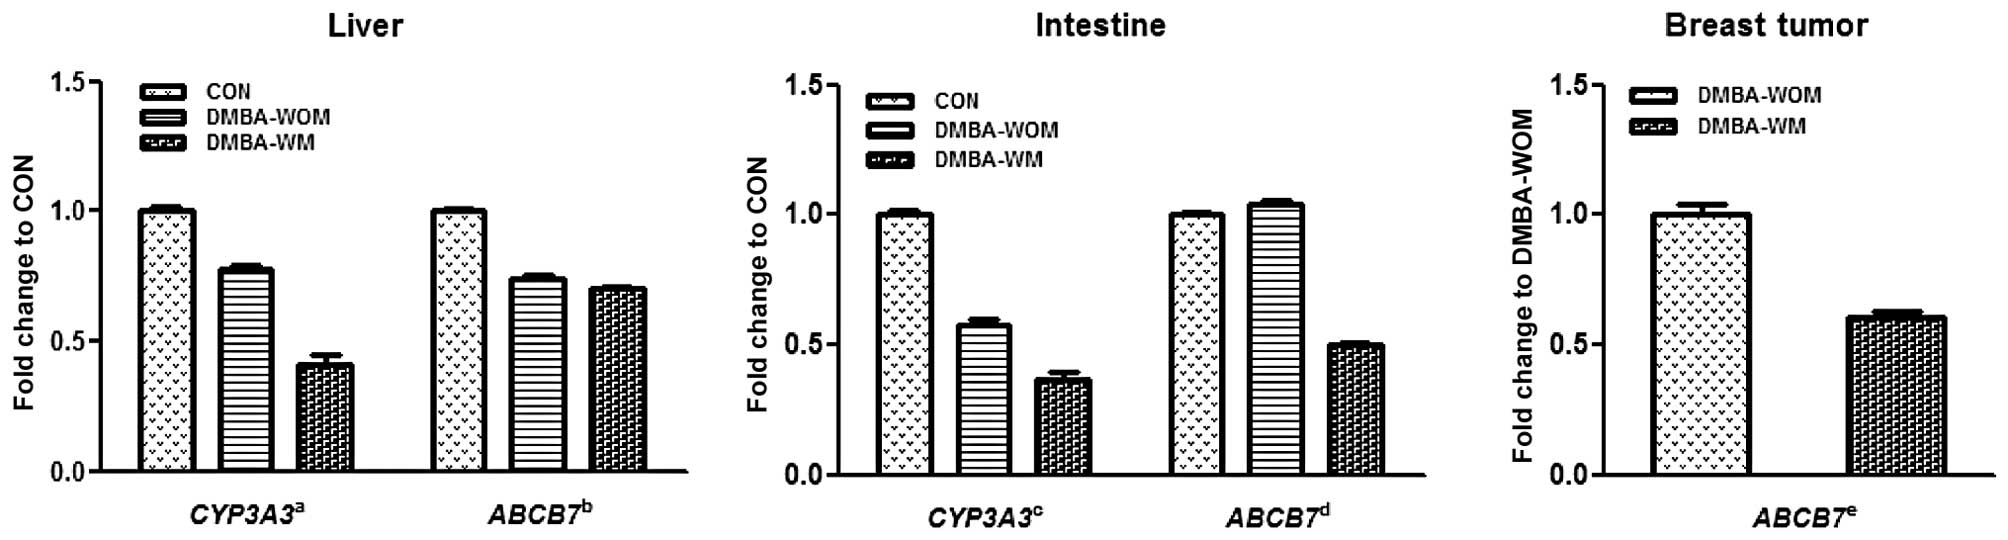
qRT-PCR
The hepatic and intestinal mRNA levels of
CYP3A3 and ABCB7 were measured by qRT-PCR analysis
using hepatic and intestinal RNA prepared from the control,
DMBA-WOM and DMBA-WM rats. The ABCB7 level was analyzed in
breast tumors from the DMBA-WOM and DMBA-WM rats (Fig. 1). The expression of CYP3A3 in
the DMBA-WOM and DMBA-WM rats was significantly decreased by 22.2
and 58.7% in the liver (P<0.001) and by 42.2 and 63.7% in the
intestine (P<0.001), respectively, as compared to these values
in the control. The expression of hepatic ABCB7 was also
significantly decreased (P<0.001) to 74.0 and 69.9% of the
control in the DMBA-WOM and DMBA-WM rats. However, the expression
of intestinal ABCB7 was not changed in the DMBA-WOM rats
compared to that in the control rats but was significantly
decreased (P<0.001) in the DMBA-WM rats by 50.1 and 54.0% as
compared to the control and DMBA-WOM rats, respectively. Similarly,
the expression of ABCB7 in the breast tumors was
significantly decreased by 39.2% (P<0.001) in the DMBA-WM rats
as compared to that in the DMBA-WOM rats, whereas CYP3A3 was
not detected in breast tumors of both groups of rats. These results
revealed that the mRNA expression of both CYP3A3 and
ABCB7 was inhibited by morin to a similar extent in the
liver, intestine and breast tumors of the chemically induced
mammary tumor-bearing rats apart from ABCB7 in the intestine
of DMBA-WOM rats.
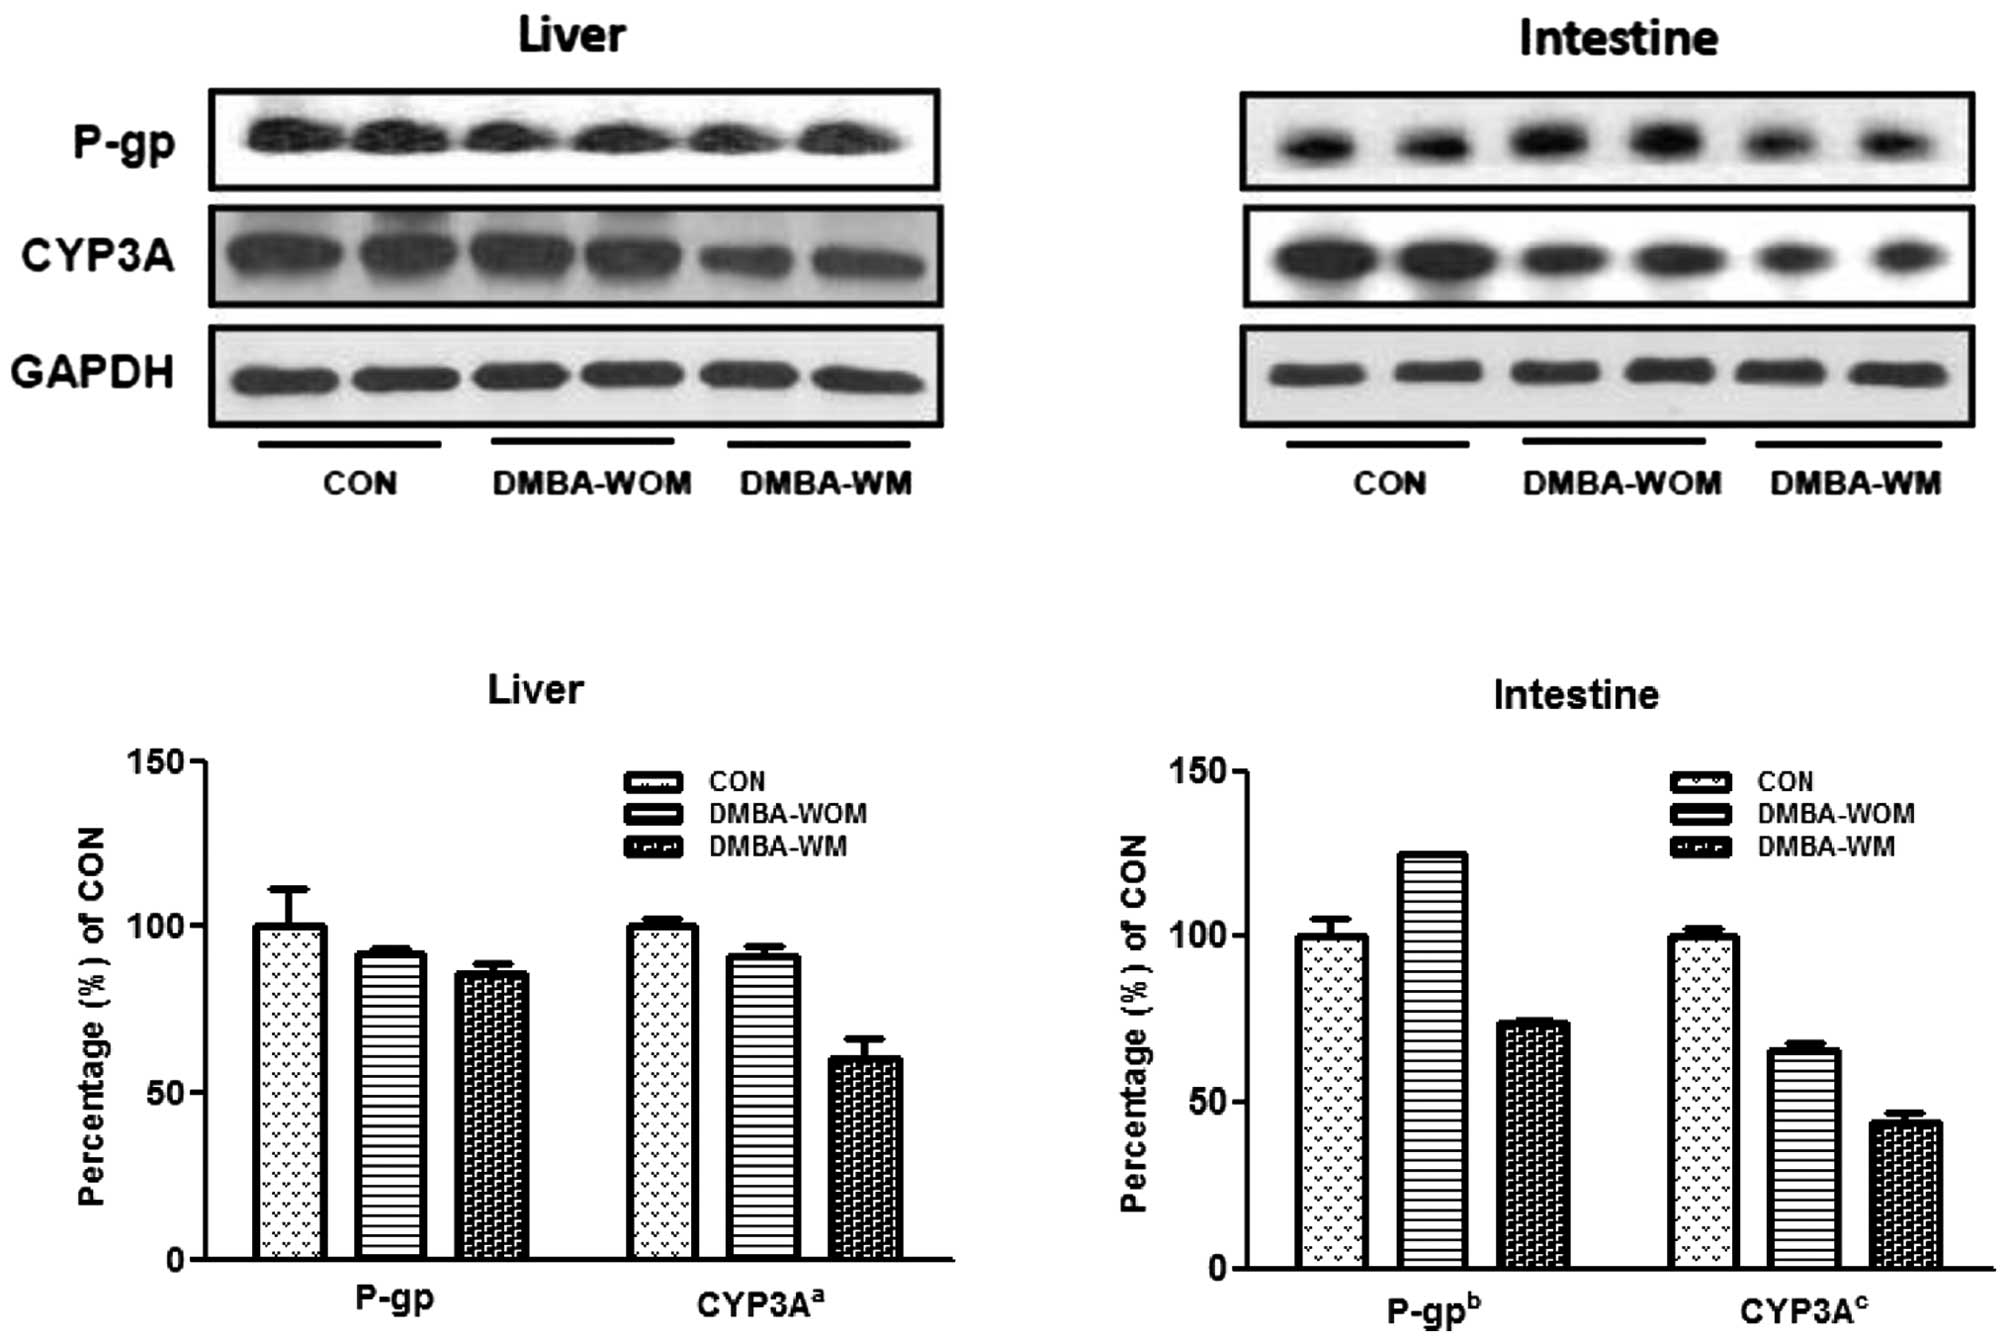
Immunoblot analysis
The hepatic and intestinal protein levels for CYP3A
and P-gp were determined by immunoblot analysis in all treated rats
(Fig. 2). The hepatic CYP3A protein
expression in DMBA-WM rats was significantly decreased (P<0.05)
compared to the expression in the control and DMBA-WOM rats,
whereas hepatic P-gp protein expression was not significantly
different among all groups of rats. Intestinal CYP3A was
significantly decreased in the DBMA-WOM (P<0.01) and DMBA-WM
(P<0.001) rats compared to this value in the control rats;
however, intestinal P-gp protein expression increased by 25.0% in
the DMBA-WOM rats but was significantly decreased by 26.1%
(P<0.05) in the DMBA-WM rats compared to the control rats and
was significantly different (P<0.01) between the DMBA-WOM and
DMBA-WM rats. The protein expression of CYP3A and P-gp was not
detected in breast tumors of all groups.
Preliminary study
In DMBA rats, the serum levels of total proteins
(6.64±0.297 vs. 7.46±0.550 g/dl for DMBA and control rats,
respectively) were significantly lower (by 11.0%, P<0.05) than
this level in the control rats, while the serum levels of GOT
(105±20.1 vs. 68.8±13.8 IU/l for DMBA and control rats,
respectively) were significantly higher (by 52.6%, P<0.05) when
compared with the control rats. In DMBA rats, the total protein
level was in a similar range (4.70–8.15 g/dl) as that reported but
the GOT level was higher (45.7–80.8 IU/l) than values in rats
reported previously (39). The
serum levels of albumin, urea nitrogen, GPT, and creatinine
clearance (CLCR) were not significantly different
between the two groups of rats (data not shown). The above data
suggest that the liver function seemed to be impaired in DMBA rats.
This was supported by liver microscopy in the DMBA rats; mild
chronic hepatitis, chronic portal inflammation with mild portal
fibrosis and focal inflammation in granuloma were observed.
However, there were no significant findings in the liver of control
rats. No significant changes were observed in the kidneys of both
groups of rats based on kidney microscopy. Moderately
differentiated adenocarcinoma in the DMBA-induced mammary tumors
was observed based on tumor microscopy.
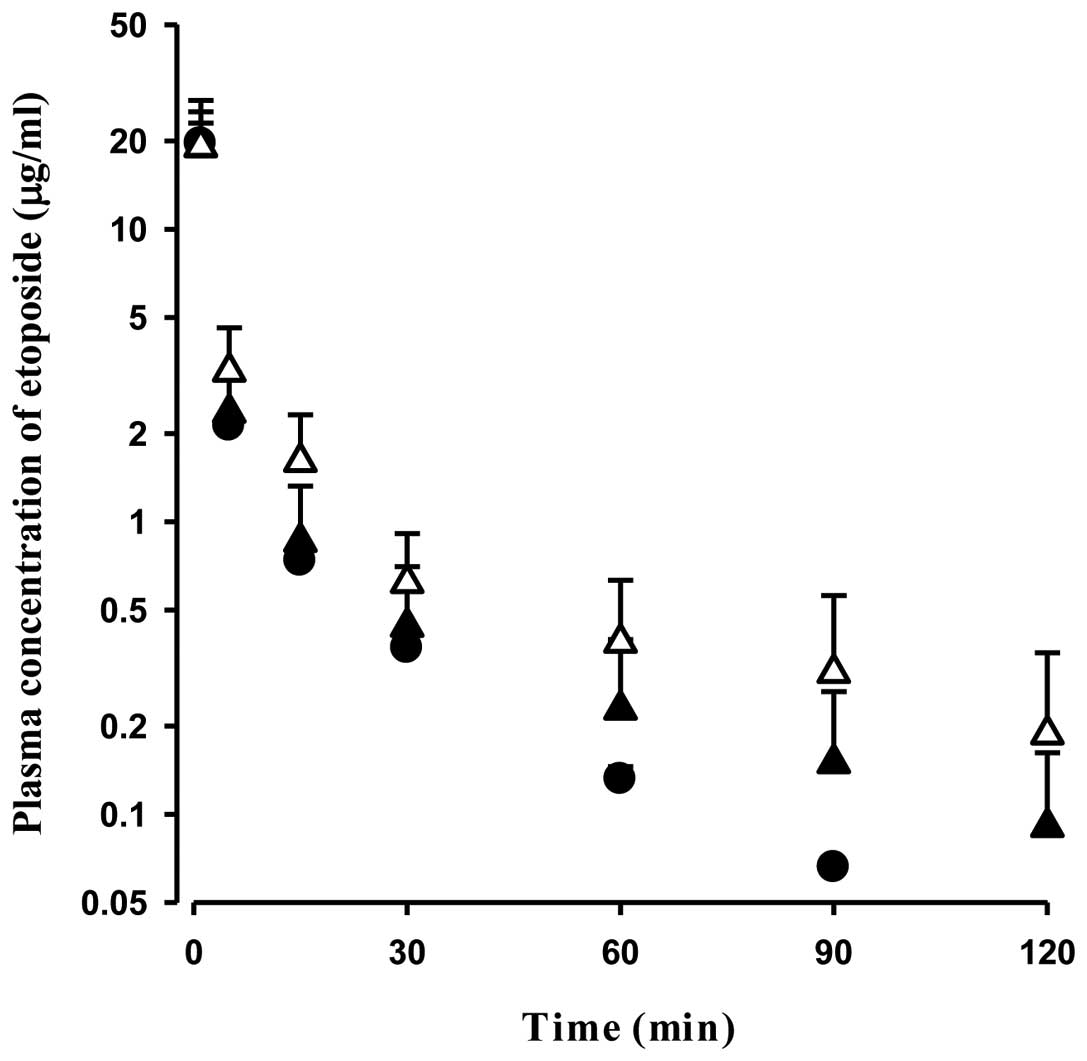
Pharmacokinetics of etoposide after its
intravenous administration
The mean arterial plasma concentration-time profiles
for the intravenous administration of etoposide at a dose of 2
mg/kg in the control, DMBA-WOM and DMBA-WM rats are shown in
Fig. 3. The relevant
pharmacokinetic parameters are listed in Table I. In DMBA-WM rats, the AUC was
significantly greater (by 64.8%, P<0.05) and considerably
greater (by 49.9%, P=0.103), respectively, than the control and
DMBA-WOM rats. Terminal half-life (by 157 and 54.4%, respectively)
and MRT (by 194 and 75.8%, respectively) were significantly longer
when compared with the control and DMBA-WOM rats. CL and
CLNR were significantly slower (by 34.1 and 36.1%,
respectively) in DMBA-WM rats than those of control rats, and
Vss was significantly larger (by 76.8%)
than that of the control rats. The pharmacokinetic values apart
from terminal half-life and Vss were not
significantly different between the control and DMBA-WOM rats.
 | Table IPharmacokinetic parameters of
etoposide after its intravenous administration (2 mg/kg) in control
and DMBA rats without (DMBA-WOM) and with (DMBA-WM) morin (15
mg/kg). |
Table I
Pharmacokinetic parameters of
etoposide after its intravenous administration (2 mg/kg) in control
and DMBA rats without (DMBA-WOM) and with (DMBA-WM) morin (15
mg/kg).
| Parameter | Control (n=6) | DMBA-WOM (n=7) | DMBA-WM (n=7) |
|---|
| Body weight
(g) | 294±13.9 | 284±44.7 | 272±20.6 |
| AUC
(μg·min/ml)a | 81.3±14.2 | 89.4±39.6 | 134±52.9 |
| Terminal half-life
(min)b | 23.7±4.18 | 39.5±4.83 | 61.0±21.4 |
| MRT (min)c | 15.8±3.44 | 26.4±5.98 | 46.4±20.2 |
| CL
(ml/min/kg)a | 25.2±4.07 | 24.8±6.65 | 16.6±4.79 |
| CLR
(ml/min/kg) | 3.56±1.27 | 4.34±2.60 | 2.71±1.33 |
| CLNR
(ml/min/kg)a | 21.6±2.99 | 21.1±6.52 | 13.8±4.57 |
|
Vss (ml/kg)d | 400±112 | 631±141 | 707±234 |
| Ae0–24
h (% of i.v. dose) | 5.52±1.40 | 7.10±3.32 | 6.88±3.53 |
| GI24 h
(% of i.v. dose) | 1.02±0.315 | 1.50±1.26 | 1.40±0.811 |
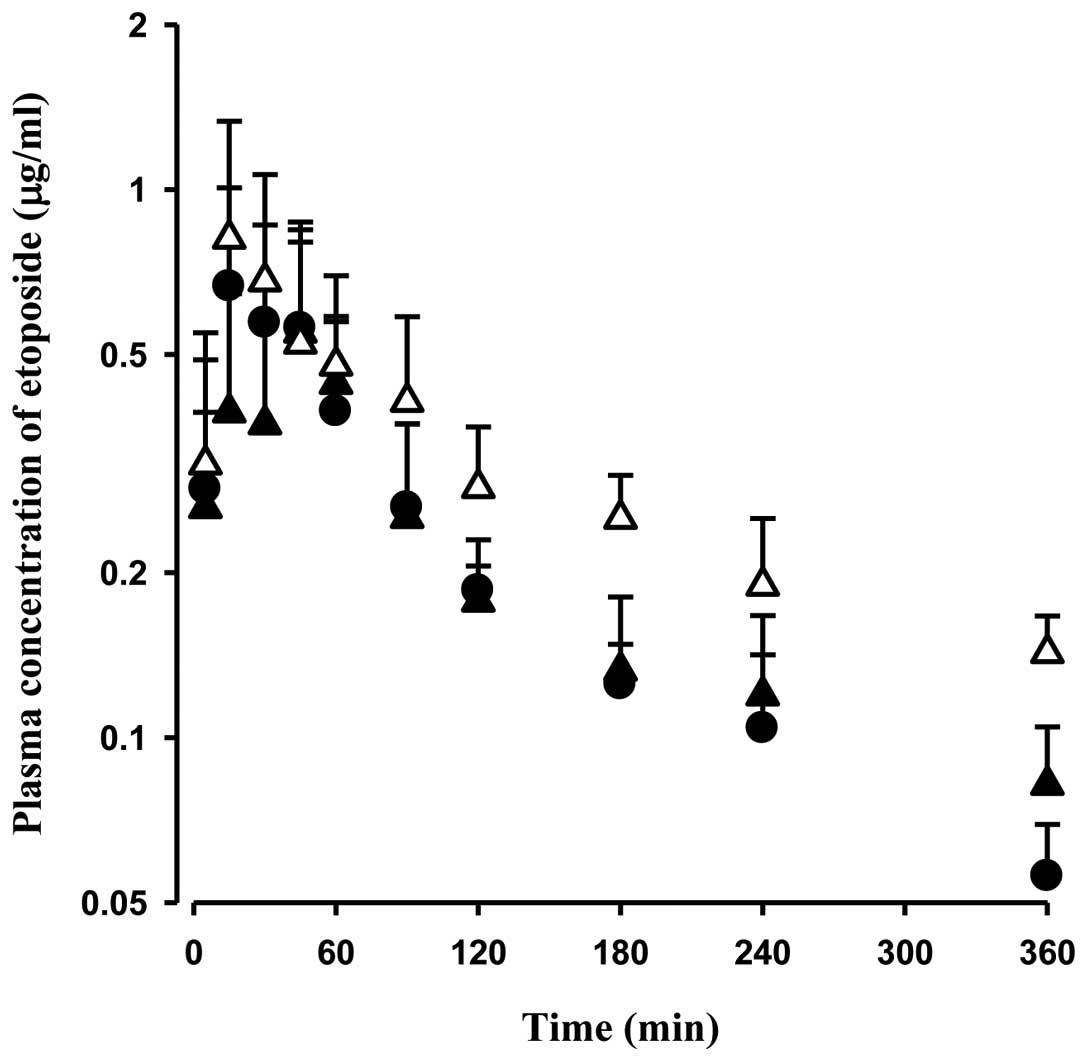
Pharmacokinetics of etoposide after its
oral administration
The mean arterial plasma concentration-time profiles
for the oral administration of etoposide at a dose of 10 mg/kg in
the control, DMBA-WOM and DMBA-WM rats are shown in Fig. 4. The relevant pharmacokinetic
parameters are listed in Table II.
After the oral administration of etoposide, its absorption from the
rat gastrointestinal tract was rapid; etoposide was detected in the
plasma from the first blood sampling time point (5 min) for all
rats studied. In DMBA-WM rats, the AUC was significantly greater
(by 80.5 and 62.5%, respectively) than AUC in the control and
DMBA-WOM rats, and the percentage of the dose recovered from the
gastrointestinal tract at 24 h (GI24 h) was
significantly smaller (by 52.5%) than this percentage in the
control rats. The pharmacokinetic values were not significantly
different between the control and DMBA-WOM rats.
| Table IIPharmacokinetic parameters of
etoposide after its oral administration (10 mg/kg) in control and
DMBA rats without (DMBA-WOM) and with (DMBA-WM) morin (15
mg/kg). |
Table II
Pharmacokinetic parameters of
etoposide after its oral administration (10 mg/kg) in control and
DMBA rats without (DMBA-WOM) and with (DMBA-WM) morin (15
mg/kg).
| Parameter | Control (n=6) | DMBA-WOM (n=6) | DMBA-WM (n=5) |
|---|
| Body weight
(g) | 306±28.5 | 318±36.9 | 259±20.7 |
| AUC
(μg·min/ml)a | 82.0±23.0 | 91.1±12.5 | 148±28.5 |
| Terminal half-life
(min) | 157±45.6 | 208±73.3 | 221±51.8 |
|
Cmax (μg/ml) | 0.777±0.243 | 0.657±0.244 | 0.895±0.492 |
|
Tmax (min)b | 15.0
(5.00–45.0) | 45.0
(15.0–45.0) | 15.0
(15.0–30.0) |
| CLR
(ml/min/kg) | 2.75±1.43 | 4.20±2.60 | 1.69±1.42 |
| Ae0–24
h (% of oral dose) | 4.72±1.99 | 7.64±4.45 | 4.53±3.38 |
| GI24 h
(% of oral dose)c | 23.6±8.67 | 13.2±10.8 | 11.2±5.10 |
| F (%) | 20.2 | 20.4 | 22.1 |
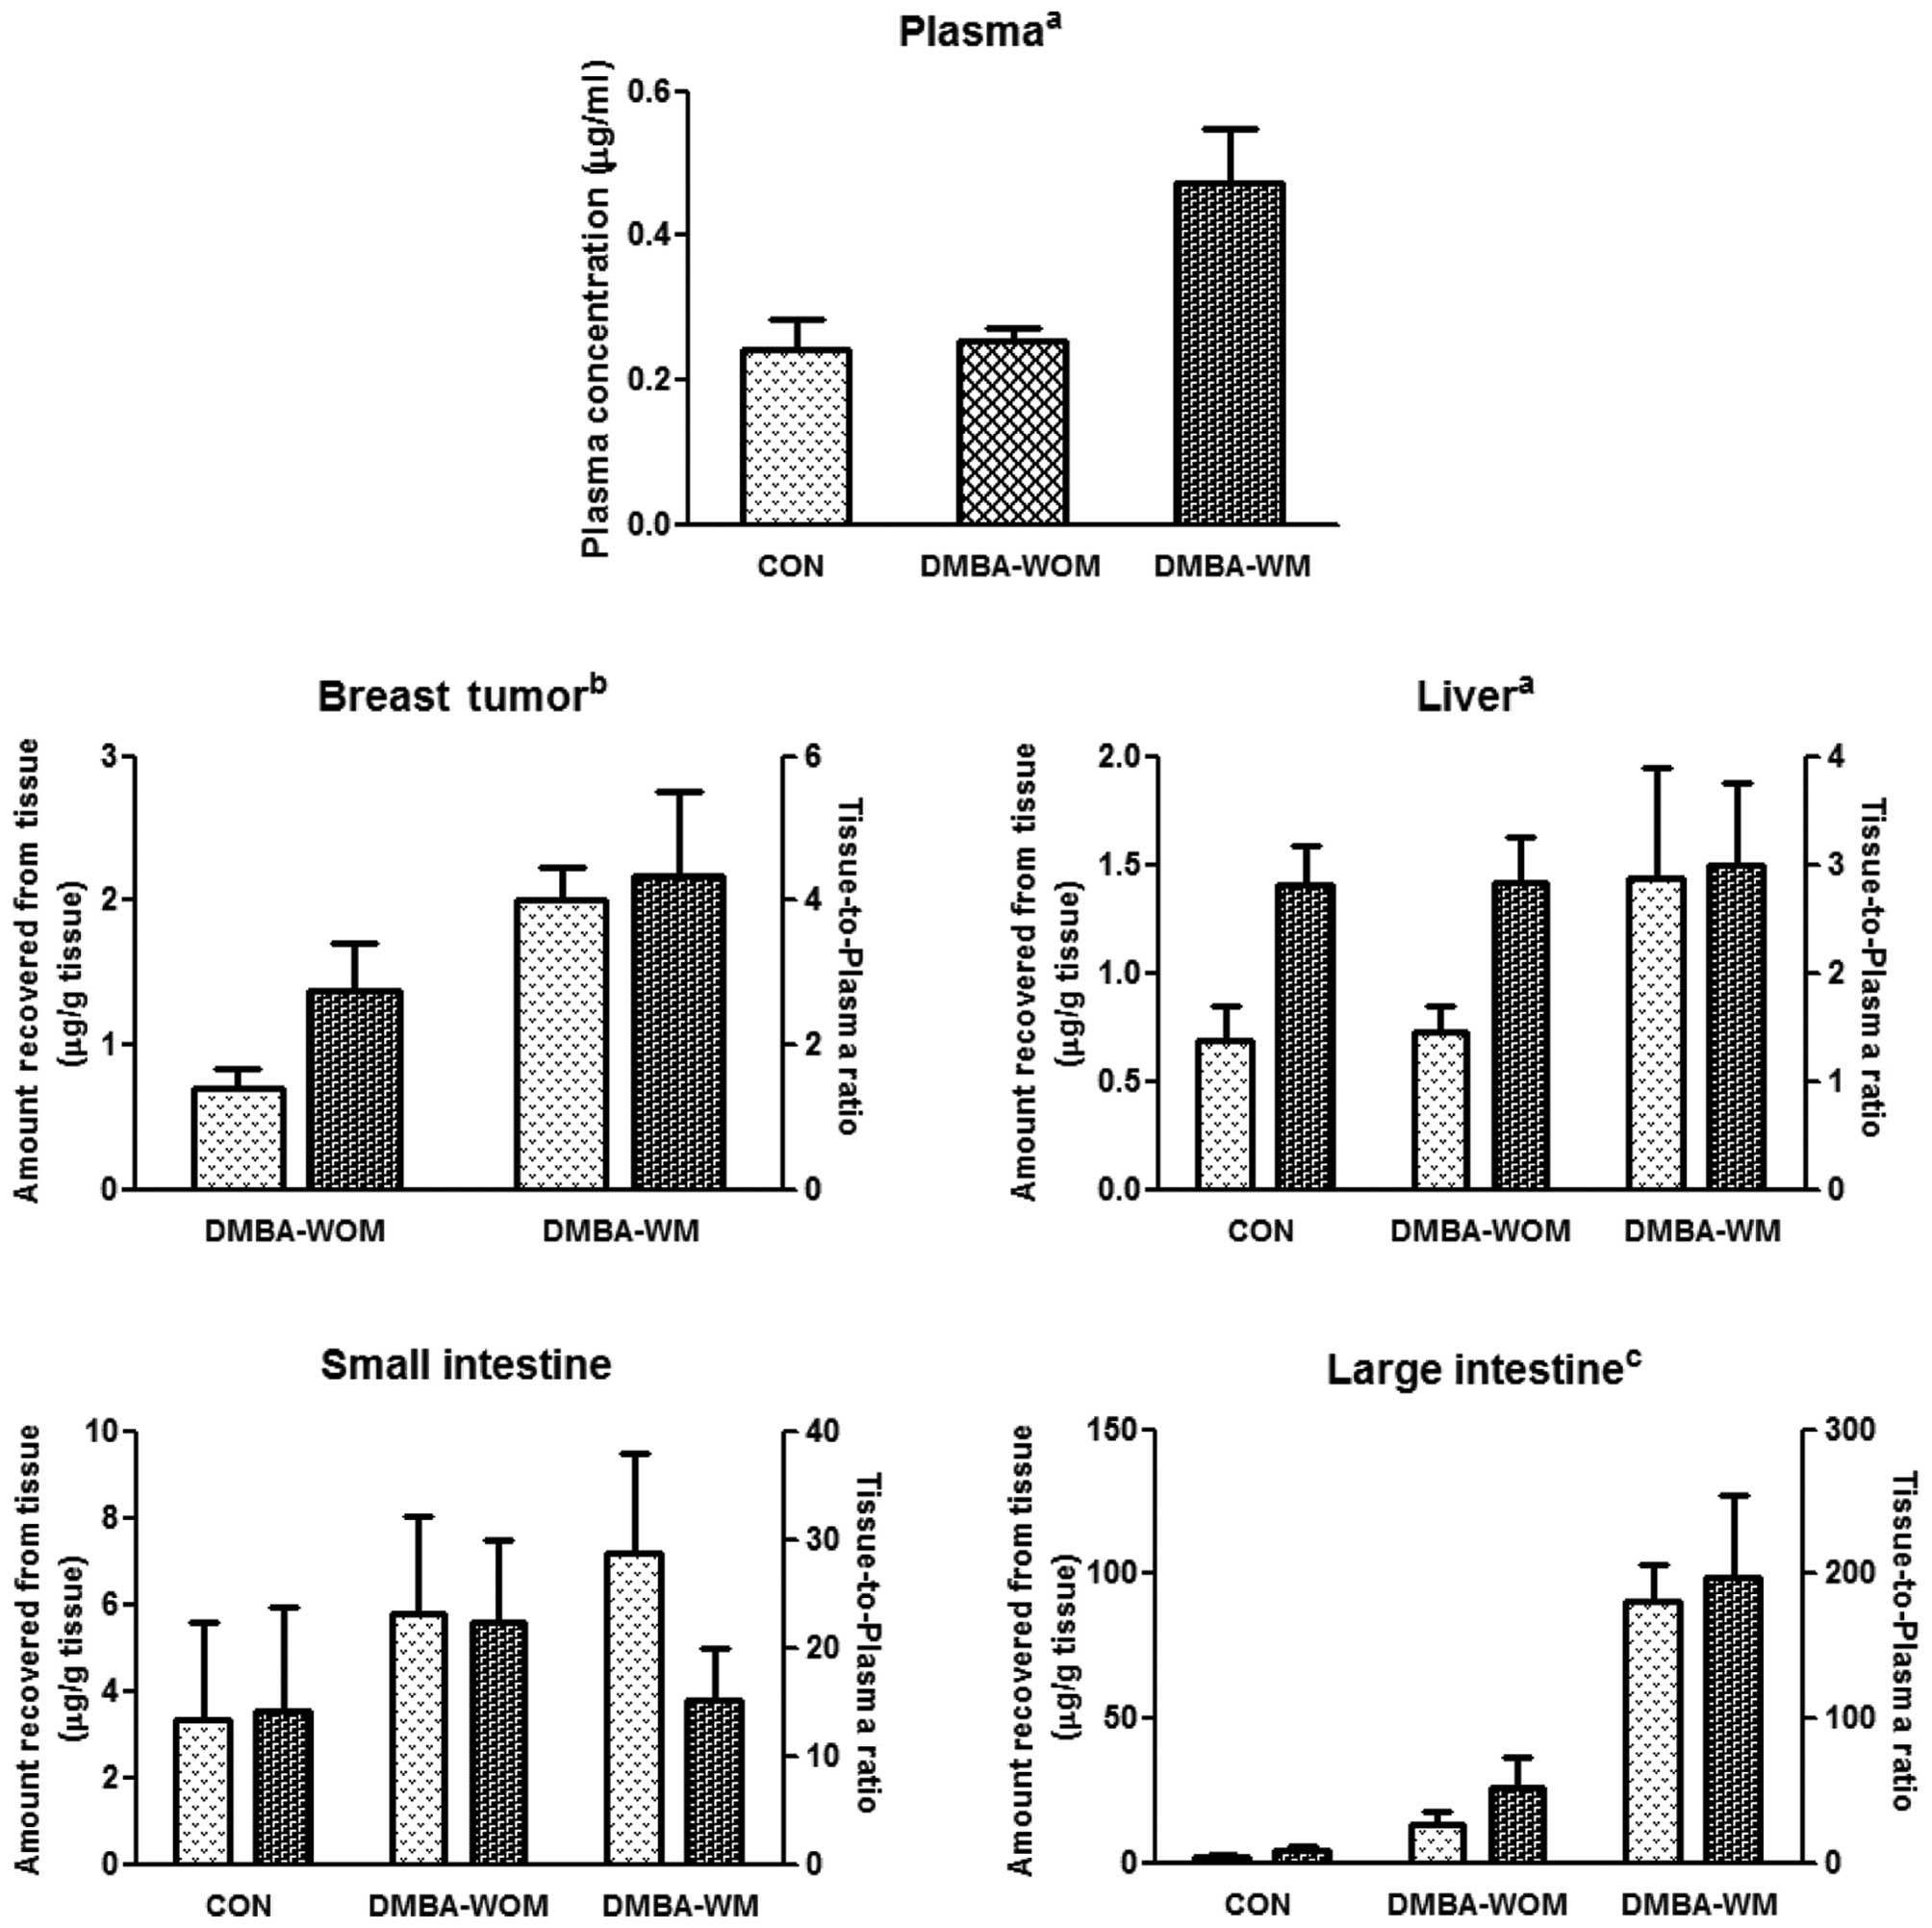
Tissue distribution of etoposide after
its oral administration
Tissue distribution of oral etoposide (10 mg/kg) in
the liver, small intestine, large intestine and breast tumors (for
mammary tumor rats) is shown in Fig.
5. Rat tissues had a good affinity to etoposide; the
tissue-to-plasma ratios of etoposide at 90 min were greater than
unity in all tissues studied. This could support the considerable
Vss values of etoposide, in the range of
400–707 ml/kg (Table I). Generally,
the amount of etoposide recovered from each tissue and/or the
tissue-to-plasma ratios in rat studied were significantly higher in
DMBA-WM rats, particularly in the breast tumors, liver and large
intestine, compared to control rats (Fig. 5).
Discussion
It has been reported that etoposide is mainly
metabolized in rat liver (40,41).
Thus, the CLNR values of etoposide listed in Table I may represent its hepatic metabolic
clearances in rats. The contribution of the CLNR of
etoposide to the CL was considerable; the values were greater than
83.1% in all groups of rats (Table
I). Thus, the significantly greater AUC of intravenous
etoposide in DMBA-WM rats could have been due to the significantly
slower CLNR when compared to the control and DMBA-WOM
rats (Table I). Etoposide is a drug
with a low hepatic extraction ratio (7.84%) in rats (36), thus its hepatic clearance depends on
its hepatic intrinsic clearance and its free (unbound to plasma
proteins) fraction in plasma (42).
Following the intravenous administration of
etoposide in the control and DMBA-WOM rats, its AUC, CL and
CLNR values were comparable (Table I). This suggests that DMBA did not
considerably affect the hepatic metabolism of etoposide in rats,
although in DMBA-WOM rats, the free fraction of etoposide in plasma
was greater (39.4%) than that in the control rats (27.0%), and the
mRNA level of hepatic CYP3A3 was significantly decreased
when compared to the control rats (Fig.
1). The effect of free fraction on the hepatic clearance of
etoposide could not be considerable since etoposide is a drug with
a low hepatic extraction ratio; the free fraction of etoposide in
plasma was already considerable (27.0%) in the control rats and the
protein expression of hepatic CYP3A subfamily was not significantly
different in the DMBA-WOM rats compared to the control rats
(Fig. 2). Therefore, in DMBA-WM
rats, the greater AUC and slower CLNR of etoposide than
those in control and DMBA-WOM rats could be due to inhibition of
hepatic CYP3A by morin. This was supported by the protein and mRNA
expression of CYP3A (Figs. 1 and
2). The hepatic protein and mRNA
expression of CYP3A in DMBA-WM rats was significantly decreased
when compared to the control and DMBA-WOM rats. Thus, the amount
(concentration) of etoposide taken into the liver may be somewhat
greater than the saturation level of hepatic metabolism of
etoposide. The contribution of P-gp was not considerable since the
protein expression of P-gp was not significantly different among
the three groups of rats (Fig.
2).
Following the oral administration of etoposide in
the control and DMBA-WOM rats, the AUCs were also comparable
(Table II). This suggests that the
effect of DMBA on the intestinal metabolism of etoposide was not
considerable, even though the protein expression of CYP3A was
decreased while the P-gp expression was increased in the DMBA-WOM
rats compared to that in the control rats (Fig. 2). However, the AUC of etoposide in
the DMBA-WM rats was significantly greater than the AUC noted in
the control and DMBA-WOM rats. The protein expression of CYP3A and
P-gp was significantly decreased in the DMBA-WM rats compared to
the levels in the control and DMBA-WOM rats and this could be due
to the inhibition of CYP3A and P-gp by morin (18) and thus contributed to the greater
AUC of oral etoposide.
This finding was also supported by the increased
tissue/plasma ratio of etoposide in the DMBA-WM rats in the large
intestine 90 min after oral administration of etoposide (Fig. 5). A similar result was reported that
oral AUC of etoposide increased significantly (by 45.8%) in rats
via orally administered morin (19). Etoposide was reported to be a
substrate for P-gp based on everted gut sacs prepared from rat
jejunum and ileum (6) and its
intestinal absorption was found to be regulated by P-gp (6,7). It
has been reported that the transport of etoposide was significantly
increased from the luminal site to the serosal site in the jejunum
in the presence of P-gp inhibitor (43). A similar trend was also observed in
the ileal sacs. This in vitro exsorption study also
demonstrated that P-gp inhibitor reduced the efflux of etoposide to
the luminal site in either the jejunum or ileum (43). Therefore, the significantly
increased AUC of etoposide in the DMBA-WM group may be due to the
increased absorption of etoposide from the gastrointestinal tract
via inhibition of intestinal P-gp and decreased intestinal
metabolism of etoposide via inhibition of intestinal CYP3A
subfamily by morin. This was supported by the protein and mRNA
expression of P-gp and CYP3A (Figs.
1 and 2). The intestinal
protein and mRNA expression of P-gp in the DMBA-WM rats was
significantly decreased compared to these values in the control
rats. Thus, the amount (concentration) of etoposide absorbed
through the intestine could be somewhat greater than the saturation
level of intestinal metabolism of etoposide. The contribution of
intestinal CYP3A subfamily was also considerable since the
intestinal protein expression of CYP3A was significantly decreased
in the DMBA-WM rats compared to levels in the control and DMBA-WOM
rats (Fig. 2), which might reduce
the intestinal first-pass metabolism of etoposide and increase the
availability of etoposide.
In summary, in DMBA-WM rats, morin significantly
increased the AUC of intravenous etoposide due to the inhibition of
hepatic CYP3A. Morin also increased the AUC of oral etoposide.
Greater AUC of oral etoposide was mainly due to the inhibition of
intestinal P-gp and CYP3A subfamily by morin. These results are
useful in predicting and designing clinical studies to investigate
the interaction between etoposide and morin. In addition, if the
present data obtained in rats is extrapolated to humans, the dosage
regimen of etoposide used in the clinical situation should be
modified to take account of the decreased metabolism and increased
absorption of the drugs, particularly with chronic administration
schedules. Further experiments in humans are required to confirm
the above hypothesis.
Acknowledgements
This study was supported by Basic Science Research
Program through the National Research Foundation of Korea (NRF)
funded by the Ministry of Education, Science and Technology
(2009-0066765).
References
|
1
|
Clark PI and Slevin ML: The clinical
pharmacology of etoposide and teniposide. Clin Pharmacokinet.
12:223–252. 1987. View Article : Google Scholar : PubMed/NCBI
|
|
2
|
de Jong RS, Mulder NH, Dijksterhuis D and
de Vries EG: Review of current clinical experience with prolonged
(oral) etoposide in cancer treatment. Anticancer Res. 15:2319–2330.
1995.PubMed/NCBI
|
|
3
|
van Maanen JM, de Vries J, Pappie D, van
den Akker E, Lafleur VM, Retel J, van der Greef J and Pinedo HM:
Cytochrome P-450-mediated O-demethylation: a route in the metabolic
activation of etoposide (VP-16–213). Cancer Res. 47:4658–4662.
1987.PubMed/NCBI
|
|
4
|
Relling MV, Nemec J, Schuetz EG, Schuetz
JD, Gonzalez FJ and Korzekwa KR: O-demethylation of
epipodophyllotoxins is catalyzed by human cytochrome P450 3A4. Mol
Pharmacol. 45:352–358. 1994.PubMed/NCBI
|
|
5
|
Kawashiro T, Yamashita K, Zhao XJ, Koyama
E, Tani M, Chiba K and Ishizaki T: A study on the metabolism of
etoposide and possible interactions with antitumor or supporting
agents by human liver microsomes. J Pharmacol Exp Ther.
286:1294–1300. 1998.PubMed/NCBI
|
|
6
|
Leu BL and Huang JD: Inhibition of
intestinal P-glycoprotein and effects on etoposide absorption.
Cancer Chemother Pharmacol. 35:432–436. 1995. View Article : Google Scholar : PubMed/NCBI
|
|
7
|
Makhey VD, Guo A, Norris DA, Hu P, Yan J
and Sinko PJ: Characterization of the regional intestinal kinetics
of drug efflux in rat and human intestine and in Caco-2 cells.
Pharm Res. 15:1160–1167. 1998. View Article : Google Scholar : PubMed/NCBI
|
|
8
|
Lagas JS, Fan L, Wagenaar E, Vlaming ML,
van Tellingen O, Beijnen JH and Schinkel AH: P-glycoprotein
(P-gp/Abcb1), Abcc2, and Abcc3 determine the pharmacokinetics of
etoposide. Clin Cancer Res. 16:130–140. 2010. View Article : Google Scholar : PubMed/NCBI
|
|
9
|
Lum BL, Kaubisch S, Yahanda AM, Adler KM,
Jew L, Ehsan MN, Brophy NA, Halsey J, Gosland MP and Sikic BI:
Alteration of etoposide pharmacokinetics and pharmacodynamics by
cyclosporine in a phase I trial to modulate multidrug resistance. J
Clin Oncol. 10:1635–1642. 1992.PubMed/NCBI
|
|
10
|
Carcel-Trullols J, Torres-Molina F, Araico
A, Saadeddin A and Peris JE: Effect of cyclosporine A on the tissue
distribution and pharmacokinetics of etoposide. Cancer Chemother
Pharmacol. 54:153–160. 2004.PubMed/NCBI
|
|
11
|
El-Rayes BF, Ali S, Heilbrun LK, Lababidi
S, Bouwman D, Visscher D and Philip PA: Cytochrome P450 and
glutathione transferase expression in human breast cancer. Clin
Cancer Res. 9:1705–1709. 2003.PubMed/NCBI
|
|
12
|
Sandanaraj E, Lal S, Selvarajan V, Ooi LL,
Wong ZW, Wong NS, Ang PC, Lee EJ and Chowbay B: PXR
pharmacogenetics: association of haplotypes with hepatic CYP3A4 and
ABCB1 messenger RNA expression and doxorubicin clearance in Asian
breast cancer patients. Clin Cancer Res. 14:7116–7126. 2008.
View Article : Google Scholar : PubMed/NCBI
|
|
13
|
Dixon RA and Steele CL: Flavonoids and
isoflavonoids - a gold mine for metabolic engineering. Trends Plant
Sci. 4:394–400. 1999. View Article : Google Scholar : PubMed/NCBI
|
|
14
|
Francis AR, Shetty TK and Bhattacharya RK:
Modulating effect of plant flavonoids on the mutagenicity of
N-methyl-N′-nitro-N-nitrosoguanidine. Carcinogenesis. 10:1953–1955.
1989.PubMed/NCBI
|
|
15
|
Hanasaki Y, Ogawa S and Fukui S: The
correlation between active oxygens scavenging and antioxidative
effects of flavonoids. Free Radic Biol Med. 16:845–850. 1994.
View Article : Google Scholar : PubMed/NCBI
|
|
16
|
Fang SH, Hou YC, Chang WC, Hsiu SL, Chao
P-DL and Chiang BL: Morin sulfates/glucuronides exert
anti-inflammatory activity on activated macrophages and decreased
the incidence of septic shock. Life Sci. 74:743–756. 2003.
View Article : Google Scholar : PubMed/NCBI
|
|
17
|
Hodek P, Trefil P and Stiborova M:
Flavonoids - potent and versatile biologically active compounds
interacting with cytochromes P450. Chem Biol Interact. 139:1–21.
2002. View Article : Google Scholar : PubMed/NCBI
|
|
18
|
Zhang S and Morris ME: Effects of the
flavonoids biochanin A, morin, phloretin, and silymarin on
P-glycoprotein-mediated transport. J Pharmacol Exp Ther.
304:1258–1267. 2003. View Article : Google Scholar : PubMed/NCBI
|
|
19
|
Li X, Yun JK and Choi JS: Effects of morin
on the pharmacokinetics of etoposide in rats. Biopharm Drug Dispos.
28:151–156. 2007. View
Article : Google Scholar : PubMed/NCBI
|
|
20
|
Shin SC, Piao YJ and Choi JS: Effects of
morin on the bioavailability of tamoxifen and its main metabolite,
4-hydroxytamoxifen, in rats. In Vivo. 22:391–396. 2008.PubMed/NCBI
|
|
21
|
Piao YJ and Choi JS: Effects of morin on
the pharmacokinetics of nicardipine after oral and intravenous
administration of nicardipine in rats. J Pharm Pharmacol.
60:625–629. 2008. View Article : Google Scholar : PubMed/NCBI
|
|
22
|
Hong SS, Jin MJ and Han HK: Enhanced
systemic availability of methotrexate in the presence of morin in
rats. Biopharm Drug Dispos. 29:189–193. 2008. View Article : Google Scholar : PubMed/NCBI
|
|
23
|
Pathak SM and Udupa N: Pre-clinical
evidence of enhanced oral bioavailability of the P-glycoprotein
substrate talinolol in combination with morin. Biopharm Drug
Dispos. 31:202–214. 2010.PubMed/NCBI
|
|
24
|
Russo J and Russo IH: Atlas and histologic
classification of tumors of rat mammary gland. J Mammary Gland Biol
Neoplasia. 5:187–200. 2000. View Article : Google Scholar : PubMed/NCBI
|
|
25
|
Kim YC, Lee I, Kim SG, Ko SH, Lee MG and
Kim SH: Effects of glucose supplementation on the pharmacokinetics
of intravenous chlorzoxazone in rats with water deprivation for 72
hours. Life Sci. 79:2179–2186. 2006. View Article : Google Scholar : PubMed/NCBI
|
|
26
|
Yang SH, Lee JH, Lee DY, Lee MG, Lyuk KC
and Kim SH: Effects of morin on the pharmacokinetics of docetaxel
in rats with 7,12-dimethylbenz[a]anthracene (DMBA)-induced mammary
tumors. Arch Pharm Res. 34:1729–1734. 2011.PubMed/NCBI
|
|
27
|
Fendl KC and Zimniski SJ: Role of
tamoxifen in the induction of hormone-independent rat mammary
tumors. Cancer Res. 52:235–237. 1992.PubMed/NCBI
|
|
28
|
Huggins C, Grand LC and Brillantes FP:
Mammary cancer induced by a single feeding of polymucular
hydrocarbons, and its suppression. Nature. 189:204–207. 1961.
View Article : Google Scholar : PubMed/NCBI
|
|
29
|
Lee DY, Jung YS, Kim YC, Kim SY and Lee
MG: Faster clearance of omeprazole in mutant Nagase analbuminemic
rats: possible roles of increased protein expression of hepatic
CYP1A2 and lower plasma protein binding. Biopharm Drug Dispos.
30:107–116. 2009. View Article : Google Scholar
|
|
30
|
Øie S and Guentert TW: Comparison of
equilibrium times in dialysis experiments using spiked plasma or
spiked buffer. J Pharm Sci. 71:127–128. 1982.PubMed/NCBI
|
|
31
|
Choi YH, Lee I and Lee MG: Effects of
cysteine on metformin pharmacokinetics in rats with protein-calorie
malnutrition: partial restoration of some parameters to control
levels. J Pharm Pharmacol. 60:153–161. 2008. View Article : Google Scholar : PubMed/NCBI
|
|
32
|
Shirazi FH, Bahrami G, Stewart DJ, Tomiak
E, Delorme F, Noel D and Goel R: A rapid reversed phase high
performance liquid chromatographic method for determination of
etoposide (VP-16) in human plasma. J Pharm Biomed Anal. 25:353–356.
2001. View Article : Google Scholar : PubMed/NCBI
|
|
33
|
Kim SH, Choi YM and Lee MG:
Pharmacokinetics and pharmacodynamics of furosemide in
protein-calorie malnutrition. J Pharmacokinet Biopharm. 21:1–17.
1993. View Article : Google Scholar : PubMed/NCBI
|
|
34
|
Piao YJ, Li X and Choi JS: Effects of
verapamil on etoposide pharmacokinetics after intravenous and oral
administration in rats. Eur J Drug Metab Pharmacokinet. 33:159–164.
2008. View Article : Google Scholar : PubMed/NCBI
|
|
35
|
Li X and Choi JS: Effects of quercetin on
the pharmacokinetics of etoposide after oral or intravenous
administration of etoposide in rats. Anticancer Res. 29:1411–1415.
2009.PubMed/NCBI
|
|
36
|
Suh JH, Kang HE, Yoon IS, Yang SH, Lee HJ,
Shim CK and Lee MG: Cysteine effects of cysteine on the
pharmacokinetics of etoposide in protein-calorie malnutrition rats:
increased gastrointestinal absorption by cysteine. Xenobiotica.
41:885–894. 2011. View Article : Google Scholar : PubMed/NCBI
|
|
37
|
Gibaldi M and Perrier D: Pharmacokinetics.
2nd edition. Marcel-Dekker; New York: 1982
|
|
38
|
Chiou WL: Critical evaluation of the
potential error in pharmacokinetic studies using the linear
trapezoidal rule method for the calculation of the area under the
plasma level-time curve. J Pharmacokinet Biopharm. 6:539–546. 1978.
View Article : Google Scholar
|
|
39
|
Mitruka BM and Rawnsley HM: Clinical
Biomedical and Hematological Reference Values in Normal
Experimental Animals and Normal Humans. 2nd edition. Masson
Publishing USA Inc; New York: pp. 161–162. 1981
|
|
40
|
Hande K, Anthony L, Hamilton R, Bennett R,
Sweetman B and Branch R: Identification of etoposide glucuronide as
a major metabolite of etoposide in the rat and rabbit. Cancer Res.
48:1829–1834. 1988.PubMed/NCBI
|
|
41
|
Hande K, Bennett R, Hamilton R, Grote T
and Branch R: Metabolism and excretion of etoposide in isolated,
perfused rat liver models. Cancer Res. 48:5692–5695.
1988.PubMed/NCBI
|
|
42
|
Wilkinson GR and Shand DG: A physiological
approach to hepatic drug clearance. Clin Pharmacol Ther.
18:377–390. 1975.PubMed/NCBI
|
|
43
|
Kan WM, Liu YT, Hsiao CL, Shieh CY, Kuo
JH, Huang JD and Su SF: Effect of hydroxyzine on the transport of
etoposide in rat small intestine. Anticancer Drugs. 12:267–273.
2001. View Article : Google Scholar : PubMed/NCBI
|