Introduction
The mammalian target of rapamycin (mTOR) plays a key
role in the regulation of cellular metabolism, growth and
proliferation. It was found to mediate the anti-proliferative
activities of rapamycin and its analogues (rapalogues). It forms
two multi-protein complexes known as complex 1 (mTORC1) and 2
(mTORC2). Raptor and Rictor are the core proteins for mTORC1 and
mTORC2, respectively, known to be essential for the integrity of
their respective complexes (1,2). Rheb
(Ras homologue enriched in brain) is a key activator of mTORC1.
There is a growing body of evidence that mTORC1 is upregulated in
many types of cancers and plays a role in carcinogenesis (3).
Rapalogues have been clinically proven in the case
of renal cell carcinoma (4,5). However, this success is yet to be
replicated in the case of other cancers. A greater understanding of
the role of mTOR in various types of cancers is needed to determine
therapeutic strategies. To this end, studies have been carried out
to identify potential markers of rapamycin sensitivity, as well as
additional therapeutic agents (6,7).
The aim of the study was to investigate the mRNA
expression of mTORC1, Rictor, Raptor and Rheb in human breast
cancer and examine the relationship between their expression and
clinicopathological parameters. Furthermore, the correlation
between mTORC1 and human telomerase reverse transcriptase (hTERT;
the catalytic subunit of telomerase) was investigated.
Materials and methods
Samples
Tissue samples were collected after informed consent
with ethical approval as per contemporaneous institutional
guidelines. Immediately after surgical excision, a tumour sample
was taken from the tumour area, while another was taken from the
associated non-cancerous tissue (ANCT) within 2 cm of the tumour,
without affecting the assessment of tumour margins. Breast cancer
tissues (n=150) and normal background tissues (n=31) were collected
and stored at −80°C in liquid nitrogen until the commencement of
this study.
All the patients were treated according to local
guidelines, following discussions in multidisciplinary meetings.
Patients undergoing breast-conserving surgery also underwent
radiotherapy. Hormone-sensitive patients received tamoxifen.
Hormone-insensitive cases, high-grade cancer, and node-positive
cases were treated with adjuvant therapy. Clinicopathological data
(Table I) were collected from the
patient charts and collated in an encrypted database.
 | Table IClinical data describing the patient
cohort. |
Table I
Clinical data describing the patient
cohort.
| Parameter | No. of patients |
|---|
| Node status |
| Node positive | 65 |
| Node negative | 55 |
| Tumour grade |
| 1 | 23 |
| 2 | 41 |
| 3 | 56 |
| Tumour type |
| Ductal | 88 |
| Lobular | 14 |
| Medullary | 2 |
| Tubular | 2 |
| Mucinous | 4 |
| Other | 4 |
| TNM staging |
| 1 | 69 |
| 2 | 40 |
| 3 | 7 |
| 4 | 4 |
| Clinical outcome |
| Disease-free | 81 |
| With local
recurrence | 5 |
| Alive with
metastasis | 7 |
| Succumbed to breast
cancer | 20 |
RNA extraction kits and reverse transcription kits
were obtained from AbGene, Ltd. (Surrey, UK). PCR primers were
designed using Beacon Designer (Premier Biosoft International,
Ltd., Palo Alto, CA, USA) and synthesized by Invitrogen, Ltd.
(Paisley, UK). Custom made Hot Start Master Mix for quantitative
PCR was from AbGene (8).
Tissue processing, RNA extraction and
cDNA synthesis
Approximately 10 mg of cancerous tissue was
homogenised. A larger amount of ANCT (20–50 mg) was used as its
high fat content made it difficult to obtain sufficient RNA for
analysis. The concentration of RNA was determined using a UV
spectrophotometer (Wolf Laboratories, York, UK) to ensure adequate
amounts of RNA for analysis. Reverse transcription was carried out
using a reverse transcription kit (AbGene) with an anchored
oligo(dT) primer using 1 mg of total RNA in a 96-well plate to
produce cDNA. The quality of cDNA was verified using β-actin
primers (5′-ATGATATCGCCGCGCTCGTC-3′ and 5′-CGCTCGGTGAGGATCTTCA-3′)
(8).
Quantitative analysis
Transcripts of the cDNA library were determined
using real-time quantitative polymerase chain reaction (qPCR) based
on Amplifluor technology. The PCR primers were designed using
Beacon Designer software, but an additional sequence, known as the
Z sequence (5′-ACTGAACCTGACCGTACA-3′), which is complementary to
the universal Z probe (Intergen, Inc., Oxford, UK) was added to the
primer. The primers used are detailed in Table II.
| Table IIPrimers used in the RT-PCR
analysis. |
Table II
Primers used in the RT-PCR
analysis.
| Gene | Primer sequence |
|---|
| mTORF1 |
CTGCAGAAGAAGGTCACT |
| mTORZr1 |
ACTGAACCTGACCGTACAAAGGAGATGGAACGGAAG |
| RHEBF1 |
TTGGTTGGGAATAAGAAAGA |
| RHEBZr1 |
ACTGAACCTGACCGTACAAAAAGCTGCATTCCAAGAT |
| RaptorF1 |
TGAACACCGGACCATGAC |
| RaptorZr1 |
ACTGAACCTGACCGTACACAATGAGGTTTCCCTGAAG |
| RictorF1 |
AACTTGCAAAACAGTGTGAA |
| RictorZr1 |
ACTGAACCTGACCGTACAATATCACAGCCTTGTTTGGT |
| β-actin forward |
ATGATATCGCCGCGCTCGTC |
| β-actin reverse |
CGCTCGGTGAGGATCTTCA |
The reaction was carried out under the following
conditions: 94°C for 12 min and 50 cycles of 94°C for 15 sec, 55°C
for 40 sec and 72ºC for 20 sec. The levels of each transcript were
generated from a standard plasmid which contained the specific DNA
sequence that was simultaneously amplified within the samples. With
every run of the PCR, a negative and positive control was employed,
using a known cDNA sequence (8).
Statistical analysis
Analysis of the data was performed using the Minitab
12 statistical software package (Minitab, Ltd., Coventry, UK) using
a custom-written macro (Stat06e.mtb). Medians were compared using
the Mann-Whitney U-test, while the means were compared using the
two-sample t-test. The transcript levels within the breast cancer
specimens were compared to those of the ANCT and correlated with
clinicopathological data collected over a 10-year follow-up
period.
P-values <0.05 were considered significant,
whereas P-values between 0.05 and 0.10 were considered marginally
significant. Correlations between the expression levels of the
molecules were studied using the Pearson product moment correlation
test.
For purposes of the Kaplan-Meier survival analysis,
the samples were divided arbitrarily into high and low
transcription groups, with the value for the moderate prognostic
group as defined by Nottingham prognostic index (NPI) serving as
the dividing line. Survival analyses were performed using PSAW18
(SPSS, Inc., Chicago, IL, USA).
Results
Significantly higher mTORC1 mRNA transcript levels
were found in the breast cancer specimens compared to the normal
glandular tissue (P=0.0018). The expression of mTORC1 mRNA was
demonstrated to increase with increasing NPI (from 53 for NPI1 to
219 for NPI3) and tumour grade, and this difference reached
statistical significance when comparing grade 2 with grade 3 (37
vs. 159, P=0.047). mTORC1 expression was found to be higher in
ductal tumours compared with non-ductal tumours (P=0.0014). The
patients who developed recurrent disease or died from breast cancer
had higher expression levels of mTORC1 than those who had been
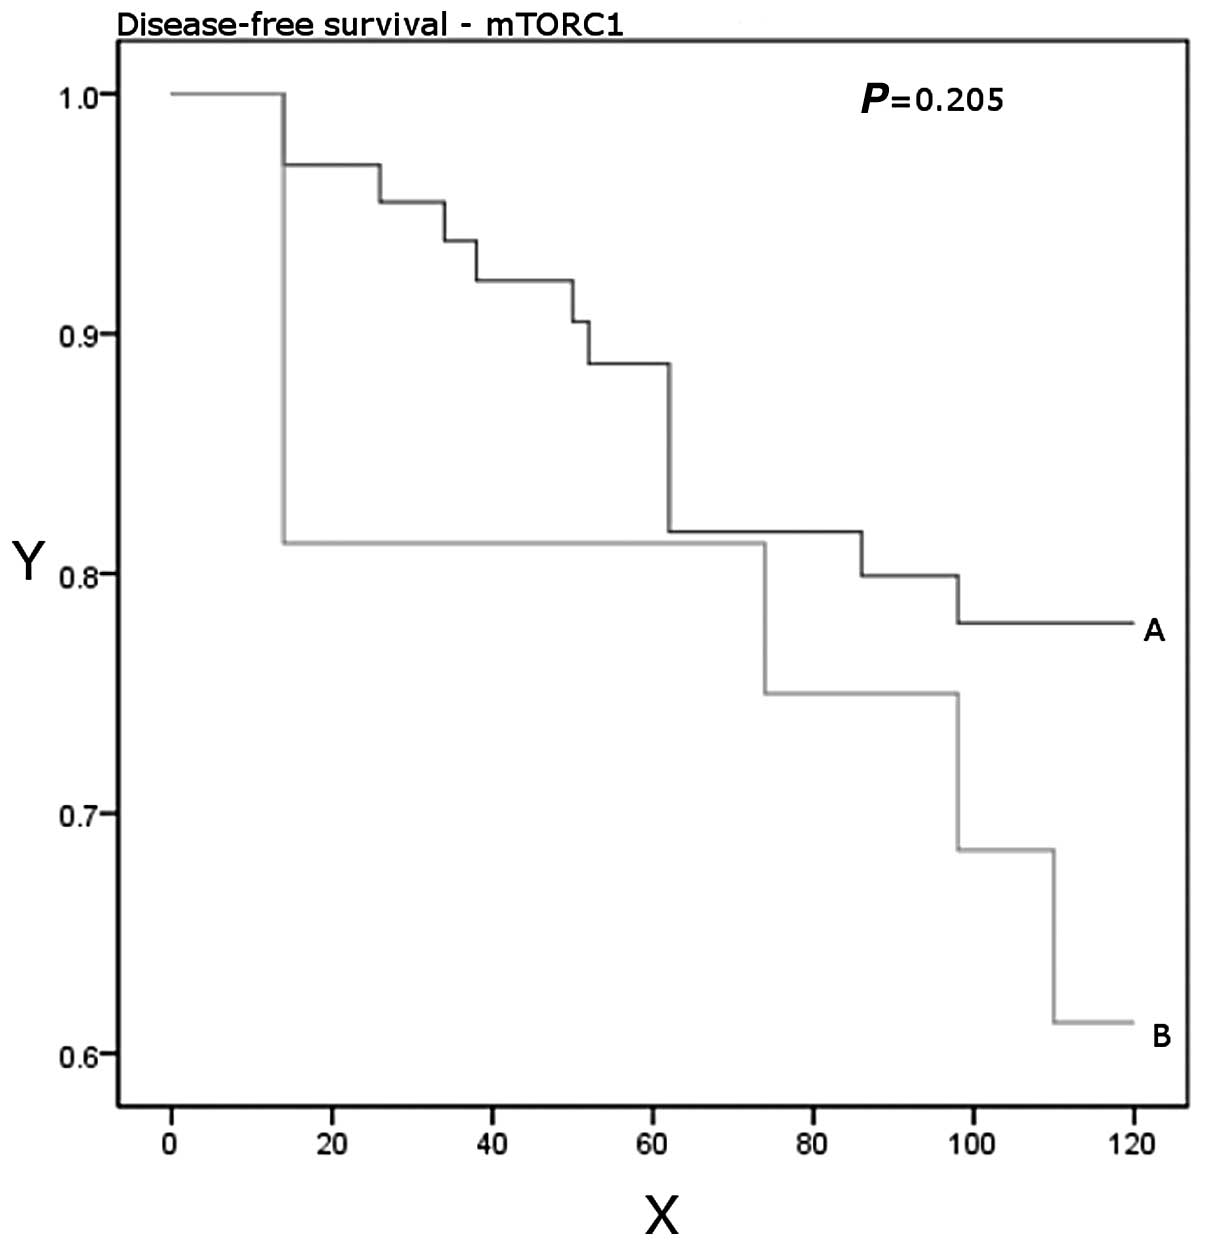
disease-free after a median follow-up period of 10 years (P=0.17).
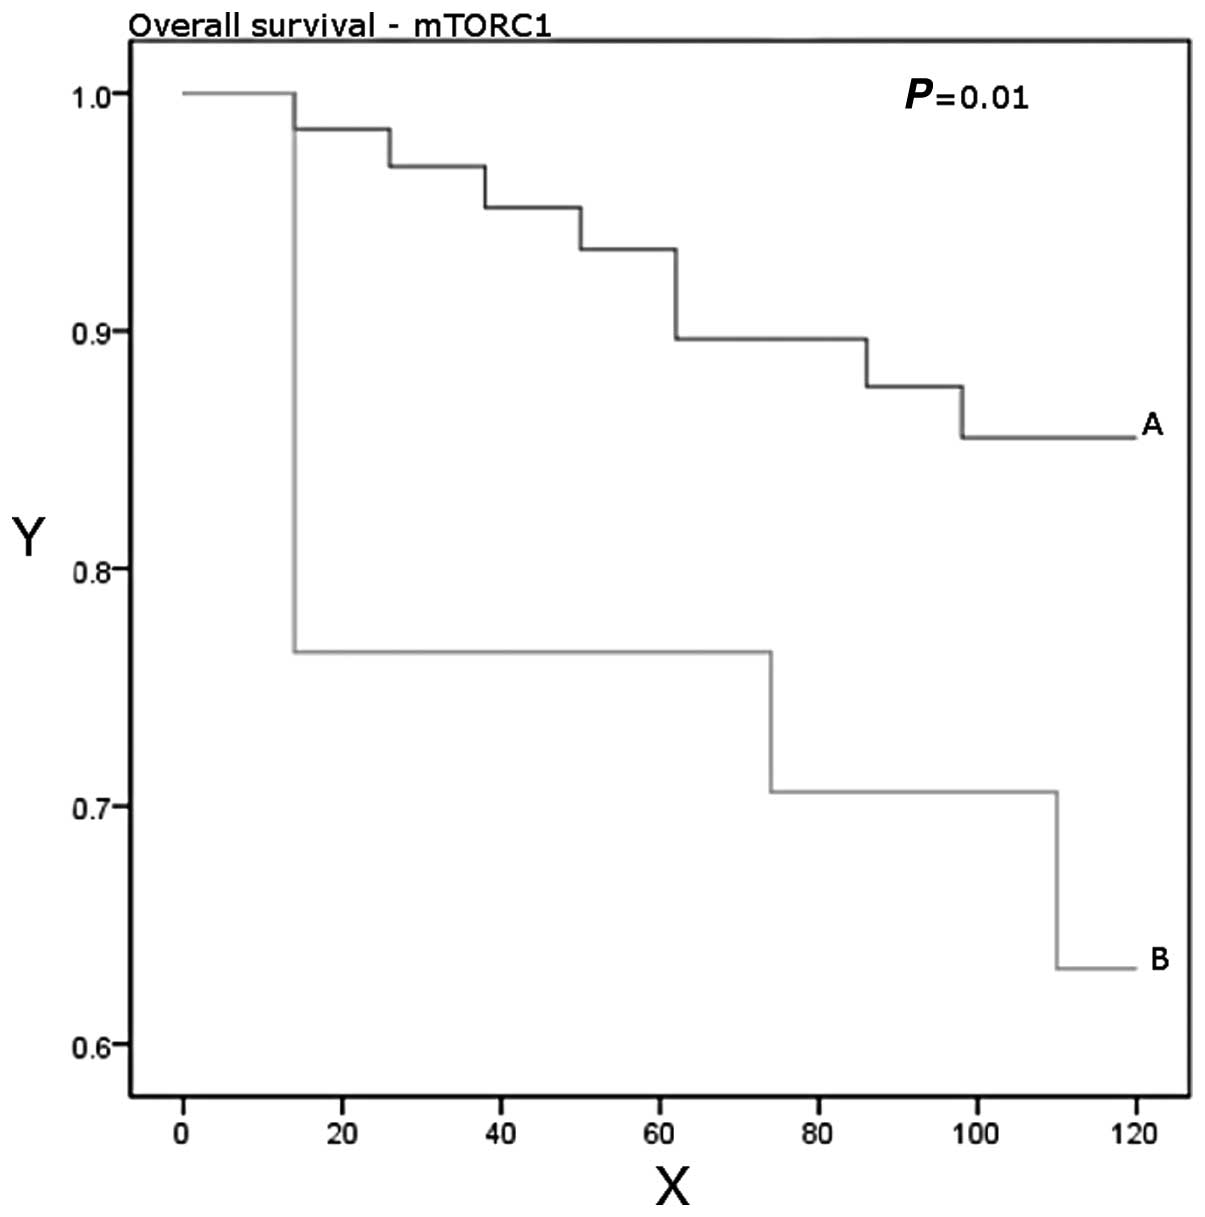
Higher expression levels were significantly associated with worse
overall survival (P=0.01; Table
III, Figs. 1 and 2).
| Table IIIComparison of mTOR mRNA expression
levels in subgroups within the cohort. |
Table III
Comparison of mTOR mRNA expression
levels in subgroups within the cohort.
| Patient and tumour
characteristics | mTOR, mean (SD) | P-value |
|---|
| Tumour grade |
| 1 vs. 2 | 59 (123) vs. 36.9
(98.9) | 0.50 |
| 1 vs. 3 | 59 (123) vs. 139
(349) | 0.16 |
| 2 vs. 3 | 36.9 (98.9) vs. 139
(349) | 0.047 |
| NPI |
| 1 vs. 2 | 53 (127) vs. 102
(306) | 0.36 |
| 1 vs. 3 | 53 (127) vs. 219
(437) | 0.17 |
| 2 vs. 3 | 102 (306) vs. 219
(437) | 0.36 |
| TNM |
| 1 vs. 2 | 61 (134) vs. 130
(383) | 0.31 |
| 1 vs. 3 | 61 (134) vs. 93
(218) | 0.74 |
| 1 vs. 4 | 61 (134) vs. 36.3
(55.7) | 0.48 |
| 2 vs. 3 | 130 (383) vs. 93
(218) | 0.75 |
| 2 vs. 4 | 130 (383) vs. 36.3
(55.7) | 0.19 |
| 3 vs. 4 | 93 (218) vs. 36.3
(55.7) | 0.57 |
| Survival |
| DF vs. LR | 63 (153) vs. 45.5
(82.7) | 0.63 |
| DF vs. DR | 63 (153) vs. 20.5
(31.7) | 0.068 |
| DF vs. D | 63 (153) vs. 324
(585) | 0.12 |
| DF vs.
LR/DR/D | 63 (153) vs. 191
(449) | 0.17 |
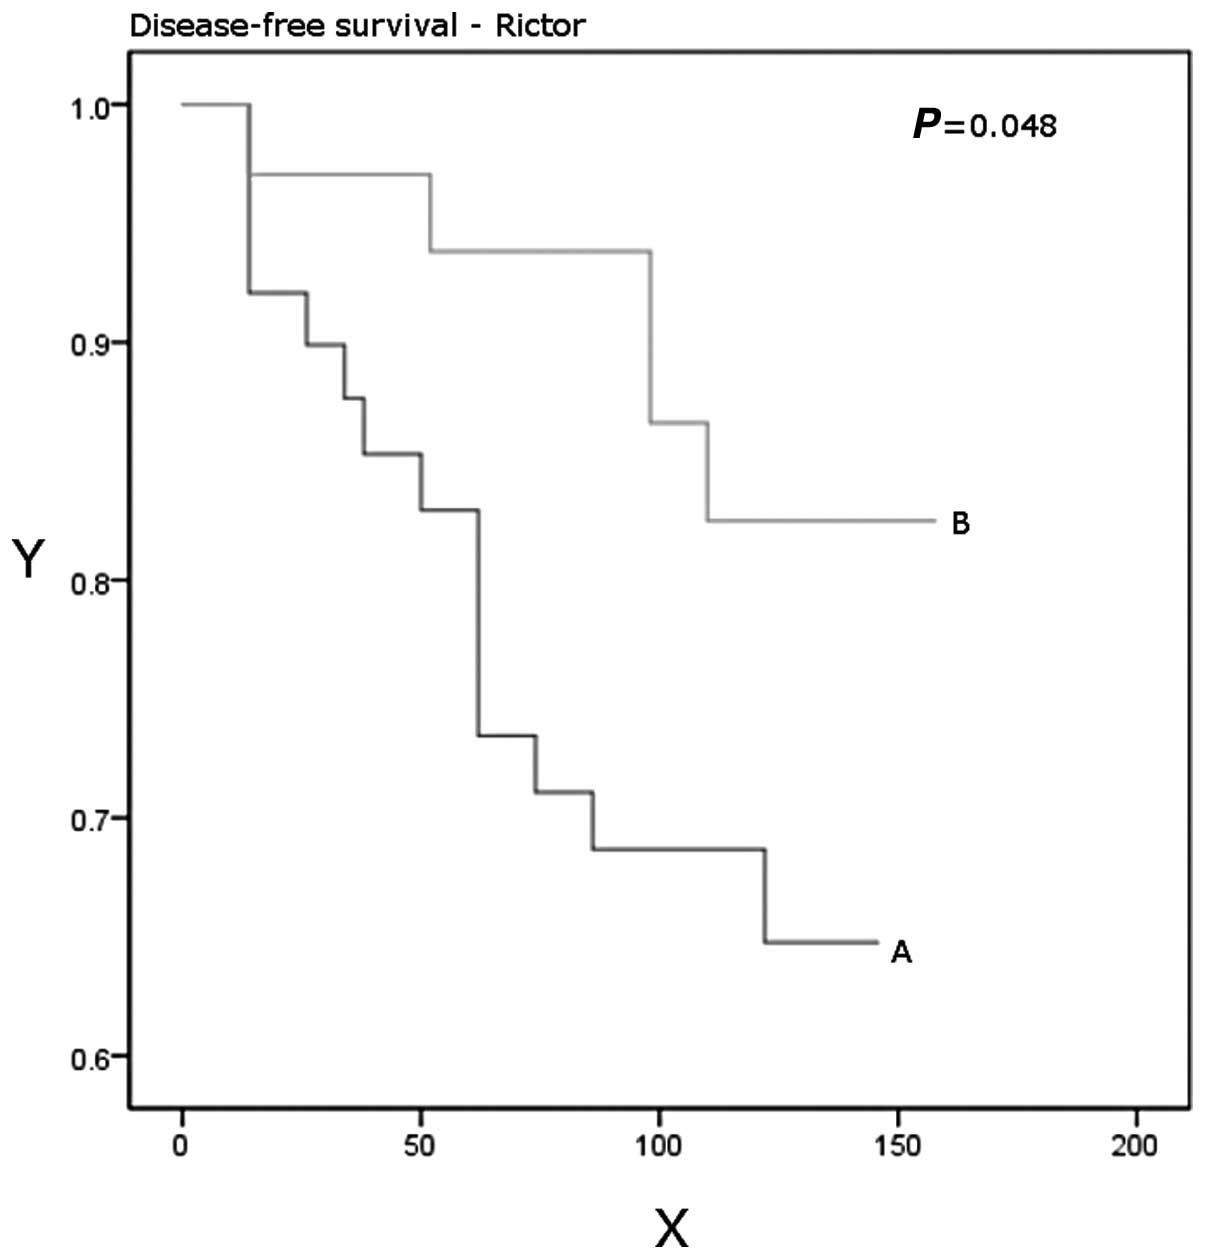
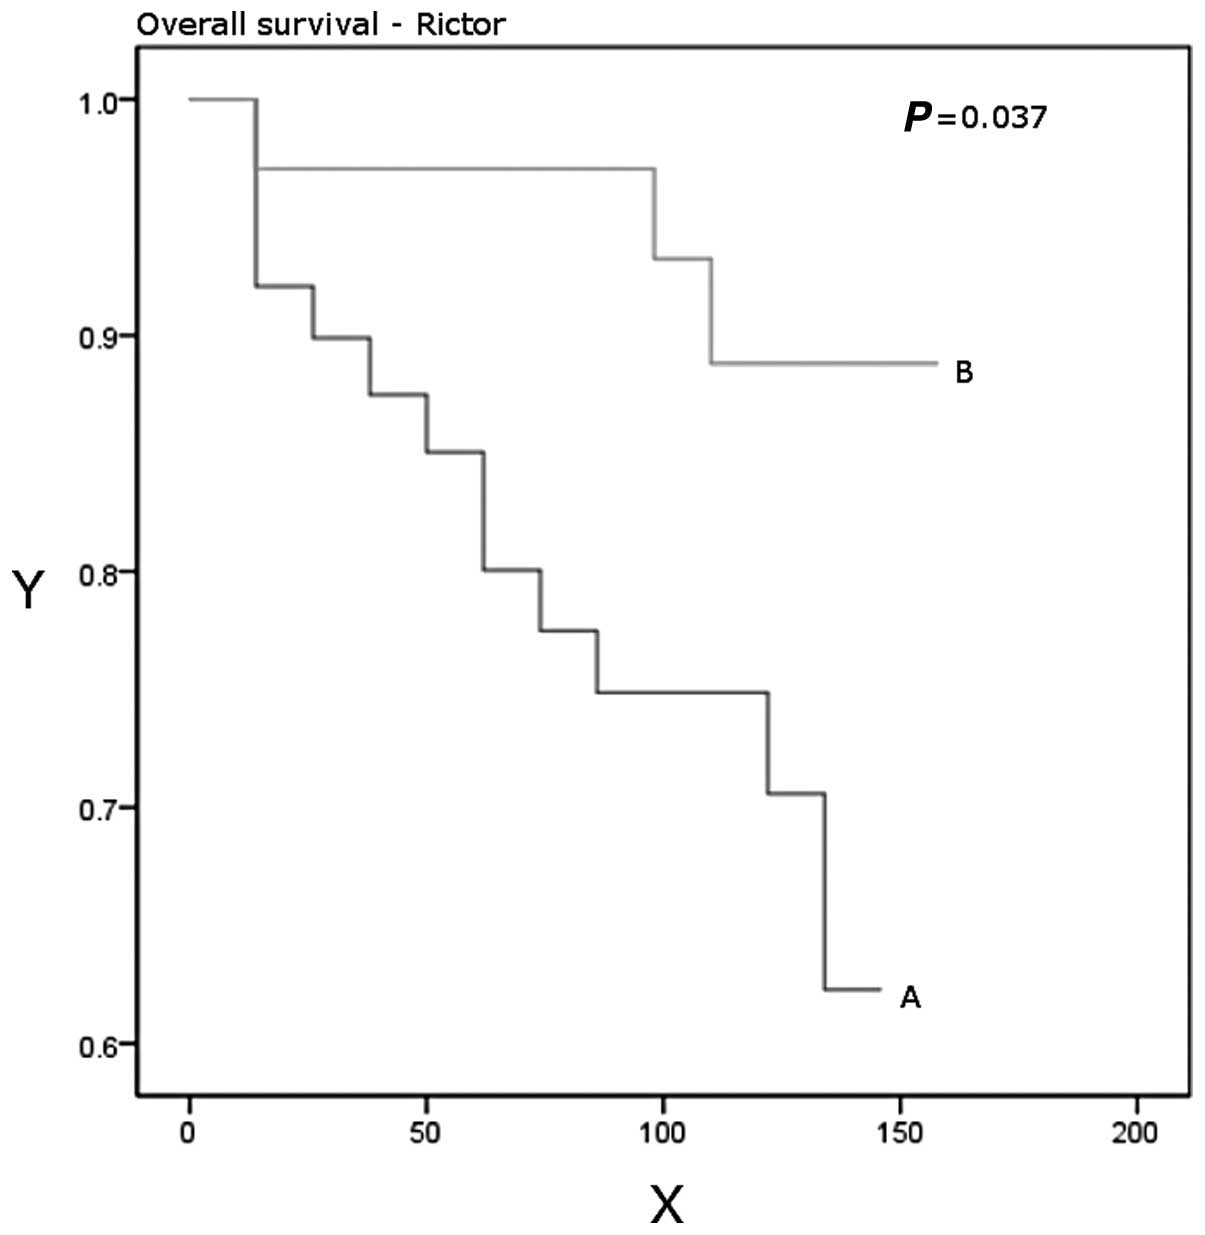
The mTORC2 core protein Rictor mRNA expression
showed an opposing trend to mTORC1 with higher levels being found
in normal breast tissue, lower NPI stage (NPI1 vs. 2, P=0.03) and
lower tumour grade (grade 1 vs. 3, P=0.01 and grade 2 vs. 3,
P=0.03). Patients with higher Rictor expression had a significantly
better disease-free (P=0.048) and overall (P=0.037) survival
(Table IV, Figs. 3 and 4).
| Table IVComparison of Rictor mRNA expression
levels in subgroups within the cohort. |
Table IV
Comparison of Rictor mRNA expression
levels in subgroups within the cohort.
| Patient and tumour
characteristics | 95% confidence
interval | P-value |
|---|
| Tumour grade |
| 1 vs. 2 | −3.1 to 11.5 | 0.54 |
| 1 vs. 3 | 0.3 to 46.1 | 0.01 |
| 2 vs. 3 | −0.2 to 4.7 | 0.039 |
| NPI |
| 1 vs. 2 | 0.1 to 8.8 | 0.03 |
| 1 vs. 3 | −0.6 to 9.0 | 0.16 |
| 2 vs. 3 | −2.5 to 1.1 | 0.73 |
| TNM |
| 1 vs. 2 | −0.7 to 3.7 | 0.622 |
| 1 vs. 3 | −8.5 to 24.2 | 0.93 |
| 1 vs. 4 | −105.9 to
120.4 | 0.74 |
| 2 vs. 3 | −9.0 to 2.1 | 0.72 |
| 2 vs. 4 | −248.9 to 2.6 | 0.32 |
| 3 vs. 4 | −249.4 to 65.1 | 0.85 |
| Survival |
| DF vs. LR | −3.3 to 6.4 | 0.56 |
| DF vs. DR | −98.9 to 13.3 | 0.68 |
| DF vs. D | −2.0 to 1.8 | 0.69 |
The mTORC1 core protein Raptor mRNA expression was
higher in the breast cancer specimens, and was found to be directly
associated with tumour grade (grade 1 vs. 3, P=0.027).
Paradoxically, it was found to be inversely correlated with TNM
staging (TNM1 vs. 4, P=0.0343; Table
V). Rheb mRNA expression was directly associated with tumour
grade (grade 1 vs. 3, P=0.0078; Table
VI). The mTORC1 mRNA showed a highly significant positive
correlation with that of hTERT (r=0.585, P<0.00001; Table VII).
| Table VComparison of Raptor mRNA expression
levels in subgroups within the cohort. |
Table V
Comparison of Raptor mRNA expression
levels in subgroups within the cohort.
| Patient and tumour
characteristics | 95% confidence
interval | P-value |
|---|
| Tumour grade |
| 1 vs. 2 | −1,144.2 to
0.0 | 0.03 |
| 1 vs. 3 | −946.7 to 0.0 | 0.027 |
| 2 vs. 3 | −27.8 to 63.0 | 0.8 |
| NPI |
| 1 vs. 2 | −0.6 to 118.3 | 0.42 |
| 1 vs. 3 | −26.1 to 457.0 | 0.33 |
| 2 vs. 3 | −29.4 to 42.4 | 0.87 |
| TNM |
| 1 vs. 2 | −225.6 to 1.5 | 0.46 |
| 1 vs. 3 | −0.3 to
1,152.8 | 0.21 |
| 1 vs. 4 | 0.0 to
12,201.9 | 0.034 |
| 2 vs. 3 | −0.4 to
4,412.4 | 0.1076 |
| 2 vs. 4 | 0.2 to
19,574.1 | 0.028 |
| 3 vs. 4 | −0.01 to
122.43 | 0.139 |
| Survival |
| DF vs. LR | −0.0 to
4,873.3 | 0.1317 |
| DF vs. DR | −1973.0 to
12,654.3 | 0.5169 |
| DF vs. D | −3.5 to 865.7 | 0.3875 |
| Table VIComparison of Rheb mRNA expression
levels in subgroups within the cohort. |
Table VI
Comparison of Rheb mRNA expression
levels in subgroups within the cohort.
| Patient and tumour
characteristics | 95% confidence
interval | P-value |
|---|
| Tumour grade |
| 1 vs. 2 | −1044.6 to 0.0 | 0.0127 |
| 1 vs. 3 | −0.26 to −0.01 | 0.0078 |
| 2 vs. 3 | 0.1 to 12.2 | 0.1768 |
| Table VIIPearson moment-product
correlations. |
Table VII
Pearson moment-product
correlations.
| Rictor | Raptor | hTERT | Rheb |
|---|
| mTOR |
| Correlation
coefficient | 0.221 | −0.0249 | 0.585 | −0.0294 |
| P-value | 0.0189 | 0.812 | 4.417E-011 | 0.778 |
| Rictor |
| Correlation
coefficient | | −0.0515 | 0.181 | −0.0639 |
| P-value | | 0.620 | 0.0614 | 0.538 |
| Raptor |
| Correlation
coefficient | | | 0.0172 | −0.0241 |
| P-value | | | 0.873 | 0.828 |
| hTERT |
| Correlation
coefficient | | | | −0.0482 |
| P-value | | | | 0.654 |
Discussion
Rapamycin is macrolide produced by Streptomyces
hygroscopius. It was initially identified in soil samples taken
from the Easter Islands, also known as Rapa Nui (9). It was remarkable for its effect on
metabolism and cell growth. During the early 1990s, the studies of
the effects of rapamycin on yeasts led to the discovery of the
targets of rapamycin (TOR1 and 2). The mammalian targets of
rapamycin (mTOR) was described shortly thereafter (10).
Initially, it was found that mTOR formed a
multi-protein complex, later termed mTOR complex 1 (mTORC1). Other
components of mTORC1 are mammalian lethal with sec-13 protein 8
(mLST8, also known as GβL), regulatory-associated protein of
mammalian target of rapamycin (Raptor) (11), DEP domain containing
mTOR-interacting protein (DEPTOR), the Tti1/Tel2 complex, and
proline-rich Akt substrate 40 kDa (PRAS40) (10). The activity of mTORC1 is inhibited
by rapamycin and other rapamycin analogues (rapalogues). Rapamycin
forms a complex with FKBP12, which interacts with mTOR subunit of
mTORC1 (12).
mTORC1 has been shown to be affected by various
stimuli, including but not limited to hypoxia, nutritional state,
stress, growth factors and amino acids. The majority of these
stimuli are mediated by a number of effectors, such as protein
kinase B (PKB, also known as Akt), extracellular-signal-regulated
kinase 1/2 (ERK1/2) and ribosomal S6 kinase (RSK1) (10). Typically, these enzymes
phosphorylate the tuberous sclerosis complex 1 and 2 (TSC1/2, also
known as hamartin and tuberin, respectively) (13). This inactivates TSC1/2, which when
active suppresses the activity of Ras homolog enriched in brain
(Rheb). In such conditions, Rheb activates mTORC1 (14). The canonical Wnt pathway interacts
with Rheb, as does the insulin/PI3K/Akt pathway (15,16).
Alternatively, several upstream components may interact directly
with Rheb. This is true with regards to mitogen-activated protein
kinase (MAPK), which mediates stimuli from p38 (17). PKB/Akt also to a certain extent,
acts directly upon Rheb. In turn, mTORC1 regulates lipid
metabolism, glycolysis, protein synthesis, cell proliferation and
autophagy (10,18).
In addition, upstream and downstream components of
the mTOR pathway have been implicated in carcinogenesis. This has
marked mTOR as a potential therapeutic target in cancer treatment
(19). Rapalogues have been
clinically proven in the treatment of renal cell carcinoma. Their
limited side-effect profile makes their particularly attractive
(4,5). However, rapalogues have had limited
success as single agents in the case of other types of cancers.
Considerable efforts have been made to identify potential markers
of rapamycin sensitivity (7,20).
A less well described complex 2 (mTORC2) was also
later identified. Similar to mTORC1, it is composed of the mTOR,
mLST8, DEPTOR and Tti1/Tel2 complex (10). In addition it also contains
rapamycin-insensitive companion of mTOR (Rictor) (21), mammalian stress-activated map
kinase-interacting protein 1 (mSin1), and protein observed with
Rictor 1 and 2 (protor1/2) (3).
mTORC2 is not sensitive to rapamycin. Our understanding of the role
of mTORC2 in the wider pathway is still evolving. It has been found
to have a role in the regulation of cell survival and the
cytoskeleton through the stimulation of various kinases, including
Akt/PKB. Through Akt/PKB, it is also thought to inhibit mTORC1
(22).
hTERT is one of the three components of the
telomerase complex, the others being the RNA template (hTR), and
the associated protein (TEP-1). This complex repairs the sequences
on the ends of chromosomes, which are termed telomeres. This
function prevents cell senescence, and could be related with cell
immortality (23). Increased hTERT
activity has been implicated in various neoplastic diseases,
including breast carcinoma (24).
In endometrial carcinoma, rapamycin has been demonstrated to reduce
hTERT mRNA expression (25). On the
other hand, in hepatocellular carcinoma, rapamycin has been found
to exert a post-transcriptional inhibitory effect on hTERT
activity. However, no effect was found on hTERT mRNA expression
(26). Evidence for a regulatory
role for mTOR on telomerase activity has been found in the case of
adult T cell leukaemia (27). hTERT
activity has been suggested as a surrogate for rapamycin
anti-neoplastic activity in endometrial carcinoma (25). Our finding of a highly significant
positive correlation between mTORC1 and hTERT lends further support
to the hypothesis that mTORC1 is an important regulator of hTERT
and telomerase.
Our study shows significant correlations between the
expression of mTORC1 and parameters of advanced disease in mammary
carcinogenesis, including tumour grade and NPI and an inverse
relationship to overall survival. This reiterates the potential for
a therapeutic role for mTORC1 inhibitors in human breast cancer.
The correlation of mTORC1 expression with ductal carcinoma suggests
that such therapeutic agents may be more effective in treating
patients with invasive ductal carcinoma. Our findings also suggest
that mTORC1 may exert its carcinogenic effect through the
upregulation of hTERT.
Whilst Raptor’s association with worsening tumour
grade is consistent with its role in mTORC1, its paradoxical
relationship with TNM stage would require further study along with
other components of mTORC1.
This is the first study to show an inverse
relationship between the Rictor subunit of mTORC2, NPI and tumour
grade, as well as demonstrate a significant direct correlation of
Rictor expression with disease-free and overall survival. This is
suggestive of a more extensive countervailing role of mTORC2 versus
mTORC1 than previously postulated.
Acknowledgements
This study was funded by grants from the Breast
Cancer Hope Foundation (London, UK).
References
|
1
|
Shiota C, Woo JT, Lindner J, Shelton KD
and Magnuson MA: Multiallelic disruption of the rictor gene in mice
reveals that mTOR complex 2 is essential for fetal growth and
viability. Dev Cell. 11:583–589. 2006. View Article : Google Scholar : PubMed/NCBI
|
|
2
|
Wu WK, Lee CW, Cho CH, Chan FK, Yu J and
Sung JJ: RNA interference targeting raptor inhibits proliferation
of gastric cancer cells. Exp Cell Res. 317:1353–1358. 2011.
View Article : Google Scholar : PubMed/NCBI
|
|
3
|
Guertin DA and Sabatini DM: Defining the
role of mTOR in cancer. Cancer Cell. 12:9–22. 2007. View Article : Google Scholar
|
|
4
|
Hudes G, Carducci M, Tomczak P, et al:
Temsirolimus, interferon alfa, or both for advanced renal-cell
carcinoma. N Engl J Med. 356:2271–2281. 2007. View Article : Google Scholar
|
|
5
|
Houghton PJ: Everolimus. Clin Cancer Res.
16:1368–1372. 2010. View Article : Google Scholar : PubMed/NCBI
|
|
6
|
Shor B, Zhang WG, Toral-Barza L, et al: A
new pharmacologic action of CCI-779 involves FKBP12-independent
inhibition of mTOR kinase activity and profound repression of
global protein synthesis. Cancer Res. 68:2934–2943. 2008.
View Article : Google Scholar : PubMed/NCBI
|
|
7
|
Noh WC, Mondesire WH, Peng J, et al:
Determinants of rapamycin sensitivity in breast cancer cells. Clin
Cancer Res. 10:1013–1023. 2004. View Article : Google Scholar : PubMed/NCBI
|
|
8
|
Jiang WG, Watkins G, Lane J, et al:
Prognostic value of rho GTPases and rho guanine nucleotide
dissociation inhibitors in human breast cancers. Clin Cancer Res.
9:6432–6440. 2003.PubMed/NCBI
|
|
9
|
Vezina C, Kudelski A and Sehgal SN:
Rapamycin (AY-22,989), a new antifungal antibiotic. I Taxonomy of
the producing streptomycete and isolation of the active principle.
J Antibiot (Tokyo). 28:721–726. 1975. View Article : Google Scholar : PubMed/NCBI
|
|
10
|
Laplante M and Sabatini DM: mTOR signaling
in growth control and disease. Cell. 149:274–293. 2012. View Article : Google Scholar : PubMed/NCBI
|
|
11
|
Bjornsti MA and Houghton PJ: The TOR
pathway: a target for cancer therapy. Nat Rev Cancer. 4:335–348.
2004. View
Article : Google Scholar : PubMed/NCBI
|
|
12
|
Brown EJ, Albers MW, Shin TB, et al: A
mammalian protein targeted by G1-arresting rapamycin-receptor
complex. Nature. 369:756–758. 1994. View
Article : Google Scholar : PubMed/NCBI
|
|
13
|
Gao X, Zhang Y, Arrazola P, et al: Tsc
tumour suppressor proteins antagonize amino-acid-TOR signalling.
Nat Cell Biol. 4:699–704. 2002. View
Article : Google Scholar : PubMed/NCBI
|
|
14
|
Manning BD and Cantley LC: Rheb fills a
GAP between TSC and TOR. Trends Biochem Sci. 28:573–576. 2003.
View Article : Google Scholar : PubMed/NCBI
|
|
15
|
Yuen HF, Chan KK, Grills C, et al: Ran is
a potential therapeutic target for cancer cells with molecular
changes associated with activation of the PI3K/Akt/mTORC1 and
Ras/MEK/ERK pathways. Clin Cancer Res. 18:380–391. 2012. View Article : Google Scholar : PubMed/NCBI
|
|
16
|
Inoki K, Ouyang H, Zhu T, et al: TSC2
integrates Wnt and energy signals via a coordinated phosphorylation
by AMPK and GSK3 to regulate cell growth. Cell. 126:955–968. 2006.
View Article : Google Scholar : PubMed/NCBI
|
|
17
|
Zheng M, Wang YH, Wu XN, et al:
Inactivation of Rheb by PRAK-mediated phosphorylation is essential
for energy-depletion-induced suppression of mTORC1. Nat Cell Biol.
13:263–272. 2011. View
Article : Google Scholar : PubMed/NCBI
|
|
18
|
Toschi A, Lee E, Thompson S, et al:
Phospholipase D-mTOR requirement for the Warburg effect in human
cancer cells. Cancer Lett. 299:72–79. 2010. View Article : Google Scholar : PubMed/NCBI
|
|
19
|
Guertin DA and Sabatini DM: The
pharmacology of mTOR inhibition. Sci Signal. 2:pe242009.PubMed/NCBI
|
|
20
|
Shoji K, Oda K, Kashiyama T, et al:
Genotype-dependent efficacy of a dual PI3K/mTOR inhibitor,
NVP-BEZ235, and an mTOR inhibitor, RAD001, in endometrial
carcinomas. PLoS One. 7:e374312012. View Article : Google Scholar : PubMed/NCBI
|
|
21
|
Sarbassov DD, Ali SM, Kim DH, et al:
Rictor, a novel binding partner of mTOR, defines a
rapamycin-insensitive and raptor-independent pathway that regulates
the cytoskeleton. Curr Biol. 14:1296–1302. 2004. View Article : Google Scholar : PubMed/NCBI
|
|
22
|
McDonald PC, Oloumi A, Mills J, et al:
Rictor and integrin-linked kinase interact and regulate Akt
phosphorylation and cancer cell survival. Cancer Res. 68:1618–1624.
2008. View Article : Google Scholar : PubMed/NCBI
|
|
23
|
Mokbel K: The role of telomerase in breast
cancer. Eur J Surg Oncol. 26:509–514. 2000. View Article : Google Scholar
|
|
24
|
Elkak A, Mokbel R, Wilson C, Jiang WG,
Newbold RF and Mokbel K: hTERT mRNA expression is associated with a
poor clinical outcome in human breast cancer. Anticancer Res.
26:4901–4904. 2006.PubMed/NCBI
|
|
25
|
Zhou C, Gehrig PA, Whang YE and Boggess
JF: Rapamycin inhibits telomerase activity by decreasing the hTERT
mRNA level in endometrial cancer cells. Mol Cancer Ther. 2:789–795.
2003.PubMed/NCBI
|
|
26
|
Bu X, Jia F, Wang W, Guo X, Wu M and Wei
L: Coupled down-regulation of mTOR and telomerase activity during
fluorouracil-induced apoptosis of hepatocarcinoma cells. BMC
Cancer. 7:2082007. View Article : Google Scholar : PubMed/NCBI
|
|
27
|
Yamada O, Ozaki K, Akiyama M and Kawauchi
K: JAK-STAT and JAK-PI3K-mTORC1 pathways regulate telomerase
transcriptionally and posttranslationally in ATL cells. Mol Cancer
Ther. 11:1112–1121. 2012. View Article : Google Scholar : PubMed/NCBI
|