Introduction
Prostate cancer (PCa) is characterised as a
non-coordinated proliferation of prostatic cells (1). However, the mechanisms behind tumour
progression have not yet been elucidated, although the risk factors
of cancer initiation have been defined (2). These include primary genetic
predispositions, ethnicity, life style and age (3). Old age has been established as a
significant risk factor for PCa (4,5). In
addition to these factors, a family history of breast or PCa
distinctly enhances PCa risk (6).
In terms of ethnicity, a distinct gradient between Afro-Americans
and Asians is evident (lower incidence in Asian populations)
(7). Apart from these factors,
androgens also play an important role in cancer development and
progression. Therefore, PCa can be classified into either
androgen-independent or androgen-dependent (8,9).
Currently, there is no complex test available for
the diagnosis of PCa (10). Usually
used tests include digital rectal examination, determination of
prostate-specific antigen (PSA) levels (11) and transrectal sonography with a
biopsy of prostate tissue. In specific cases, computed tomography
(12), magnetic resonance (13) and positron emission tomography may
be utilised (14). In this context,
potential markers of PCa, which may be considered as a useful tool
for earlier diagnosis without clinical examinations, are
investigated. Currently, PSA, first described in 1977 (15), is the most perspective marker of
PCa. However, it is used for diagnosis, for determining the stage
of disease and for monitoring the treatment progression; however,
its sensitivity (49–91%) and specificity (68–80%) are not
sufficient to confirm diagnosis (16). Novel potential markers, including
alpha-methylacyl-CoA racemase (AMACR) (17), prostate cancer antigen 3 (PCA3) and
Annexin A3 (18) have been
identified. The most discussed marker of early-stage PCa is the
amino acid, sarcosine as described by Sreekumar et
al(19) (Fig. 1). In spite of the controversy in the
scientific community and contradicting views on this marker, the
role of sarcosine in methylation processes during cancer
progression has been shown (19). A
recent study demonstrated the effect of sarcosine on the increasing
human epidermal growth factor receptor 2 (HER2/neu) expression
levels (20). Therefore, it is
important to investigate the function and involvement of sarcosine
in PCa initiation and progression. The aim of this study was to
investigate the effect of sarcosine on PC-3 PCa cells. PC-3 cells
were treated with sarcosine at various concentrations (10; 250;
500; 1,000 and 1,500 μM). In addition, the antioxidant capacity of
the PC-3 cells following treatment with sarcosine, as well as the
metallothionein (MT) concentration were examined.
Materials and methods
Chemical and biochemical reagents
Ham’s F12 medium, fetal bovine serum (FBS)
(mycoplasma-free), penicillin/streptomycin and trypsin were
purchased from PAA Laboratories GmbH (Pasching, Austria). PBS was
purchased from Invitrogen Corp. (Carlsbad, CA, USA).
Ethylenediaminetetraacetic acid (EDTA) and all other chemicals of
ACS purity were purchased from Sigma-Aldrich Co. (St. Louis, MO,
USA), unless stated otherwise.
Cell culture conditions
In this study, the highly metastatic PC-3 prostate
cancer cell line derived from bone metastasis was used. Cells were
cultivated in Ham’s F12 medium supplemented with 7% FBS and
antibiotics (penicillin and streptomycin). Cells were cultivated in
a MCO-18AIC incubator (Sanyo, Osaka, Japan) at 37°C under 5%
CO2.
Sarcosine treatment of cell cultures
Immediately after the cells grew to 50–60%
confluence, the cultivation medium was replaced by fresh medium to
synchronise cell growth. Cells were cultivated for 24 h under these
conditions. Subsequently, the culture medium was supplemented with
sarcosine (N-methylglycine) diluted to a final concentration 10,
150, 250, 500, 1,000 and 1,500 μM. Treatment was carried out for 0,
6, 12, 24 and 72 h, and samples were collected at these strictly
defined time points.
Cell content quantification
Total cell number was analysed using a
semi-automated image-based cell analyser (CASY, Roche Innovatis,
Basel, Switzerland) according to the manufacturer’s instructions.
The cultivation medium was removed and the samples were washed
twice with 5 ml of ice-cold PBS to maintain only viable cells.
Cells were scraped and transferred to clean tubes. Trypan blue
solution (Roche Innovatis) was diluted to 0.2% prior to use and
added to the samples. The following settings were used in the
operating software: cell type, standard cells; dilution, none;
process type, standard. All samples were measured in duplicate.
Light microscopy of treated cells
For light microscopy, cells were cultivated directly
on glass microscope slides (75×25 mm, thickness 1 mm, Fischer
Scientific, Pardubice, Czech Republic) in Petri dishes in the
abovementioned cultivation medium as described in ‘Cell culture
conditions’. Cells were transferred directly onto slides, which
were submerged in cultivation medium. Following treatment, the
glass microscope slides with a monolayer of cells were removed from
the Petri dishes, rinsed with cultivation medium without sarcosine
supplementation and PBS buffer and directly used for light
microscopy under an inverted microscope (Eclipse TS100; Nikon,
Tokyo, Japan). Images were taken using a digital camera (Olympus
Camedia C-750, Olympus).
MTT assay
To determine cell viability, MTT assay was carried
out. MTT is yellow water-soluble stain
(3-[4,5-dimethylthiazol-2-yl]-2,5-diphenyltetrazolium bromide) that
is reduced by living cells to a non-soluble violet formazan
precipitate. Cell suspension was pipetted to a microplate (TPP
Techno Plastic Products AG, Trasadingen, Switzerland) according to
the following scheme: 1st and 12th well with 200 μl medium and 2nd
to 11th well with 200 μl cell suspension. The assay was carried out
in duplicate. Furthermore, the cells were incubated for 24 h and
the media were exchanged. Subsequently, the columns were fed with
200 μl of medium with 50 μl MTT [5 mg/ml in PBS (Invitrogen)] and
incubated for 4 h, wrapped in aluminium foil. Subsequently,
medium-MTT was exchanged with 200 μl of 99.9% DMSO to dissolve the
MTT-formazan crystals. A total of 25 μl of glycine buffer was then
added to the wells with DMSO. Plates were read at λ 570 nm
(VersaMax Microplate Reader; Molecular Devices, Sunnyvale, CA,
USA).
Ion-exchange chromatography
An AAA 400 liquid chromatography apparatus (Ingos,
Prague, Czech Republic) was used for the determination of sarcosine
concentration. The system consisted of a glassy filling
chromatographic column and a steel precolumn, two chromatographic
pumps for the transport of elution buffers and derivatization
reagent, a cooled carousel for 25 test tubes of 1.5–2.0 ml volume,
a dosing valve, a heat reactor, a Vis detector and a cooled chamber
for the derivatization reagent. The glassy chromatographic column
(i.d. 3.7 mm and 350 mm length) was filled with LG ANB strong catex
in sodium cycle (Spolchemie, Ústí nad Labem, Czech Republic) with
particles of average size of 12 μm and a netting of 8%. The glassy
column was tempered by a thermostat at a temperature ranging from
35 to 95°C. The precolumn was filled with LG KS0804 ionex (Ingos).
Chromatographic columns for the transfer of elution buffers and
derivatization reagent function at a flow of 0.01–10 ml/min under a
maximum pressure of 40 MPa. The volume of the injected sample was
100 μl with an application accuracy RSD of ~1%. A two-channel Vis
detector with a 5 μl flow volume cuvette was operated at
wavelengths of 440 and 570 nm. Ninhydrin solution (Ingos) was used
as the derivatization reagent. Ninhydrin was dissolved in solution
containing 75% (v/v) of the organic solvent, methyl cellosolve
(Ingos), and 25% (v/v) of 4 M acetate buffer (pH 5.5).
SnCl2 (Lachema, Brno, Czech Republic) was used as a
reducing agent. The derivatization reagent was stored under an
inert atmosphere (N2) with cooling at 4°C. During the
analysis, the mobile phase flow was set at 0.3 ml/min under a
pressure range of 4.5 to 6.0 MPa. The reactor temperature was set
to 120°C.
Differential pulse voltammetry for
Brdicka reaction
Differential pulse voltammetric measurements were
performed with a 747 VA Stand instrument connected to 693 VA
Processor and 695 Autosampler (Metrohm, Herisau, Switzerland),
using a standard cell with three electrodes and a cooled sample
holder (4°C) for the measurement of cells (Julabo F25; Julabo,
Seelbach, Germany). A hanging mercury drop electrode (HMDE) with a
drop area of 0.4 mm2 was used as the working electrode.
An Ag/AgCl/3M KCl electrode was the reference and a platinum
electrode was the auxiliary electrode. For data processing, the VA
Database 2.2 (Metrohm) was employed. The analysed samples were
deoxygenated prior to the measurements by purging with argon
(99.999%) saturated with water for 120 sec. Brdicka supporting
electrolyte containing 1 mM
Co(NH3)6Cl3 and 1 M ammonia buffer
[NH3(aq) + NH4Cl, pH 9.6] was used.
The supporting electrolyte was exchanged after each analysis. The
parameters of the measurement were as follows: initial potential of
−0.7 V; end potential of −1.75 V; modulation time, 0.057 sec; time
interval, 0.2 sec; step potential, 2 mV; modulation amplitude, −250
mV; Eads 0 V; volume of injected sample, 25 μl;
measurement of cell volume, 2 ml (25 μl of sample and 1,975 μl
Brdicka solution).
Capillary electrophoresis-Experion
system
Analyses on an automated microfluidic Experion
electrophoresis system (Bio-Rad Laboratories, Hercules, CA, USA)
were carried out according to the manufacturer’s instructions with
the supplied chemicals (Experion Pro260 Analysis kit; Bio-Rad
Laboratories). A sample (4 μl) was mixed with 2 μl of reducing
sample buffer (3.3% mercaptoethanol), and after 3 min of boiling,
84 μl of water were added. After the priming of the chip with the
gel and gel-staining solution in the diluted priming station
sample, the mixture (6 μl) was loaded into the sample wells. The
Pro260 Ladder included in the kit was used as a standard. For
operation and standard data analysis, Experion software version
3.10 (Bio-Rad Laboratories) was used.
Spectrophotometric analysis
For the determination of antioxidant activity, a
BS-400 automated spectrophotometer (Mindray, Shenzhen, China) was
used. It is composed of cuvette space tempered to 37±1°C, reagent
space with a carousel for reagents (tempered to 4±1°C), sample
space with a carousel for the preparation of samples and an optical
detector. The transfer of samples and reagents was carried out by a
robotic arm equipped with a dosing needle (error of dosage up to 5%
of volume). Cuvette contents are mixed by an automatic mixer
including a stirrer immediately after the addition of reagents or
samples. Contamination is reduced due to its rinsing system,
including rinsing of the dosing needle as well as the stirrer by
Milli-Q water.
Determination of antioxidant activity by
the 2,2′-azino-bis(3-ethylbenzothiazoline-6-sulphonic acid (ABTS)
test
The ABST test was carried out as previously
described by Sochor et al(21,22).
Briefly, a 150-μl volume of reagent (7 mM ABTS• and 4.95
mM potassium peroxodisulfate) was incubated with 3 μl of sample.
Absorbance was measured at λ 660 nm for 12 min. For the calculation
of the antioxidant activity, values determined before the decrease
of the absorbance (2nd minute of measurement - A2) and
the last measurement value (12th minute of measurement -
A12) were used. The resulting value was calculated in
accordance with the following formula: differential absorbance A =
A12 - A2.
Determination of antioxidant activity by
the 2,2-diphenyl-1- picrylhydrazyl (DPPH) test
The DPPH test was carried out as described by Sochor
et al(21,22). Briefly, a 150-μl volume of reagent
(0.095 mM DPPH•) was incubated with 15 μl of sample.
Absorbance was measured at 505 nm for 10 min and the output ratio
was achieved by the difference of absorbance at the 10th and 2nd
minute of the assay procedure.
Determination of antioxidant activity by
the N,N-dimethyl-p-phenylenediamine (DMPD) method
The DMPD test was carried out as previously
described by Sochor et al(21,22).
Briefly, a 160 μl volume of reagent (200 mM DMPD, 0.05 M
FeCl3, 0.1 M acetate buffer pH 5.25) was injected into a
plastic cuvette with the subsequent addition of 4 μl of sample.
Absorbance was measured at 505 nm. The difference between
absorbance at the 10th and 2nd minute of the assay procedure was
used for the calculation of the antioxidant activity.
Determination of antioxidant activity by
the free radical method
The determination of antioxidant activity using the
free radical method was carried out as previously described by
Pohanka et al(23). Briefly,
a 150 μl volume of reagent was injected into a plastic cuvette with
the subsequent addition of a 6 μl of sample. Absorbance was
measured at 450 nm in the 2nd minute of the assay and the 10th
minute. The difference of the two absorbances was considered as an
output value.
Determination of antioxidant activity by
the ferric reducing ability of plasma (FRAP) method
The determination of antioxidant activity using the
FRAP method was carried out as previously described by Sochor
(21,22). Briefly, a 150 μl volume of reagent
was injected into a plastic cuvette with the subsequent addition of
3 μl of sample. Absorbance was measured at 605 nm for 10 min. The
difference between the absorbance at the final 10th minute and the
2nd minute of the assay procedure was used for the calculation of
the antioxidant activity.
Statistical analysis
Software Statistica 10 (StatSoft, Tulsa, OK, USA)
was used for statistical evaluation. T-tests were used to compare
levels across groups and correlations were performed to reveal
trends between variables. A P-value <0.05 was considered to
indicate a statistically significant difference, unless stated
otherwise.
Results and Discussion
Cell treatment and viability test
The PC-3 PCa cell line was derived from a metastatic
site in the bone and represents a highly aggressive metastatic form
of PCa. Compared to the widely used prostate cancer cell lines,
DU145 and LNCaP, PC-3 is androgen-independent and does not express
PSA (24,25). As mentioned in the Introduction,
sarcosine is considered a tumour marker for the diagnosis of PCa. A
schematic diagram of the role of sarcosine in the biochemistry of
PCa cells adopted from a previous study (26) is shown in (Fig. 1). Therefore, the first experiments
focused on the determination of cell viability and proliferation
following treatment with sarcosine. The commonly used
3-[4,5-dimethylthiazol-2-yl]-2,5-diphenyl tetrazolium bromide (MTT)
assay was employed for these tests. For MTT assay, the cells were
harvested and re-cultivated in a 96-well plate (5,000 cells/well).
After 24 h of growth synchronization, the cells were treated with
sarcosine at various concentrations ranging from 10 to 1,500 μM.
The cells were further cultivated under these conditions, and
samples were taken in the strictly defined time points (6, 12, 24,
48 and 72 h), when viability was evaluated. The results are shown
in Fig. 2. Compared to the
viability of the control cells (i.e., those not treated with
sarcosine), the viability of the sarcosine-treated cells was
significantly reduced. The determined IC50 value at all
the time points was ~325.5 μM. In all the applied concentrations,
cell viability was reduced by 30–40% after 10 h of treatment;
subsequently, a moderate increase in cell viability (65–80%)
compared to the initial viability values was recorded. As shown in
Fig. 2, the increasing sarcosine
concentration (10–1,500 μM) led to a reduction in cell viability
(significance level P<0.05) during the first 6–24 h of treatment
(34% on average). After 12 h, the decreasing trend in cell
proliferation slowly increased compared to the untreated control
cells, where the decrease was only moderate and was characteristic
of the growth curve of the PC-3 PCa cell line. These results
confirm the microscopic observations, where the toxic effect of
sarcosine at a high concentration (1,500 μM) was evident. At this
concentration, changes in cell morphology (loss of typical shape,
formation of round cells and loss of adherence) were determined. At
lower concentrations, sarcosine reduced cell viability, although
non-significant cellular morphological changes were observed (data
not shown).
Sarcosine determination
In the following experiment, both the culture medium
and sarcosine-treated cells were analysed for sarcosine content by
ion-exchange chromatography (27).
In the sarcosine-treated cells, sarcosine content was recalculated
to the percentage of viable cells. The sarcosine content in the
cells significantly increased until 24 h of treatment at all
concentrations (10–1,500 μM). However, after 24 h of treatment,
only a moderate sarcosine content increase was recorded. The
untreated cells showed a similar tendency compared to the treated
cells. These results indicate the possibility of sarcosine
biosynthesis by PC-3 cells (19).
The obtained results indicated a contrary tendency compared to the
sarcosine content in PC-3 cells, i.e., that the concentration of
sarcosine in the culture medium increased at all concentrations
(10–1,500 μM). This increase is characterised by the directional
slopes from each applied concentration (Fig. 3). The most significant increase in
sarcosine content was recorded at the highest applied sarcosine
concentrations (500–1,500 μM). As regards statistical significance,
a significant change in the sarcosine content was observed at the
concentrations between 0–1,000 μM vs. 1,500 μM (P=0.02). On the
other hand, the sarcosine content increased in the culture medium
in the case of the untreated control cells.
Determination of MT levels
MT is considered as a possible marker of PCa
(28–34). As certain studies have indicated,
its levels are elevated in the blood serum of patients suffering
from PCa, independent of their state of health (35,36).
Chip capillary electrophoresis (Experion) was used for the
determination of MT levels. The assumed molecular weight of MT
varies from 6 to 15 kDa (37);
however, this depends on the type of isoform and the rate of
oxidation (38,39). From the Experion records, it is
evident that PC-3 cells cultivated for 12 h synthesised MT with
molecular weights of 11, 15 and 19 kDa (see MT peaks, Fig. 4A). These results are also visible on
virtual output (Fig. 4B). The
height of these peaks increased depending on the applied sarcosine
concentration up to 1,000 μM. On the other hand, a distinct
increase in all three peaks was determined for the highest applied
concentration of sarcosine (1,500 μM); however, this increase was
below the level of statistical significance. This trend is shown in
Fig. 4C. Furthermore, PC-3 cells
affected by sarcosine were investigated electrochemically using the
Brdicka reaction, which is a highly sensitive method for the
determination of MT levels (40,41).
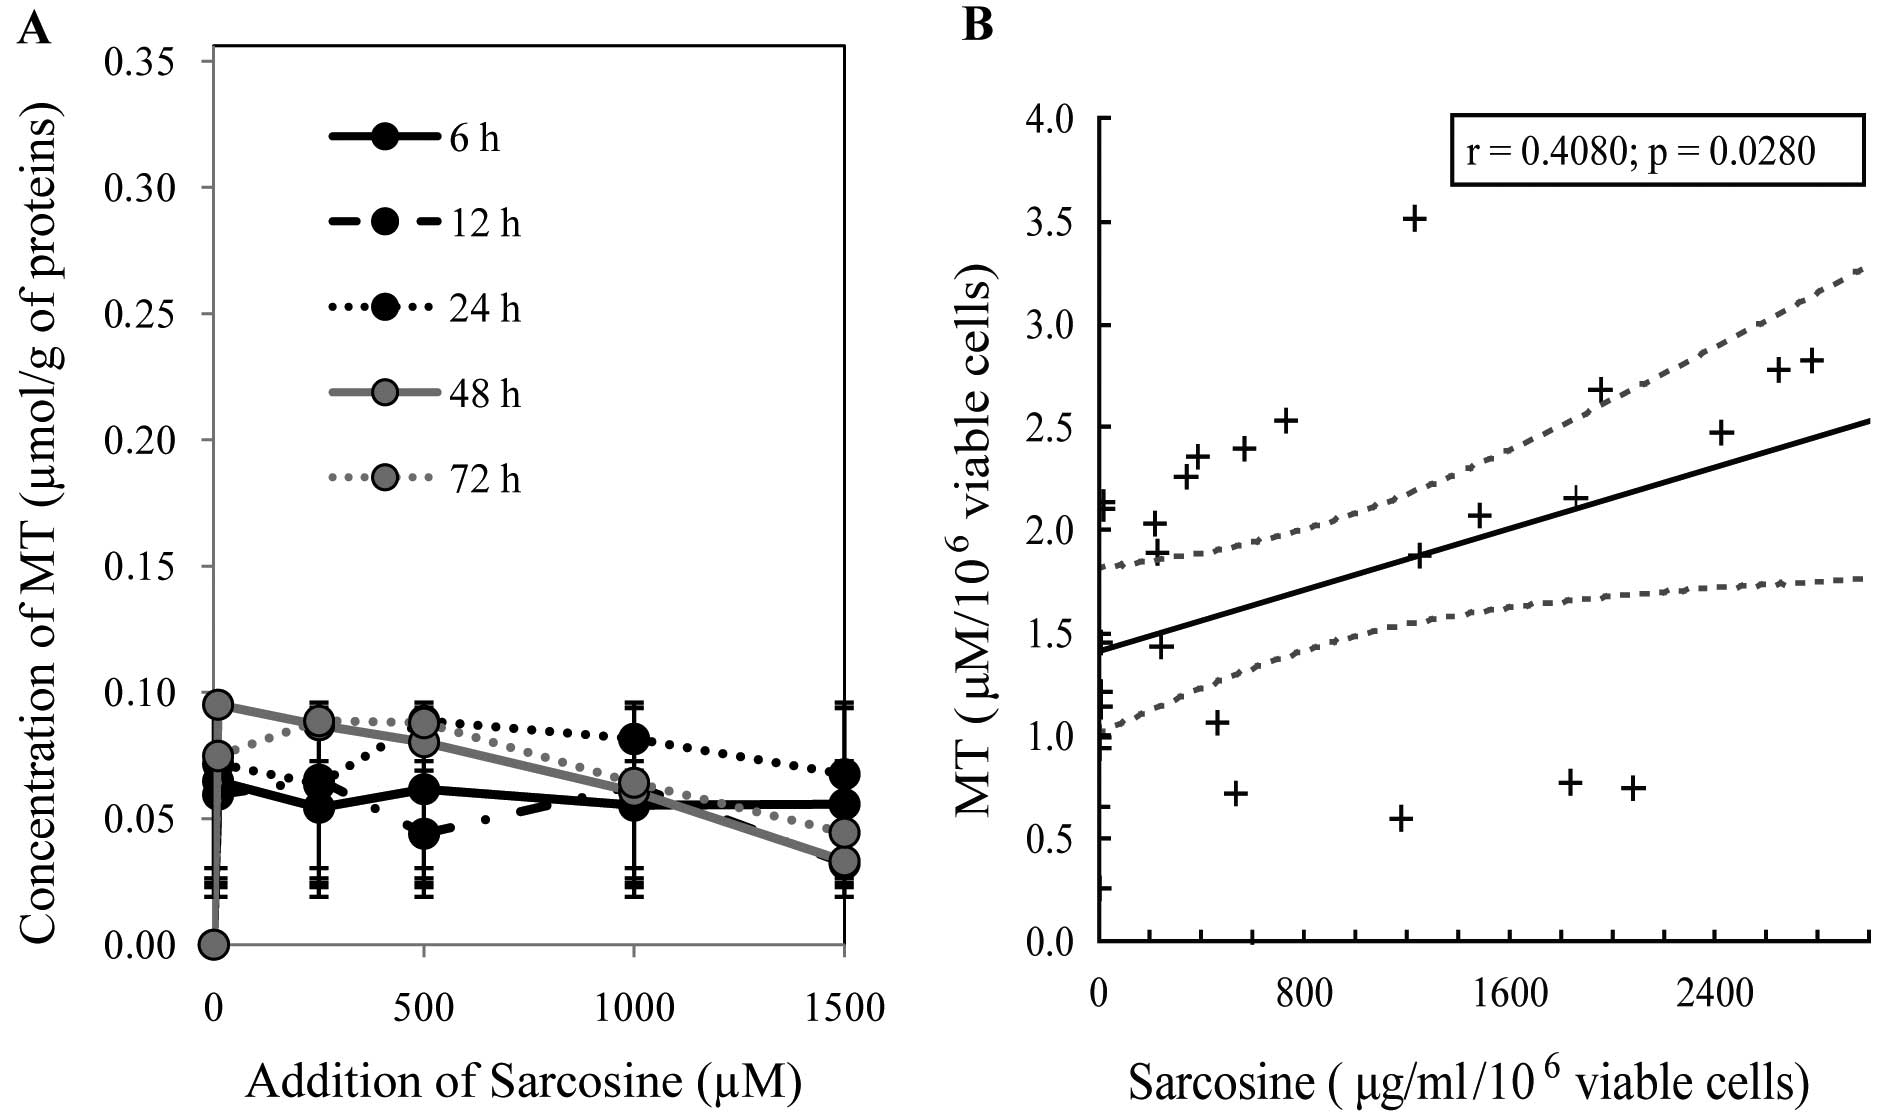
As shown in Fig. 5A, the MT level
was reduced with the highest applied sarcosine concentration (1,500
μM) in a time-dependent manner. This trend confirmed the results
obtained by the chip capillary electrophoresis method. As regards
the dependence of mentioned variables, we revealed a significant
positive correlation between sarcosine and MT (r=0.41 at P=0.03,
Fig. 5B). Moreover, no other
significant dependencies were identified across variables,
including markers of oxidative capacity.
Antioxidant capacity determination
A number of methods have been introduced for the
determination of antioxidant activity in the field of chemical and
biological analysis (23,42–44).
The methods differ according the molecular mechanisms of the
particular group of antioxidants (45–47).
These mechanisms usually involve the quenching/trapping of the
radicals; however, the strictly specific mechanisms of the majority
of these antioxidants remain unclear. Therefore, the approaches for
the determination of antioxidant capacity are based on various
techniques with different chemical principles. In our study, for
the determination of the antioxidant capacity of PC-3 cells, we
used five different methods, DPPH, TEAC, FRAP, DMPD and free
radicals.
The DPPH test is based on the ability of the stable
2,2-diphenyl-1-picrylhydrazyl free radical to react with hydrogen
donors and it is still one of the most commonly used methods. In
this test, a radical solution is decolourised after reduction with
antioxidant (AH) or a radical (R•) in accordance with
the following scheme: DPPH• + AH→DPPH-H + A•,
DPPH• + R• → DPPH-R (48). The ABTS radical method is based on
the quenching of substances which acts as a hydrogen radical cation
created as one electron oxidation of synthetic chromophore
ABTS• which is thus reduced and changes its colour,
which is monitored as a decrease in absorbance at a preferable
wavelength (49). The FRAP method
is based on the principle of redox reaction using Fe(III) complexes
which are colourless and following reduction, it generates
violet-coloured products. DMPD radical cation (DMPD•+)
is generated through a reaction between DMPD and potassium
persulfate and is subsequently reduced in the presence of
hydrogen-donating antioxidants, similar to the DPPH test. After the
addition of a sample containing antioxidants, DMPD•+
radicals are scavenged and as a result of this scavenging, the
coloured solution is decolourised (50). The FRAP method is based on the
ability of chlorophyllin (the sodium-copper salt of chlorophyl) to
accept and donate electrons with a stable change of maximum
absorption. This effect is conditioned by an alkaline environment
and the addition of a catalyst (21).
All methods were calibrated using the standard
compound, Trolox. The obtained results were recalculated to the
viable cells (% of viability) that were determined in as described
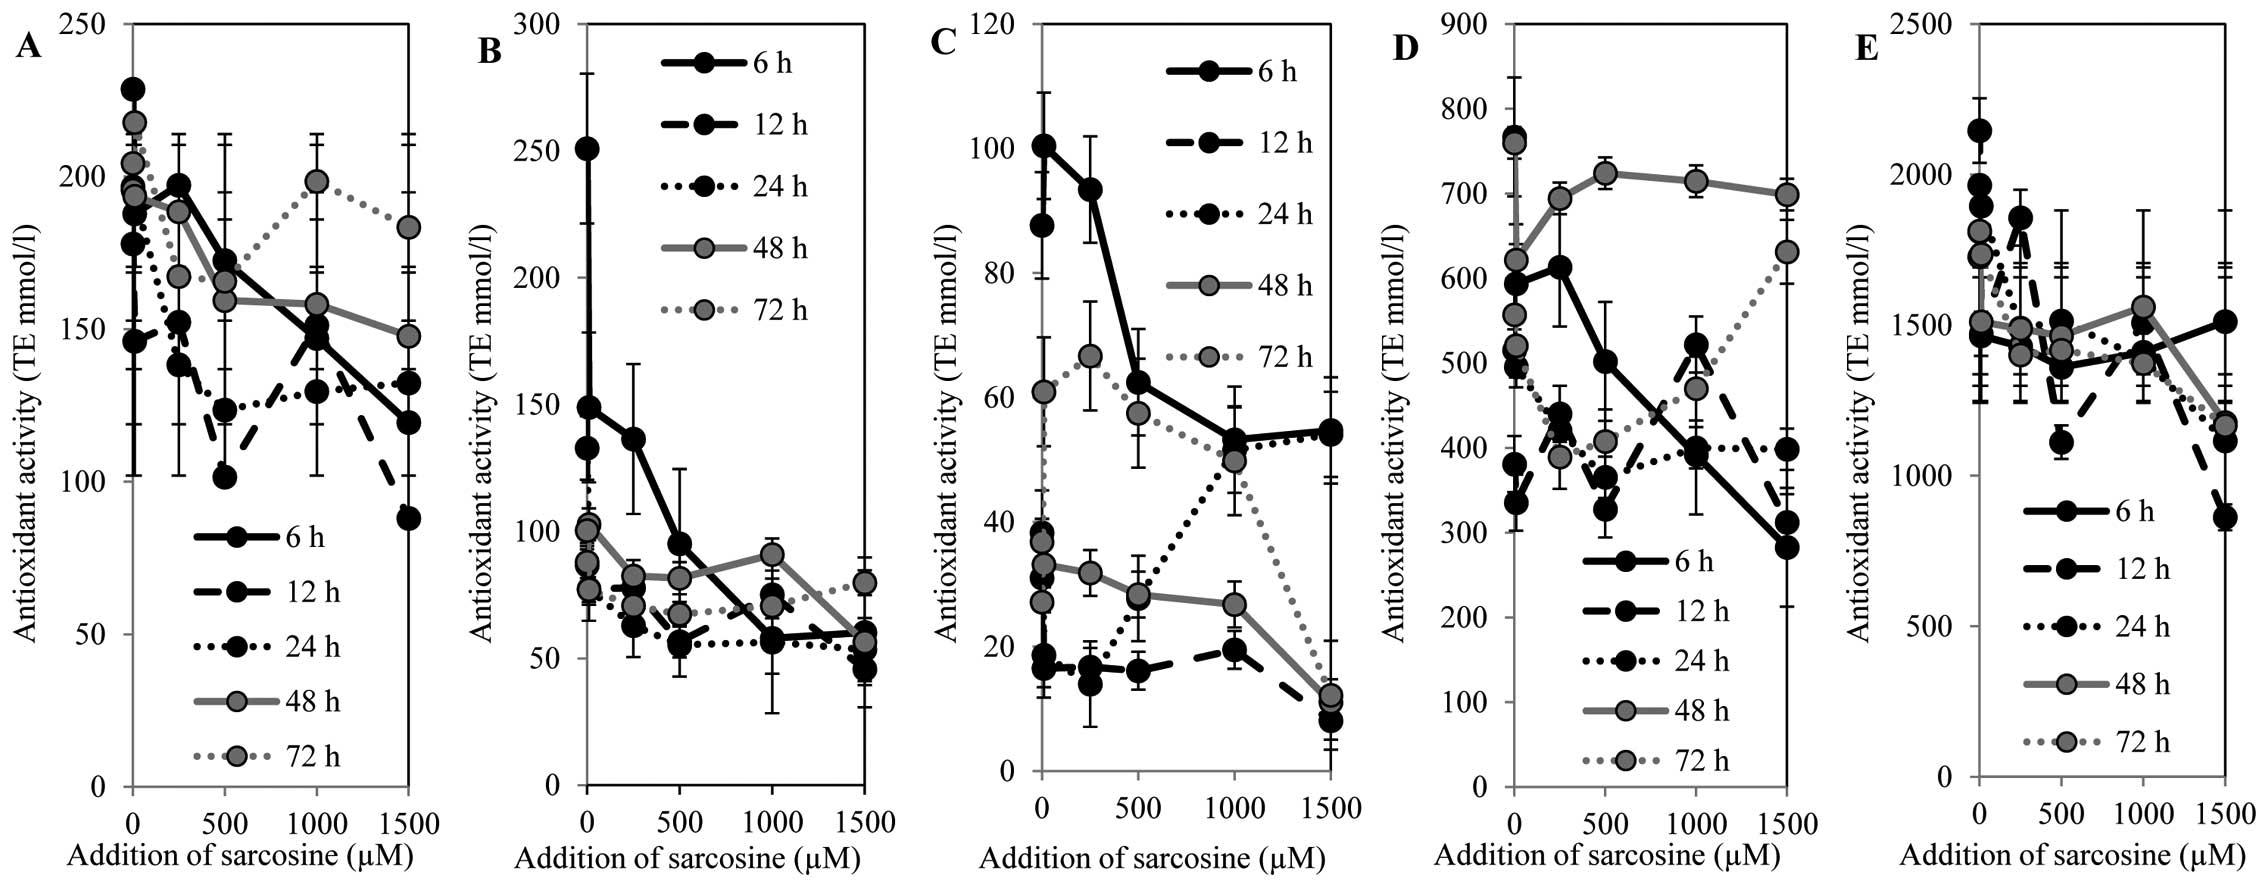
above in ‘Spectrophotometric analysis’. The antioxidant capacity
determined by the free radical method (Fig. 6A) showed a decreasing tendency in a
concentration-dependent manner within the time interval of 0 to 48
h. Subsequently, the antioxidant capacity increased in a
time-dependent manner. The highest antioxidant capacity was
determined after 72 h of sarcosine treatment in a
concentration-dependent manner. However, the antioxidant capacity
was reduced by 10% compared to the untreated control cells. The
results obtained using the FRAP method correlated with the results
obtained by the free radical method (Fig. 6B). A decrease in antioxidant
capacity in a concentration-dependent manner was evident. The
highest antioxidant capacity was determined in the cells treated
with sarcosine for 6 h; subsequently, a decrease was recorded.
After 48 h of incubation, an increase in antioxidant capacity in
the PC-3 cells treated with high sarcosine concentrations
(500–1,000 μM) was observed. On the other hand, the highest
sarcosine concentration (1,500 μM) led to a significant reduction
in antioxidant capacity. Different results were obtained after 72 h
of treatment. The lower sarcosine concentrations (up to 500 μM) led
to a reduction in antioxidant capacity, and the higher
concentrations led to a significant increase in antioxidant
capacity. The DPPH method confirmed the results obtained by the
previous two methods (Fig. 6C). The
most evident increase in antioxidant capacity was recorded in the
untreated PC-3 cells and in the PC-3 cells treated with sarcosine
in the concentration of 250 μM at the time points of 6, 12, 48 and
72 h. High sarcosine concentrations (500–1,500 μM) led to a
significant reduction in antioxidant capacity. However, the
obtained results indicate the role of the duration of the
treatment. PC-3 cells incubated for 24 h showed an increasing
tendency in antioxidant capacity in a concentration-dependent
manner. This fact is particularly evident in the PC-3 cells treated
with 1,000 μM sarcosine. The ABTS method revealed similar results
to those obtained by the DPPH method in both the untreated control
(0 μM of sarcosine) and treated cells (Fig. 6D). On the other hand, the increasing
antioxidant capacity with the increasing sarcosine concentrations
in the treated cells for 48 h was evident. The DMPD method showed a
decreasing tendency in antioxidant capacity with the increasing
sarcosine concentrations within the time points of 12 to 72 h
(Fig. 6E). On the other hand, the
increase in antioxidant capacity is evident in the cells treated
with sarcosine for 6 h. The results indicate the involvement of the
compounds with antioxidant activity in the metabolism of the PC-3
cells following sarcosine treatment. The changes in antioxidant
capacity demonstrate the rapid response to sarcosine treatment in a
time-dependent manner. As regards the correlation of markers of
oxidative capacity, we revealed a significant negative trend
between DPPH and FRAP (r=−0.68 at P<0.001) and between DMPD and
ABST (r=−0.64 at P<0.001). In addition, significant positive
trends were observed only between MT and DPPH (r=0.62 at
P<0.001).
In conclusion, non-invasive markers for PCa, through
which it would be possible to diagnose PCa by urine analysis, are
required. The non-protein amino acid, sarcosine, is one of the
substances with potential for use in the diagnosis of PCa by urine
analysis. However, the exact function of this amino acid in tumour
cells is not yet fully understood. In this study, we attempted to
cast light on the effects of various sarcosine doses on PC-3 PCa
cells and discovered that this compound significantly influences
various determined markers.
Acknowledgements
The present study was financially supported by
CEITEC CZ.1.05/1.1.00/02.0068, NanoBioTECell GACR P102/11/1068,
CYTORES GAČR P301/10/0356 and project for conceptual development of
research organization 00064203.
References
|
1
|
Boyd LK, Mao XY, Xue LY, et al:
High-resolution genome-wide copy-number analysis suggests a
monoclonal origin of multifocal prostate cancer. Gene Chromosomes
Cancer. 51:579–589. 2012. View Article : Google Scholar : PubMed/NCBI
|
|
2
|
Shimojo H, Kobayashi M, Kamigaito T,
Shimojo Y, Fukuda M and Nakayama J: Reduced glycosylation of
alpha-dystroglycans on carcinoma cells contributes to formation of
highly infiltrative histological patterns in prostate cancer.
Prostate. 71:1151–1157. 2011. View Article : Google Scholar
|
|
3
|
Chang HH, Chen BY, Wu CY, et al: Hedgehog
overexpression leads to the formation of prostate cancer stem cells
with metastatic property irrespective of androgen receptor
expression in the mouse model. J Biomed Sci. 18:62011. View Article : Google Scholar
|
|
4
|
Song LM, Zhu YC, Han P, et al: A
retrospective study: correlation of histologic inflammation in
biopsy specimens of Chinese men undergoing surgery for benign
prostatic hyperplasia with serum prostate-specific antigen.
Urology. 77:688–692. 2011. View Article : Google Scholar
|
|
5
|
Astigueta JC, Abad MA, Morante C, Pow-Sang
MR, Destefano V and Montes J: Characteristics of metastatic
prostate cancer ocurring in patients under 50 years of age. Actas
Urol Esp. 34:327–332. 2010.(In Spanish).
|
|
6
|
Lindstrom S, Schumacher FR, Cox D, et al:
Common genetic variants in prostate cancer risk prediction -
results from the NCI Breast and Prostate Cancer Cohort Consortium
(BPC3). Cancer Epidemiol Biomarkers Prev. 21:437–444. 2012.
View Article : Google Scholar : PubMed/NCBI
|
|
7
|
Hall MJ, Ruth K and Giri VN: Rates and
predictors of colorectal cancer screening by race among motivated
men participating in a prostate cancer risk assessment program.
Cancer. 118:478–484. 2012. View Article : Google Scholar : PubMed/NCBI
|
|
8
|
Vindrieux D, Reveiller M, Chantepie J, et
al: Down-regulation of DcR2 sensitizes androgen-dependent prostate
cancer LNCaP cells to TRAIL-induced apoptosis. Cancer Cell Int.
11:422012. View Article : Google Scholar : PubMed/NCBI
|
|
9
|
Paquet S, Fazli L, Grosse L, et al:
Differential expression of the androgen-conjugating UGT2B15 and
UGT2B17 enzymes in prostate tumor cells during cancer progression.
J Clin Endocrinol Metab. 97:E428–E432. 2012. View Article : Google Scholar : PubMed/NCBI
|
|
10
|
Armstrong AJ, Eisenberger MA, Halabi S, et
al: Biomarkers in the management and treatment of men with
metastatic castration-resistant prostate cancer. Eur Urol.
61:549–559. 2012. View Article : Google Scholar : PubMed/NCBI
|
|
11
|
Prensner JR, Rubin MA, Wei JT and
Chinnaiyan AM: Beyond PSA: the next generation of prostate cancer
biomarkers. Sci Transl Med. 4:127rv32012. View Article : Google Scholar : PubMed/NCBI
|
|
12
|
Lattanzi J, McNeely S, Hanlon A, Das I,
Schultheiss TE and Hanks GE: Daily CT localization for correcting
portal errors in the treatment of prostate cancer. Int J Radiat
Oncol Biol Phys. 41:1079–1086. 1998. View Article : Google Scholar : PubMed/NCBI
|
|
13
|
van Vugt HA, Roobol MJ, Busstra M, et al:
Compliance with biopsy recommendations of a prostate cancer risk
calculator. BJU Int. 109:1480–1488. 2012.PubMed/NCBI
|
|
14
|
Schoder H and Larson SM: Positron emission
tomography for prostate, bladder, and renal cancer. Semin Nucl Med.
34:274–292. 2004. View Article : Google Scholar : PubMed/NCBI
|
|
15
|
Fukushima K, Satoh T, Baba S and Yamashita
K: alpha 1,2-Fucosylated and beta-N-acetylgalactosaminylated
prostate-specific antigen as an efficient marker of prostatic
cancer. Glycobiology. 20:452–460. 2010. View Article : Google Scholar : PubMed/NCBI
|
|
16
|
Page ST, Hirano L, Gilchriest J, et al:
Dutasteride reduces prostate size and prostate specific antigen in
older hypogonadal men with benign prostatic hyperplasia undergoing
testosterone replacement therapy. J Urol. 186:191–197. 2011.
View Article : Google Scholar
|
|
17
|
Luo J, Zha S, Gage WR, et al:
Alpha-methylacyl-CoA racemase: a new molecular marker for prostate
cancer. Cancer Res. 62:2220–2226. 2002.PubMed/NCBI
|
|
18
|
Cao DL, Ye DW, Zhang HL, Zhu Y, Wang YX
and Yao XD: A multiplex model of combining gene-based,
protein-based, and metabolite-based with positive and negative
markers in urine for the early diagnosis of prostate cancer.
Prostate. 71:700–710. 2011. View Article : Google Scholar : PubMed/NCBI
|
|
19
|
Sreekumar A, Poisson LM, Rajendiran TM, et
al: Metabolomic profiles delineate potential role for sarcosine in
prostate cancer progression. Nature. 457:910–914. 2009. View Article : Google Scholar : PubMed/NCBI
|
|
20
|
Dahl M, Bouchelouche P, Kramer-Marek G,
Capala J, Nordling J and Bouchelouche K: Sarcosine induces increase
in HER2/neu expression in androgen-dependent prostate cancer cells.
Mol Biol Rep. 38:4237–4243. 2011. View Article : Google Scholar : PubMed/NCBI
|
|
21
|
Sochor J, Ryvolova M, Krystofova O, et al:
Fully automated spectrometric protocols for determination of
antioxidant activity: advantages and disadvantages. Molecules.
15:8618–8640. 2010. View Article : Google Scholar : PubMed/NCBI
|
|
22
|
Sochor J, Salas P, Zehnalek J, et al: An
assay for spectrometric determination of antioxidant activity of a
biological extract. Listy Cukrov Reparske. 126:416–417. 2010.
|
|
23
|
Pohanka M, Sochor J, Ruttkay-Nedecky B, et
al: Automated assay of the potency of natural antioxidants using
pipetting robot and spectrophotometry. J Appl Biomed. 10:155–167.
2012. View Article : Google Scholar
|
|
24
|
Ghosh A, Wang YN, Klein E and Heston WD:
Novel role of prostate-specific membrane antigen in suppressing
prostate cancer invasiveness. Cancer Res. 65:727–731.
2005.PubMed/NCBI
|
|
25
|
Tai S, Sun Y, Squires JM, et al: PC3 is a
cell line characteristic of prostatic small cell carcinoma.
Prostate. 71:1668–1679. 2011. View Article : Google Scholar : PubMed/NCBI
|
|
26
|
Moolenaar SH, Poggi-Bach J, Engelke UF, et
al: Defect in dimethylglycine dehydrogenase, a new inborn error of
metabolism: NMR spectroscopy study. Clin Chem. 45:459–464.
1999.PubMed/NCBI
|
|
27
|
Cernei N, Zitka O, Ryvolova M, et al:
Spectrometric and electrochemical analysis of sarcosine as a
potential prostate carcinoma marker. Int J Electrochem Sci.
7:4286–4301. 2012.
|
|
28
|
Eckschlager T, Adam V, Hrabeta J, Figova K
and Kizek R: Metallothioneins and cancer. Curr Protein Pept Sci.
10:360–375. 2009. View Article : Google Scholar : PubMed/NCBI
|
|
29
|
Krizkova S, Fabrik I, Adam V, Hrabeta J,
Eckschlager T and Kizek R: Metallothionein - a promising tool for
cancer diagnostics. Bratisl Lek Listy. 110:93–97. 2009.PubMed/NCBI
|
|
30
|
Krizkova S, Adam V, Eckschlager T and
Kizek R: Easy-to-use and rapid detection of potential tumour
disease marker metallothionein by using of PVDF membranes and
chicken antibodies. FEBS J. 276:317. 2009.
|
|
31
|
Krizkova S, Fabrik I, Huska D, et al: An
adsorptive transfer technique coupled with Brdicka reaction to
reveal the importance of metallothionein in chemotherapy with
platinum based cytostatics. Int J Mol Sci. 11:4826–4842. 2010.
View Article : Google Scholar : PubMed/NCBI
|
|
32
|
Krizkova S, Masarik M, Majzlik P, et al:
Serum metallothionein in newly diagnosed patients with childhood
solid tumours. Acta Biochim Pol. 57:561–566. 2010.PubMed/NCBI
|
|
33
|
Krejcova L, Fabrik I, Hynek D, et al:
Metallothionein electrochemically determined using Brdicka reaction
as a promising blood marker of head and neck malignant tumours. Int
J Electrochem Sci. 7:1767–1784. 2012.
|
|
34
|
Sochor J, Hynek D, Krejcova L, et al:
Study of metallothionein role in spinocellular carcinoma tissues of
head and neck tumours using Brdicka reaction. Int J Electrochem
Sci. 7:2136–2152. 2012.
|
|
35
|
Gumulec J, Masarik M, Krizkova S, et al:
Evaluation of alpha-methylacyl-CoA racemase, metallothionein and
prostate specific antigen as prostate cancer prognostic markers.
Neoplasma. 59:191–201. 2012. View Article : Google Scholar : PubMed/NCBI
|
|
36
|
Krizkova S, Ryvolova M, Gumulec J, et al:
Electrophoretic fingerprint metallothionein analysis as a potential
prostate cancer biomarker. Electrophoresis. 32:1952–1961. 2011.
View Article : Google Scholar : PubMed/NCBI
|
|
37
|
Hamer DH: Metallothionein. Annu Rev
Biochem. 55:913–951. 1986. View Article : Google Scholar : PubMed/NCBI
|
|
38
|
Krizkova S, Adam V and Kizek R: Study of
metallothionein oxidation by using of chip CE. Electrophoresis.
30:4029–4033. 2009. View Article : Google Scholar : PubMed/NCBI
|
|
39
|
Krizkova S, Masarik M, Eckschlager T, Adam
V and Kizek R: Effects of redox conditions and zinc(II) ions on
metallothionein aggregation revealed by chip capillary
electrophoresis. J Chromatogr A. 1217:7966–7971. 2010. View Article : Google Scholar : PubMed/NCBI
|
|
40
|
Adam V, Fabrik I, Eckschlager T, Stiborova
M, Trnkova L and Kizek R: Vertebrate metallothioneins as target
molecules for analytical techniques. TrAC Trends Anal Chem.
29:409–418. 2010. View Article : Google Scholar
|
|
41
|
Ryvolova M, Krizkova S, Adam V, et al:
Analytical methods for metallothionein detection. Curr Anal Chem.
7:243–261. 2011.
|
|
42
|
Sochor J, Pohanka M, Ruttkay-Nedecky B, et
al: Effect of selenium in organic and inorganic form on liver,
kidney, brain and muscle of Wistar rats. Cent Eur J Chem.
10:1442–1451. 2012. View Article : Google Scholar
|
|
43
|
Jurikova T, Sochor J, Rop O, et al:
Evaluation of polyphenolic profile and nutritional value of
non-traditional fruit species in the Czech Republic - a comparative
study. Molecules. 17:8968–8981. 2012. View Article : Google Scholar : PubMed/NCBI
|
|
44
|
Rop O, Reznicek V, Mlcek J, et al:
Antioxidant and radical oxygen species scavenging activities of 12
cultivars of blue honeysuckle fruit. Hort Sci. 38:63–70. 2011.
|
|
45
|
Sochor J, Babula P, Krska B, et al:
Evaluation of output signals from CoulArray detector for
determination of antioxidant capacity of apricots samples. Analysis
of Biomedical Signals and Images. Jan J, Jirik R, Kolar R, Kolarova
J, Kozumplik J and Provaznik I: Brno University of Technology VUT v
Brně Press; Brno: pp. 209–214. 2010
|
|
46
|
Krauth-Siegel RL and Leroux AE:
Low-molecular-mass antioxidants in parasites. Antioxid Redox
Signal. 17:583–607. 2012. View Article : Google Scholar : PubMed/NCBI
|
|
47
|
Pohanka M, Karasova JZ, Musilek K, Kuca K,
Jung YS and Kassa J: Changes of rat plasma total low molecular
weight antioxidant level after tabun exposure and consequent
treatment by acetylcholinesterase reactivators. J Enzyme Inhib Med
Chem. 26:93–97. 2011. View Article : Google Scholar
|
|
48
|
Parejo L, Codina C, Petrakis C and Kefalas
P: Evaluation of scavenging activity assessed by
Co(II)/EDTA-induced luminol chemiluminescence and DPPH·
(2,2-diphenyl-1-picrylhydrazyl) free radical assay. J Pharmacol
Toxicol Methods. 44:507–512. 2000.PubMed/NCBI
|
|
49
|
Nilsson J, Pillai D, Onning G, Persson C,
Nilsson A and Akesson B: Comparison of the
2,2′-azinobis-3-ethylbenzotiazoline-6-sulfonic acid (ABTS) and
ferric reducing antioxidant power (FRAP) methods to asses the total
antioxidant capacity in extracts of fruit and vegetables. Mol Nutr
Food Res. 49:239–246. 2005.
|
|
50
|
Asghar MN, Khan IU, Arshad MN and Sherin
L: Evaluation of antioxidant activity using an improved DMPD
radical cation decolorization assay. Acta Chim Slov. 54:295–300.
2007.
|