Introduction
Lung cancer is one of the most common malignancies
in the Western world and also in Denmark (1,2). It is
highly associated with smoking and, despite significant efforts in
antismoking campaigns, the incidence is still increasing. Lung
cancer can be sub-classified into small cell lung cancer (SCLC) and
non-small cell lung cancer (NSCLC), with NSCLC being the most
common (80%). NSCLC can be further classified according to
histology and genetic composition. The treatment of NSCLC comprises
surgery, radiotherapy, chemotherapy and/or biological treatment,
depending on the stage of disease, co-morbidity and the patient’s
general health. The disease may be cured by surgery, but the
majority of patients are diagnosed at an advanced stage, leaving
palliative treatment as the only option. Thus, the prognosis is
often poor with only few patients experiencing long-term survival,
calling for treatment improvements.
New treatment strategies are rapidly emerging and
most are biological compounds with specific targets such as the
epidermal growth factor receptor tyrosine kinase inhibitors (EGFR
TKIs), which have proven highly effective in patients with
activating EGFR mutations. Another treatment strategy are the
EML4-ALK inhibitors effective in EML4-ALK positive lung cancer
(3–6). Common characteristics for these
genetic changes are that they are more frequent in adenocarcinomas
and represent an early event in the development of cancer.
Furthermore, it has become evident that new mutations may appear
during the course of the disease, and the initial biopsy may,
therefore, be insufficient as the basis for choice of treatment
(7). Some of the mutations arising
confer resistance to the current treatment (such as the EGFR T790M
mutation causing resistance to EGFR TKIs) and identification of
such mutations at an early stage may help tailor the treatment
(7,8). With the increasing knowledge of the
complex genetic composition of NSCLC, mutation testing at baseline
has gained significance.
To date, mutation analyses are generally performed
on DNA derived from tumour tissue and, for practical reasons,
mostly from the initial diagnostic biopsy. The new insights into
the mutation status possibly changing throughout the treatment
course necessitate repeated mutation analyses, leaving the
clinicians with the dilemma of either performing multiple invasive
procedures or staying on the path pointed out by the initial
biopsy. Recent years have seen new and refined methods of
identifying mutations in DNA derived from a blood sample, offering
a highly appealing way of reducing the need for sequential invasive
procedures.
The plasma mutated DNA represents a fraction of the
cell-free DNA (cfDNA), which is small fragments of DNA circulating
in the blood stream. The biological mechanisms underlying cfDNA
remain to be fully understood, but increased apoptosis, necrosis of
tumour cells, active release and lysis of circulating tumour cells
(CTCs) have been proposed (9).
cfDNA is present in both healthy individuals and patients with
non-cancerous diseases, but the levels increase in patients with
malignant diseases, probably due to increased activity of the
aforementioned processes. Several studies have demonstrated a
prognostic value of the total level of cfDNA, with high levels
being associated with shorter survival (10–15).
Furthermore, the qualitative perspective in terms of
tumour-specific mutations has been investigated, demonstrating that
it is indeed possible to identify tumour-specific mutations in the
blood to serve as prognostic or predictive markers in different
treatment settings (16,17). The possibility of monitoring the
disease opens new options calling for further investigation.
Quantitative changes during the treatment course may predict the
effect of the treatment and, thus, may represent a new tool for
treatment monitoring, while qualitative changes such as new
mutations in plasma are another important aspect (17,18).
The present study investigated the relationship
between the level of cfDNA and the disease development at different
time-points during the course of disease. Furthermore, the plasma
KRAS mutation status during treatment and the prognostic impact of
cfDNA was analysed.
Materials and methods
Patients
Patients with newly diagnosed, histopathologically
confirmed stage III-IV NSCLC were included in a prospective
biomarker study at the Department of Oncology, Vejle Hospital.
Patients were included based on the following criteria: candidate
for first-line treatment, age >18 years, no previous cancer
diagnosis within five years before their inclusion in this study
and written informed consent. The treatment comprised carboplatin
[(GFR+25) × AUC mg i.v. on day 1] and vinorelbine (30
mg/m2 i.v. on day 1 and 60 mg/m2 p.o. on day
8), alone or with bevacizumab (7.5 mg/m2 i.v. on day
1).
Blood samples for analysis of cfDNA were drawn at
baseline (within two weeks before treatment start), on day 8 of the
first treatment cycle and at time of progression. The samples were
stored at −80°C until further analyses.
All patients had a baseline CT of the chest and
upper abdomen within a month prior to treatment start. The
treatment effect was evaluated by CT scans of the chest and upper
abdomen and repeated at follow-up. Objective response rate was
determined according to RECIST v.1.1 (19). The primary end-points were overall
survival (OS) and progression-free survival (PFS).
The study was approved by the Regional Scientific
Ethics Committee for Southern Denmark in accordance with the Danish
law.
Plasma analyses of cfDNA and KRAS
A peripheral blood sample of 20 ml collected in
EDTA-tubes was drawn at each time-point and plasma was subsequently
isolated by centrifugation at 2,000 × g for 10 min. The plasma was
separated within 2 h of blood sampling and subsequently stored at
−80°C until further analysis. Total nucleic acid was extracted from
1.0 ml plasma by the use of a QIAsymphony virus/bacteria midi-kit
on a QIAsymphony robot (Qiagen) according to the manufacturer’s
instructions. Both cfDNA and KRAS mutations were analysed by qPCR
and an in-house developed assay. To determine the level of cfDNA a
one-genome equivalent gene, the β2 microglobuline (B2M)
was used. The B2M-gene is not involved in carcinogenesis but is
present in all cells and is therefore suitable for determining the
total level of cfDNA regardless of cellular origin. The sequence of
the forward primer was 3′-TAA AACTTAATGTCTTCCTTTTTTTTCTC-5′, the
reverse primer was 3′-AAACATTTTCTCAAGGTCAAAAACTTA-5′, and the probe
Fam-CCTCCATGATGCTGCTTACATGTC TC-Tamra. The rather small PCR product
(102 bp) increases the sensitivity of the analysis, since smaller
cfDNA fragments are more likely to be detected.
In order to prevent overestimation of the cfDNA
caused by lysis of leukocytes or accidental mixing of leukocytes
into the plasma, the samples were analysed for leukocyte
contamination. Samples with evidence of leukocytes were excluded
from the quantitative analyses.
The KRAS mutations were also analysed by in-house
qPCR assays as previously described in detail (14,20).
In brief, six mutations of codon 12 and one in codon 13 of the
KRAS-gene were identified by an ARMS-qPCR method. The high
specificity of the method allowed for identification of KRAS
mutations despite high background DNA.
All the reactions were run as doublets and the qPCR
results were demonstrated as an amplification plot and subsequently
transformed into alleles/ml as previously described (14).
Statistical analysis
The correlations between patient characteristics,
cfDNA and pmKRAS were investigated by non-parametric Wilcoxon rank
sum test, χ2 test or Fischer’s exact test when
appropriate. The same tests were used for correlations between
objective response rate and cfDNA level. Differences in level of
cfDNA between different time-points of blood sampling were
investigated by Wilcoxon rank-sum test. Survival analyses were
evaluated by Kaplan-Meier plots and any differences between the
groups were estimated by the log-rank method.
PFS was calculated as time between first day of
treatment and objective progression or mortality due to any cause.
OS was calculated as time between first day of treatment and date
of mortality due to any cause. Patients with no events were
censored by the last date of observation (May 15, 2013).
All statistical analyses were carried out in NSCSS
statistical software (version 07.1.15 2009; NCSS Statistical
Software, Kaysville, UT, USA). Two-sided P-value <0.05 was
considered to indicate a statistically significant result.
Results
Patient selection
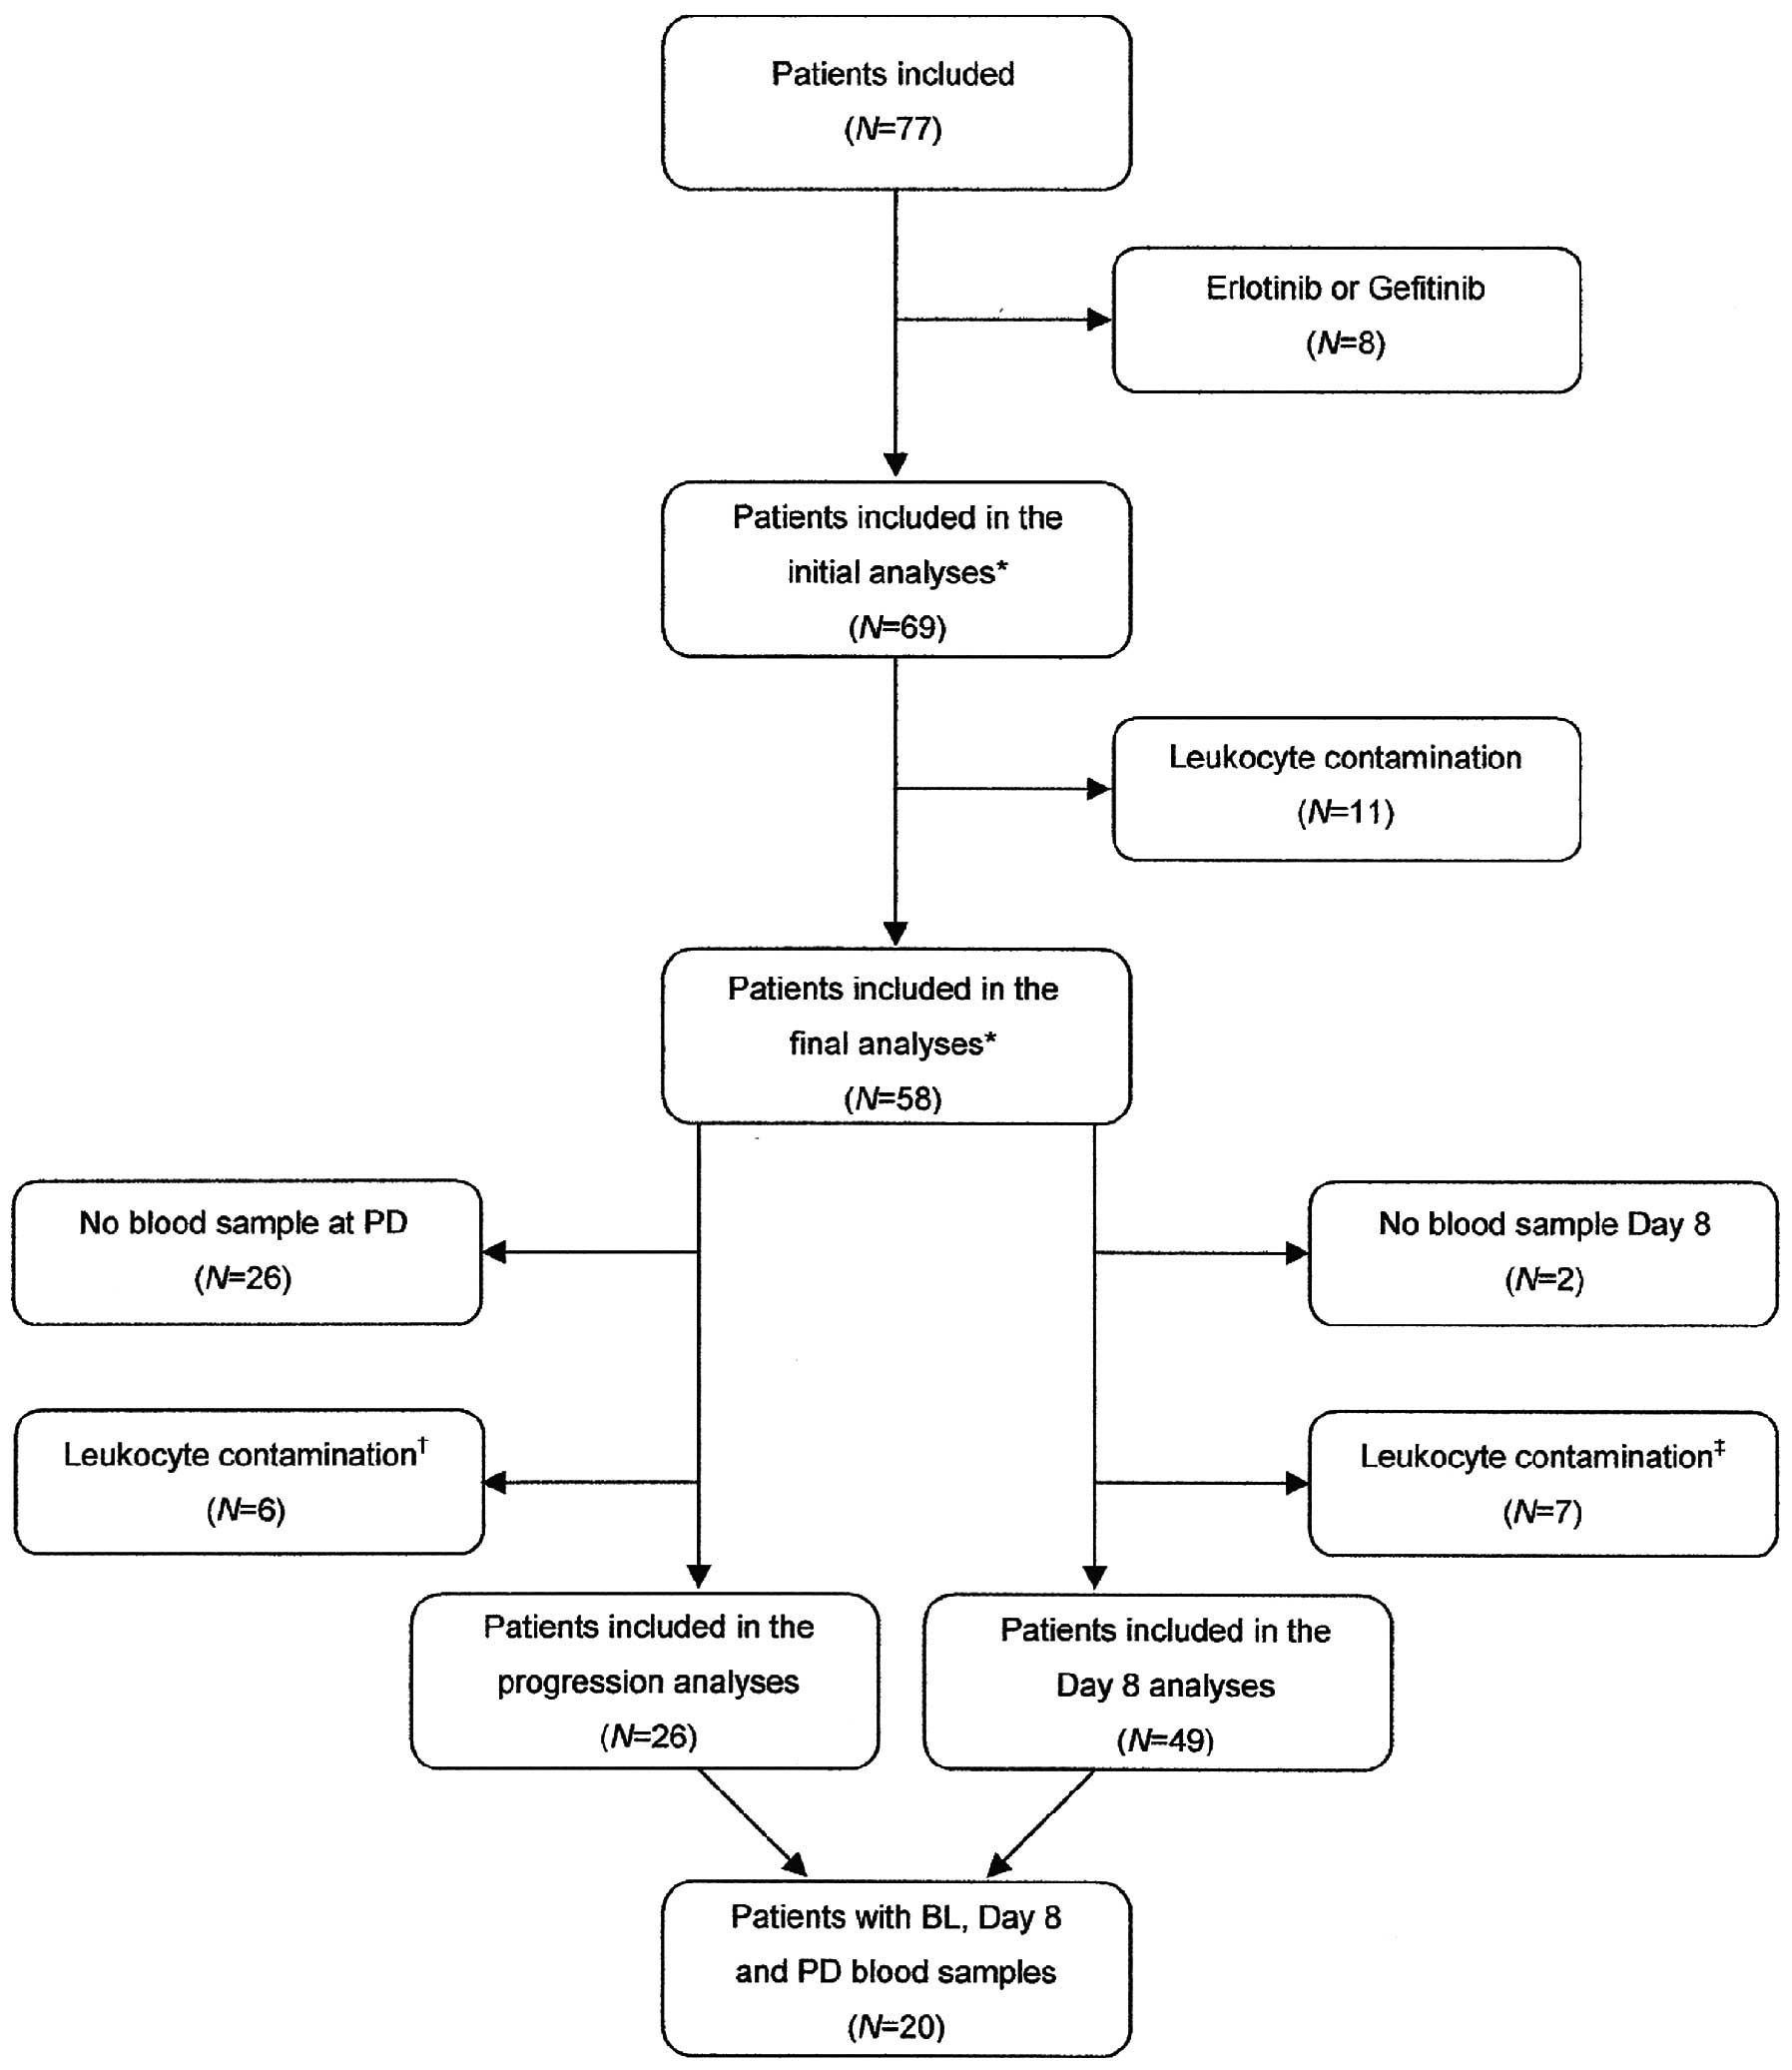
The present study included 69 patients. Patients
with leukocyte contamination were excluded leaving 58 patients for
analysis of cfDNA. The patient selection process is demonstrated in
the consort diagram (Fig. 1) and
patient characteristics are provided in Table I. The patient characteristics were
correlated with the baseline level of cfDNA. Patients with distant
metastases (median cfDNA 7,100 alleles/ml) had a significantly
higher level of cfDNA compared to patients without metastases
(median cfDNA 4,900 alleles/ml; P=0.04). Furthermore, the patient
characteristics were tested for differences in PFS and OS, but no
significant differences were found in any of the variables.
 | Table IPatient characteristics. |
Table I
Patient characteristics.
| Characteristics | Baseline values |
|---|
| No. of patients, n
(%) | 58 (100) |
| Age (years) |
| Median (range) | 64 (46–84) |
| Gender, n (%) |
| Male | 33 (57) |
| Female | 25 (43) |
| Histology, n (%) |
| Adenocarcinoma | 48 (83) |
| SCCa | 8 (14) |
| Unclassified | 2 (3) |
| Stage, n (%) |
| III | 6 (10) |
| IV | 52 (90) |
| Distant
metastasesb, n (%) |
| Yes | 44 (76) |
| No | 14 (24) |
| CNS metastases, n
(%) |
| Yes | 8 (14) |
| No | 50 (86) |
| ECOG PSc at baseline, n (%) |
| 0 | 21 (36) |
| 1 | 29 (50) |
| 2 | 8 (14) |
| LDH at baseline, n
(%) |
| Normal | 33 (57) |
| Elevated | 22 (38) |
| Missing | 3 (5) |
| Treatment regimen, n
(%) |
| Carboplatin +
vinorelbine (CN)d | 36 (62) |
| CN +
bevacizumab | 22 (38) |
Dynamics of cfDNA during treatment
When comparing the median level of cfDNA at baseline
and time of progression (n=26), there was a significantly higher
median at progression (9,250 alleles/ml) compared to baseline
(5,450 alleles/ml); P=0.02). There were no significant differences
between the level at baseline and on day 8 but a significantly
higher level at progression compared to day 8 (data not shown).
Response was evaluated according to RECIST v.1.1,
and the best overall response was correlated with the change in
total cfDNA from baseline to day 8. There was no obvious trend in
the change of cfDNA depending on response. Due to the large
differences in the level of cfDNA between the patients, the
response was correlated with the size of change in terms of
percent. There was no significant difference in response (PR, vs.
NC vs. PD) between patients with an increase or decrease in cfDNA
larger than either 25 or 50%. There were no significant differences
when the patients were grouped into stable disease (PR+NC) vs. PD
either.
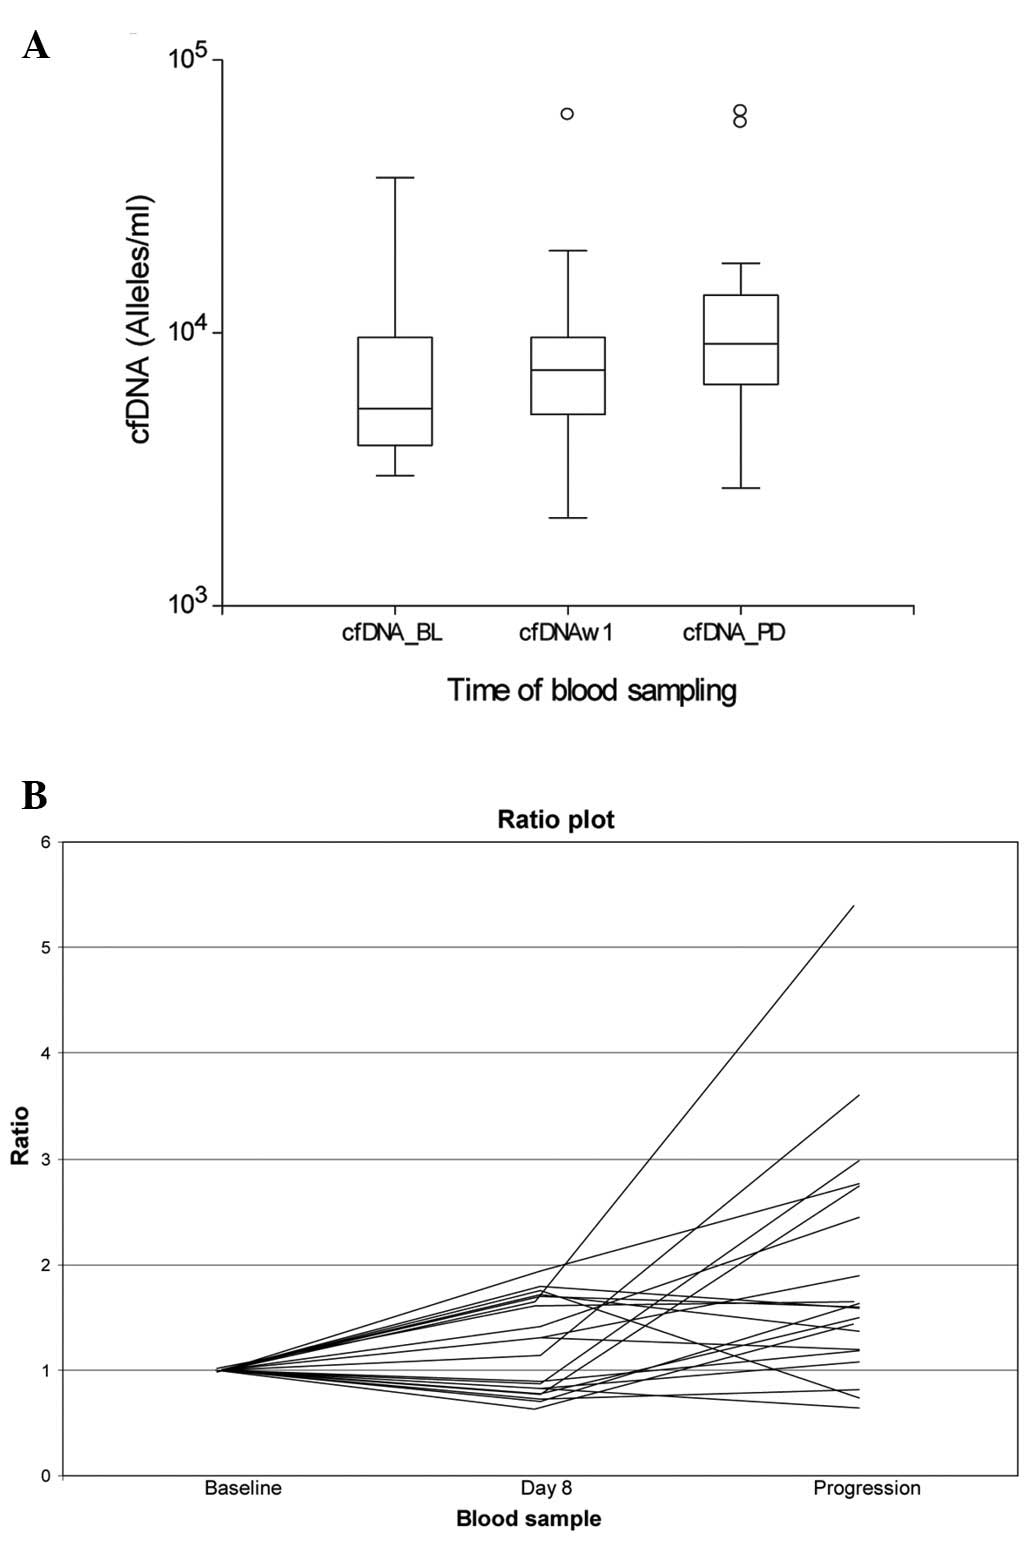
Fig. 2 illustrates
the levels of cfDNA during the therapy in the 20 individual
patients with cfDNA analyses available at all three time-points.
Seventeen patients (85%) had increasing values at progression. The
difference between baseline (median cfDNA, 5,320 alleles/ml) and
progression (median cfDNA, 9,250 alleles/ml) was significant
(P=0.01).
Dynamics of pmKRAS during treatment
Only seven of the patients were identified with a
plasma KRAS mutation at baseline (10%). The mutation persisted
during the treatment course. Two patients had changing mutation
status during the treatment period. The first patient had no
mutation at either baseline or day 8, but at progression, and the
second patient had no mutation at baseline but at day 8 and at
progression.
Prognostic value of cfDNA
When investigating the prognostic value, the initial
cut-off was set at quartiles, as previously described (12). By this exploratory approach, a
significant difference between patients in the lower three
quartiles and the upper fourth was observed (P<0.05; data not
shown), leading to further dichotomisation by the upper fourth
quartile.
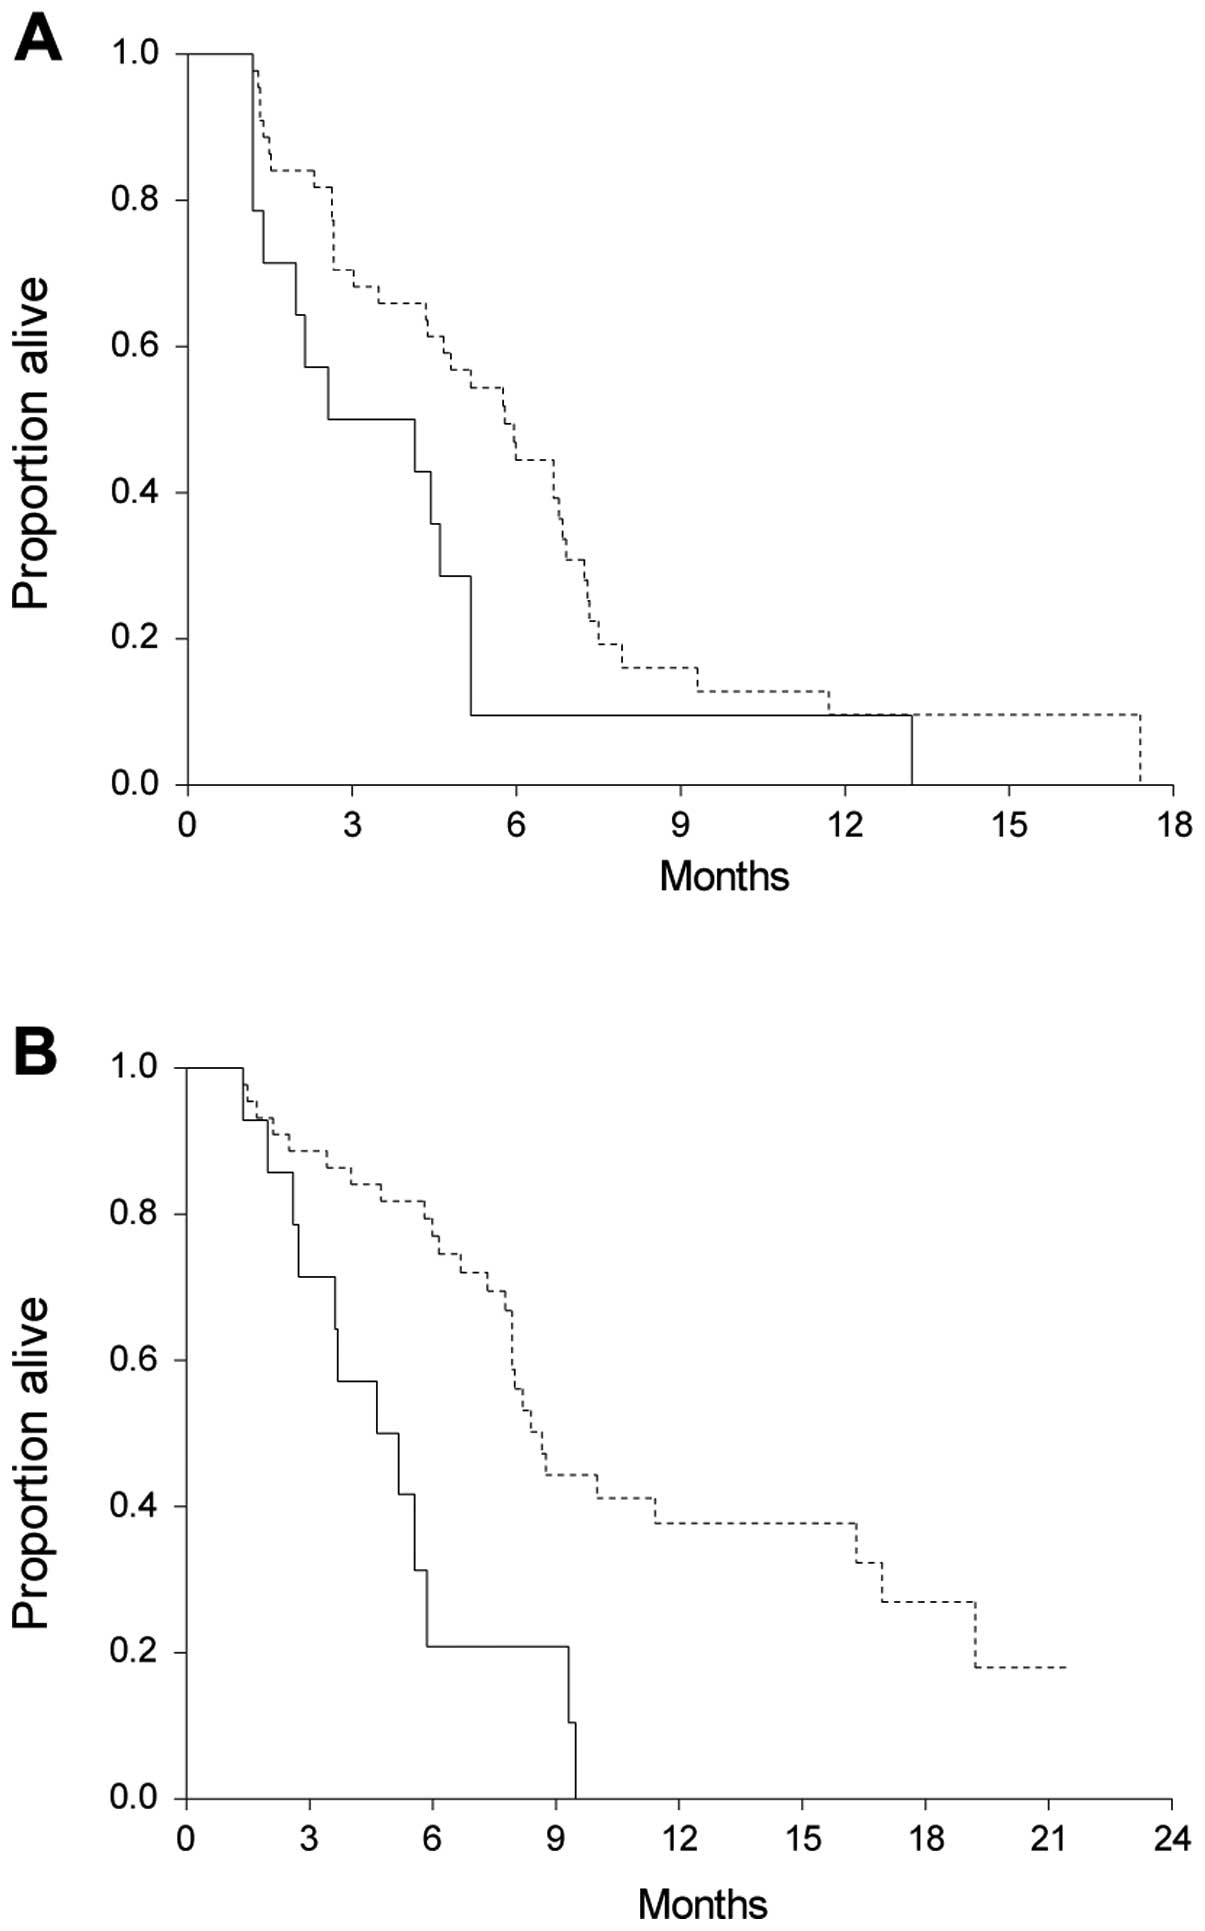
This revealed a significantly shorter median OS of
patients with high levels of cfDNA. The median survival time of all
patients was 8.0 months (95% CI, 6.7–9.3). Patients with high
levels of cfDNA had a significantly shorter OS (median, 4.6 months;
95% CI, 2.7–5.6) than patients with lower levels (median, 8.7
months; 95% CI 7.9–11.4; HR, 3.1, 95% CI 1.2–8.0; P=0.0004).
Nineteen patients were censored. Survival curves are demonstrated
in Fig. 3.
In addition to OS, PFS according to the baseline
level of cfDNA was also investigated. As shown in Fig. 3, there were significant differences
in PFS in patients with high vs. low levels of cfDNA. Eight
patients were censored. The median PFS of patients with cfDNA
>75% was 2.6 months (95% CI, 1.4–4.6) compared to 5.8 months
(95% CI, 4.3–6.8) of the other patients (HR, 2.0; 95% CI, 1.0–4.3;
P=0.03).
cfDNA at day 8 (n=56) was not correlated with either
PFS or OS (P>0.05; data not shown).
Prognostic value of plasma mutated KRAS
(pmKRAS)
pmKRAS was identified and quantified. Only 7/69
patients (10%) had a mutation at baseline and further statistical
analyses of the quantitative impact of pmKRAS were therefore not
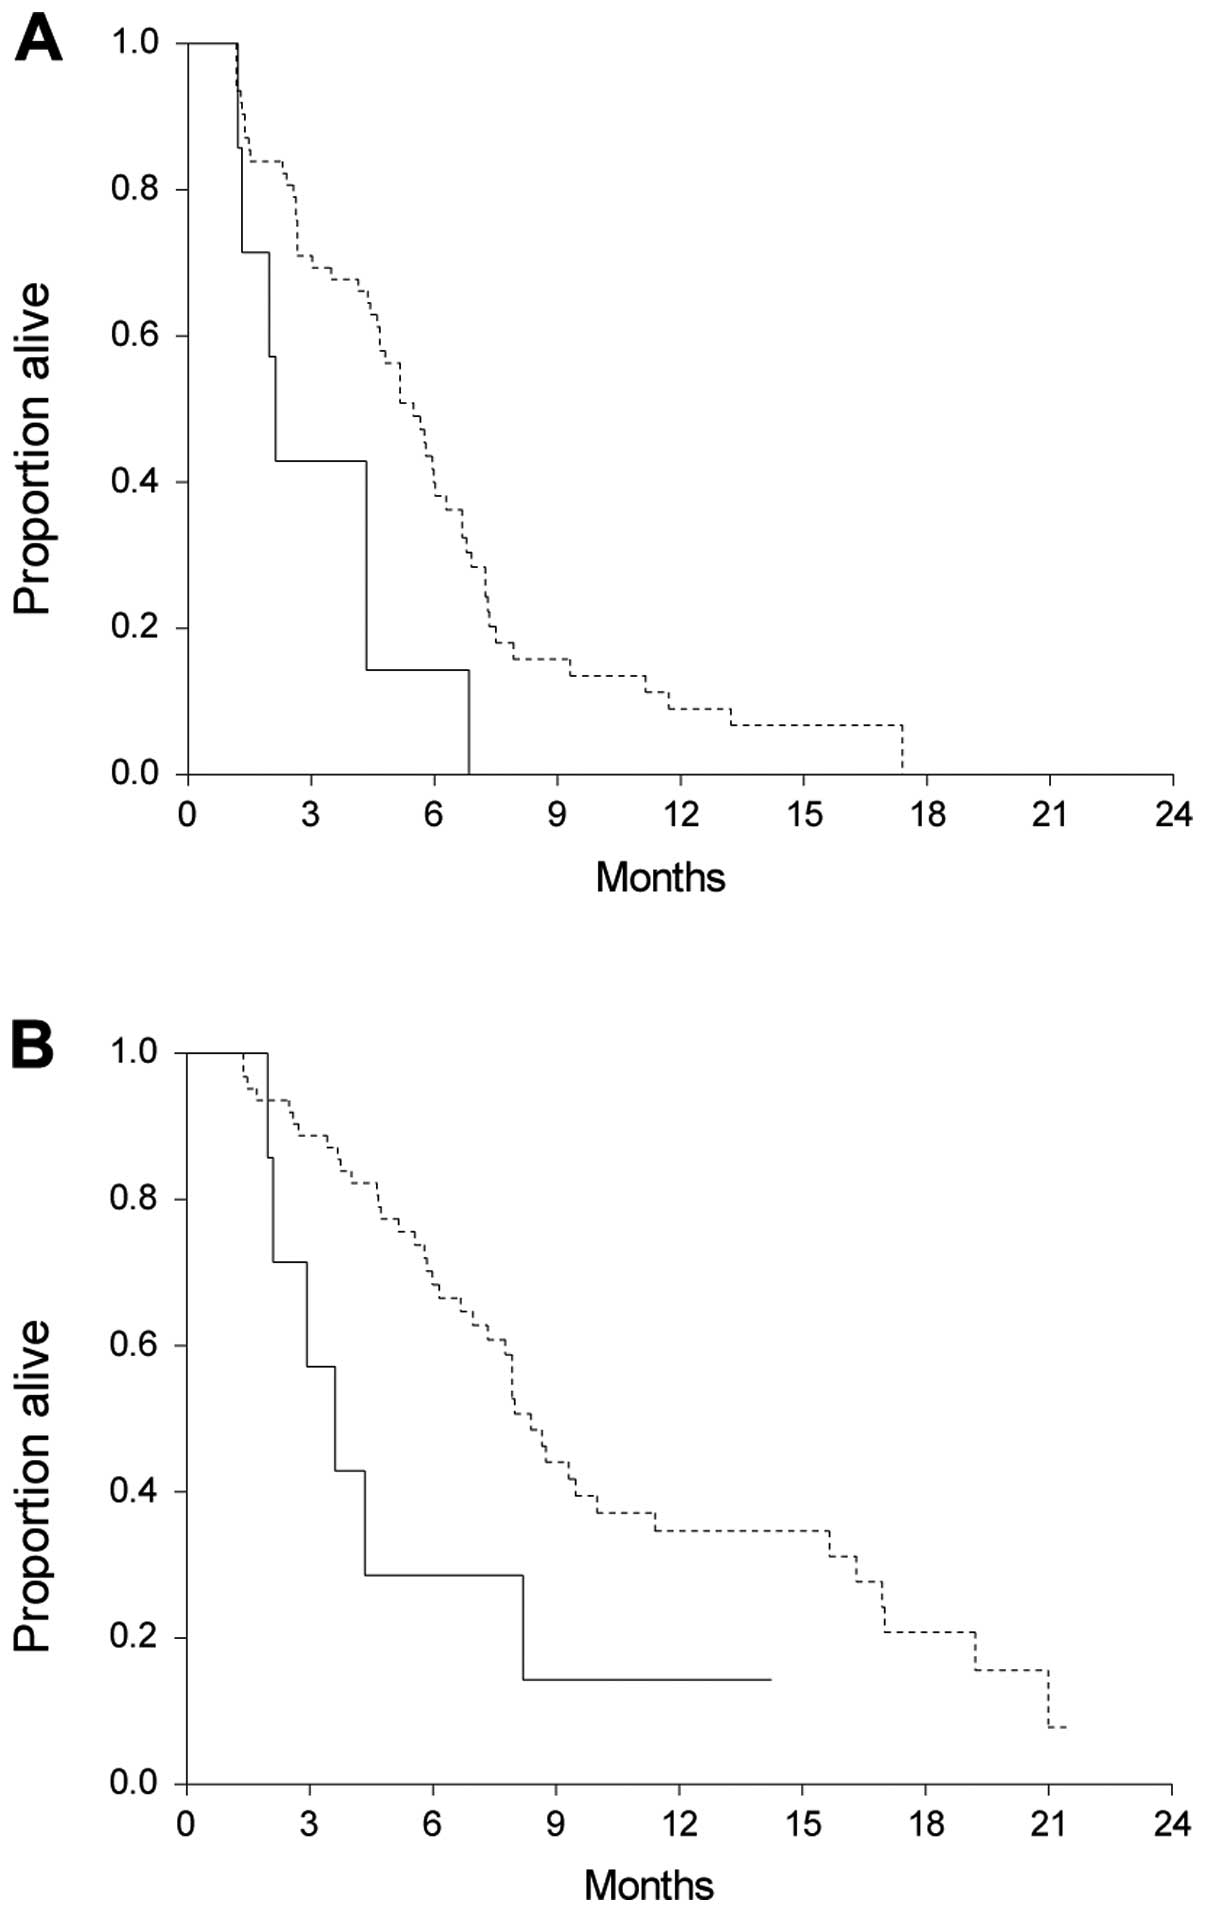
possible. Qualitative analyses were performed with the patients
divided into two groups, with mutations or wild-type (WT). Nine
patients were censored for PFS and 22 for OS. The median OS in the
mutated group was significantly shorter than in the WT group
[median 3.6 (95% CI, 2.1–4.3) vs. 8.4 months (95% CI, 7.3–10.0; HR;
2.5 (95% CI, 0.7–8.6); P=0.03]. The same was observed in PFS, where
patients harbouring a mutation had a median PFS of 2.1 months (95%
CI, 1.3–2.1) compared to 5.5 months (95% CI, 4.6–6.0) in the WT
patients [HR, 2.6 (95% CI, 0.8–8.6); P=0.01]. Survival curves are
shown in Fig. 4.
Discussion
The focus on and the need for sequential genetic
testing throughout the course of the disease is rapidly increasing.
Patient-friendly methods rather than invasive procedures are highly
warranted, and the possibility of identifying reliable biomarkers
and even tumour-specific mutations in a blood sample is highly
advantageous. In the present study, we investigated both the level
of cfDNA and the tumour-specific KRAS mutation in plasma at three
different time-points. The material was prospectively collected by
enrolment in a pre-defined biomarker protocol making the patient
group homogenous and, importantly, also comparable with previous
studies of the same area (12,16).
The analyses were performed by an in-house developed
assay, which has been used, validated and previously described in
detail (14,16,20).
The PCR-fragment used in the present study was short (only 102 bp),
increasing the detection rate of even small fragments of cfDNA in
the plasma. A method for identifying samples with possible
leukocyte contamination was also used, enabling exclusion of
patients with an unreliable estimation of the level of cfDNA.
The level of cfDNA changed significantly from
baseline to progression, but not between baseline and day 8,
indicating a correlation between disease progression and increasing
levels of cfDNA. Day 8 may be too early to detect any significant
indications of the prognosis, but the same measurement at later
time-points may be of interest in order to predict progression at
an early stage. The issue has been investigated by other authors,
although only few studies are available. In 2001, Sozzi et
al (21) investigated the level
of cfDNA before and after surgery and at follow-up of 38 patients
with NSCLC. A reduction of cfDNA was seen in the relapse-free
patients, while four patients had increasing levels in following
measurements of cfDNA. Notably, all patients with increasing levels
subsequently presented with cancer.
In agreement with our data, Kumar et al
(22) also reported increasing
levels of cfDNA in patients with progression after three courses of
chemotherapy in 42 patients with advanced NSCLC. However, in
contrast to our observations, the authors were not able to
demonstrate any prognostic value of the baseline level of cfDNA as
in the present study. Reasons for these discrepancies may be
different cut-off limits as well as a heterogeneous patient
population.
We examined the dynamics of pmKRAS at the different
time-points. Ten percent of the patients had a KRAS mutation at
baseline, which is lower than expected, but may be due to the
relatively low number of patients included or, undetectable, low
levels of KRAS in the circulation. Of note, two patients without
detectable KRAS mutation at baseline were subsequently identified
with KRAS mutations in the plasma. One of the patients had a
mutation both on day 8 and at progression, while the other had a
mutation only at time of progression. The findings may reflect
limitations of the method in detecting KRAS mutations in plasma,
tumour heterogeneity with increasing levels of the KRAS-mutated
clone during treatment, or the appearance of new mutations. The
same phenomenon has previously been demonstrated in metastatic
colorectal cancer and is also discussed in a review by Mok
(7), suggesting that new mutations
may arise as a consequence of selection pressure during treatment
(14).
In addition to the dynamics of cfDNA and pmKRAS, we
investigated the prognostic value of the two parameters at
baseline. We previously demonstrated an independent prognostic
value of the level of cfDNA and the mutational status of pmKRAS in
similar patient material and sought to validate these findings
(12,16). The same cut-off limits based on
quartiles and subsequent dichotomisation at the 75th percentile
were used in the present study. We were able to validate the
prognostic value of cfDNA both at the level of quartiles and at the
75th percentile, with higher levels of cfDNA being associated with
a shorter OS and PFS. Furthermore, in our previous study, a
subgroup analysis of patients with both high levels of cfDNA
(>75th percentile) and a poor PS (PS=2) showed an even poorer
prognosis for these patients. In the present study, only two
patients fulfilled these criteria, leaving no room for further
statistical analyses.
Our previous study showed an independent prognostic
value of the presence of KRAS mutations in plasma, the mutations
being associated with a poorer prognosis (16). Despite the low number of patients
with pmKRAS in the present study, the results of our previous study
were confirmed, indicating a prognostic value of pmKRAS in this
setting.
cfDNA is a potentially valuable tool in monitoring
treatment effect in patients with NSCLC, but the optimal time for
analysis remains to be defined. Furthermore, tumour-specific
mutations such as KRAS appear to be a dynamic phenomenon
highlighting the need for repeated analyses of the tumour’s genetic
composition. The present results confirmed our previous findings,
but further studies are required to outline the field of optimal
clinical application of cfDNA and tumour-specific mutations
measured in plasma.
Acknowledgements
The authors thank Yvette Schandorf Sørensen for
keeping track of the blood sample collection and the dedicated
co-workers of the Department of Biochemistry for technical
assistance. We thank Karin Larsen for proofreading the final
manuscript.
References
|
1
|
Engholm G, Ferlay J, Christensen N, et al:
NORDCAN: Cancer Incidence, Mortality, Prevalence and Survival in
the Nordic Countries, Version 5.3 (25.04.2013). Association of the
Nordic Cancer Registries. Danish Cancer Society. http://www.ancr.nu.
Accessed March 2013
|
|
2
|
Ferlay J, Shin HR, Bray F, Forman D,
Mathers C and Parkin DM: GLOBOCAN 2008 v2.0. Cancer Incidence and
Mortality Worldwide: IARC CancerBase No. 10 [Internet].
International Agency for Research on Cancer; Lyon: 2010, http://globocan.iarc.fr.
Accessed March 2013
|
|
3
|
Hirsch FR, Janne PA, Eberhardt WE, et al:
Epidermal growth factor receptor inhibition in lung cancer: status
2012. J Thorac Oncol. 8:373–384. 2013.PubMed/NCBI
|
|
4
|
D’arcangelo M, Wynes MW and Hirsch FR: The
role of anaplastic lymphoma kinase inhibitors in the treatment of
advanced nonsmall cell lung cancer. Curr Opin Oncol. 25:121–129.
2013.PubMed/NCBI
|
|
5
|
Sasaki T, Rodig SJ, Chirieac LR and Janne
PA: The biology and treatment of EML4-ALK non-small cell lung
cancer. Eur J Cancer. 46:1773–1780. 2010. View Article : Google Scholar : PubMed/NCBI
|
|
6
|
Soda M, Choi YL, Enomoto M, et al:
Identification of the transforming EML4-ALK fusion gene in
non-small-cell lung cancer. Nature. 448:561–566. 2007. View Article : Google Scholar : PubMed/NCBI
|
|
7
|
Mok TS: Personalized medicine in lung
cancer: what we need to know. Nat Rev Clin Oncol. 8:661–668. 2011.
View Article : Google Scholar : PubMed/NCBI
|
|
8
|
Kuang Y, Rogers A, Yeap BY, et al:
Noninvasive detection of EGFR T790M in gefitinib or erlotinib
resistant non-small cell lung cancer. Clin Cancer Res.
15:2630–2636. 2009. View Article : Google Scholar : PubMed/NCBI
|
|
9
|
Stroun M, Maurice P, Vasioukhin V, et al:
The origin and mechanism of circulating DNA. Ann NY Acad Sci.
906:161–168. 2000. View Article : Google Scholar : PubMed/NCBI
|
|
10
|
Catarino R, Coelho A, Araujo A, et al:
Circulating DNA: diagnostic tool and predictive marker for overall
survival of NSCLC patients. PLoS One. 7:e385592012. View Article : Google Scholar : PubMed/NCBI
|
|
11
|
Gautschi O, Bigosch C, Huegli B, et al:
Circulating deoxyribonucleic acid as prognostic marker in
non-small-cell lung cancer patients undergoing chemotherapy. J Clin
Oncol. 22:4157–4164. 2004. View Article : Google Scholar : PubMed/NCBI
|
|
12
|
Nygaard AD, Garm Spindler KL, Pallisgaard
N, Andersen RF and Jakobsen A: Quantification of cell free DNA as a
prognostic factor in advanced NSCLC. J Can Ther. 4:1–7. 2013.
|
|
13
|
Sirera R, Bremnes RM, Cabrera A, et al:
Circulating DNA is a useful prognostic factor in patients with
advanced non-small cell lung cancer. J Thorac Oncol. 6:286–290.
2011. View Article : Google Scholar : PubMed/NCBI
|
|
14
|
Spindler KL, Pallisgaard N, Vogelius I and
Jakobsen A: Quantitative cell-free DNA, KRAS, and
BRAF mutations in plasma from patients with metastatic
colorectal cancer during treatment with cetuximab and irinotecan.
Clin Cancer Res. 18:1177–1185. 2012.
|
|
15
|
van der Drift MA, Hol BE, Klaassen CH, et
al: Circulating DNA is a non-invasive prognostic factor for
survival in non-small cell lung cancer. Lung Cancer. 68:283–287.
2010.PubMed/NCBI
|
|
16
|
Nygaard AD, Garm Spindler KL, Pallisgaard
N, Andersen RF and Jakobsen A: The prognostic value of KRAS mutated
plasma DNA in advanced non-small cell lung cancer. Lung Cancer.
79:312–317. 2013. View Article : Google Scholar : PubMed/NCBI
|
|
17
|
Punnoose EA, Atwal S, Liu W, et al:
Evaluation of circulating tumor cells and circulating tumor DNA in
non-small cell lung cancer: association with clinical endpoints in
a phase II clinical trial of pertuzumab and erlotinib. Clin Cancer
Res. 18:2391–2401. 2012. View Article : Google Scholar : PubMed/NCBI
|
|
18
|
Kumar S, Guleria R, Singh V, Bharti AC,
Mohan A and Das BC: Plasma DNA level in predicting therapeutic
efficacy in advanced nonsmall cell lung cancer. Eur Respir J.
36:885–892. 2010. View Article : Google Scholar : PubMed/NCBI
|
|
19
|
Therasse P, Arbuck SG, Eisenhauer EA, et
al: New guidelines to evaluate the response to treatment in solid
tumors. European Organization for Research and Treatment of Cancer,
National Cancer Institute of the United States, National Cancer
Institute of Canada. J Natl Cancer Inst. 92:205–216. 2000.
View Article : Google Scholar : PubMed/NCBI
|
|
20
|
Steffensen KD, Waldstrom M, Grove A, Lund
B, Pallisgard N and Jakobsen A: Improved classification of
epithelial ovarian cancer: results of 3 danish cohorts. Int J
Gynecol Cancer. 21:1592–1600. 2011. View Article : Google Scholar : PubMed/NCBI
|
|
21
|
Sozzi G, Conte D, Mariani L, et al:
Analysis of circulating tumor DNA in plasma at diagnosis and during
follow-up of lung cancer patients. Cancer Res. 61:4675–4678.
2001.PubMed/NCBI
|
|
22
|
Kumar S, Guleria R, Singh V, Bharti AC,
Mohan A and Das BC: Efficacy of circulating plasma DNA as a
diagnostic tool for advanced non-small cell lung cancer and its
predictive utility for survival and response to chemotherapy. Lung
Cancer. 70:211–217. 2010. View Article : Google Scholar : PubMed/NCBI
|