Introduction
Human epidermal growth factor receptor 2
(HER2), initially identified in a rat glioblastoma model
(1), is a transmembrane receptor
with tyrosine kinase activity. The HER2 gene encodes a
185-kDa receptor tyrosine kinase involved in the regulation of cell
growth, survival and differentiation.
HER2 gene amplification and associated
protein overexpression occur in 10–30% of primary breast cancers
(2–4). HER2 gene amplification by
fluorescence in situ hybridization (FISH) and protein
overexpression by immunohistochemistry (IHC) are associated with
poor prognosis and reduced disease-free survival (5–7). Many
new drugs are in early developmental stages or preclinical trials,
including those directed at the HER2 receptor, as well as
those targeting downstream effectors and signaling pathways
(8).
Trastuzumab-based therapy (9) is indicated for patients with
HER2 overexpression or amplification. The American Society
of Clinical Oncology (ASCO)/College of American Pathologists (CAP)
guidelines for HER2 assays recommend two algorithms for
performing IHC and FISH (9,10). Based on the ASCO/CAP definition,
14.7% of breast carcinomas exhibit HER2 genetic
heterogeneity. Clinical trials using dual-or single-color FISH or
chromogenic in situ hybridization (CISH) for HER2
gene copy number assessment successfully identified patients that
benefited from trastuzumab therapy. However, systems assessing the
HER2/CEP17 ratio may provide a more accurate evaluation of
HER2 amplification than single probe systems (11). These claims are based on the fact
that 8% of breast cancers show increased copy numbers of CEP17 by
FISH (i.e., average CEP17 >3.0/nucleus), which represent
chromosome 17 polysomy (9,12,13).
Abnormalities of chromosome 17 are important
molecular genetic events in breast cancer (14). Several important oncogenes (15), including HER2, TOP2A
and TAU, tumor-suppressive genes p53, BRCA1 and
HIC-1, as well as DNA double-strand break repair and
recombination gene RDM1, play an essential role in the
development and progression of breast cancer. CEP17 polysomy is a
major aberration, which is frequently identified in 20–40% of
invasive breast carcinomas (16). A
high HER2 gene copy number associated with polysomy 17 is a
contributing factor in HER2 protein overexpression (17,18).
Findings of recent studies (19)
have also shown that chromosome 17 polysomy is associated with
HER2 gene expression, prognosis and sensitivity to
chemotherapy in patients with breast cancer. However, in previous
studies, no effect of polysomy 17 on HER2 protein expression
was identified (16). Instead, it
only affected a small group of cases (20,21).
Additionally, the FISH algorithm may not identify positive IHC
cases, if polysomy 17 affected the IHC score (9). As a result, the accurate assessment of
HER2 status and chromosome 17 polysomy is of great
importance in screening patients for trastuzumab therapy (22,23).
In the HER2 gene analysis and chromosome 17
amplification, FISH was performed using 4-μm paraffin sections
(12,23–25).
FISH conducted with thin tissue sections leads to the
underestimation of the true chromosome copy number in various types
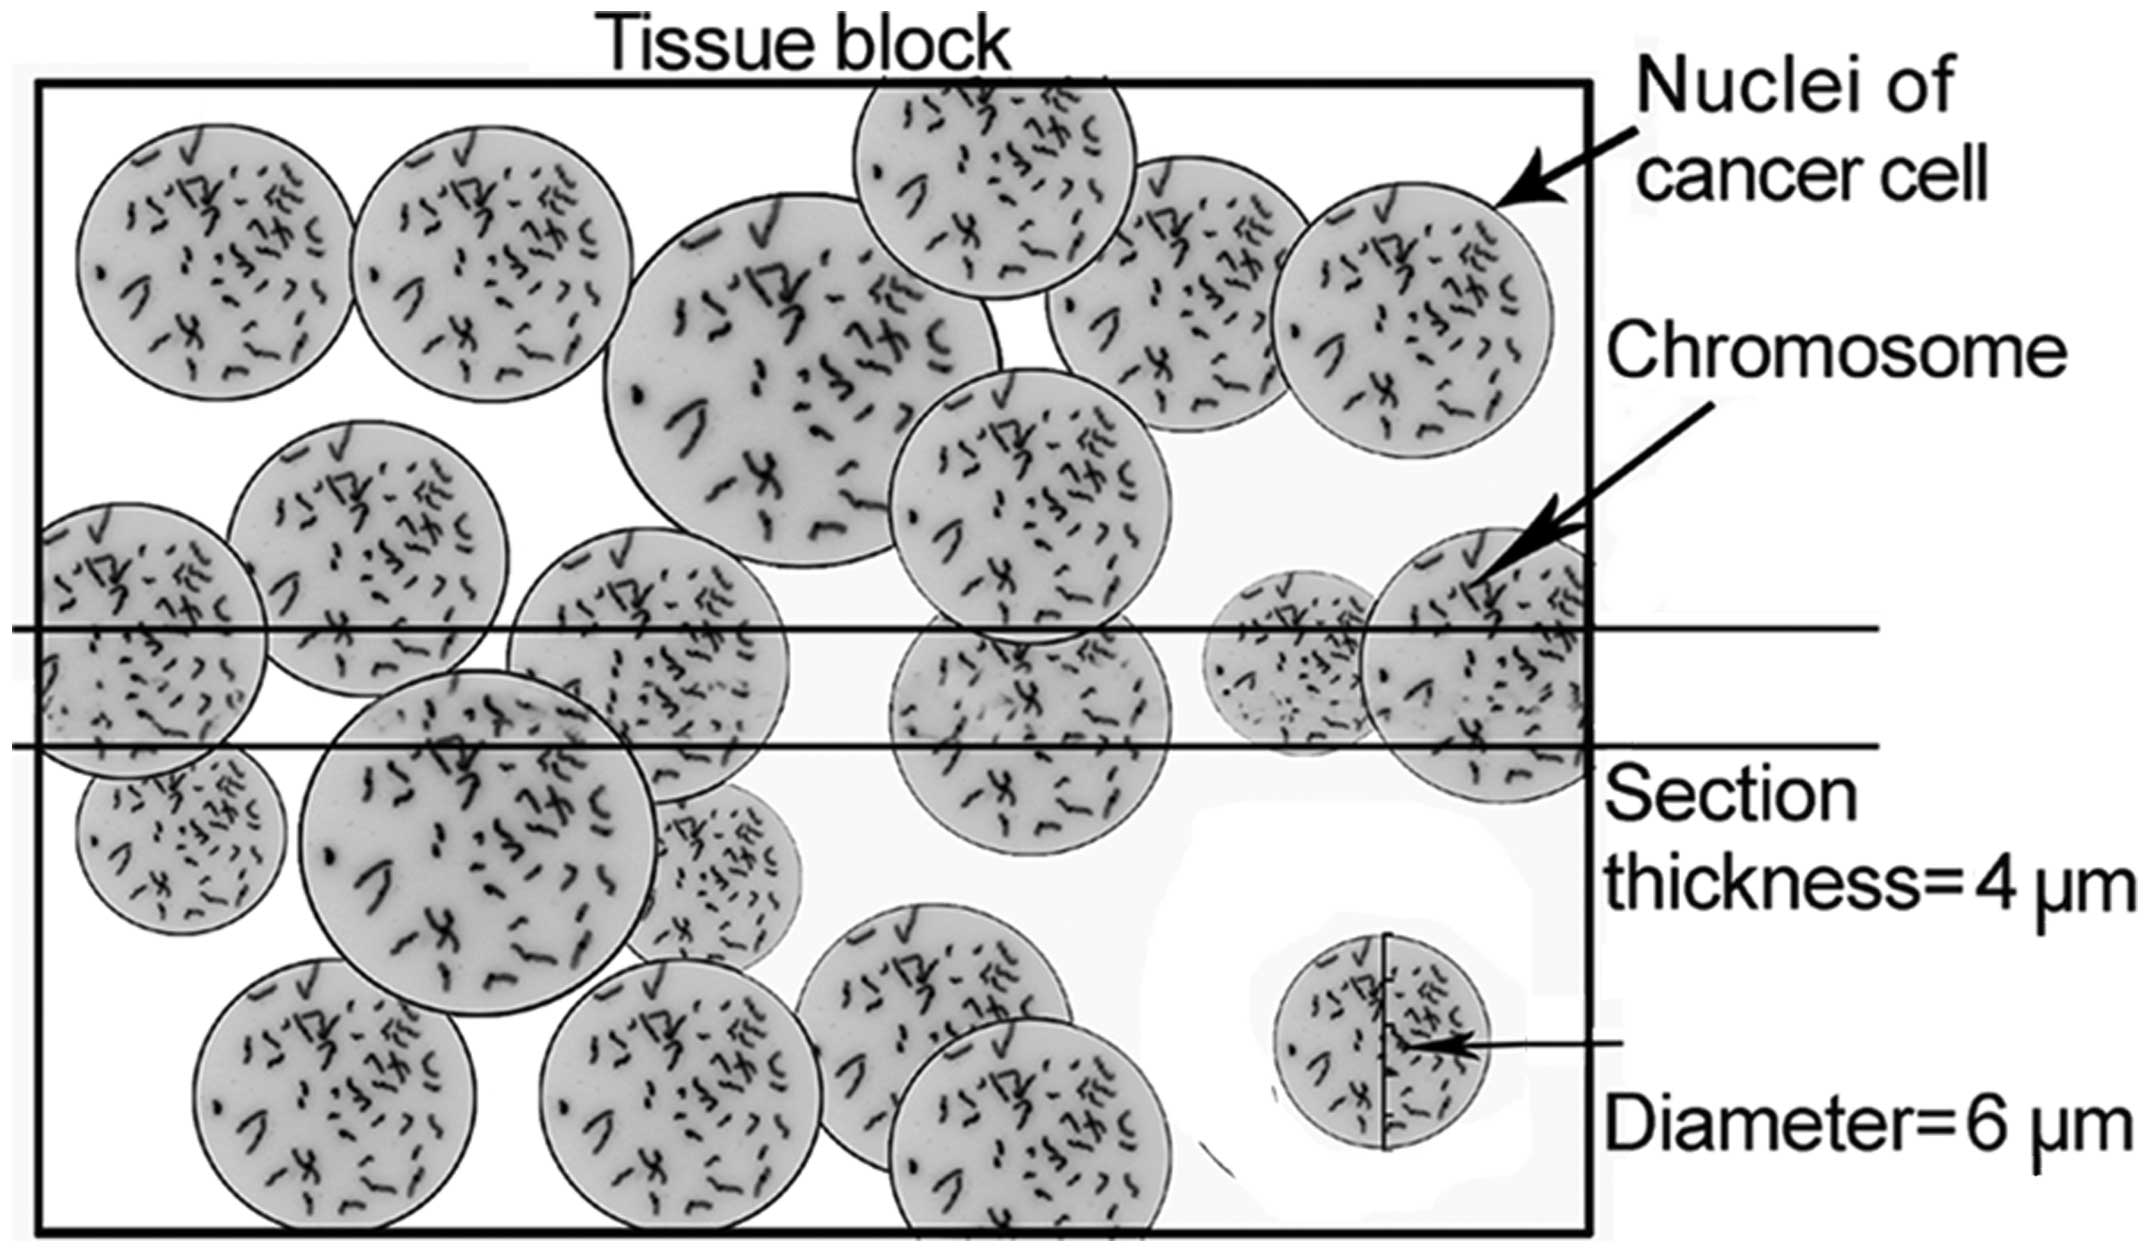
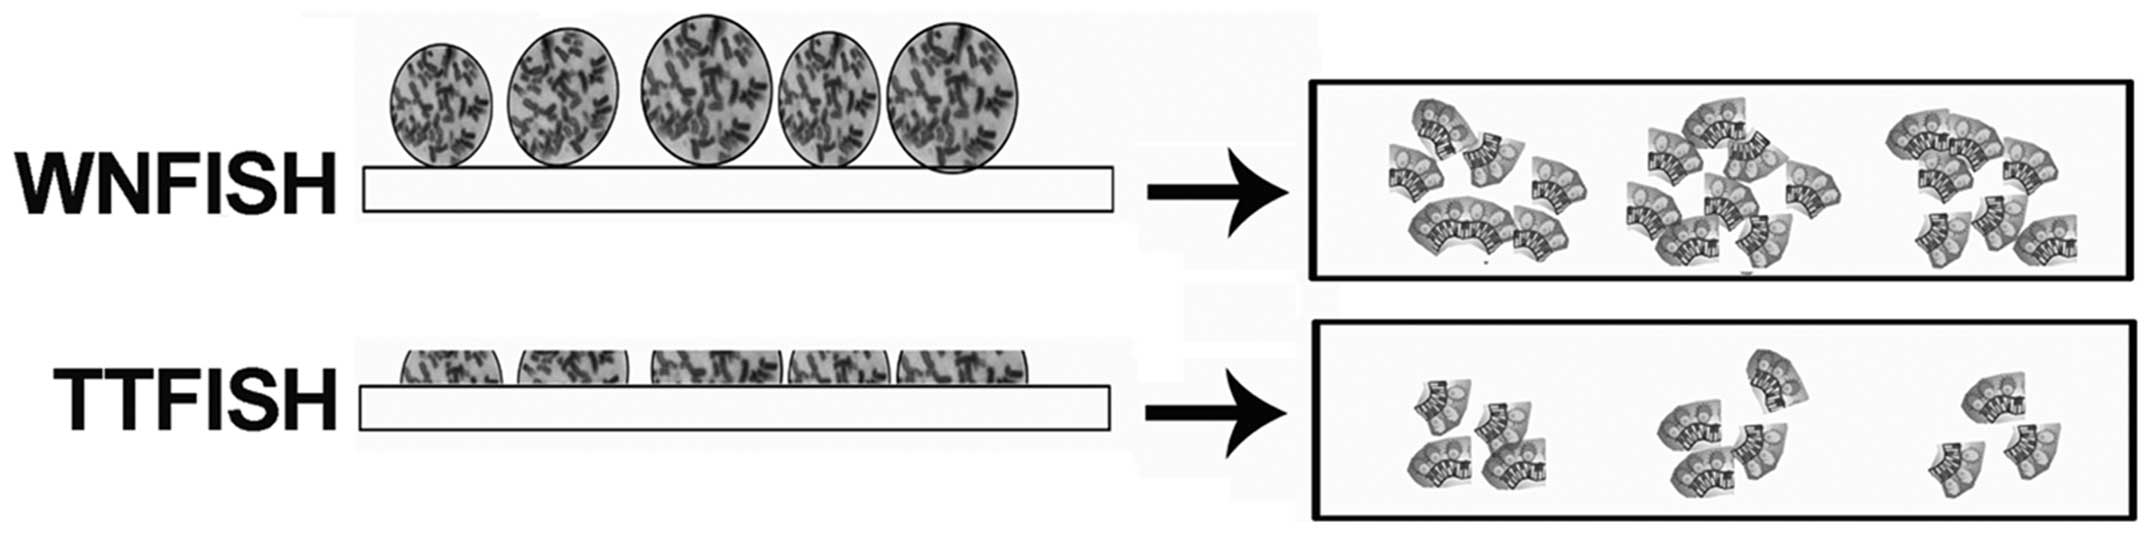
of cancer (26). In this study it
was hypothesized that the 4-μm sections caused DNA loss resulting
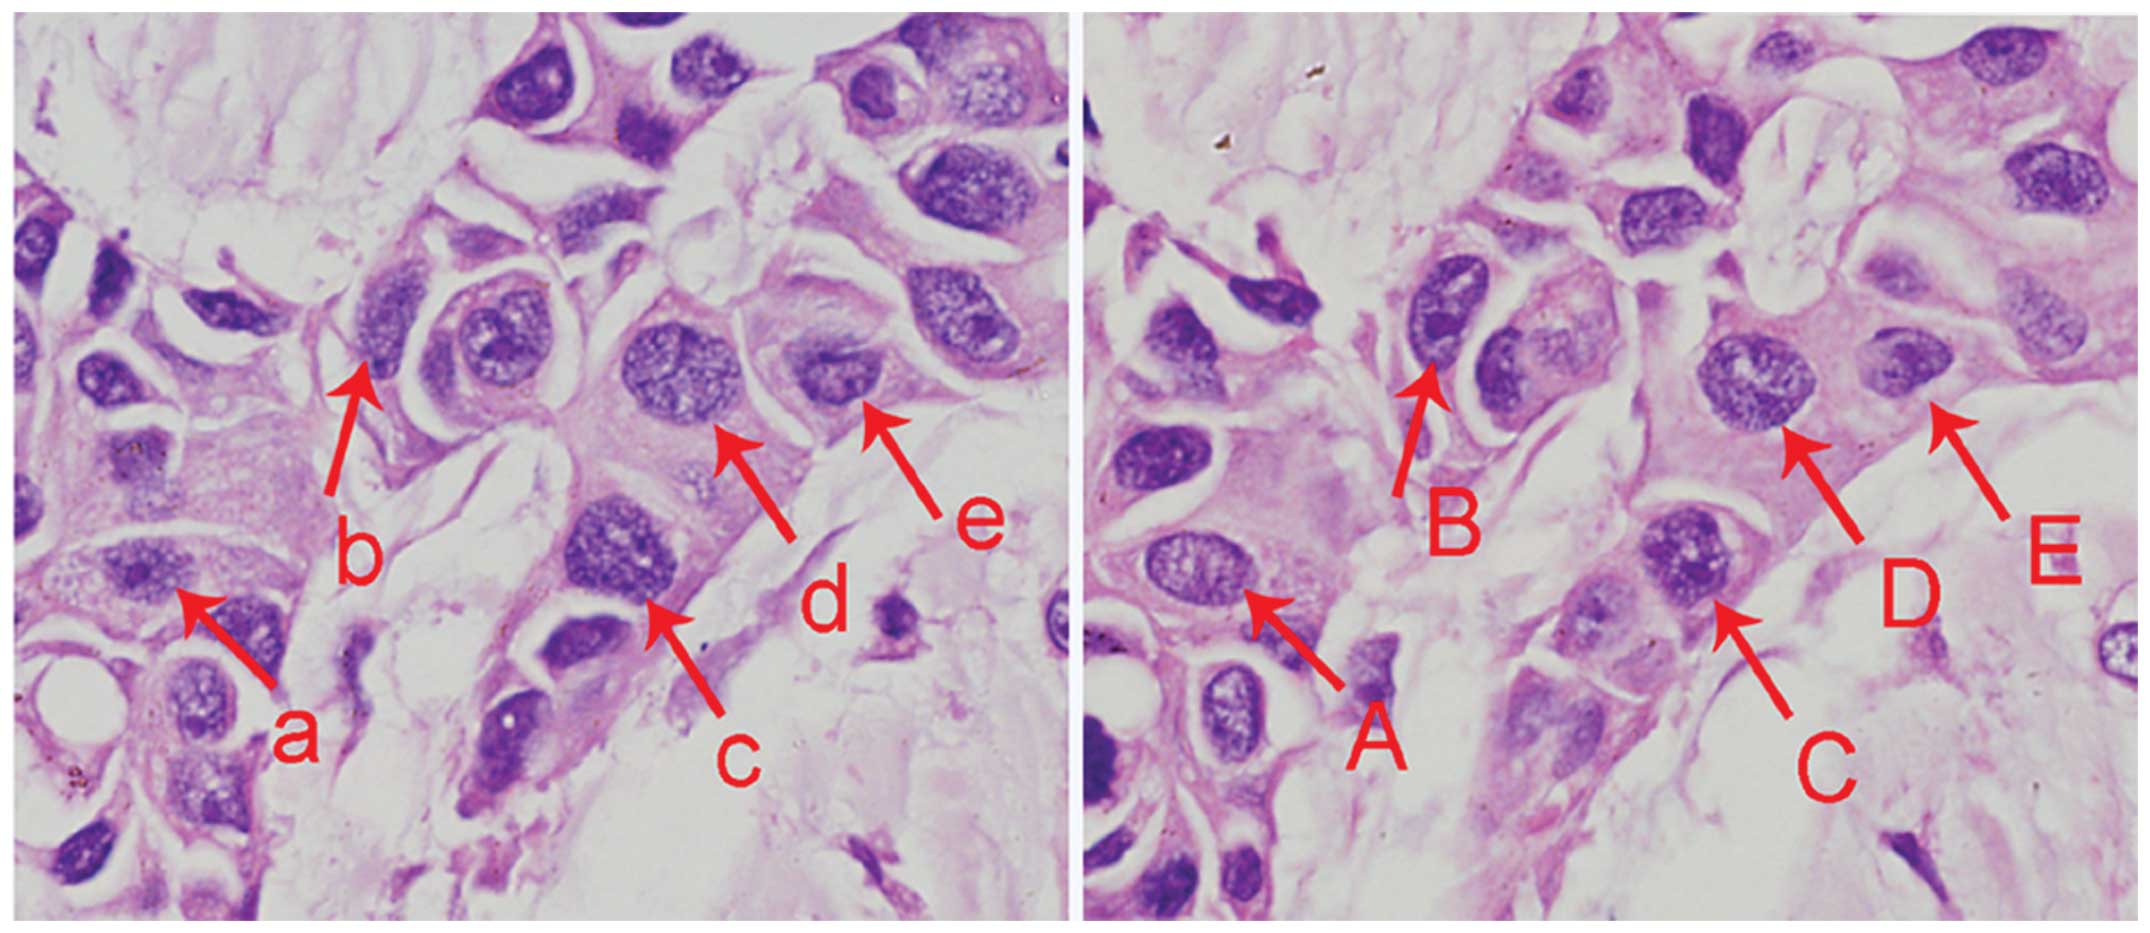
in detection bias (Fig. 1). In the
4-μm serial breast cancer paraffin sections, the same nuclei were
sectioned twice and appeared in two adjacent sections (Fig. 2). The disruption of nuclear
integrity may lead to an inaccurate estimate of gene copy numbers
with thin tissue sections. Therefore, in the present study FISH
with intact nuclei was performed to test the detection bias using
thin tissue sections. In total, 109 cases of invasive breast cancer
were examined for the correlation between HER2 gene
amplification, CEP17 polysomy and HER2/CEP17 ratio.
Materials and methods
Case selection
In total, 109 patients (aged 33–83 years; median
age, 49.5 years) diagnosed with invasive ductal carcinoma of breast
at the General Hospital of Shenyang Military Area Command
(Shenyang, China) between 2010 and 2011, were selected for a
retrospective study. HER2 gene status was evaluated in the
109 formalin-fixed paraffin-embedded (FFPE) tissues by thin tissue
section FISH (TTFISH) and whole nuclei FISH (WNFISH) with the
nuclei extracted from the FFPE tissue blocks.
The present study was approved by the Ethics
Committee of Shenyang General Hospital.
Extraction of whole nuclei
A stained section of each tumor sample was prepared
from blocks to confirm the diagnosis. Representative tumor areas
were then selected for extraction of the nuclei. Four tissue sample
cores were collected from each specimen using a blunt core needle
of 0.6 mm diameter. The needle was part of a Manual Arrayer
(Beecher Instruments, Silver Spring, MD, USA) that was pushed
through the entire paraffin tissue block. The collected tissue core
was then forced into a 1.5-ml polypropylene microcentrifuge
tube.
Xylene (1.0 ml) was added to the tube twice, each
time for 20 min under light vibration, followed by the addition of
1.0 ml of dehydrated ethanol twice, each time for 3 min under light
vibration. One milliliter each of 80, 70 and 50%, respectively,
ethanol was added into the tube, for 3 min under light vibration.
The ethanol was discarded and the tube was dried at 45°C for 10 min
for the remaining ethanol to evaporate. Enzymatic digestion was
then performed using 300 μl of freshly prepared proteinase K
solution [0.01% proteinase K, 30 m Anson-U/mg, in 0.05 mol/l
Tris-hydroxymethyl aminomethane hydrochloride (pH 7.0), 0.01 mol/l
ethylenediaminetetraacetic acid disodium salt, and 0.01 mol/l
sodium chloride] to the microcentrifuge tube. The specimen was then
incubated at 37°C for 2 h. The sample was vortexed for 3 sec at
20-min intervals during incubation to facilitate enzymatic
digestion.
The mixture was vibrated and centrifuged at 1,000
rpm for 5 sec to deposit the tissue mass. The nuclear suspension
was extracted using a pipette. The nuclei were washed by
resuspension in 100 μl of phosphate-buffered saline (PBS) and
vortexed. The PBS solution was removed and the nuclei were fixed by
resuspension twice in freshly prepared fixative (3 parts methanol +
1 part glacial acetic acid) and vortexed. The fixative was removed
and the nuclei were resuspended in 100 μl of distilled water. Cell
density was calculated on a cell-calculating plate and adjusted to
1×10⁴/μl using distilled water.
The pretreated nuclear suspension
(1×10⁴/μl) was pipetted onto poly-L-lysine-coated
slides. The slides with cells were heated at 65°C for 1 h and the
nuclei were ready for subsequent experiments after air drying.
WNFISH
WNFISH analysis was evaluated using a commercially
available FDA-approved PathVysion HER2/neu DNA Probe kit
(Abbott-Vysis, Downers Grove, IL, USA). The hybridization mixture
included a centromere 17-specific spectrum with green-labeled DNA
probe and HER2/neu-specific spectrum with an
orange-labeled DNA probe.
The whole nuclei slides were dried in a 65°C oven
for 1 h, fixed with methanol-glacial acetic acid (3:1) for 1 h.
After air drying, the slides were placed in citrate buffer (pH 6.0)
and incubated for 10 min in a microwave oven, transferred to
freshly prepared 0.4% pepsin solution (0.16 g pepsin; 2,850 U/mg
solid; in 40 ml of 0.9% sodium chloride, pH 1.5) and dehydrated
through a series of graded ethanol. After dehydration, 10 μl
HER2/CEN-17 probe mix was applied to the tissue and covered
with a coverslip. The sections were placed in a HYBrite instrument,
denatured at 82°C for 10 min, and hybridized at 45°C for 16 h.
After hybridization the slides were washed in stringent wash buffer
briefly at room temperature, and then in a 65°C hot solution for 10
min. The slides were dehydrated, air-dried and counterstained with
diamidinophenylindole.
The samples were analyzed under a ×100 oil immersion
objective using an Olympus BX-61 fluorescence microscope (Olympus,
Japan) with appropriate filters.
Thin tissue section FISH (TTFISH)
A 4-μm section of each tumor sample was prepared
from blocks for thin-tissue FISH analysis. FISH was performed using
the same HER2 FISH kit as for WNFISH. The section was
treated by the Paraffin Pretreatment Reagent I (Gene Tech Company
02J02-032), according to the manufacturer’s instructions. Following
deparaffinization and rehydration, the slides were pretreated in
hot (95°C) 2-(N-morpholino)ethanesulfonic acid (MES) buffer for 10
min followed by a cooling step and pepsin digestion at room
temperature for 10 min. After dehydration, the section was
subjected to similar treatment as in WNFISH. Breast cancer samples
with known HER2 gene amplification served as positive
controls.
Evaluation of HER2 gene amplification and
chromosome 17 polysomy FISH signals were assessed by two
independent assessors examining 30 non-overlapping nuclei for each
tissue. The number of chromosome 17 signals and HER2 signals
was recorded in each case. The mean number of HER2 signals,
CEP17 signals and the HER2/CEP17 ratio was calculated.
HER2 gene amplification status was classified according to
the ASCO/CAP criteria (9). The
results were graded based on the HER2/CEP17 ratios, as
follows: negative HER2 gene amplification was defined as a
HER2/CEP17 ratio of <1.8. Equivocal HER2 gene
amplification was defined as a HER2/CEP17 ratio between 1.8
and 2.2. Positive-HER2 gene amplification was defined as a
HER2/CEP17 ratio of >2.2.
Cases with an average chromosome 17 (CEP17) ≥2.6
(27) per nucleus were considered
polysomy.
Statistical analysis
The Student’s t-test was used to compare the means
of two variables for nominal data, which were shown as means ± SD.
McNemar and McNemar-Bowker tests were used to compare categorical
variables. All reported P-values were two-tailed. P<0.05 was
considered to indicate a statistically significant result.
Concordant data were determined from both TTFISH and
WNFISH. The κ statistic and associated 95% confidence intervals
were used to measure the agreement among the two assays of the
HER2/CEP17 ratio and CEP17 polysomy. The agreement was
quantified with the κ (κ) statistic, which evaluates inter-examiner
reliability by eliminating agreement by chance. The κ coefficient
>0.80 indicated almost perfect agreement, values of 0.61–0.80
suggested substantial agreement, 0.41–0.60 moderate agreement,
0.21–0.40 fair agreement, >0–0.20 slight agreement, and values
of 0 suggested no agreement or a random association (28).
Correlations between the TTFISH and WNFISH CEP17
copy number, HER2 copy number and HER2 ratios were
assessed by the Excel X, Y plot to demonstrate the linear
relationship between the two methods and to calculate the
correlation coefficient (r).
Results
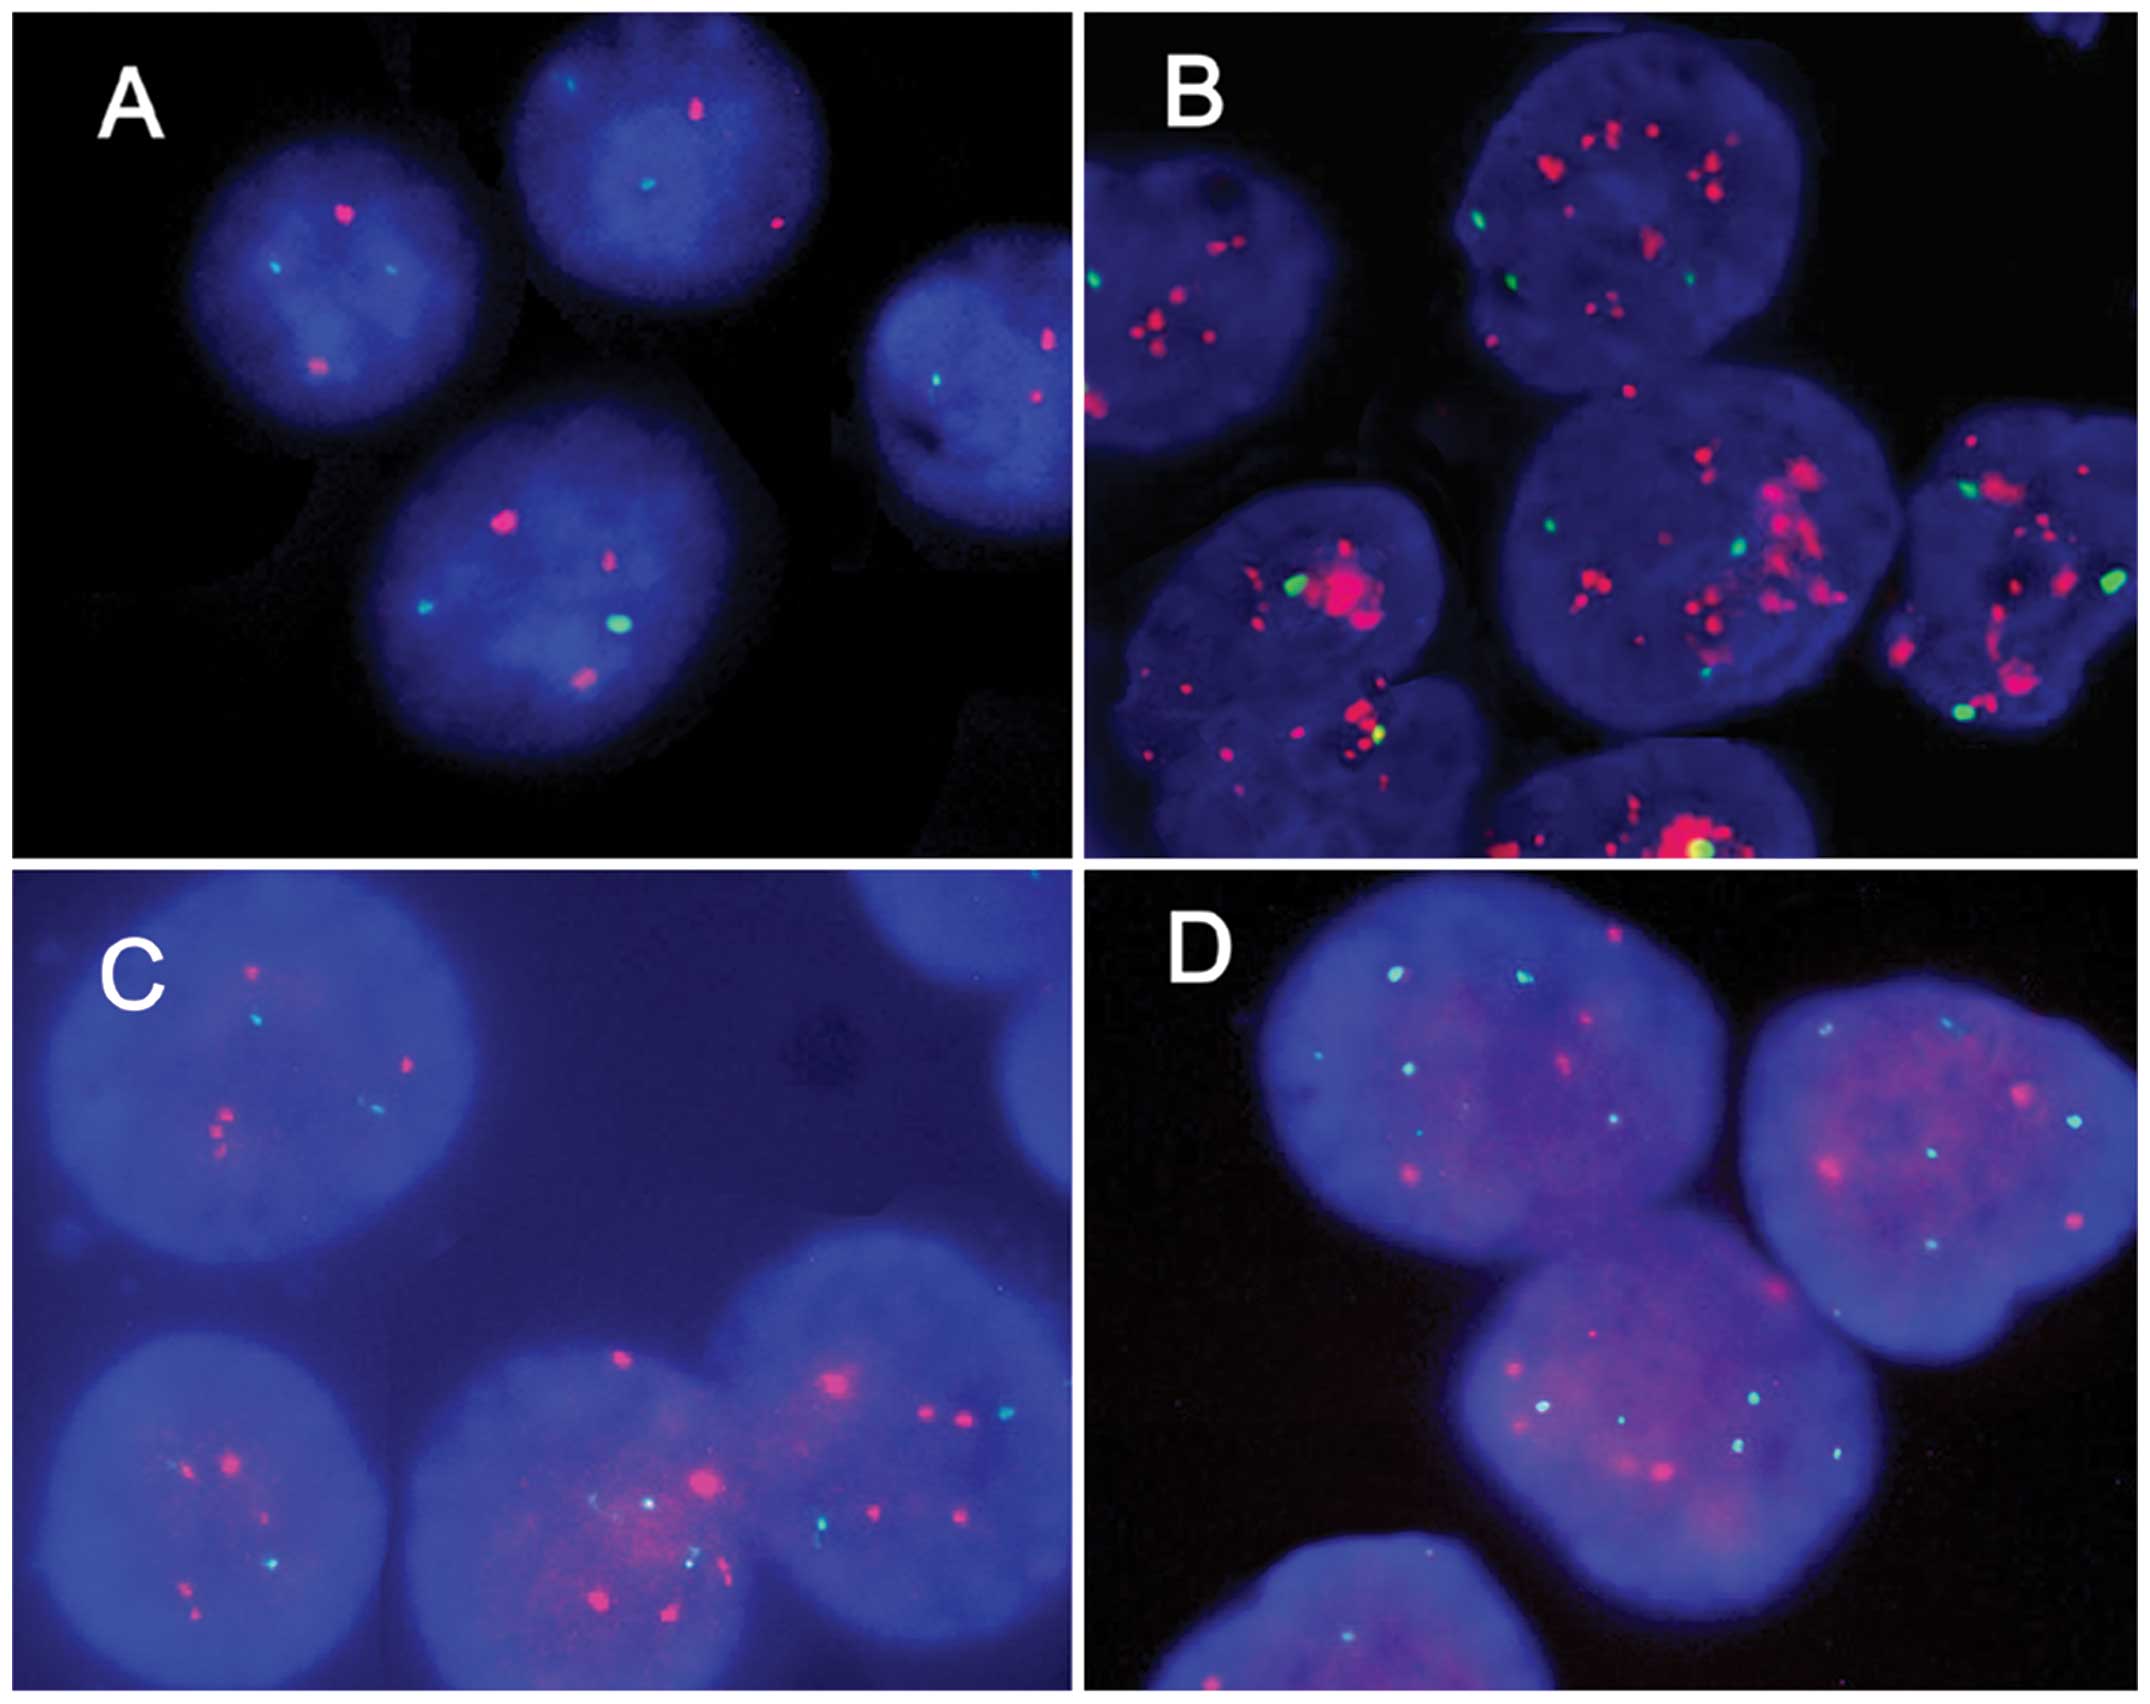
The CEP17 and HER2 gene copies, evaluated by
TTFISH and WNFISH, were available for all 109 samples. Signals for
HER2 and chromosome 17 centromeres were clearly detected
using the TTFISH and WNFISH methods. Separate signals were counted
without difficulty for amplified, equivocal and non-amplified
HER2 samples. Representative micrographs of the HER2
non-amplified, HER2 amplified, CEP17 non-polysomy and CEP17
polysomy are shown in Fig. 3.
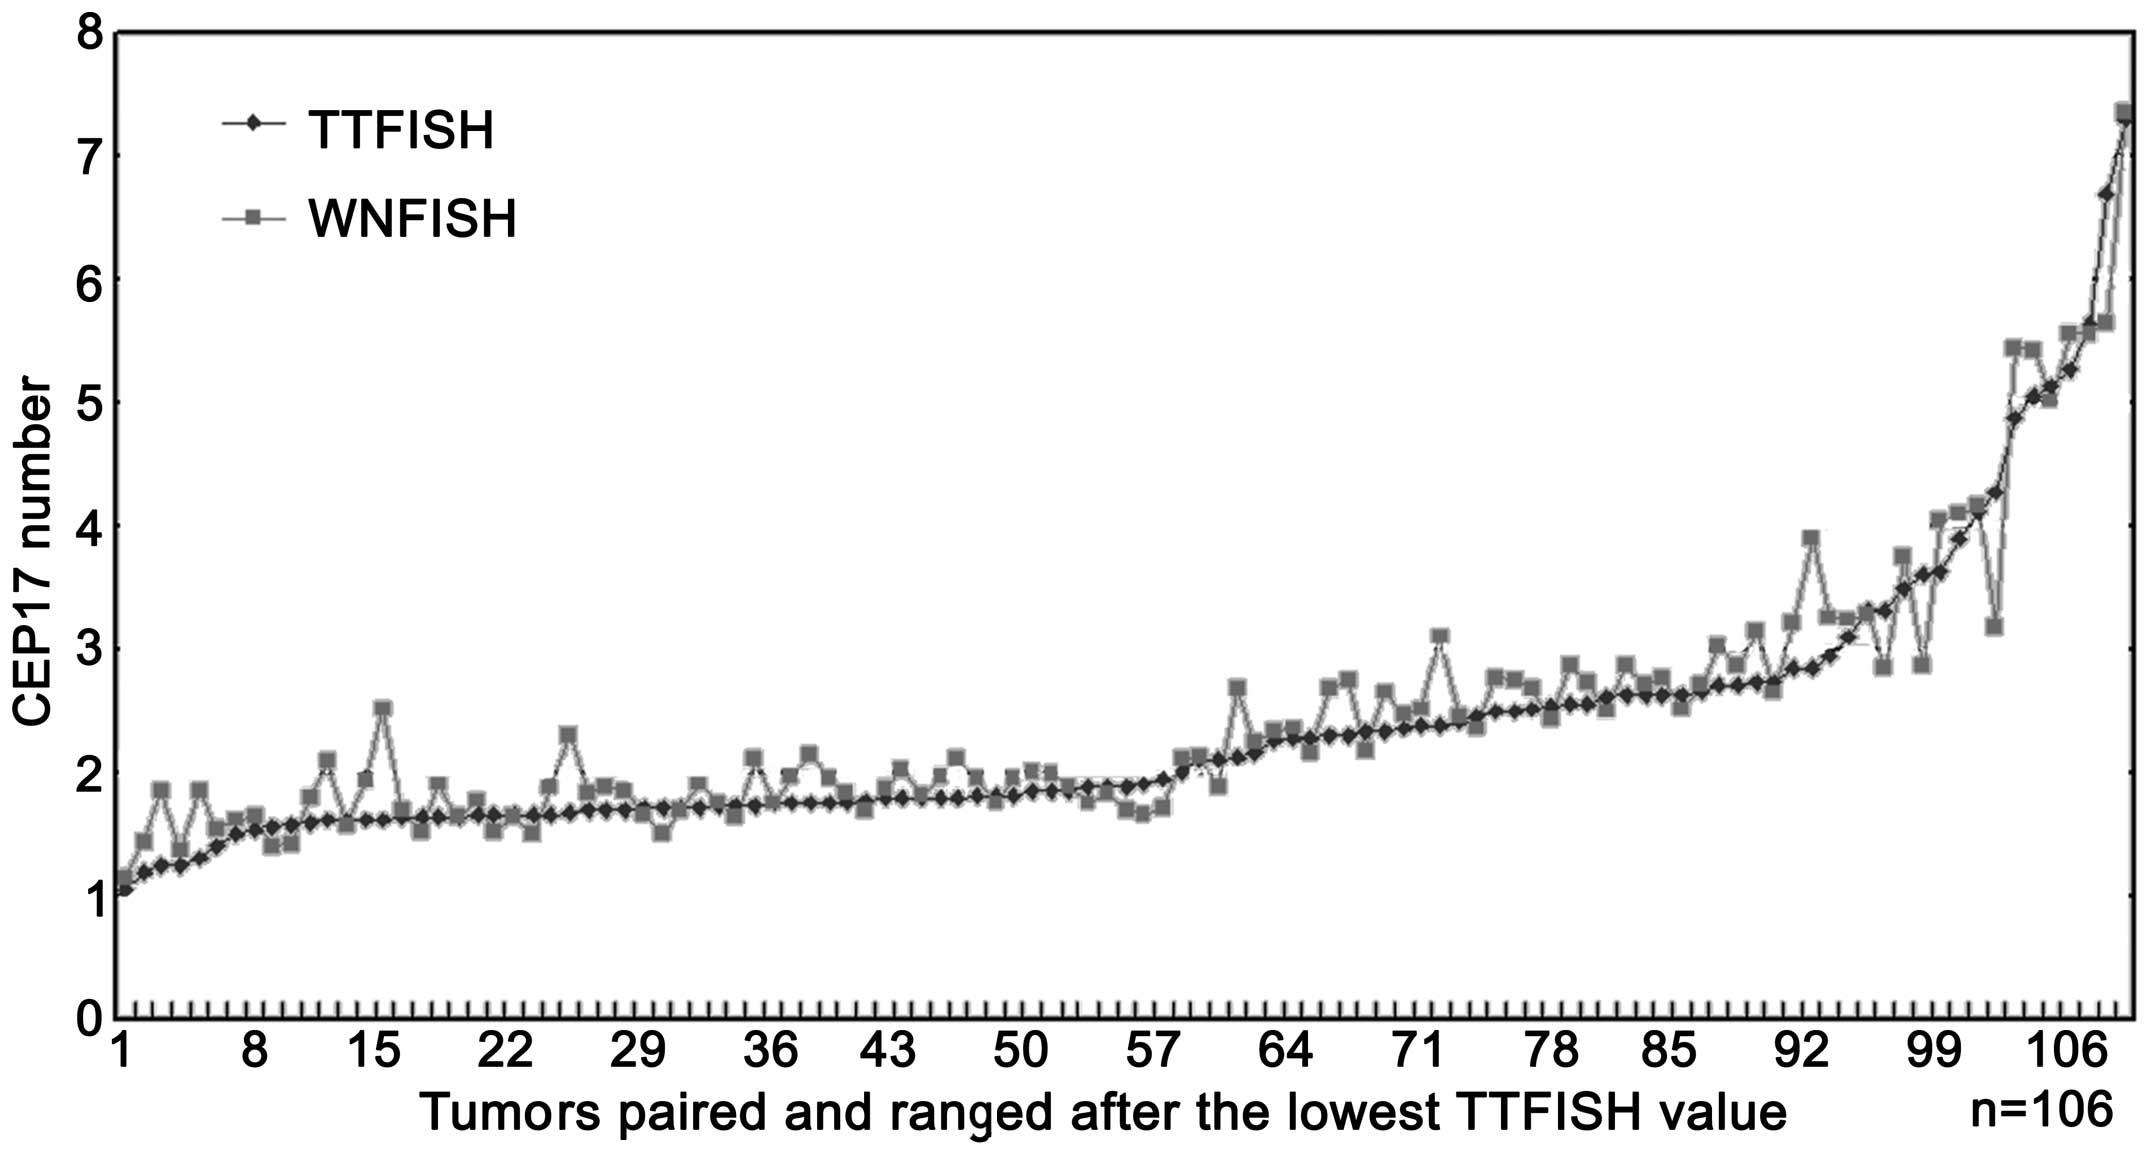
The HER2 numbers, CEP17 copy numbers as well
as HER2 ratios analyzed using the two methods are shown in
Figs. 4–6.
The mean copy number of Her2 and CEP17 number
detected by the two methods was 5.267±4.084 vs. 5.497±3.996 and
2.361±1.100 vs. 2.467±1.075. A significant difference was observed
between the two methods in the detection of HER2 and CEP17
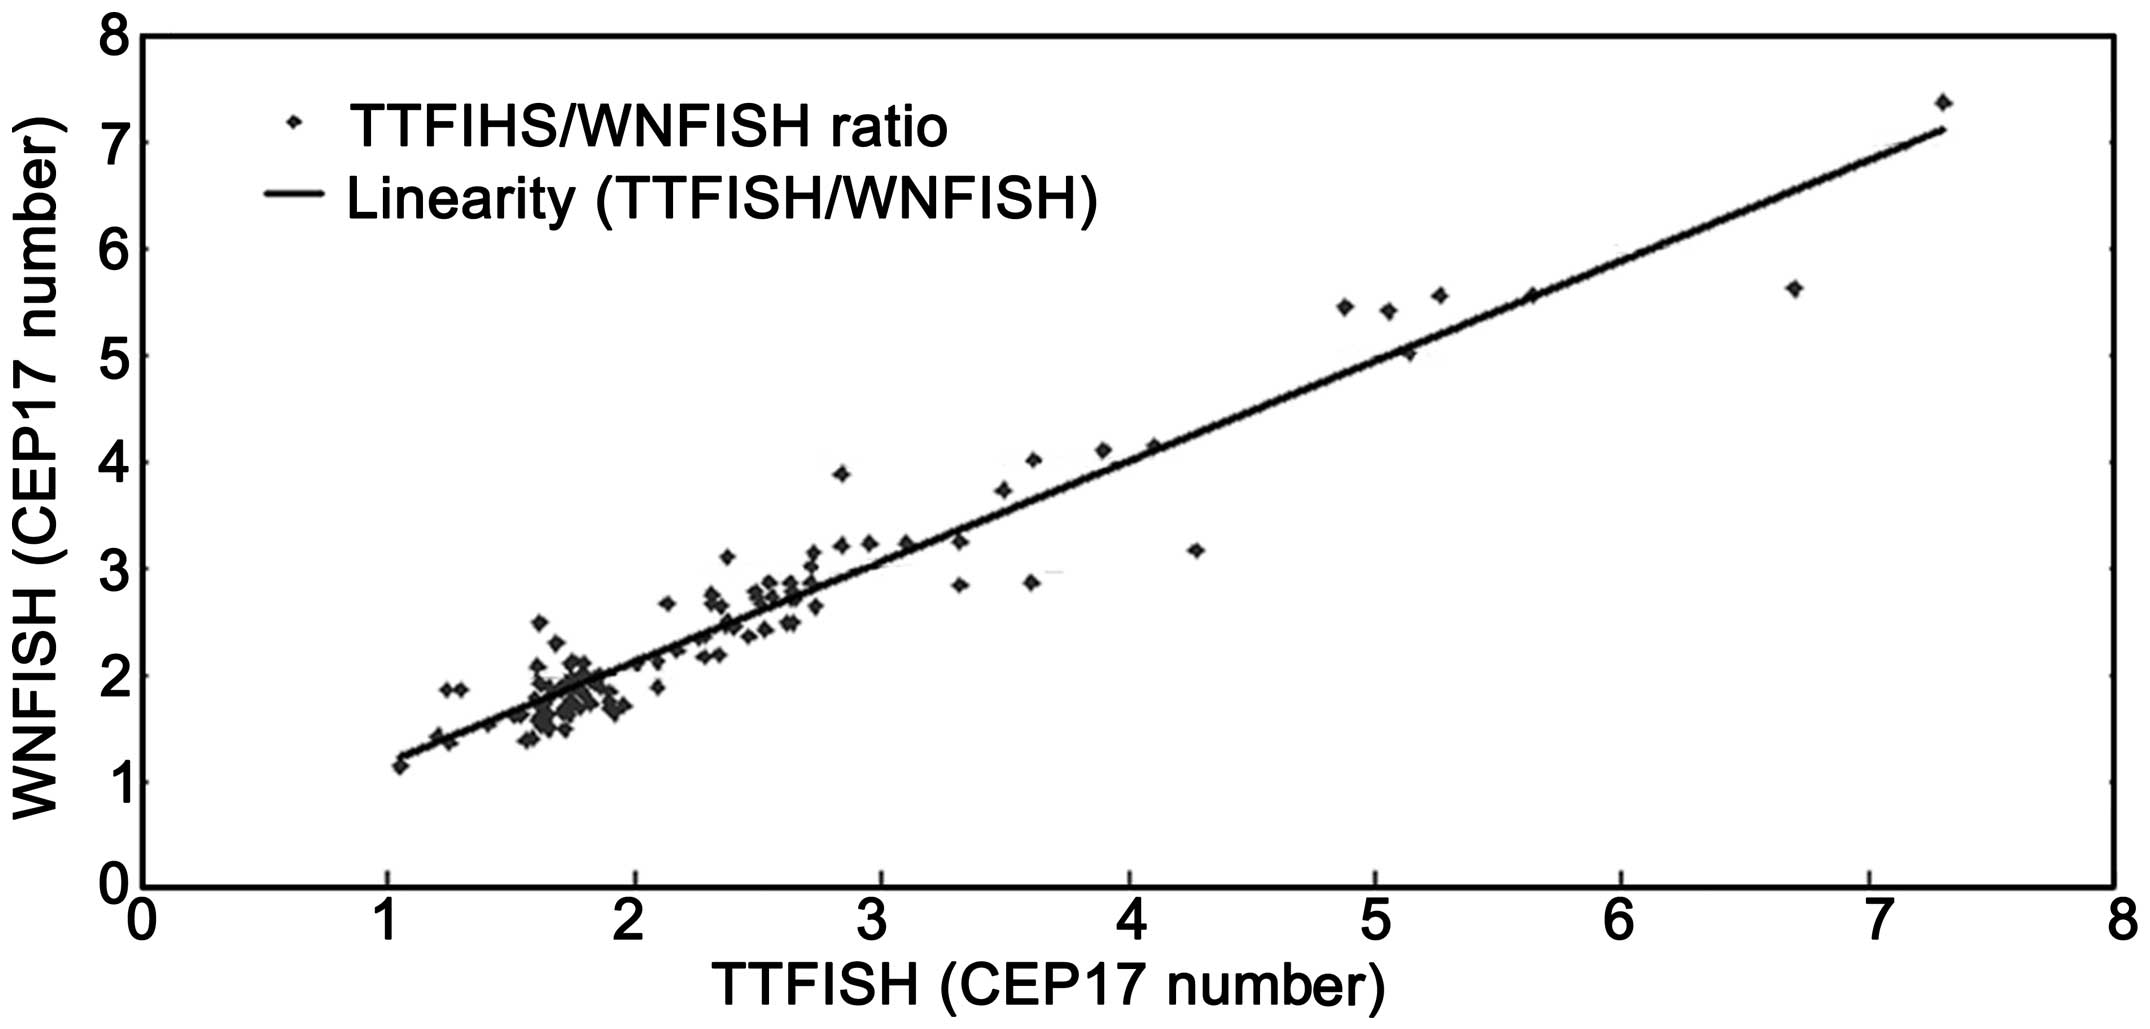
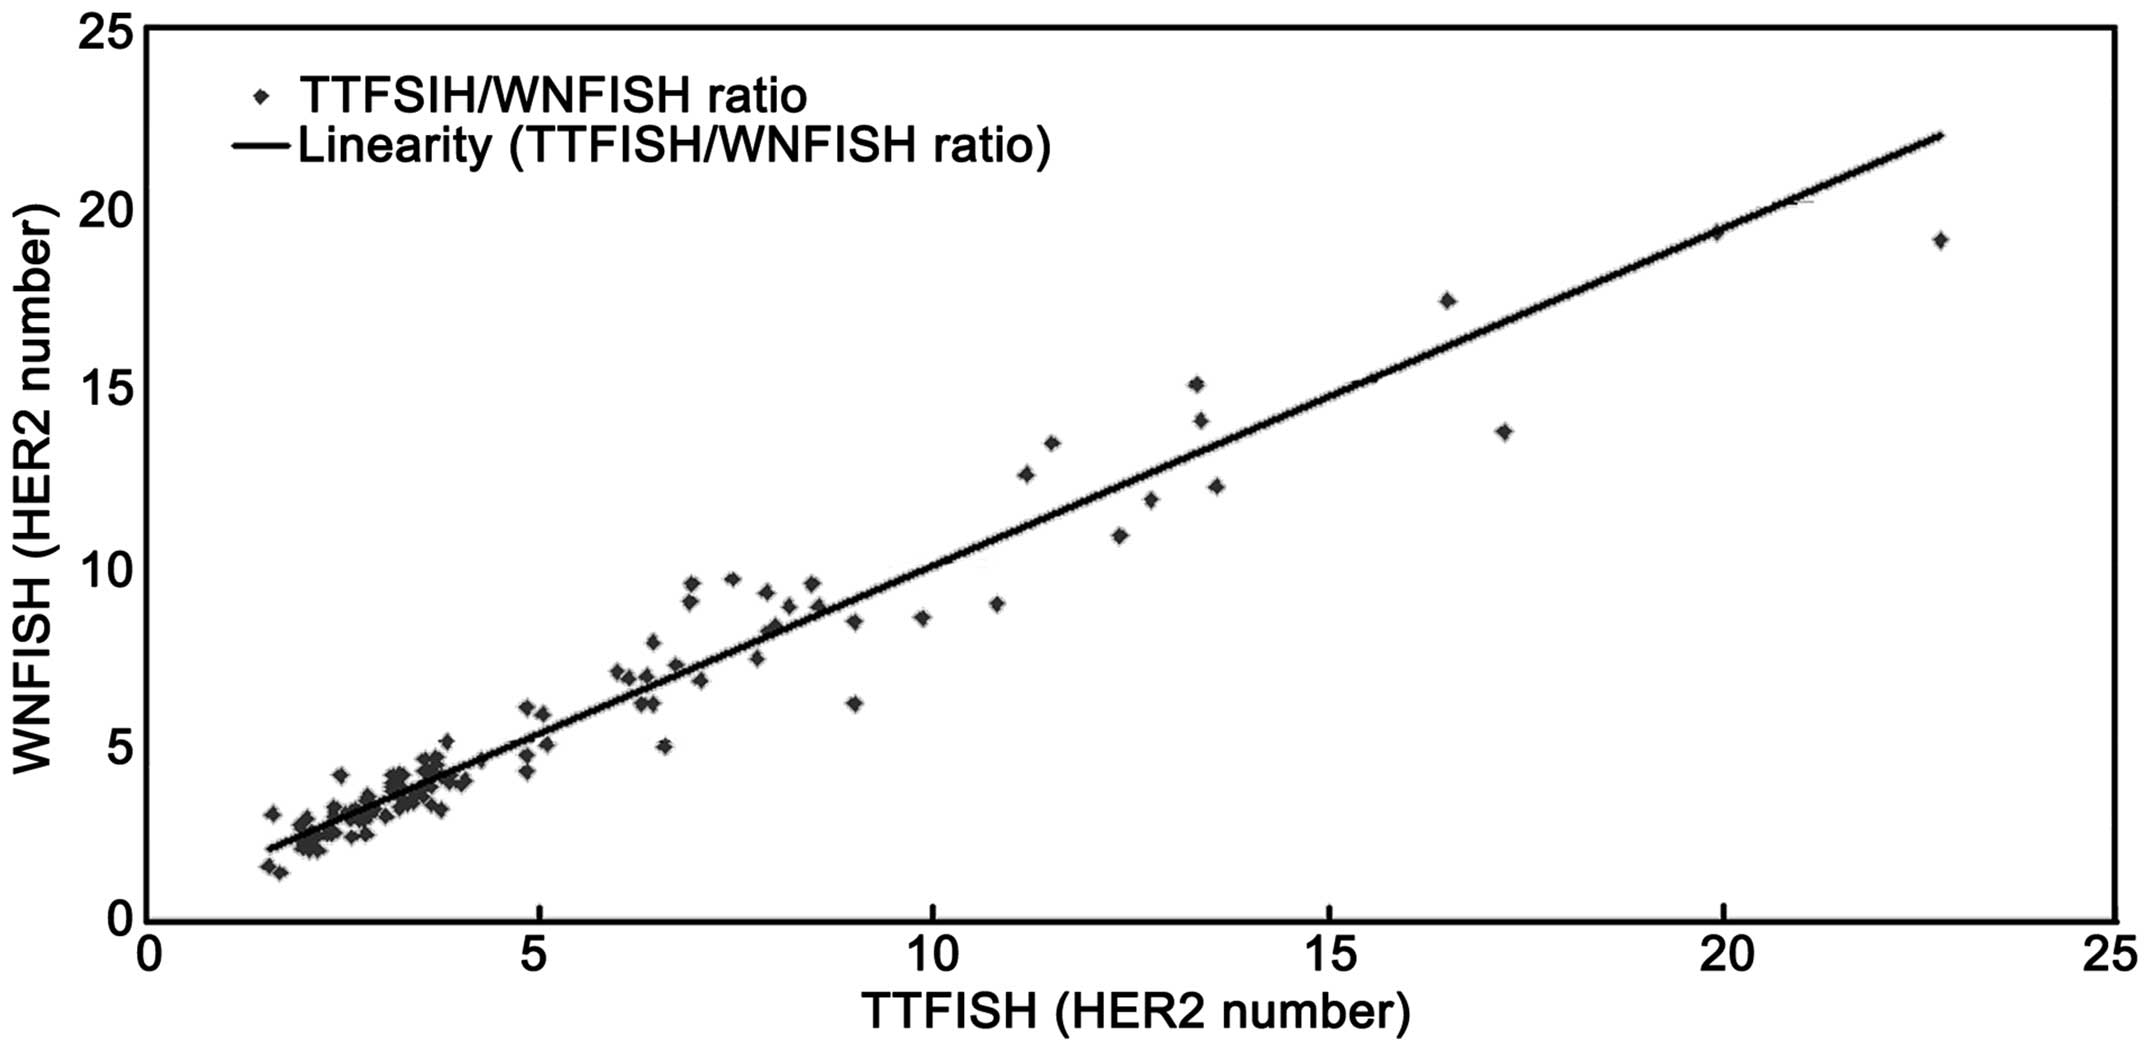
copy numbers (P=0.040 and <0.001) (Table I). The two methods showed a perfect
correlation in detecting HER2 and CEP17 copy numbers
(Figs. 7 and 8) with a correlation coefficient of
(r)=0.920 and 0.924. The 95% confidence intervals were 0.886–0.992
and 0.888–0.991, respectively.
 | Table ICorrelation of HER2 and CEP17
copy numbers and HER2 ratio between TTFISH and WNFISH. |
Table I
Correlation of HER2 and CEP17
copy numbers and HER2 ratio between TTFISH and WNFISH.
| Variables | TTFISH | WNFISH | T-value | P-value | 95% CI |
|---|
| HER2 copy
number | 5.267±4.084 | 5.497±3.996 | −2.072 | 0.040 | −0.450–0.010 |
| CEP17 copy
number | 2.361±1.100 | 2.467±1.075 | −3.628 | <0.001 | −0.163–0.048 |
| HER2
ratio | 2.144±1.140 | 2.153±1.066 | −0.335 | 0.738 | −0.060–0.042 |
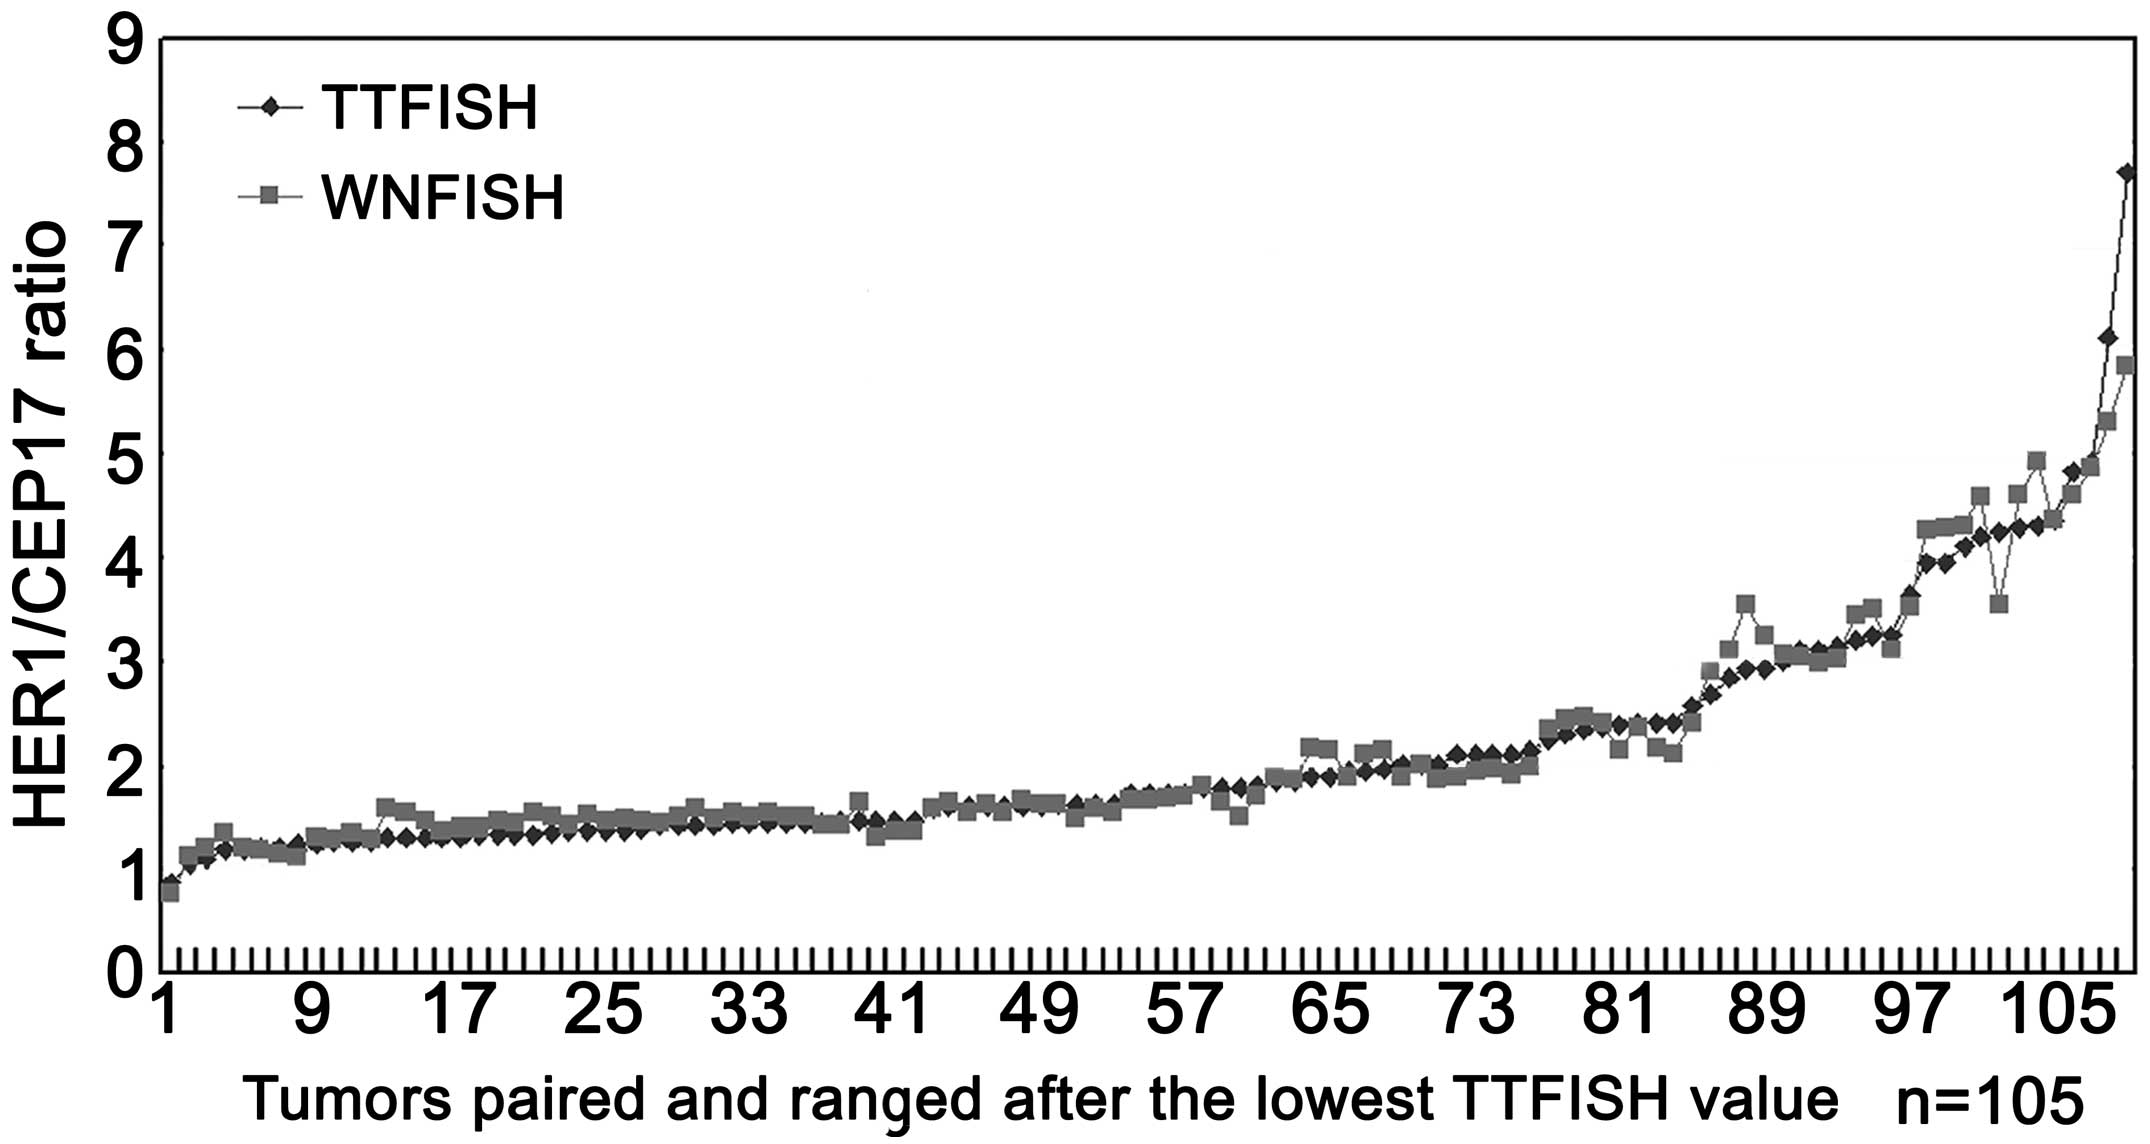
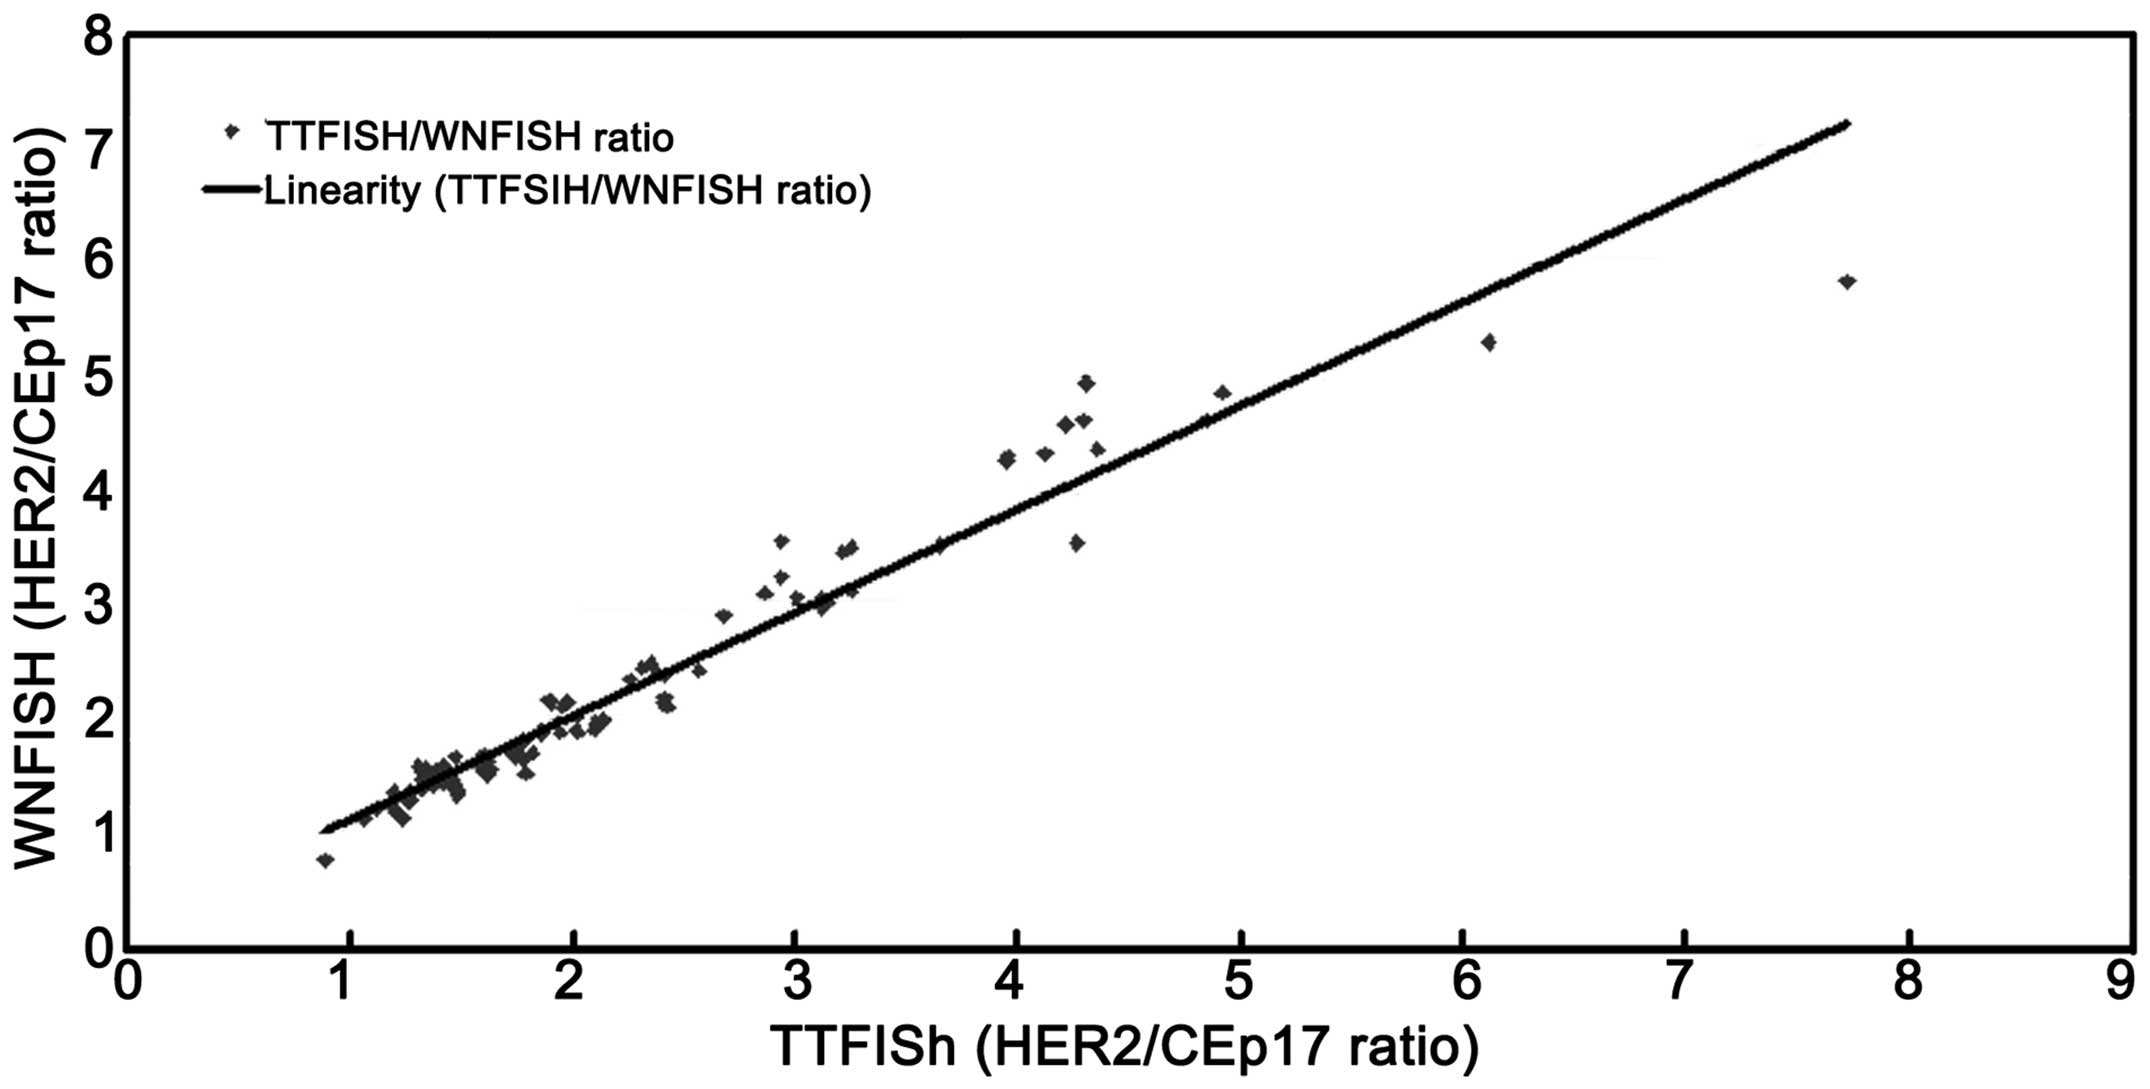
The correlation between the HER2/CEP17 ratios
obtained by the TTFISH and WNFISH methods was excellent (Fig. 9), with a correlation coefficient
(r)=0.946 (95% confidence interval, 0.868–0.951). No significant
difference was observed between the two methods (P=0.738) (Table I).
Of the 109 cases, the WNFISH method revealed
HER2 amplification (HER2 ratio >2.2) in 30 cases,
equivocal (ratios from 1.8 to 2.2) in 19 cases and non-amplified
HER2 (ratios <1.8) in 60 cases. TTFISH method revealed
HER2 amplification in 33 cases, equivocal in 16 cases and
non-amplified HER2 in 60 cases. No significant difference
occurred between the two methods (McNemar-Bowker test, P=0.223).
The agreement between WNFISH and TTFISH was almost perfect: 95.41%
(104/109), κ coefficient=0.922 (Table
II). The WNFISH method detected CEP17 polysomy (CEP17 number
>2.6) in 37 cases and non-polysomy (CEP17 number <2.6) in 72
cases. TTFISH method detected CEP17 polysomy in 29 cases and
non-polysomy in 80 cases. A significant difference was observed
between the two methods using the McNemar test (P=0.039). A
substantial agreement existed between WNFISH and TTFISH: 89.0%
(97/109) κ coefficient=0.741 (Table
III).
| Table IIHER2 amplification, TTFISH vs.
WNFISH. |
Table II
HER2 amplification, TTFISH vs.
WNFISH.
| WNFISH |
|---|
|
|
|---|
| TTFISH |
Non-amplifieda | Equivocalb | Amplifiedc | Total |
|---|
|
Non-amplifieda | 59 | 1 | 0 | 60 |
| Equivocalb | 1 | 15 | 0 | 16 |
| Amplifiedc | 0 | 3 | 30 | 33 |
| Total | 60 | 19 | 30 | 109 |
| Table IIIChromosome 17 polysomy, TTFISH vs.
WNFISH. |
Table III
Chromosome 17 polysomy, TTFISH vs.
WNFISH.
| TTFISH | WNFISH |
|---|
|
|---|
|
Non-polysomya | Polysomyb | Total |
|---|
|
Non-polysomya | 70 | 10 | 80 |
| Polysomyb | 2 | 27 | 29 |
| Total | 72 | 37 | 109 |
Discussion
TTFISH is routinely used to detect gene status in
paraffin-embedded breast cancer tissues. The average thickness of
deparaffinized formalin fixed tissues was 4 μm, with <6 μm being
the average diameter of a cell nucleus. Since only a portion of a
given nucleus was observed in the sampling section, Tse et
al (27) used a second
chromosome 17 gene such as CEP17 to correct for possible
truncation. The use of a reference gene abrogated the effect of
variations in the section thickness. In addition, the use of the
HER2:CEP17 ratio also rectified the increase in HER2
signals associated with cell proliferation during the G2 phase of
the cell cycle. However, whether loss of genetic DNA during
sectioning was associated with a detection bias should be
investigated.
Whole intact nuclei extracted from paraffin-embedded
tissues were used in FISH to detect the HER2 gene and CEP17
status. The approach enabled the preservation of genetic DNA in the
experimental process. Compared with TTFISH, the present results
have shown that the average copy numbers of the HER2 and
CEP17 genes were higher with WNFISH compared to TTFISH. When
chromosome 17 polysomy was evaluated according to the cut-off
values reported in the literature, significantly more cases of
chromosome 17 polysomy were identified by WNFISH than TTFISH (37
vs. 29, P=0.039). The result confirmed the loss of nuclear
integrity and genetic materials during the sectioning of FFPE
tissue blocks. No statistical difference was observed between the
two methods in the detection of HER2/CEP17 ratio (P=0.738).
According to ASCO/CAP standards of HER2 gene amplification,
the concordance rate of the two methods was 95.41%, with a
correlation coefficient of 0.922. The sectioning process was
associated with a similar probability of HER2 or CEP17 loss.
The HER2/CEP17 ratio was not affected after calculation of
various nuclear signals (Fig. 10).
As a result, TTFISH and WNFISH were comparable in the detection of
the HER2/CEP17 ratio.
Nuclei extracted from paraffin-embedded tissues
contain breast cancer cells as well as normal breast and stromal
cells. Contrary to expectations, the results of our study show an
increased CEP17 copy number obtained by WNFISH as compared to
TTFISH, suggesting that thin tissue sections caused the loss of
cell integrity, resulting in biased analyses with FISH.
The widespread use of TTFISH in the clinical and
research fields has lowered expectations of high standards and
accuracy. Apparently, the complexity of the experimental steps in
WNFISH may restrict its application. However, in the present study
WNFISH was an effective substitute for TTFISH, and a sensitive and
prognostic tool in targeted therapy.
The present study demonstrated a linear correlation
between CEP17 and HER2 copy number. As a result, we
estimated WNFISH results by analyzing TTFISH results. Irrespective
of the method employed, a reasonable cut-off value was critical for
accurate interpretation of the data.
CEP17 signals represent tumors exhibiting chromosome
17 polysomy. The most direct method uses an average signal count of
CEP17, in which levels above a cut-off score are considered
indicative of polysomy 17. Findings of a previous study show that,
>1.86 (29) to three CEP17
signals/cell were indicative of polysomy (23).
In conclusion, detection of chromosome 17 polysomy
in breast cancer with fluorescence in situ hybridization
using thin tissue sections may cause the loss of CEP17 and HER2
signals.
Acknowledgements
This study was supported by the Natural Science
Foundation of Liaoning Province (grant no. 2013020217).
References
|
1
|
Gschwind A, Fischer OM and Ullrich A: The
discovery of receptor tyrosine kinases: targets for cancer therapy.
Nat Rev Cancer. 4:361–370. 2004. View
Article : Google Scholar : PubMed/NCBI
|
|
2
|
Lal P, Salazar PA, Hudis CA, Ladanyi M and
Chen B: HER-2 testing in breast cancer using immunohistochemical
analysis and fluorescence in situ hybridization: a
single-institution experience of 2,279 cases and comparison of
dual-color and single-color scoring. Am J Clin Pathol. 121:631–636.
2004. View Article : Google Scholar
|
|
3
|
Owens MA, Horten BC and Da Silva MM: HER2
amplification ratios by fluorescence in situ hybridization and
correlation with immunohistochemistry in a cohort of 6556 breast
cancer tissues. Clin Breast Cancer. 5:63–69. 2004. View Article : Google Scholar : PubMed/NCBI
|
|
4
|
Yaziji H, Goldstein LC, Barry TS, et al:
HER-2 testing in breast cancer using parallel tissue-based methods.
JAMA. 291:1972–1977. 2004. View Article : Google Scholar : PubMed/NCBI
|
|
5
|
Baselga J, Bradbury I, Eidtmann H, et al:
Lapatinib with trastuzumab for HER2-positive early breast cancer
(NeoALTTO): a randomised, open-label, multicentre, phase 3 trial.
Lancet. 379:633–640. 2012. View Article : Google Scholar : PubMed/NCBI
|
|
6
|
Valabrega G, Capellero S, Cavalloni G, et
al: HER2-positive breast cancer cells resistant to trastuzumab and
lapatinib lose reliance upon HER2 and are sensitive to the
multitargeted kinase inhibitor sorafenib. Breast Cancer Res Treat.
130:29–40. 2011. View Article : Google Scholar : PubMed/NCBI
|
|
7
|
Carr JA, Havstad S, Zarbo RJ, Divine G,
Mackowiak P and Velanovich V: The association of HER-2/neu
amplification with breast cancer recurrence. Arch Surg.
135:1469–1474. 2000. View Article : Google Scholar : PubMed/NCBI
|
|
8
|
Arteaga CL, Sliwkowski MX, Osborne CK,
Perez EA, Puglisi F and Gianni L: Treatment of HER2-positive breast
cancer: current status and future perspectives. Nat Rev Clin Oncol.
9:16–32. 2012. View Article : Google Scholar : PubMed/NCBI
|
|
9
|
Wolff AC, Hammond ME, Schwartz JN, et al:
American Society of Clinical Oncology/College of American
Pathologists guideline recommendations for human epidermal growth
factor receptor 2 testing in breast cancer. J Clin Oncol.
25:118–145. 2007. View Article : Google Scholar
|
|
10
|
Ohlschlegel C, Zahel K, Kradolfer D, Hell
M and Jochum W: HER2 genetic heterogeneity in breast
carcinoma. J Clin Pathol. 64:1112–1116. 2011. View Article : Google Scholar
|
|
11
|
Dal Lago L, Durbecq V, Desmedt C, et al:
Correction for chromosome-17 is critical for the determination of
true Her-2/neu gene amplification status in breast cancer. Mol
Cancer Ther. 5:2572–2579. 2006.PubMed/NCBI
|
|
12
|
Ma Y, Lespagnard L, Durbecq V, et al:
Polysomy 17 in HER-2/neu status elaboration in breast
cancer: effect on daily practice. Clin Cancer Res. 11:4393–4399.
2005.
|
|
13
|
Reddy JC, Reimann JD, Anderson SM and
Klein PM: Concordance between central and local laboratory HER2
testing from a community-based clinical study. Clin Breast Cancer.
7:153–157. 2006. View Article : Google Scholar : PubMed/NCBI
|
|
14
|
Reinholz MM, Bruzek AK, Visscher DW, et
al: Breast cancer and aneusomy 17: implications for carcinogenesis
and therapeutic response. Lancet Oncol. 10:267–277. 2009.
View Article : Google Scholar : PubMed/NCBI
|
|
15
|
Zhang W and Yu Y: The important molecular
markers on chromosome 17 and their clinical impact in breast
cancer. Int J Mol Sci. 12:5672–5683. 2011. View Article : Google Scholar : PubMed/NCBI
|
|
16
|
Downs-Kelly E, Yoder BJ, Stoler M, et al:
The influence of polysomy 17 on HER2 gene and protein expression in
adenocarcinoma of the breast: a fluorescent in situ hybridization,
immunohistochemical, and isotopic mRNA in situ hybridization study.
Am J Surg Pathol. 29:1221–1227. 2005. View Article : Google Scholar
|
|
17
|
Bose S, Mohammed M, Shintaku P and Rao PN:
Her-2/neu gene amplification in low to moderately expressing breast
cancers: possible role of chromosome 17/Her-2/neu polysomy. Breast
J. 7:337–344. 2001. View Article : Google Scholar : PubMed/NCBI
|
|
18
|
Farabegoli F, Ceccarelli C, Santini D, et
al: c-erbB-2 over-expression in amplified and non-amplified breast
carcinoma samples. Int J Cancer. 84:273–277. 1999. View Article : Google Scholar : PubMed/NCBI
|
|
19
|
Pritchard KI, Munro A, O’Malley FP, et al:
Chromosome 17 centromere (CEP17) duplication as a predictor of
anthracycline response: evidence from the NCIC Clinical Trials
Group (NCIC CTG) MA.5 Trial. Breast Cancer Res Treat. 131:541–551.
2012. View Article : Google Scholar : PubMed/NCBI
|
|
20
|
Lal P, Salazar PA, Ladanyi M and Chen B:
Impact of polysomy 17 on HER-2/neu immunohistochemistry in breast
carcinomas without HER-2/neu gene amplification. J Mol Diagn.
5:155–159. 2003. View Article : Google Scholar : PubMed/NCBI
|
|
21
|
Varshney D, Zhou YY, Geller SA and Alsabeh
R: Determination of HER-2 status and chromosome 17 polysomy in
breast carcinomas comparing HercepTest and PathVysion FISH assay.
Am J Clin Pathol. 121:70–77. 2004. View Article : Google Scholar : PubMed/NCBI
|
|
22
|
Rosenberg CL: Polysomy 17 and HER-2
amplification: true, true, and unrelated. J Clin Oncol.
26:4856–4858. 2008. View Article : Google Scholar : PubMed/NCBI
|
|
23
|
Vanden Bempt I, Van Loo P, Drijkoningen M,
et al: Polysomy 17 in breast cancer: clinicopathologic significance
and impact on HER-2 testing. J Clin Oncol. 26:4869–4874.
2008.PubMed/NCBI
|
|
24
|
Pritchard KI, Shepherd LE, O’Malley FP, et
al: HER2 and responsiveness of breast cancer to adjuvant
chemotherapy. N Engl J Med. 354:2103–2111. 2006. View Article : Google Scholar
|
|
25
|
Shah SS, Wang Y, Tull J and Zhang S:
Effect of high copy number of HER2 associated with polysomy 17 on
HER2 protein expression in invasive breast carcinoma. Diagn Mol
Pathol. 18:30–33. 2009. View Article : Google Scholar : PubMed/NCBI
|
|
26
|
Kouvaras E, Papandreou CN, Daliani DD,
Athanasiadis A and Koukoulis GK: Comparative study of spatial
localization of HER-2 and CEP17 signals and of HER-2/CEP17 ratios,
in ‘thin’ and ‘thick’ tissue sections. Breast. 21:34–39.
2012.PubMed/NCBI
|
|
27
|
Tse CH, Hwang HC, Goldstein LC, et al:
Determining true HER2 gene status in breast cancers with
polysomy by using alternative chromosome 17 reference genes:
implications for anti-HER2 targeted therapy. J Clin Oncol.
29:4168–4174. 2011.PubMed/NCBI
|
|
28
|
JRL and GGK: A one-way components of
variance model for categorical data. Biometrics. 334:671–679.
1977.
|
|
29
|
Watters AD, Going JJ, Cooke TG and
Bartlett JM: Chromosome 17 aneusomy is associated with poor
prognostic factors in invasive breast carcinoma. Breast Cancer Res
Treat. 77:109–114. 2003. View Article : Google Scholar : PubMed/NCBI
|