Introduction
Acute leukemia (AL) is the most common cancer in
childhood and is characterized by increased self-renewal of
leukemia stem/progenitor cells, decreased cell death and a block in
cell differentiation (1,2). In Mexico it has been observed that of
the two types of AL, acute lymphoblastic leukemia (ALL) shows the
highest frequency, accounting for 85% of the cases, while acute
myeloid leukemia (AML) constitutes 15% (3).
MicroRNAs (miRNAs) are ~22 nt, non-coding RNA
molecules that play a role in most cellular processes, including
apoptosis, cell differentiation, proliferation and survival
pathways (4). Furthermore,
cancer-specific miRNA profiles associated with diagnosis, staging,
progression, prognosis and response to treatment have been
identified in many types of cancers (5). In leukemia, miRNA expression
signatures associated with the cytogenetic and clinical outcome of
adult CLL, AML and Hodgkin lymphoma were have been reported
(6–8).
Recently, it was observed that miRNAs play a major
regulatory role in normal hematopoietic differentiation, evidenced
by the discovery of a small set of hematopoietic stem-progenitor
cell (HSPC)-expressed miRNAs (HE-miRNAs) which
post-transcriptionally regulate specific mRNAs involved in
hematopoiesis (9–11).
miR-24 was found to be enriched in CD34+
HSPCs (9), and has a well-defined
role as a regulator of normal erythropoiesis via targeting of human
activin receptor type 1, ALK4 (12). Additionally, miR-24 is implicated in
regulating apoptosis and cell proliferation. Reported targets of
miR-24 include pro-apoptotic (FAF-1, caspase 9, Bim and Apaf-1) and
cell cycle proteins (13–15) and it was observed that miR-24
promotes the survival of hematopoietic cells (16).
Previous studies have identified the processes in
which miR-24 is involved in hematopoietic cell lines. However, the
number of studies on the miR-24 expression features and functions
in samples from pediatric patients with AL is relatively low. In
the present study, we investigated the expression of miR-24 in
clinical samples from children with AL, as well as healthy
controls. Our primary aim was to investigate the differential
expression of miR-24 in patients with AL and healthy individuals.
Secondly, we determined if there was a significant association
between miR-24 expression and patient survival, which could point
to a potential role for miR-24 as a prognostic marker of AL.
Materials and methods
Study population
A case control study was carried out in the
Pediatric Oncology Service of the State Cancer Institute (SCI) from
the South of Mexico (Acapulco, Guerrero, Mexico), between September
2005 and July 2013. The cases consisted of 111 (ALL) and 36 (AML)
patients diagnosed with AL, through bone marrow aspirate based on
French-American-British morphological criteria of blast cells.
The diagnosis of ALL was further subclassified as
T-lineage (CD3+, CD7+ plus CD2+ or
CD5+ or both) or B-lineage (CD22+,
CD19+, CD20+, CD79A+,
HLA-DR+ and CD10+) (Becton-Dickinson
Biosciences, Mountain View, CA, USA). The multiagent
chemotherapeutic protocols used were 96091, 96092 or CIE-10:C9.1.0
of the Cancer Institute from Guerrero State and previously
described (17,18).
Immunophenotypic studies to myeloblastic leukemia
showed HLA-DR+, CD13+, CD19−,
CD33+, CD45+, CD34+ and
CD117−. Patients with AML were treated with cytarabine,
mitoxantrone, daunorubicin and etoposide, according to the
protocols of the Cancer Institute from Guerrero State (Tables I and II).
 | Table IAcute myeloid leukemia chemotherapy
regimens. |
Table I
Acute myeloid leukemia chemotherapy
regimens.
| Regimen | | Dosing |
|---|
| | High-risk
patients |
| Induction
therapy | Cycle 1 | |
| Cytarabine | Days 1–7: | Cytarabine 100
mg/m2/day continuous intravenous (IV) infusion for 2
h |
| Daunorubicin | Days 1, 3 and
5: | Daunorubicin 30
mg/m2/day continuous IV infusion for 1 h |
| Etoposide | Days 1–5: | Etoposide 100
mg/m2/day IV for 3 h |
| Mitoxantrone | Day 2: | Intrathecal (IT)
chemotherapy (Table II) |
| Cycle 2 | |
| Days 1–7: | Cytarabine 100
mg/m2/day continuous IV infusion for 2 h |
| Days 1, 3. 5: | Daunorubicin 30
mg/m2/day continuous IV infusion for 1 h |
| Days 1–5: | Etoposide 100
mg/m2/day continuous IV infusion for 3 h |
| Day 2: | IT chemotherapy
(Table II) |
| Cycle 3 | |
| Days 1–5: | Cytarabine 100
mg/m2/day continuous IV infusion for 2 h |
| Days 1–3: | Mitoxantrone 10
mg/m2/day continuous IV infusion for 30 min |
| Day 2: | Intrathecal (IT)
chemotherapy (Table II) |
| Maintenance
therapy | Cycle 1 | |
| Cytarabine | Days 1–3: | Cytarabine 1
g/m2/day continuous IV infusion for 2 h |
| Daunorubicin | Days 1–3: | Mitoxantrone 10
mg/m2/day continuous IV infusion for 30 min |
| Etoposide | Day 2: | Intrathecal (IT)
chemotherapy (Table II) |
| Mitoxantrone | Cycle 2 | |
| Days 1–3: | Cytarabine 2
g/m2/day continuous IV infusion for 2 h |
| Days 1–4: | Etoposide 100
mg/m2/day continuous IV infusion for 1 h |
| Day 2: | Intrathecal (IT)
chemotherapy (Table II) |
| Cycle 3 | |
| Days 1–3: | Cytarabine 3
g/m2/day continuous IV infusion for 2 h |
| Cycle 4 | |
| Days 1–3: | Cytarabine 2
g/m2/day continuous IV infusion for 2 h |
| Days 1–4: | Etoposide 100
mg/m2/day continuous IV infusion for 1 h |
| Day 2: | Intrathecal (IT)
chemotherapy (Table II) |
| Low-risk
patients | |
| Induction
therapy | Cycle 1 | |
| Cytarabine | Days 1–7: | Cytarabine 100
mg/m2/day continuous intravenous (IV) infusion for 2
h |
| Daunorubicin | Days 1, 3 and
5: | Daunorubicin 30
mg/m2/day continuous IV infusion for 1 h |
| Etoposide | Days 1–5: | Etoposide 100
mg/m2/day IV for 3 h |
| Day 2: | Intrathecal (IT)
chemotherapy (Table II) |
| Cycle 2 | |
| Days 1–7: | Cytarabine 100
mg/m2/day continuous IV infusion for 2 h |
| Days 1, 3 and
5: | Daunorubicin 30
mg/m2/day continuous IV infusion for 1 h |
| Days 1–5: | Etoposide 100
mg/m2/day continuous IV infusion for 3 h |
| Maintenance
therapy | Cycle 1 | |
| Cytarabine | Days 1–3: | Cytarabine 1
g/m2/day continuous IV infusion for 2 h |
| Daunorubicin | Days 1–3: | Daunorubicin 25
mg/m2/day continuous IV infusion for 1 h |
| Etoposide | Cycle 2 | |
| Days 1–3: | Cytarabine 1
g/m2/day continuous IV infusion for 2 h |
| Days 1–4: | Etoposide 100
mg/m2/day continuous IV infusion for 1 h |
| Cycle 3 | |
| Days 1–3: | Cytarabine 2
g/m2/day continuous IV infusion for 2 h |
| Cycle 4 | |
| Days 1–3: | Cytarabine 1
g/m2/day continuous IV infusion for 2 h |
| Days 1–4: | Etoposide 100
mg/m2/day continuous IV infusion for 1 h |
| Table IIAcute myeloid leukemia intrathecal
(IT) chemotherapy. |
Table II
Acute myeloid leukemia intrathecal
(IT) chemotherapy.
| Age (years) | Methotrexate
(mg) | Hydrocortisone
(mg) | ARA-C (mg) | Volume (ml) |
|---|
| <2 | 8 | 16 | 24 | 8 |
| 2 | 10 | 20 | 30 | 10 |
| >3 | 12 | 24 | 36 | 12 |
Complete remission was defined by <5% blast cells
in the bone marrow and normalization of the peripheral blood counts
at 4 weeks after starting induction therapy. Relapse was defined as
the reappearance of >20% blast cells in the marrow, or the
presence of localized leukemic infiltrates at any site after
completion of induction chemotherapy (17,19).
The worst outcome was defined as a lack of response to induction
therapy, a relapse after achieving complete remission or death due
to any cause (17,19). Overall survival (OS) was measured
from the day of registration of the study until death from any
cause, censored for patients known to be alive at the last contact.
Risk classification was: standard risk, 1–10 years of age and
presenting a white blood cell (WBC) count of
<50,000/mm3; high-risk, <1 and >10 years of
age; and a WBC count >50,000/mm3 (17,20).
The controls were 100 apparently healthy individuals
(4–10×103 leukocytes/mm3) without a family
history of leukemia. Subjects in both groups in the present study
were 1–18 years of age, including both genders and were residents
of the State of Guerrero, Mexico.
The bone marrow samples of the patients and blood
samples of the healthy individuals used in the present study were
part of the samples taken for clinical diagnostic tests in the
hospital. No extra amount of samples was collected from the study
subjects. Informed consent was obtained from all the individuals or
their guardians, after a detailed briefing of the study aims. The
present study and the informed consent procedure were approved by
the Institutional Review Board of the Cancer Institute of the State
of Guerrero, Mexico.
Specimen collection and total RNA
extraction
A bone marrow and/or a blood sample were taken from
the 247 participants and placed in tubes with anticoagulant.
Leukocytes were purified from the whole blood sample by a selective
osmotic lysis of erythrocytes (21); total RNA was extracted using the
TRIzol method (Invitrogen, Carlsbad, CA, USA) according to the
manufacturer’s protocol and the quantity and concentration of RNA
were spectrophotometrically assessed by measuring absorbance at
A260/280.
Detection of translocations by polymerase
chain reaction
Total RNA (1 μg) was reverse transcribed into cDNA
by priming with oligo(dT) and by the Superscript II First-Strand
Synthesis System (Invitrogen) according to the manufacturer’s
instructions. After the synthesis of cDNA, translocations were
detected by the molecular biology technique of conventional PCR.
Specific primers were used in the PCR reaction to amplify BCR-ABL,
ETV6-RUNX1, AML1-ETO and CBFβ-MYH11 (22–26).
The oligonucleotide sequences of these primers for each of these
translocations are shown in Table
III. Amplification was performed with a thermocycler
Mastercycle ep gradient S (Eppendorf North America, Westbury, NY,
USA).
| Table IIIOligonucleotide sequences of the
primers used in this study. |
Table III
Oligonucleotide sequences of the
primers used in this study.
| Genetic fusion | Sense strand | Antisense
strand | Size (bp) |
|---|
| BCR-ABL |
| Subtype b3a2 |
5′-TCGTGTGTGAAACTCCAGAC-3′ |
5′-CCATTCCCCATTGTGATTAT-3′ | 349 |
| Subtype b2a2 |
5′-TCGTGTGTGAAACTCCAGAC-3′ |
5′-CCATTCCCCATTGTGATTAT-3′ | 274 |
| Subtype e1a2 |
5′-ACTGCCCGGTTGTCGTGT-3′ |
5′-CCATTCCCCATTGTGATTAT-3′ | 317 |
| Internal control
ABL |
5′-TAGCATCTGACTTTGAGCCT-3′ |
5′-CCATTCCCCATTGTGATTAT-3′ | 200 |
| ETV6-RUNX1 |
| Subtype 1s1 |
5′-AGCCCCATCATGCACCCTCTGATCC-3′ |
5′-GTGGTCGGCCAGCACCTCCACC-3′ | 271 |
| Subtype 1s2 |
5′-GCAGAATTCCACTCCGTGGATTTCAAACAGTCC-3′ |
5′-AACGCCTCGCTCATCTTGCCTGGGCTC-3′ | 232 |
| Internal control
BL1 |
5′-GAGGGAAAAGCTTCACTCTG-3′ |
5′-GCCGCAGCTGCTCCAGTTCA-3′ | 200 |
| AML1-ETO |
| AML1-ETO |
5′-GAGGGAAAAGCTTCACTCTG-3′ |
5′-GCGAACTCTTTCTCCTATC-3′ | 467 |
| Internal control
AML |
5′-GAGGGAAAAGCTTCACTCTG-3′ |
5′-GCCGCAGCTGCTCCAGTTCA-3′ | 192 |
| CBFB-MYH11 |
| Subtype A |
5′-AGCTGCGTCTTCATCTCCTC-3′ |
5′-CTGGATGGTATGGGCTGTCT-3′ | 227 |
| Subtype
B |
5′-AGCTGCGTCTTCATCTCCTC-3′ |
5′-CTGGATGGTATGGGCTGTCT-3′ | 241 |
| Subtype B |
5′-GTCTGTGTTATCTGGAAAGGCTG-3′ |
5′-CGTACTGCTGGGTGAGGTTCT-3′ | 620 |
| Subtype C |
5′-GTCTGTGTTATCTGGAAAGGCTG-3′ |
5′-CGTACTGCTGGGTGAGGTTCT-3′ | 568 |
| Subtype D |
5′-GTCTGTGTTATCTGGAAAGGCTG-3′ |
5′-CGTACTGCTGGGTGAGGTTCT-3′ | 775 |
| Internal control
CBFβ |
5′-CTGGATGGTATGGGCTGTCT-3′ |
5′-TAGGGTCTTGTTGTCTTCTTGC-3′ | 230 |
For the amplification, cDNA (10 μg) was brought to a
final volume of 50 ml with 1X PCR buffer, 0.2 mM of each dNTP, 1.5
mM MgCl2, 1 U Taq polymerase (all from
Invitrogen) and 0.4 μM of each primer. For all the translocations
and the constitutive gene, the conditions for amplification are
shown in Table III using
previously established protocols (22–26).
The amplification products were subjected to electrophoresis on a
2.5% agarose gel, stained with ethidium bromide and viewed under an
UV transilluminator. The amplification products could be
discriminated by molecular size using a molecular weight marker
(100 bp; Invitrogen).
Quantification of miRNAs using real-time
PCR
To detect the levels of miR-24, 1–10 ng of total RNA
was reverse transcribed to cmiRNA with specific RT primer using
TaqMan® MicroRNA Reverse Transcription kit, and
stem-loop real-time PCR was used to detect miR-24 level by the
TaqMan® MicroRNA assays (000402) (both from Applied
Biosystems, Foster City, CA, USA). The PCR cycles were as follows:
94°C for 5 min, followed by 40 cycles of 94°C for 30 sec, 60°C for
30 sec and 72°C for 30 sec. Real-time reverse transcription
polymerase chain reactions were performed in an Applied Biosystems
7500 Detection System (Applied Biosystems).
The expression of miR-24 was determined from the
threshold cycle (Ct), and the relative expression levels were
calculated by the 2−ΔΔCt method. The Ct values were
normalized with reference to the expression of RNU6B (001093;
Applied Biosystems).
Statistical analysis
Continuous data are presented as the means ±
standard deviation (SD) or median, 25th and 75th interquartiles.
Categorical data were compared by Chi-square or Fisher’s exact
tests. One-way analysis of variance (ANOVA) was used to compare
differences among the miR-24 levels between groups, and results are
presented as mean ± SD. Univariate logistic regression analysis for
the association with the risk of relapse to AL were tested first
for miR-24 expression, gender and other clinical characteristics,
and those factors were included into a second multivariate logistic
analysis. The log-rank test and Kaplan-Meier curves were used to
analyze the effect of the miR-24 expression, gender, risk of
relapse and risk classification (standard- and high-risk) on OS.
p<0.05 was considered to indicate a statistically significant
result. All statistical analyses were performed using SPSS
software, version 20.0 (SPSS, Inc., Chicago, IL, USA), GraphPad
Prism software (version 5.0; GraphPad Software, Inc., USA) and
STATA software, version 9.2 (StataCorp, College Station, TX,
USA).
Results
General characteristics of the children
with AL
We studied 111 children with ALL with a mean age of
7.73±4.91 (mean ± SD) years and a median leukocyte count at
diagnosis of 19,700 leukocytes/mm3. The predominant
gender was male with 63.06% while there were 36.94% female
patients. These children (63.96%) had a relapse of ALL at some time
during their treatment. According to risk by age and leukocytes at
diagnosis 43.24% of the children were in the age group of 1–9
years, while 56.76% of the patients were <1 and >9 years of
age at the time of the initial diagnosis.
Of the 111 cases with ALL examined by
immunophenotype, B-lineage was the most frequently found (83.78%).
The majority (83.78%) was cytomorphologically diagnosed as L1
(Table IV). Seven (6.31%) cases of
ALL presented with the BCR-ABL rearrangement; 1 case (0.90%) the
ETV6-RUNX1 rearrangement; while, 64 (57.66%) showed none of the
genetic rearrangements under study (BCR-ABL or ETV6-RUNX1
rearrangements). Thirty nine of the 111 patients with ALL were not
considered for rearrangement analysis since analysis was not
possible (Table IV).
| Table IVGeneral characteristics and clinical
data of the AL patients and healthy individuals. |
Table IV
General characteristics and clinical
data of the AL patients and healthy individuals.
| Variables | ALL
111 (75.51) | AML
36 (24.49) | Healthy
individuals
100 (100) | P-valueb |
|---|
| Age (years, mean ±
SD) | 7.73±4.91 | 8.02±4.79 | 10.21±5.53 | 0.002d |
| No. of
leukocytes/mm3 | 19,700
(4,700–42,900)a | 34,550
(9,350–68,000)a | 8,000
(7,000–9,000)a | <0.001d |
| Gender | | | | |
| Female | 41 (36.94) | 14 (38.89) | 47 (47.00) | 0.317 |
| Male | 70 (63.06) | 22 (61.11) | 53 (53.00) | |
| Status of
participants | | | | |
| Alive | 42 (37.84) | 13 (36.11) | 100 (100.00) | 1.00c |
| Deceased | 69 (62.16) | 23 (63.89) | - | |
| Risk by age and
leukocytes at diagnosis | | | | |
| Low-risk (1–10
years and <50,000 leukocytes/mm3) | 48 (43.24) | 12 (33.33) | - | 1.00c |
| High-risk (<1
and >10 years and >50,000 leukocytes/mm3) | 63 (56.76) | 24 (66.67) | - | |
| Relapse during
treatment | | | | |
| No | 40 (36.04) | 17 (47.22) | - | |
| Yes | 71 (63.96) | 19 (52.77) | - | 0.244c |
|
Immunophenotype | | | | |
| B-lineage | 93 (83.78) | - | - | - |
| T-lineage | 11 (9.91) | - | - | |
| B/T-lineage | 7 (6.31) | - | - | |
| FAB
classification | | | | |
| L1 | 93 (83.78) | - | - | - |
| L2 | 18 (16.22) | - | - | |
| M0 | - | 10 (27.77) | - | |
| M1 | - | 14 (38.89) | - | - |
| M2 | - | 6 (16.67) | - | |
| M3 | - | 6 (16.67) | - | |
| Chromosomal
translocations | | | | |
| ETV6-RUNX1
[t(12;21)] | 1 (0.90) | - | - | |
| BCR-ABL
[t(9;22)] | 7 (6.31) | - | - | |
| AML1-ETO
[t(8;21)] | - | 3 (8.33) | - | |
| CBFB-MYH11
[inv(16)] | - | 0 (0.00) | - | - |
| Negative | 64 (57.66) | 22 (61.11) | - | |
| Not
determined | 39 (35.13) | 11 (30.56) | - | |
| miR-24 levels | 0.84
(0.21–2.54)a | 4.22
(2.08–8.22)a | 1.25
(1.09–1.61)a | <0.001d |
Likewise, we also included 36 children with AML, who
had a mean age of 8.102±4.79 years, with a median of 34, 550
leukocytes/mm3 at diagnosis. There were 22 (61.11%)
males and 14 (38.89%) females. Twelve patients (33.33%) were in the
age group of 1–9 years. Twenty-four patients (66.67%) were <1
and >9 years of age at the time of the initial diagnosis.
Nineteen (52.77%) of the patients with AML had a relapse at some
time during their treatment (Table
IV).
TheFABsubtypesobservedinthepresentstudywereM0–M3,
with a preponderance of acute myeloblastic leukemia without
maturation (FAB-M1, 38.89%), followed by minimally differentiated
acute myeloid leukemia (FAB-M0, 27.77%). Adequate rearrangement
analyses were obtained for 25 (69.44%) of the patients with AML.
Three (8.33%) cases of AML presented with the AML1-ETO
rearrangement; while, 22 (61.11%) showed none of the genetic
rearrangements under study (AML1-ETO or CBFB-MYH11 rearrangements).
Eleven of the 36 patients with AML studied were not considered for
rearrangement analysis since analysis was not possible (Table IV).
General characteristics of the healthy
children
One-hundred healthy individuals (controls) were
apparently included. In this group, the age range was 1–18 years
(mean ± SD, 10.21±5.53 years), and the leukocyte count was normal
(4–10×103 leukocytes/mm3; median 8,000). In
this group, 53 healthy individuals (53.00%) were male and 47
(47.00%) were female (Table IV). A
significant difference could be observed in the age and the
leukocyte count at diagnosis between the patients with AL and
healthy individuals (Table
IV).
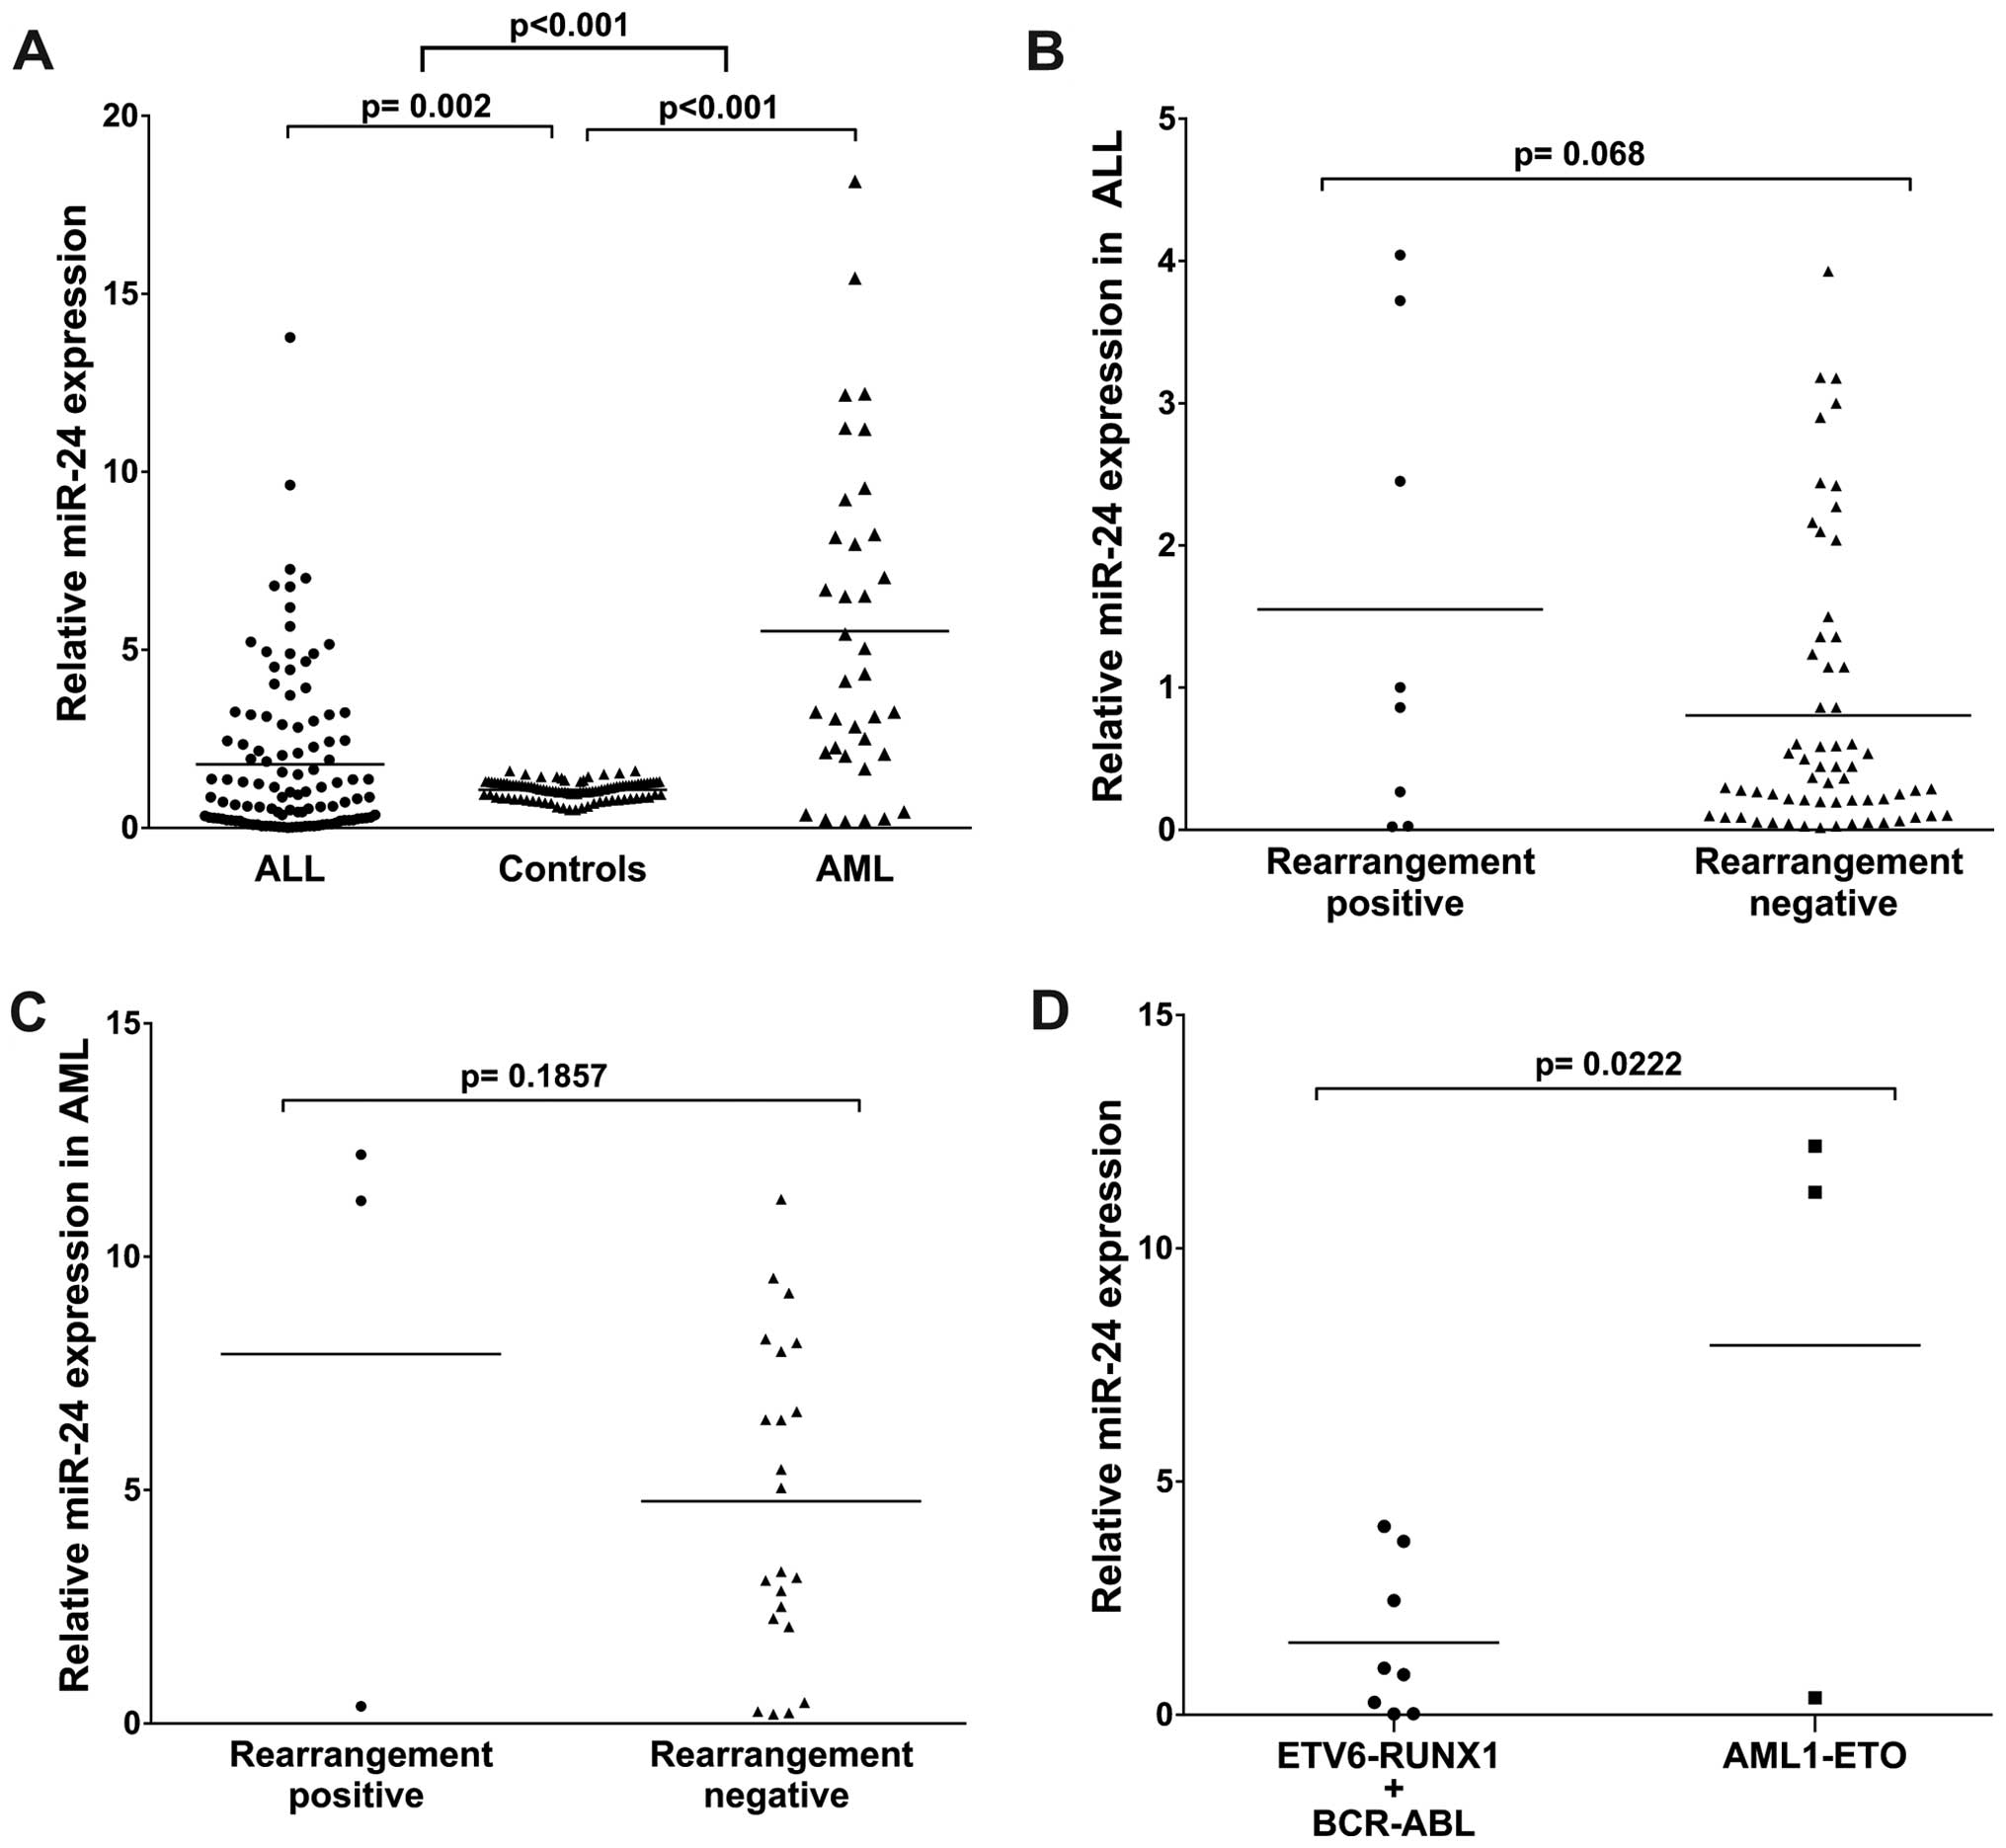
miR-24 was differentially expressed in
AML and ALL
To identify whether miR-24 was differentially
expressed between the ALL and AML samples, we examined miR-24
levels in samples of the AL patients and the healthy individuals.
The RNAs isolated were subjected to TaqMan RT-PCR analysis. The
assays showed that the miR-24 levels were significantly higher
(4.22 median, p<0.001) in the AML patients as compared with the
healthy individuals. In turn, miR-24 in the ALL patients was
significantly low (0.84 median, p=0.002). miR-24 expression in the
AML patients was much higher than that in the ALL patients
(p<0.001) (Table IV and
Fig. 1A). These results suggest
that upregulation of miR-24 expression may play a role in the
progression of AML.
miR-24 expression in AL patients
with/without rearrangement
We further quantitatively detected miR-24 expression
in 111 cases of ALL and 36 cases of AML divided into two subtype
groups: rearrangement-positive (ALL, 8; AML, 3) and
rearrangement-negative (ALL, 64; AML, 22). The analysis showed no
statistically significant difference between the positive and
negative rearrangement patients (p=0.068 for ALL and p=0.185 for
AML), (Fig. 1B and C).
Then, we compared miR-24 expression in patients
according to ETV6-RUNX1/BCR-ABL vs. AML1-ETO rearrangement
positivity and observed that miR-24 was significantly higher in the
AML1-ETO-positive patients (p=0.022); the mean was 1.55-fold
(ETV6-RUNX1/BCR-ABL) vs. 7.92-fold (AML1-ETO) (Fig. 1D).
Risk of relapse based on the miR-24
expression and other risk factors
To evaluate the correlation between miR-24
expression and the risk of relapse to ALL, patients were divided
into groups with downregulation and upregulation of miR-24
expression. The 75th percentile expression level of miR-24
(2.54-fold) was used as a cut-off point to divide all 111 patients
with ALL into 2 groups. Those who expressed miR-24 at levels less
than the cut-off value were assigned to the downregulation group
(n=61), and those with expression above the cut-off value were
assigned to the upregulation group (n=50).
In a logistic regression analysis, an association
was observed between miR-24 expression and the risk of relapse of
ALL (p<0.05). It was observed that those patients with
upexpression of miR-24, showed a significant increase in the risk
of relapse to ALL (OR=2.51, 95% CI 1.10–5.72, p=0.028) compared to
those patients who had downexpression of miR-24 expression
(Table V). We also observed that
individuals <1 and >10 years of age with >50,000
leukocytes/mm3 (high-risk) had a 5.46 fold (95% CI
2.34–12.77, p≤0.001) increased risk to have relapsed compared to
individuals between 1–10 years with <50,000
leukocytes/mm3 (low-risk) (Table V).
| Table VAssociation of miR-24 expression and
clinical features with the risk of relapse to ALL. |
Table V
Association of miR-24 expression and
clinical features with the risk of relapse to ALL.
| Without
relapse
n (%) | With
relapse
n (%) | P-value | Univariate
analysis | Multivariate
analysis |
|---|
|
|
|---|
| OR | CI 95% | P-valuea | OR | CI 95% | P-valueb |
|---|
| Gender | | | | | | | | | |
| Female | 16 (41.03) | 25 (34.72) | 0.542 | 1.00 | | | | | |
| Male | 23 (58.97) | 47 (65.28) | | 1.31 | 0.59–2.91 | 0.512 | | | |
|
Immunophenotype | | | | | | | | | |
| B-lineage | 36 (92.31) | 57 (79.17) | | 1.00 | | | | | |
| T-lineage | 2 (5.13) | 9 (12.50) | 0.198 | 2.84 | 0.58–13.90 | 0.197 | | | |
| B/T-lineage | 1 (2.56) | 6 (8.33) | | 3.78 | 0.44–32.78 | 0.226 | | | |
| B-lineage | 36 (92.31) | 57 (79.17) | | 1.00 | | | | | |
| T-lineage +
B/T-lineage | 3 (7.69) | 15 (20.83) | 0.105 | 3.15 | 0.85–11.67 | 0.085 | | | |
| FAB
classification | | | | | | | | | |
| ALL | | | | | | | | | |
| L1 | 31 (79.49) | 62 (86.11) | | 1.60 | 0.57–4.46 | 0.369 | | | |
| L2 | 8 (20.51) | 10 (13.89) | 0.423 | 1.00 | | | | | |
| Risk by age and
leukocytes at diagnosis | | | | | | | | | |
| Low-risk (1–10
years and <50,000 leukocytes/mm3) | 27 (69.23) | 21 (29.17) | <0.001c | 1.00 | | | | | |
| High-risk (<1
and >10 years and >50,000 leukocytes/mm3) | 12 (30.77) | 51 (70.83) | | 5.46 | 2.34–12.77 | <0.001c | 5.20 | 2.19–12.32 | <0.001c |
| miR-24 levels | | | | | | | | | |
| Downregulated | 27 (69.23) | 34 (47.22) | 0.030c | 1.00 | | | | | |
| Upregulated | 12 (30.77) | 38 (52.78) | | 2.51 | 1.10–5.72 | 0.028c | 2.27 | 1. 94–5.51 | 0.020c |
Similarly to what was carried out with patients with
ALL, the patients with AML were divided in subgroups according to
downexpression and upexpression [< or > 75th percentile
expression level of miR-24 (8.22-fold)]: downexpression group
(n=18) and upexpression group (n=18). We also examined the
relationship between miR-24 expression levels and the risk of
relapse to AML. We observed a significant correlation between
miR-24 expression levels and risk of relapse (OR=7.00, 95% CI
1.59–30.79, p=0.010), (Table VI).
These data suggest that upregulation of miR-24 expression may have
an important role in the relapse of the disease.
| Table VIAssociation of the miR-24 expression
and clinical features with risk of relapse to AML. |
Table VI
Association of the miR-24 expression
and clinical features with risk of relapse to AML.
| Without
relapse
n (%) | With
relapse
n (%) | P-value | Univariate
analysis | Multivariate
analysis |
|---|
|
|
|---|
| OR | CI 95% | P-valuea | OR | CI 95% | P-valueb |
|---|
| Gender | | | | | | | | | |
| Female | 7 (43.75) | 7 (35.00) | 0.734 | 1.00 | | | | | |
| Male | 9 (56.25) | 13 (65.00) | | 1.44 | 0.37–5.57 | 0.593 | | | |
| FAB
classification | | | | | | | | | |
| M0 | 5 (31.25) | 5 (25.00) | | 0.73 | 0.17–3.17 | 0.678 | | | |
| M1 | 7 (50.00) | 5 (30.00) | 0.460 | 0.42 | 0.10–1.76 | 0.240 | | | |
| M2 | 2 (6.25) | 6 (15.00) | | 3.00 | 0.51–17.49 | 0.222 | | | |
| M3 | 2 (12.50) | 4 (20.00) | | 1.00 | | | | | |
| Risk by age and
leukocytes at diagnosis | | | | | | | | | |
| Low-risk (1–10
years and <50,000 leukocytes/mm3) | 12 (75.00) | 7 (35.00) | 0.023c | 1.00 | | | | | |
| High-risk (<1
and >10 years and >50,000 leukocytes/mm3) | 4 (25.00) | 13 (65.00) | | 5.57 | 1.29–23.93 | 0.021c | 8.38 | 1.39–50.56 | 0.020c |
| miR-24 levels | | | | | | | | | |
| Downregulated | 12 (75.00) | 6 (30.00) | 0.018c | 1.00 | | | | | |
| Upregulated | 4 (25.00) | 14 (70.00) | | 7.00 | 1.59–30.79 | 0.010c | 10.20 | 1.71–60.87 | 0.011c |
Expression of miR-24 is associated with
unfavorable prognosis in AL patients
The relationship between survival and gender was
also calculated. We observed that males had a poorer OS compared to
females (log-rank test; p=0.034 for ALL, Fig. 2A). In AML the Kaplan-Meier survival
curves showed no significant association between gender and
survival, although a reduction in survival among men and women was
observed (log-rank test; p=0.323; Fig.
3A).
Likewise, individuals <1 and >10 years of age
with >50,000 leukocytes/mm3 (high-risk) had a poor
survival rate compared with those patients between 1–10 years of
age with <50,000 leukocytes/mm3 (Fig. 2B; log-rank test; p<0.001 for ALL
and Fig. 3B; log-rank test; p=0.031
for AML). A different rate of OS was evident between the
individuals with and without relapse of AL (Fig. 2C; log-rank test; p<0.001 for ALL
and Fig. 3C; log-rank test; p=0.015
for AML).
The association between miR-24 expression and
survival of AL patients was investigated. We observed that ALL
patients with high miR-24 expression tend to have shorter OS than
those with low miR-24 (Fig. 2D;
log-rank test; p=0.001 for ALL and Fig.
3D; log-rank test; p=0.018 for AML). During the follow-up
period, 69 of the 111 patients with ALL (62.16%) and 23 of the 36
patients with AML (63.89%) had died (Table IV). In addition, the univariate and
multivariate analyses performed showed that miR-24 expression is an
independent prognostic factor for AL (Tables V and VI).
Discussion
Acute leukemias (ALs) are the most frequent type of
childhood cancers (2). In spite of
the development of advanced therapeutic strategies, the prognosis
of patients with this type of cancer varies significantly and is
hard to predict; therefore knowledge of the prognosis is vital
since some patients with AL have different responses to the same
therapy (27). Therefore, it is
critical to identify biomarkers for the early identification of
patients with a high-risk of treatment failures, in order to modify
therapeutic methods for improving the overall survival (OS) of
patients with AL.
miR-24 is a tumor-suppressor among the miRNAs that
are consistently upregulated during terminal differentiation.
miR-24 is expressed in a cyclical manner and takes part in
maintaining and regulating proper cell cycle progression and
apoptosis (13,15). Overexpression of miR-24 in liver,
gastric, prostate and cervical cancer cell lines was found to
protects these cells from apoptosis whereas knockdown of miR-24
turns differentiated cells into a proliferation state and
sensitizes them to apoptosis (13,15).
Yet the role of miR-24 in AL samples is poorly understood. We
investigated the expression of miR-24 in samples of AL patients and
detected its relationships with clinical parameters.
In the present study, we observed that miR-24
expression was significantly increased in both AML and ALL patients
(p<0.001). This phenomenon was consistent with previous
publications, where it was noted that miR-24 promotes the survival
of hematopoietic progenitors (16,28).
A previous study has shown miR-24 to have an
increased expression in AML and a decreased expression in ALL
(28). For a more comprehensive
insight into the clinical value of miR-24, in the present study we
performed a logistic regression analysis to investigate its
association with the clinical features of AL patients. Our data
proved that miR-24 expression was significantly higher in AL
patients compared with that in apparently healthy individuals
(p<0.001). We observed a statistically significant association
between the expression of miR-24 and the risk of AL (OR=2.51, 95%
CI 1.10–5.72, p=0.028 for ALL and OR=7.00, 95% CI 1.59–30.79,
p=0.010 for AML). In addition, miR-24 expression, was associated
with risk of relapse of leukemia (p<0.05). This suggests that
the regulation of miR-24 expression, and the high association with
the risk of relapse (p<0.05) may be a factor that led to >50%
of deaths in the patients with AL included in the present
study.
Moreover, it was reported that miRNA expression is
correlated with cytogenetic and molecular subtypes of AL [i.e.,
with t(8;21), t(15;17), inv(16),
NPM1 and CEBPA mutations] (8).
Notably, two from our cases with t(8;21) rearrangement presented
high expression of miR-24 when compared with others rearrangements
(ETV6-RUNX1/BCR-ABL), which is similar to previous findings
(8,28–30).
In many studies, age, gender and white cell count at
diagnosis have been shown to be a consistently strong prognostic
factors in childhood AL. Patients <1 year of age have higher
relapse rates compared with others ages as reported in various
studies; this feature also retained its significance in this study.
Patients in the age group of 1–10 years (low-risk) had the best
prognosis, whereas patients <1 and >9 years of age
(high-risk) showed the worst prognosis (OR=5.46, 95% CI 2.34–12.77,
p≤0.001 for ALL and OR=5.57, 95% CI 1.29–23.93, p=0.021 for AML),
which agrees with previous studies (17,31–33).
The relationship between white cell count at diagnosis (WBC) and
prognosis has been firmly established in many studies of childhood
AL (17,30–33)
and confirmed in the present study. WBC >50,000
leukocytes/mm3 (high-risk) has been shown to be an
adverse risk factor in childhood AL. This value has been proposed
as the value by which to define patients with a poor prognosis by
the National Cancer Institute sponsored workshop (20).
In the multivariate analysis, for patients with
miR-24 expression, OR estimates retained their significance
(p<0.05) in the presence of other prognostic factors, which also
influenced AL outcome (age, gender and risk by age and leukocytes
at diagnosis), which suggests that miR-24 is an independent
prognostic marker for AL. More importantly, we proved that miR-24
expression was significantly associated with OS of patients with
AL. In support of this, Kaplan-Meier analysis of OS showed that
patients with high miR-24 expression tended to have a significantly
shorter OS compared with patients with low expression (log-rank
p<0.05), indicating that high miR-24 expression is a marker of
poor prognosis for patients with AL. Thus, miR-24 could be used as
molecular prognostic marker in addition to known prognostic
indicators, in order to identify patients who are more likely to
have a higher risk of death, thus, should receive more aggressive
treatment.
In conclusion, our data indicated that miR-24
upregulation was associated with poor prognosis in AL. miR-24 was
identified for the first time as an independent marker for
predicting the clinical outcome of AL patients. Nevertheless, our
data generate novel hypotheses regarding the role of miR-24
expression in the risk and relapse of AL and an impact on survival
of AL patients, which will have to be confirmed in independent
studies.
Acknowledgements
Y.G.G. and J.O.N were recipients of fellowships from
the Programa de Apoyo a los Estudios de Posgrado, Universidad
Nacional Autónoma de Mexico (PAEP-UNAM).
References
|
1
|
Dorantes-Acosta E and Pelayo R: Lineage
switching in acute leukemias: A consequence of stem cell
plasticity? Bone Marrow. pp. 4067962012, http://dx.doi.org/10.1155/2012/406796.
|
|
2
|
Daniel-Cravioto A, Gonzalez-Bonilla CR,
Mejia-Arangure JM, Perez-Saldivar ML, Fajardo-Gutierrez A,
Jimenez-Hernandez E, Hernandez-Serrano M and Bekker-Mendez VC:
Genetic rearrangement MLL/AF4 is most frequent in children with
acute lymphoblastic leukemias in Mexico City. Leuk Lymphoma.
50:1352–1360. 2009. View Article : Google Scholar : PubMed/NCBI
|
|
3
|
Pérez-Saldivar ML, Fajardo-Gutiérrez A,
Bernáldez-Ríos R, et al: Childhood acute leukemias are frequent in
Mexico City: descriptive epidemiology. BMC Cancer. 11:3552011.
View Article : Google Scholar : PubMed/NCBI
|
|
4
|
Bartel DP: MicroRNAs: Genomics,
biogenesis, mechanism, and function. Cell. 116:281–297. 2004.
View Article : Google Scholar : PubMed/NCBI
|
|
5
|
Calin GA and Croce CM: MicroRNA signatures
in human cancers. Nat Rev Cancer. 6:857–866. 2006. View Article : Google Scholar : PubMed/NCBI
|
|
6
|
Calin GA, Ferracin M, Cimmino A, et al: A
MicroRNA signature associated with prognosis and progression in
chronic lymphocytic leukemia. N Engl J Med. 353:1793–1801. 2005.
View Article : Google Scholar : PubMed/NCBI
|
|
7
|
Garzon R, Volinia S, Liu CG, et al:
MicroRNA signatures associated with cytogenetics and prognosis in
acute myeloid leukemia. Blood. 111:3183–3189. 2008. View Article : Google Scholar : PubMed/NCBI
|
|
8
|
Jongen-Lavrencic M, Sun SM, Dijkstra MK,
Valk PJ and Löwenberg B: MicroRNA expression profiling in relation
to the genetic heterogeneity of acute myeloid leukemia. Blood.
111:5078–5085. 2008. View Article : Google Scholar : PubMed/NCBI
|
|
9
|
Georgantas RW III, Hildreth R, Morisot S,
Alder J, Liu CG, Heimfeld S, Calin GA, Croce CM and Civin CI:
CD34+ hematopoietic stem-progenitor cell microRNA
expression and function: a circuit diagram of differentiation
control. Proc Natl Acad Sci USA. 104:2750–2755. 2007. View Article : Google Scholar
|
|
10
|
Xiao C, Calado DP, Galler G, Thai TH,
Patterson HC, Wang J, Rajewsky N, Bender TP and Rajewsky K: miR-150
controls B cell differentiation by targeting the transcription
factor c-Myb. Cell. 131:146–159. 2007. View Article : Google Scholar : PubMed/NCBI
|
|
11
|
Ben-Ami O, Pencovich N, Lotem J, Levanon D
and Groner Y: A regulatory interplay between miR-27a and Runx1
during mega-karyopoiesis. Proc Natl Acad Sci USA. 106:238–243.
2009. View Article : Google Scholar
|
|
12
|
Wang Q, Huang Z, Xue H, Jin C, Ju XL, Han
JD and Chen YG: MicroRNA miR-24 inhibits erythropoiesis by
targeting activin type I receptor ALK4. Blood. 111:588–595. 2008.
View Article : Google Scholar
|
|
13
|
Qin W, Shi Y, Zhao B, Yao C, Jin L, Ma J
and Jin Y: miR-24 regulates apoptosis by targeting the open reading
frame (ORF) region of FAF1 in cancer cells. PLoS One. 5:e94292010.
View Article : Google Scholar : PubMed/NCBI
|
|
14
|
Cheng AM, Byrom MW, Shelton J and Ford LP:
Antisense inhibition of human miRNAs and indications for an
involvement of miRNA in cell growth and apoptosis. Nucleic Acids
Res. 33:1290–1297. 2005. View Article : Google Scholar : PubMed/NCBI
|
|
15
|
Lal A, Navarro F, Maher CA, et al: miR-24
inhibits cell proliferation by targeting E2F2, MYC, and other
cell-cycle genes via binding to ‘seedless’ 3′UTR microRNA
recognition elements. Mol Cell. 35:610–625. 2009. View Article : Google Scholar : PubMed/NCBI
|
|
16
|
Nguyen T, Rich A and Dahl R: miR-24
promotes the survival of hematopoietic cells. PLoS One.
8:e554062013. View Article : Google Scholar : PubMed/NCBI
|
|
17
|
Gómez-Gómez Y, Organista-Nava J,
Saavedra-Herrera MV, Rivera-Ramírez AB, Terán-Porcayo MA, Del
Carmen Alarcón-Romero L, Illades-Aguiar B and Leyva-Vázquez MA:
Survival and risk of relapse of acute lymphoblastic leukemia in a
Mexican population is affected by dihydrofolate reductase gene
polymorphisms. Exp Ther Med. 3:665–672. 2012.PubMed/NCBI
|
|
18
|
Seguro-popular: Secretaria de Salud/Seguro
Popular A. 2007, Available at: http://seguropopular.col.gob.mx/segpop/.
Accessed May, 2009
|
|
19
|
Reiter A, Schrappe M, Ludwig WD, et al:
Chemotherapy in 998 unselected childhood acute lymphoblastic
leukemia patients. Results and conclusions of the multicenter trial
ALL-BFM 86. Blood. 84:3122–3133. 1994.PubMed/NCBI
|
|
20
|
Smith M, Arthur D, Camitta B, et al:
Uniform approach to risk classification and treatment assignment
for children with acute lymphoblastic leukemia. J Clin Oncol.
14:18–24. 1996.PubMed/NCBI
|
|
21
|
Chomczynski P and Sacchi N: Single-step
method of RNA isolation by acid guanidinium
thiocyanate-phenol-chloroform extraction. Anal Biochem.
162:156–159. 1987. View Article : Google Scholar : PubMed/NCBI
|
|
22
|
Shtivelman E, Lifshitz B, Gale RP and
Canaani E: Fused transcript of abl and bcr genes in chronic
myelogenous leukaemia. Nature. 315:550–554. 1985. View Article : Google Scholar : PubMed/NCBI
|
|
23
|
van der Feltz MJ, Shivji MK, Allen PB,
Heisterkamp N, Groffen J and Wiedemann LM: Nucleotide sequence of
both reciprocal translocation junction regions in a patient with Ph
positive acute lymphoblastic leukaemia, with a breakpoint within
the first intron of the BCR gene. Nucleic Acids Res. 17:1–10. 1989.
View Article : Google Scholar : PubMed/NCBI
|
|
24
|
Kozu T, Miyoshi H, Shimizu K, Maseki N,
Kaneko Y, Asou H, Kamada N and Ohki M: Junctions of the
AML1/MTG8(ETO) fusion are constant in t(8;21) acute myeloid
leukemia detected by reverse transcription polymerase chain
reaction. Blood. 82:1270–1276. 1993.PubMed/NCBI
|
|
25
|
Harbott J, Viehmann S, Borkhardt A, Henze
G and Lampert F: Incidence of TEL/AML1 fusion gene analyzed
consecutively in children with acute lymphoblastic leukemia in
relapse. Blood. 90:4933–4937. 1997.
|
|
26
|
Claxton DF, Liu P, Hsu HB, Marlton P,
Hester J, Collins F, Deisseroth AB, Rowley JD and Siciliano MJ:
Detection of fusion transcripts generated by the inversion 16
chromosome in acute myelogenous leukemia. Blood. 83:1750–1756.
1994.PubMed/NCBI
|
|
27
|
Dulucq S, St-Onge G, Gagné V, Ansari M,
Sinnett D, Labuda D, Moghrabi A and Krajinovic M: DNA variants in
the dihydrofolate reductase gene and outcome in childhood ALL.
Blood. 111:3692–3700. 2008. View Article : Google Scholar
|
|
28
|
Mi S, Lu J, Sun M, et al: MicroRNA
expression signatures accurately discriminate acute lymphoblastic
leukemia from acute myeloid leukemia. Proc Natl Acad Sci USA.
104:19971–19976. 2007. View Article : Google Scholar : PubMed/NCBI
|
|
29
|
Daschkey S, Röttgers S, Giri A, Bradtke J,
Teigler-Schlegel A, Meister G, Borkhardt A and Landgraf P:
MicroRNAs distinguish cytogenetic subgroups in pediatric AML and
contribute to complex regulatory networks in AML-relevant pathways.
PLoS One. 8:e563342013. View Article : Google Scholar : PubMed/NCBI
|
|
30
|
Zaidi SK, Dowdy CR, van Wijnen AJ, Lian
JB, Raza A, Stein JL, Croce CM and Stein GS: Altered Runx1
subnuclear targeting enhances myeloid cell proliferation and blocks
differentiation by activating a miR-24/MKP-7/MAPK network. Cancer
Res. 69:8249–8255. 2009. View Article : Google Scholar : PubMed/NCBI
|
|
31
|
Organista-Nava J, Gómez-Gómez Y,
Saavedra-Herrera MV, Rivera-Ramírez AB, Terán-Porcayo MA,
Alarcón-Romero LC, Illades-Aguiar B and Leyva-Vázquez MA:
Polymorphisms of the γ-glutamyl hydrolase gene and risk of relapse
to acute lymphoblastic leukemia in Mexico. Leuk Res. 34:728–732.
2010. View Article : Google Scholar : PubMed/NCBI
|
|
32
|
Ng SM, Lin HP, Ariffin WA, Zainab AK, Lam
SK and Chan LL: Age, sex, haemoglobin level, and white cell count
at diagnosis are important prognostic factors in children with
acute lymphoblastic leukemia treated with BFM-type protocol. J Trop
Pediatr. 46:338–343. 2000. View Article : Google Scholar
|
|
33
|
Leyva-Vázquez MA, Organista-Nava J,
Gómez-Gómez Y, Contreras-Quiroz A, Flores-Alfaro E and
Illades-Aguiar B: Polymorphism G80A in the reduced folate carrier
gene and its relationship to survival and risk of relapse in acute
lymphoblastic leukemia. J Investig Med. 60:1064–1067.
2012.PubMed/NCBI
|