Introduction
Chromosome instability (CIN) is characterized by
chromosomal numerical and/or structural changes and can be caused
by chromosomal missegregation during mitosis (1,2). CIN
is observed in diverse human cancers and is associated with a poor
patient prognosis in some types of cancer (3–5).
Centrosome amplification is one factor that contributes to CIN
through chromosomal missegregation in cancerous cells (6–8). The
centrosome, a major microtubule-organizing center, is composed of a
pair of centrioles and surrounding protein aggregates, and each
cell is maintained so that it has one or two centrosomes during the
cell cycle (7,9). When centrosome amplification (≥3
centrosomes in a cell) occurs, it causes an increase in aberrant
mitotic spindle formation, merotelic kinetochore-microtubule
attachment errors and lagging chromosome formation. Such mitotic
abnormalities can cause chromosome segregation errors leading to
CIN (6–10).
Spindle assembly abnormal protein 6 homolog (SASS6)
is a centrosomal protein that, together with PLK4, CEP135, CENPJ
(also known as CPAP) and STIL, is involved in regulating the number
of centrosomes in human cells (11–14).
The forced overexpression of SASS6 leads to centrosome
amplification (11,12,15,16).
Notably, the abnormal expression of PLK4, resulting in the
induction of centrosome amplification, has been reported in several
types of cancers (17,18). Moreover, genetic abnormalities of
various types in other genes that play roles in centrosome
regulation, such as AURKA amplification and SKA1
overexpression, have also been reported in human cancers (19,20).
At present, however, abnormalities in SASS6 expression or
SASS6 somatic mutations have not been reported for any human
cancers. Since CIN is frequently observed in colorectal cancer
(CRC) (3,5), we hypothesized that SASS6
abnormalities may be involved in the induction of CIN in CRC.
Therefore, in the present study, we first examined whether SASS6 is
aberrantly expressed in human primary CRCs. Since the upregulation
of SASS6 expression was detected in CRCs, we next showed that SASS6
overexpression induced centrosome amplification, mitotic
abnormalities, and CIN in colon cancer cells. SASS6 upregulation in
colon cancer was also revealed using data from the Cancer Genome
Atlas (TCGA) database and was found to be associated with a
relatively poor survival outcome in analyses using both the TCGA
and Gene Expression Omnibus (GEO) data. Finally, SASS6 expression
was shown to be upregulated in a modest manner not only in colon
cancer, but also in 8 other distinct cancer types, although the
incidence of somatic SASS6 mutations was exremely low.
Materials and methods
Tissue samples
CRC tissues and corresponding normal colorectal
tissues were obtained from primary CRC patients treated at
Hamamatsu University Hospital (Japan) for use in a quantitative
reverse-transcription-polymerase chain reaction (qRT-PCR) analysis
(n=81) and western blot analysis (n=19). The present study design
was approved by the Institutional Review Board of the Hamamatsu
University School of Medicine.
qRT-PCR
Total RNA was extracted using an RNeasy kit (Qiagen,
Valencia, CA, USA) or an Isogen kit (Nippon Gene, Tokyo, Japan) and
converted to cDNA using the SuperScript First-Strand Synthesis
system for RT-PCR (Invitrogen, Carlsbad, CA, USA). The expression
levels of the SASS6 and GAPDH mRNA transcripts were measured using
real-time qRT-PCR with the cDNA, a set of primers, the QuantiTect
SYBR-Green PCR kit (Qiagen), and a LightCycler instrument (Roche,
Palo Alto, CA, USA). The following PCR primers were used for the
SASS6 transcripts: 5′-CCA GAA TAC CTT CCC TCA TTC G-3′ and 5′-GTT
GCT CCT GAC TGA ACA TCT CC-3′. The PCR primer sequences for the
GAPDH transcripts were previously described (21). The relative amounts of SASS6
transcript were normalized to those of the GAPDH transcript. The
T/N values were calculated by dividing the normalized transcript
amounts in the cancerous tissue (T) of primary cancers by the
amounts in the corresponding noncancerous tissue (N).
Western blot analysis
Tissues or cultured cells were lysed in a buffer
containing 50 mM HEPES-KOH (pH 7.5), 150 mM NaCl, 0.1% sodium
dodecyl sulfate, 1% Triton X-100, 0.5% sodium deoxycholate, 100 mM
sodium fluoride, 1 mM sodium orthovanadate and protease inhibitor
cocktail (Sigma-Aldrich, St. Louis, MO, USA). Western blot analysis
using an anti-SASS6 polyclonal antibody (Novus Biologicals,
Littleton, CO, USA) or an anti-β-tubulin monoclonal antibody (clone
2–28–33; Sigma-Aldrich) was performed as described previously
(21). Immunoreactivity was
visualized using an ECL chemiluminescence system (GE Healthcare
Bio-Science, Piscataway, NJ, USA). ImageJ software (National
Institutes of Health, Bethesda, MD, USA) was used to measure
protein expression levels.
Establishment of stable inducible cell
lines
The human colon cancer cell line DLD-1 was obtained
from the American Type Culture Collection (ATCC, Manassas, VA,
USA). The cells were maintained at 37°C in RPMI-1640 medium
supplemented with 10% fetal bovine serum and
penicillin/streptomycin under a 5% CO2 atmosphere. DLD-1
cells were transfected with a cumate switch inducible vector for
SASS6 expression, which was constructed using a GFP-SASS6 plasmid
(13) kindly provided by Prof. T.K.
Tang as a PCR template, together with the piggyBac transposase
vector (System Biosciences, Mountain View, CA, USA). To establish
stable inducible cell lines, positively transposed cells were
selected using 1 µg/ml puromycin (Clontech, Palo Alto, CA, USA).
Since the inducible piggyBac vector features a tight cumate switch
combined with the EF1-CymR repressor-T2A-Puro cassette to establish
stable cell lines, the addition of cumate solution (System
Biosciences) to the puromycin-selected cells led to the induction
of SASS6 expression.
Indirect immunofluorescence analysis
Cells were fixed with methanol and permeabilized
with 1% Nonidet P-40 solution. After blocking with normal goat
serum, the cells were probed with anti-γ-tubulin monoclonal
antibody (GTU88; Sigma-Aldrich). Indirect immunofluorescence
labeling was performed by exposure to the Alexa Fluor
594-conjugated secondary antibody (Molecular Probes, Eugene, OR,
USA), and the nuclei were stained with
4′,6-diamidino-2-phenylin-dole (DAPI) (Sigma-Aldrich). The cells
were examined under a fluorescence microscope (Olympus BX-51-FL;
Olympus, Tokyo, Japan) equipped with epifluorescence filters and a
photometric CCD camera (Sensicam; PCO Company, Kelheim,
Germany).
Fluorescence in situ hybridization (FISH)
analysis
Trypsinized cells were treated with 0.075 M KCl
hypotonic solution and fixed in Carnoy’s fixative. The fixed cell
suspension was spread onto glass slides, and the slides were then
hybridized with a Spectrum Orange-labeled probe for the centromere
locus on chromosome 17 [Centromere enumeration probe 17 (CEP17);
Joko, Tokyo, Japan], as previously described (22). DAPI was used for nuclear staining.
The cells were examined under a fluorescence microscope as
described in the previous section.
Counting of anaphase bridges in primary
CRC
Formalin-fixed paraffin-embedded tissue sections
were stained with hematoxylin and eosin (H&E), and a chromatin
bridge between two anaphase plates was counted as an anaphase
bridge under a microscope.
Collection of publicly available gene
expression and somatic mutation data
Gene expression data for 5,376 samples and somatic
mutation data for 4,025 samples of 12 cancer types (TCGA public
data available in April 2014) were collected from the TCGA data
portal (https://tcga-data.nci.nih.gov/tcga/). The patients’
clinical data were also collected. The expression data were
obtained as processed RNA-sequence (RNA-seq) data in the form of
RNA-seq by Expectation Maximization (RSEM), which is based on a
generative probabilistic model of maximum expectation (23). The somatic mutation data were
obtained in the form of a mutation annotation format (MAF) file.
Cancers from the following organs were analyzed: urinary bladder
(BLCA), breast (BRCA), head and neck (HNSC), kidney (KICH, KIRC and
KIRP), lung (LUAD, LUSC), prostate (PRAD), thyroid gland (THCA) and
uterine corpus (UCEC).
Microarray-based gene expression data for 177 CRCs
and the corresponding patient clinical data, which were previously
published by Smith et al (24), were also downloaded from the GEO at
the National Center for Biotechnology Information (NCBI).
Statistical analysis
The statistical analysis was performed using an
unpaired t-test, Mann-Whitney U test, or Wilcoxon matched pairs
test. Overall survival curves were constructed using the
Kaplan-Meier method, and the log-rank test was used to evaluate the
differences between the curves. The hazard ratio (HR) was
calculated using the Cox proportional hazard model in both
univariate and multivariate analyses. JMP version 9.0 software (SAS
Institute, Cary, NC, USA) was used for the analyses. P<0.05 was
considered statistically significant.
Results
Upregulation of SASS6 mRNA and protein
expression in a subset of primary CRCs
To investigate the status of SASS6 expression in
human primary CRCs, we examined the expression of SASS6 mRNA in 81
primary CRCs using a real-time qRT-PCR analysis and calculated the
ratio of the level of SASS6 mRNA expression in the cancerous
tissues to that in the corresponding non-cancerous tissues (T/N
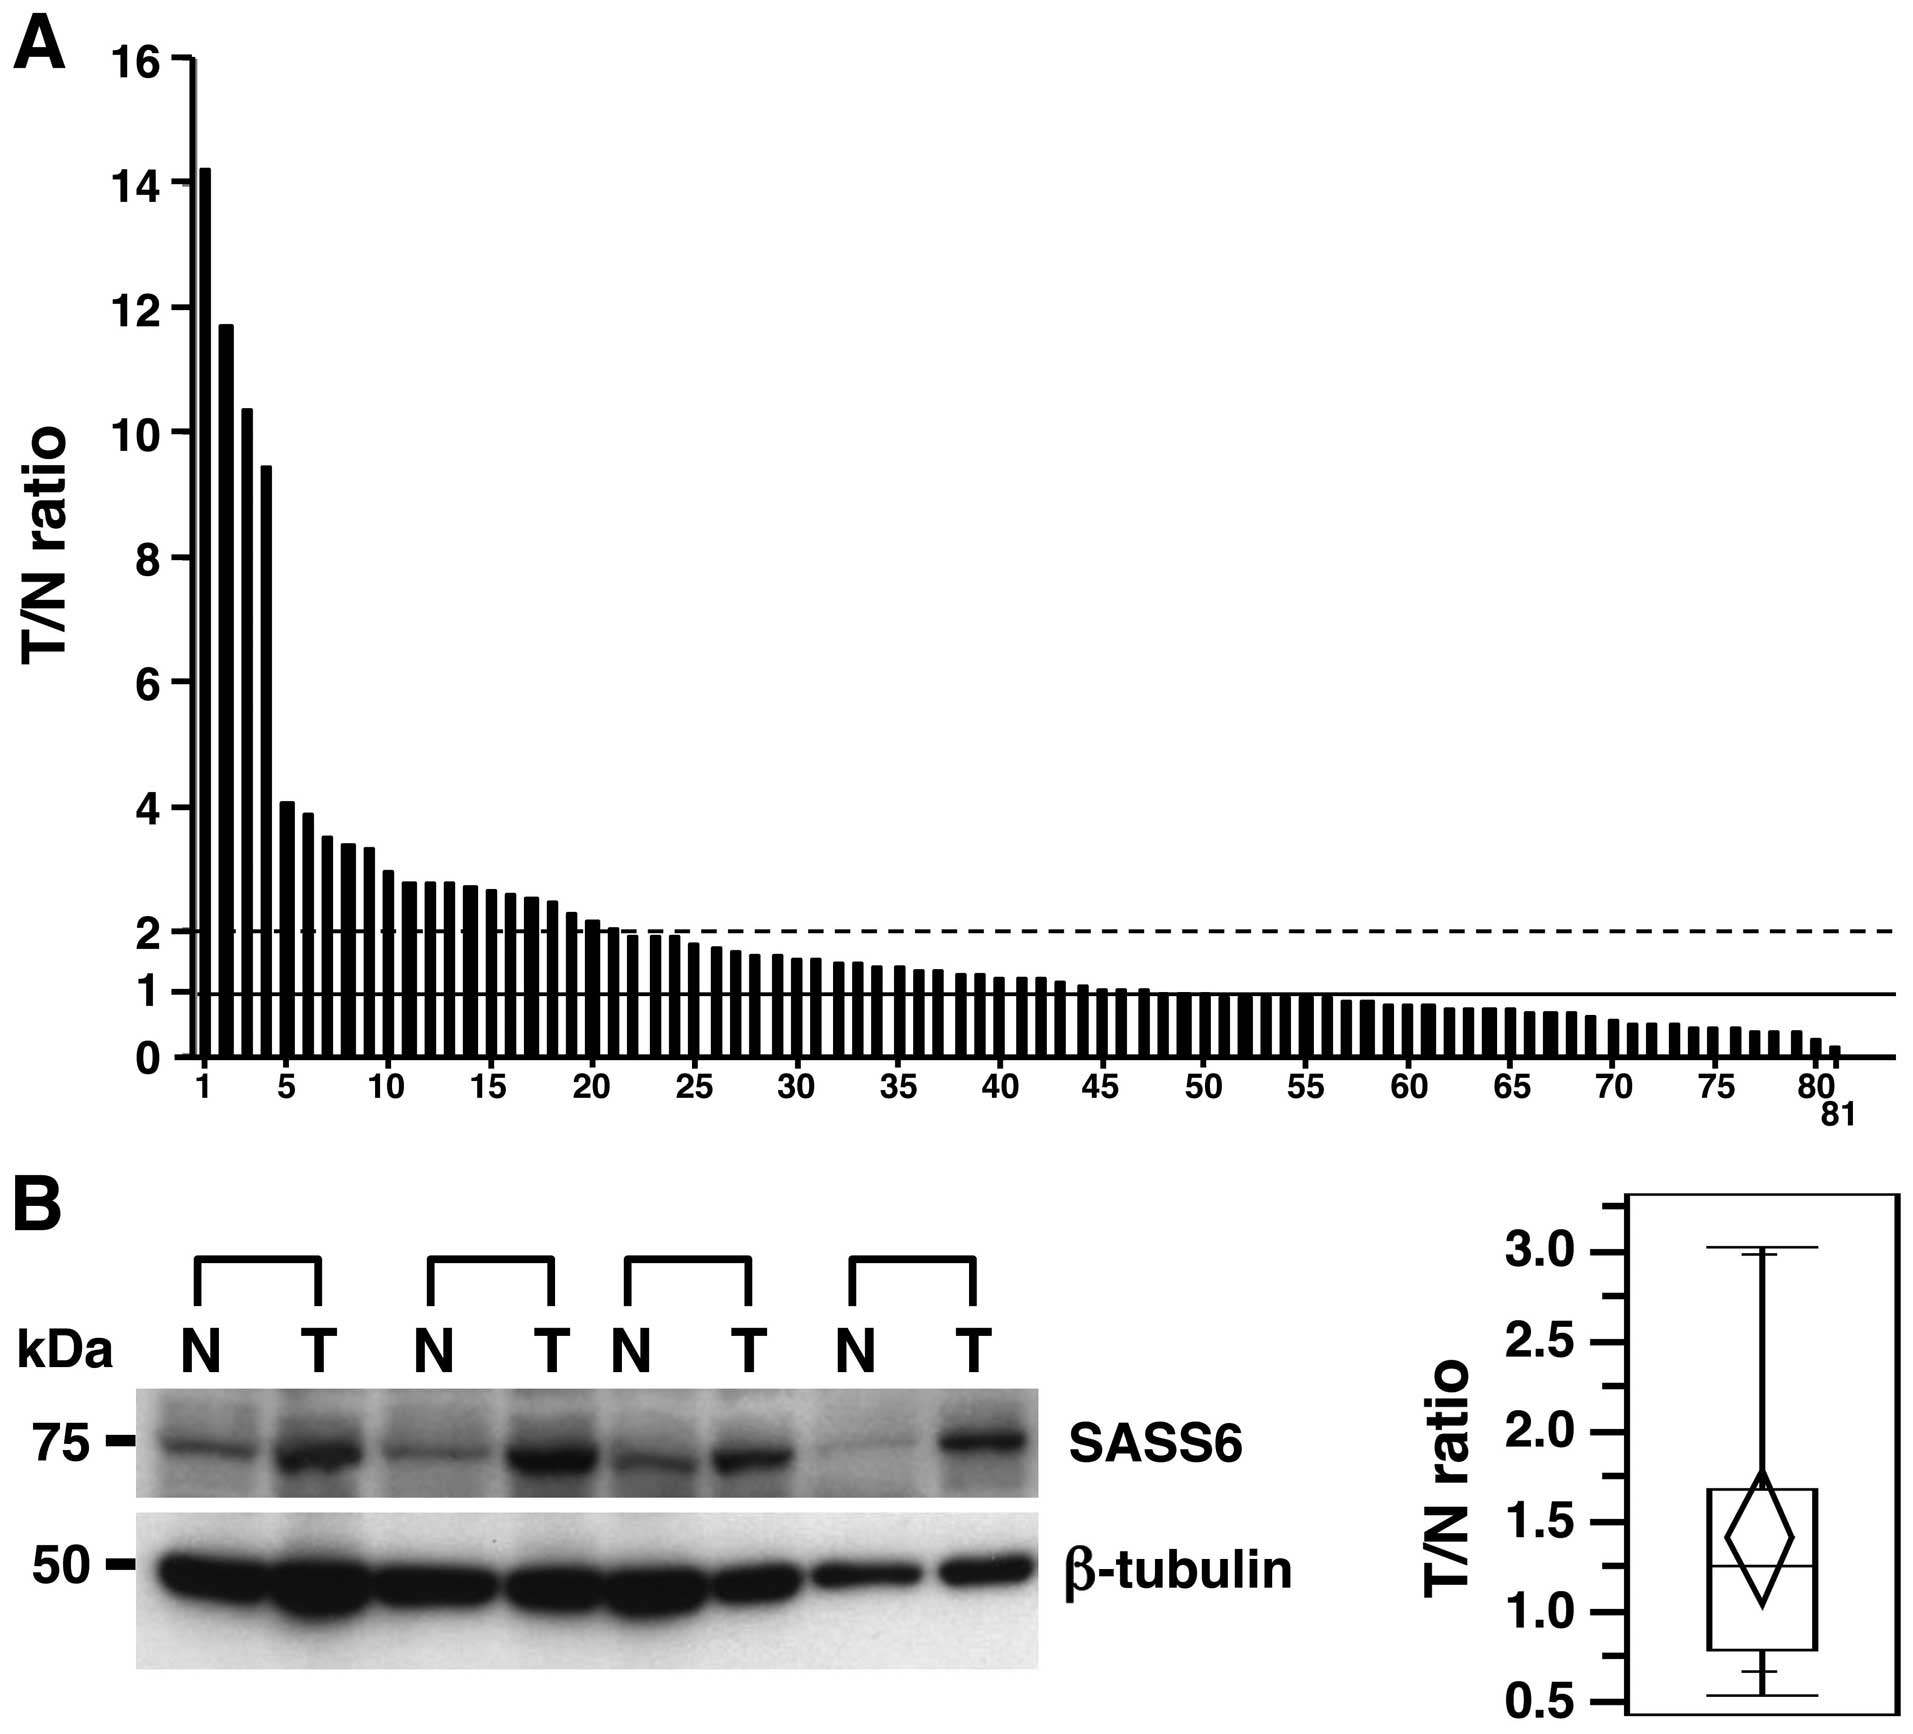
ratio). An increased SASS6 expression level (T/N value >1) was
observed in 49 (60.5%) of the 81 primary CRCs (Fig. 1A). In particular, 21 (25.9%) of the
81 cases had a T/N value ≥2 for the SASS6 expression level.
Moreover, a significant difference in the SASS6 expression level
was detected between the cancerous tissues and the corresponding
non-cancerous tissues when examined using statistical analysis
(P=0.0410, Wilcoxon matched pairs test). These results suggested
that the expression of SASS6 mRNA transcripts is upregulated in
primary CRC. We next examined the expression of SASS6 protein in 19
primary CRCs using a western blot analysis with the anti-SASS6
antibody and calculated the ratio of the level of SASS6 protein
expression in the cancerous tissues to the level in the
corresponding non-cancerous tissues (T/N ratio). A semiquantitative
analysis showed an increased SASS6 protein expression level (T/N
value >1) in 11 (57.9%) of the 19 primary CRCs, with an average
T/N value of 1.42 (Fig. 1B). Both
the mRNA and protein results described above indicate that SASS6
expression was upregulated in a subset of primary CRCs.
Induction of centrosome amplification,
mitotic abnormalities, and chromosomal numerical changes by SASS6
overexpression in colonic cells
To investigate the effect of SASS6 overexpression in
colonic cells, we used the piggyBac transposon vector system
(25) to establish human colonic
cells capable of inducibly expressing SASS6. First, DLD-1 colon
cancer cells were transfected with a piggyBac cumate switch
inducible vector for the expression of SASS6 together with the
piggyBac transposase vector; positively transposed cells were then
selected using puromycin. We also prepared cells transfected with
an empty (parental) piggyBac cumate switch inducible vector and
transposase vector. The expression of SASS6 protein was confirmed
in cells transposed with the SASS6 vector after cumate induction
using western blot analysis with the anti-SASS6 antibody (Fig. 2A). Then, we examined the centrosome
number in the SASS6-transposed cells after cumate induction using
an immunofluorescence analysis of γ-tubulin, a major centrosomal
protein (26,27). The frequency of cells containing ≥3
centrosomes was significantly higher among the SASS6-overexpressing
cells than among the empty vector-transposed cells (average: 0.9
vs. 13.3%, P<0.001, t-test) (Fig.
2B). This result suggests that the upregulation of SASS6
expression causes centrosome amplification in colonic cells. Next,
we attempted to determine whether the increased frequency of
centrosome amplification in the SASS6-overexpressing colonic cells
resulted in mitotic chromosomal abnormalities. When mitotic phase
cells were examined after cumate induction, the percentage of
metaphase cells with misaligned chromosomes was significantly
higher for the SASS6-overexpressing cells (average: 3.4 vs. 21.3%,
P<0.001, t-test) (Fig. 2C).
Moreover, the percentage of anaphase/telophase cells with a
chromosome bridge and/or lagging chromosomes was also significantly
higher for the SASS6-overexpressing cells (average: 2.5 vs. 15.1%,
P<0.001, t-test) (Fig. 2C).
These results suggested that SASS6 overexpression is associated
with mitotic abnormalities in colonic cells. Next, to investigate
the effect of SASS6 overexpression on the number of chromosomes,
the chromosome 17 number per cell was compared before and after
cumate induction using FISH analysis with CEP17. The results showed
that the percentage of cells with an abnormal chromosome 17 number
was higher for the SASS6-overexpressing cells (average: 3.3 vs.
7.5%, P<0.01, t-test) (Fig. 2D),
suggesting that SASS6 overexpression is associated with changes in
the chromosomal number (such as CIN) in colonic cells. Based on the
above findings, SASS6 overexpression was thought to contribute to
centrosome amplification, mitotic abnormalities and CIN in colonic
cells.
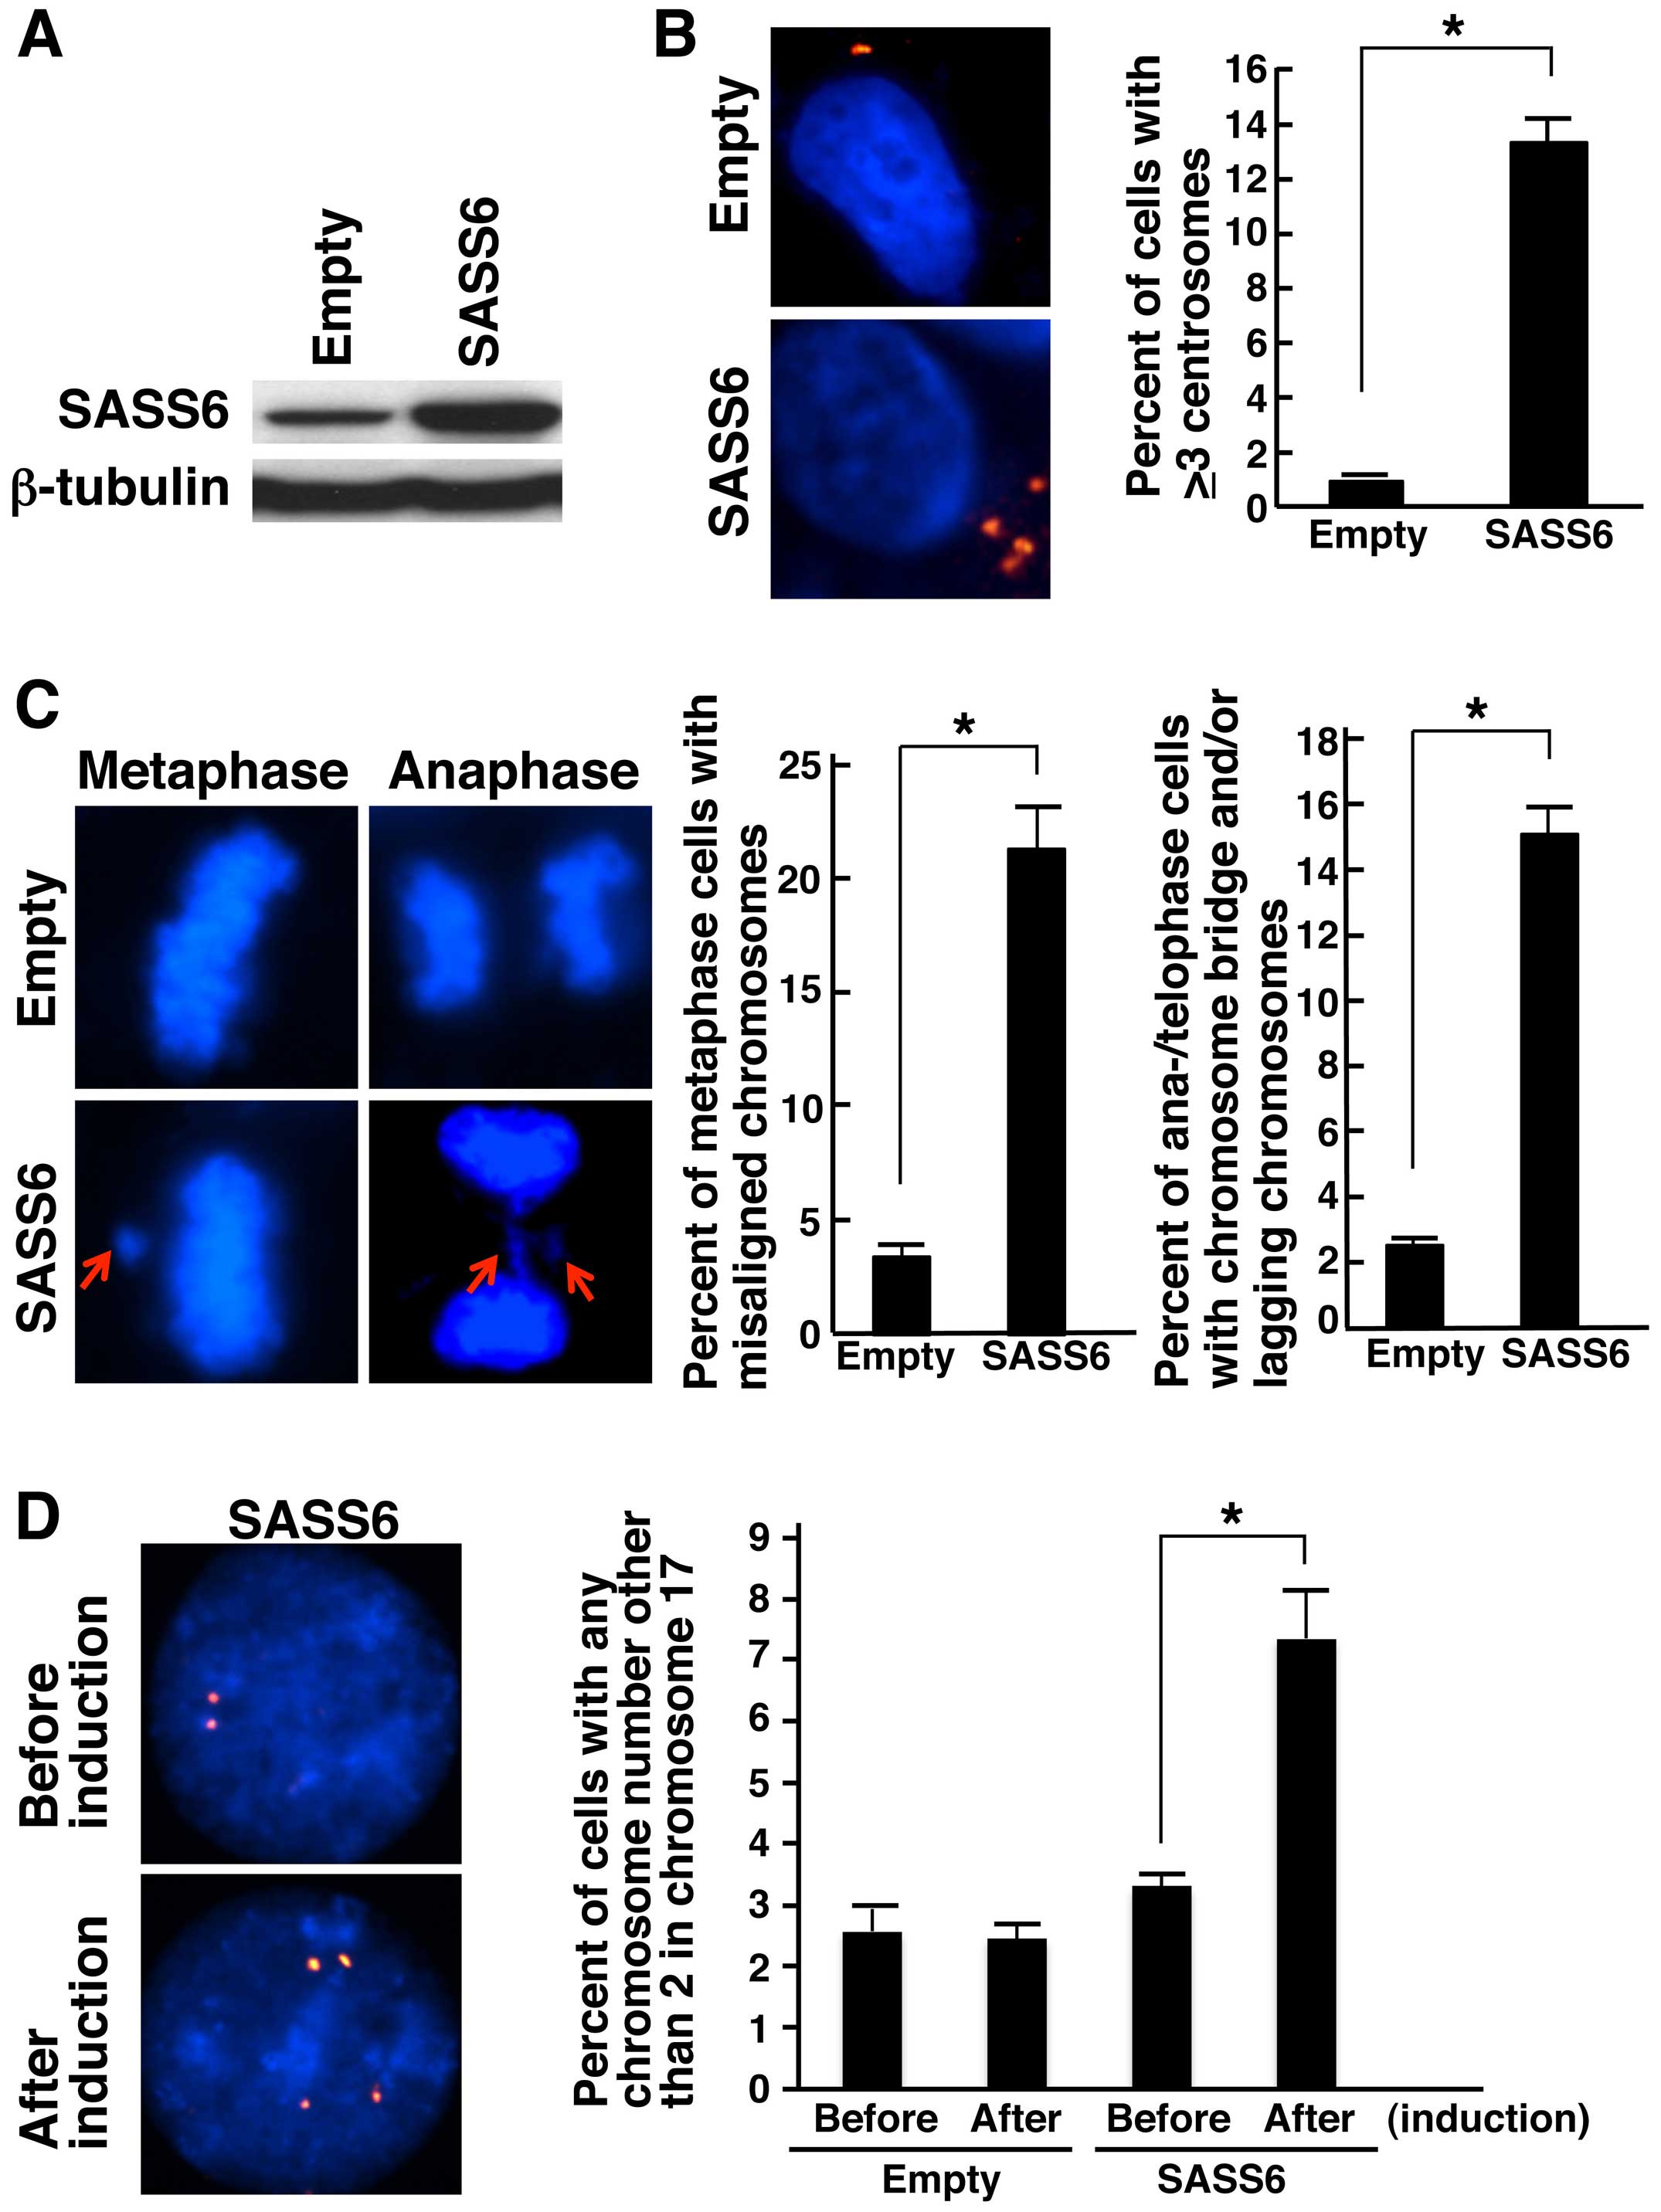 | Figure 2Induction of centrosome
amplification, mitotic chromosome abnormalities and chromosomal
numerical changes in response to SASS6 overexpres-sion in colon
cancer cells. (A) Detection of SASS6 proteins in cumate-inducible
stable DLD-1 colon cancer cell lines designed to express SASS6 in
the presence of cumate; the SASS6 proteins were detected using
western blot analysis with an anti-SASS6 antibody. Lysates from
empty vector-transposed cells and cells inducibly expressing SASS6
were analyzed. β-tubulin protein was also analyzed as an internal
control. (B) Induction of centrosome amplification in DLD-1 cells
as a result of SASS6 overexpression. At 72 h after cumate addition,
the cells were immunostained with mouse anti-γ-tubulin monoclonal
antibody (red). The nuclei were stained with DAPI (blue). The
number of centrosomes per cell was counted, and the counts are
shown in the right bar graph. A t-test was performed for the
statistical analysis (P<0.001). (C) Induction of mitotic
chromosome abnormalities in response to SASS6 overexpression in
DLD-1 cells. At 72 h after cumate addition, the cells were fixed
and the nuclei were stained with DAPI (blue). The percentages of
metaphase cells with misaligned chromosomes were determined, and
the percentages are shown in the left bar graph. The percentages of
anaphase/telophase cells with chromosome bridges and/or lagging
chromosomes were also determined, and the percentages are shown in
the right bar graph. A t-test was used to perform the statistical
analysis in each comparison (P<0.001). (D) Induction of
chromosomal numerical changes in response to SASS6 overexpression
in colon cancer cells. At 72 h after cumate addition, the DLD-1
cells were replated in fresh medium without cumate, cultured for an
additional 72 h, and then subjected to FISH analysis using a
Spectrum Orange-labeled probe for the centromere locus on
chromosome 17, CEP17. Cells before cumate induction were also
subjected to FISH analysis. The nuclei were stained with DAPI
(blue). The percentages of cells with an abnormal chromosome 17
number were determined, and the percentages are shown in the right
bar graph. A t-test was used to perform the statistical
analysis (P<0.01). |
Increased anaphase bridge formation in
primary CRCs with SASS6 overexpression
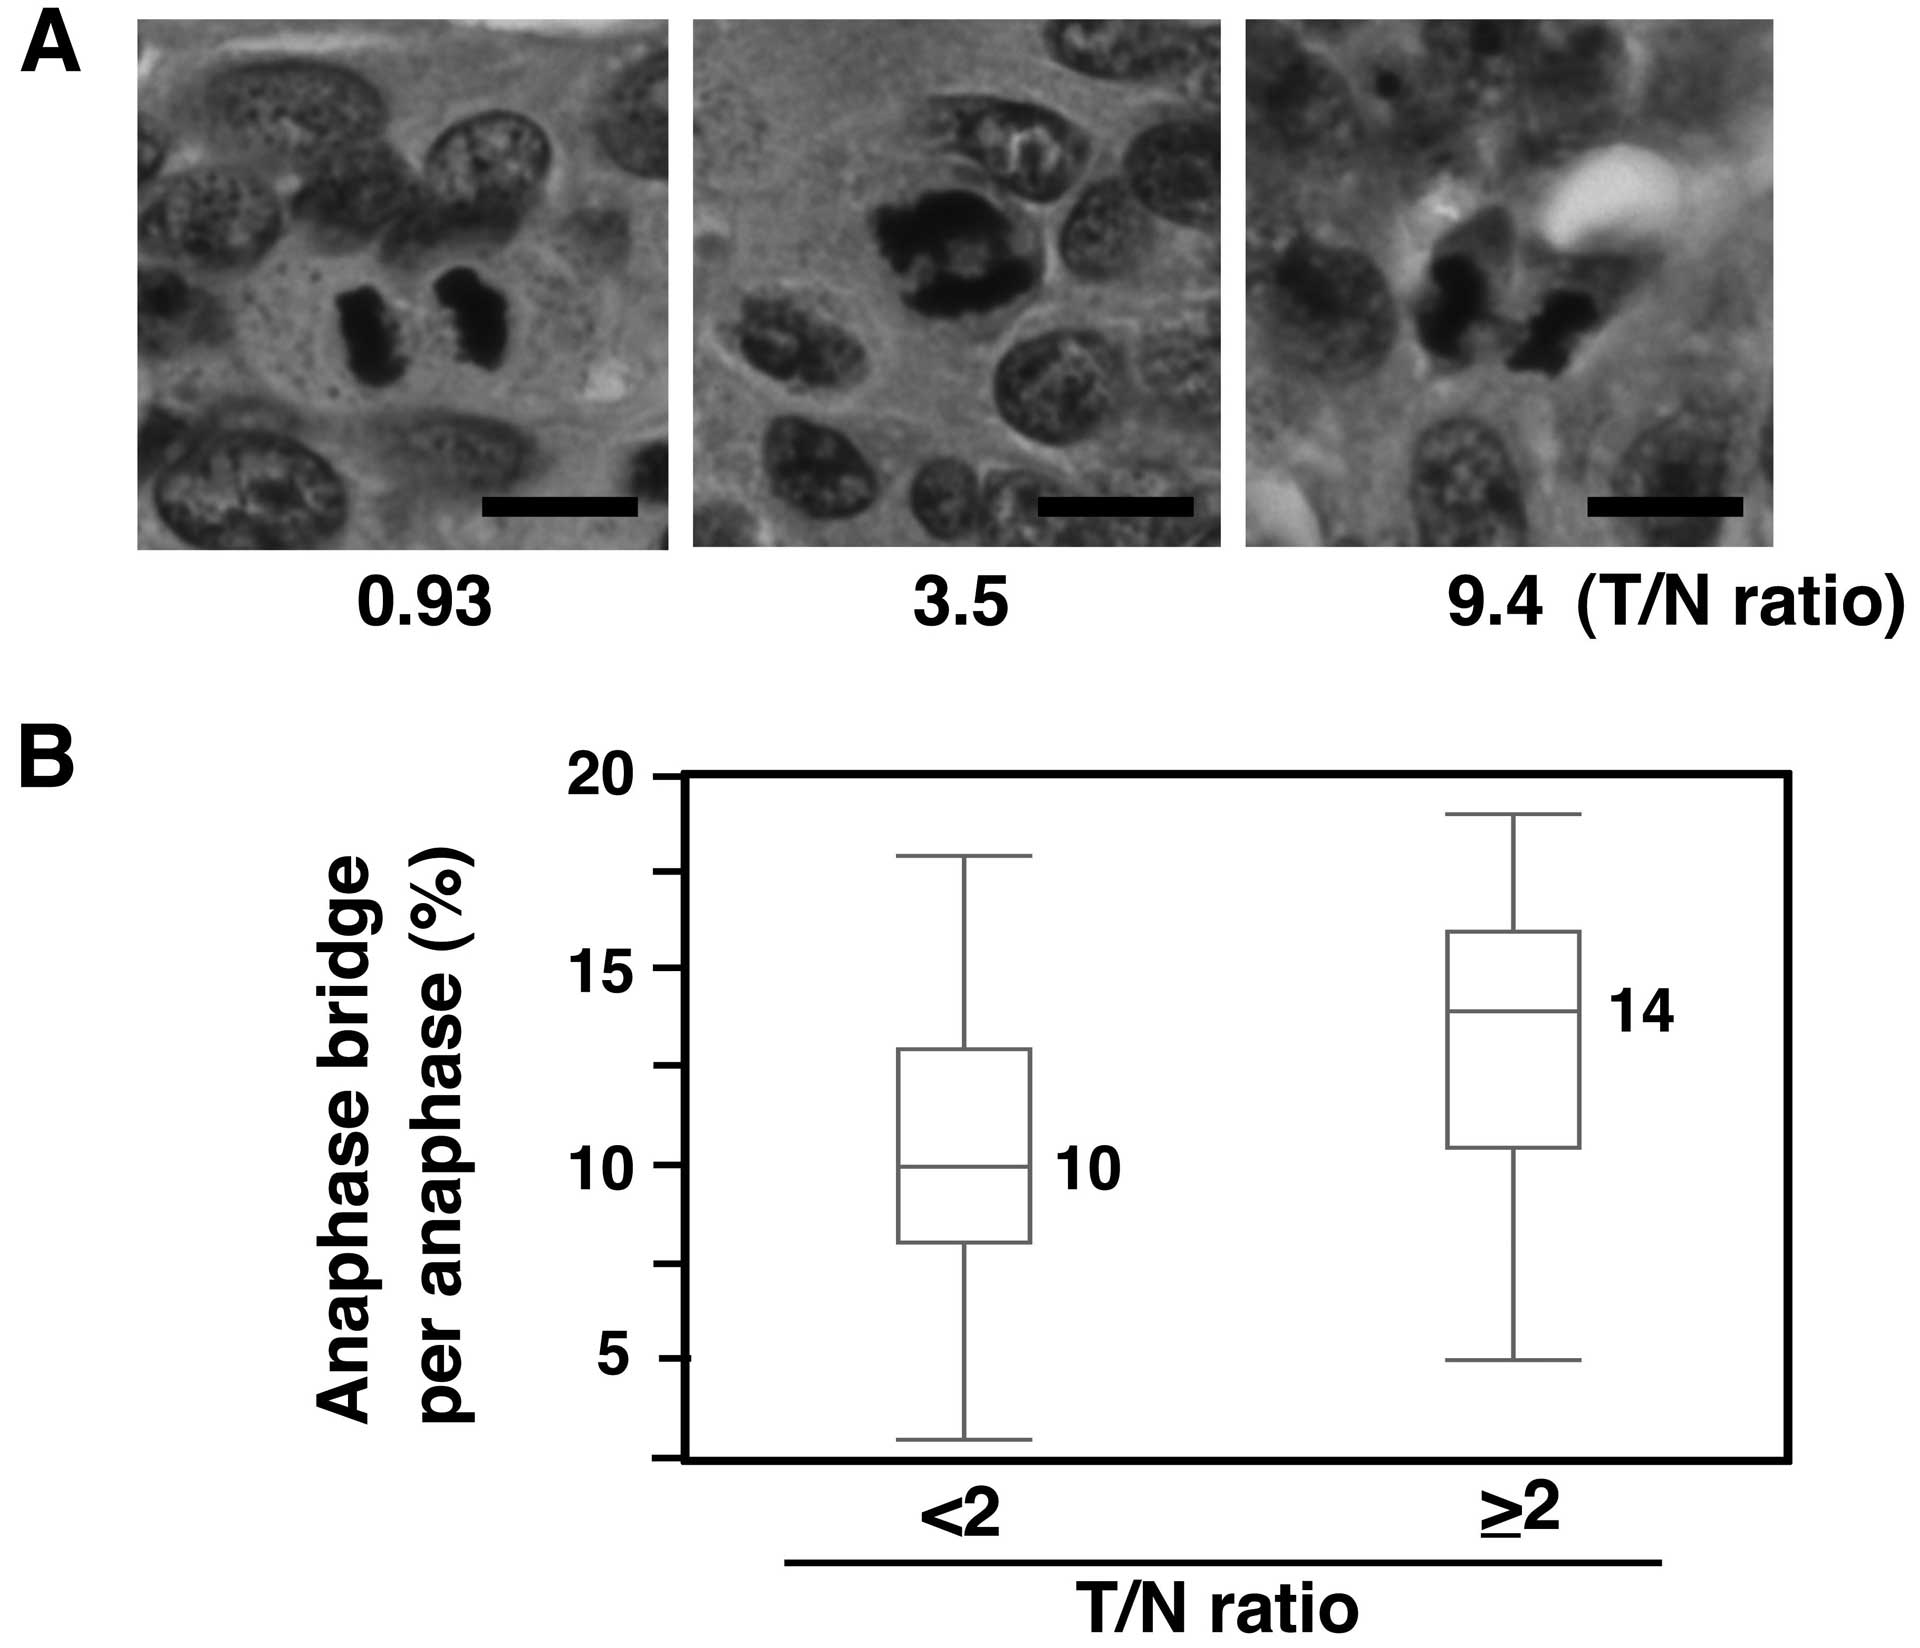
We next investigated whether mitotic chromosomal
aberrations were also associated with SASS6 overexpression in
primary CRCs. The presence of bridge formation in anaphase cells
was examined using H&E-stained sections from the 81 CRCs that
were used in the SASS6 mRNA expression analysis. A T/N ratio of 2
was used as the cut-off value, such as for defining a higher SASS6
expression group (T/N ≥2) and a lower SASS6 expression group (T/N
<2). As a result, a significantly higher frequency of anaphase
bridge formation was observed in the higher SASS6 expression group,
compared with the lower SASS6 expression group (median: 14 vs. 10%,
P<0.01, Mann-Whitney U test) (Fig.
3). These results suggest that SASS6 overexpression is
associated with anaphase bridge formation, which is a type of
mitotic chromosomal aberration, in primary CRC.
Association between SASS6 overexpression
and a poor survival outcome in colon cancer
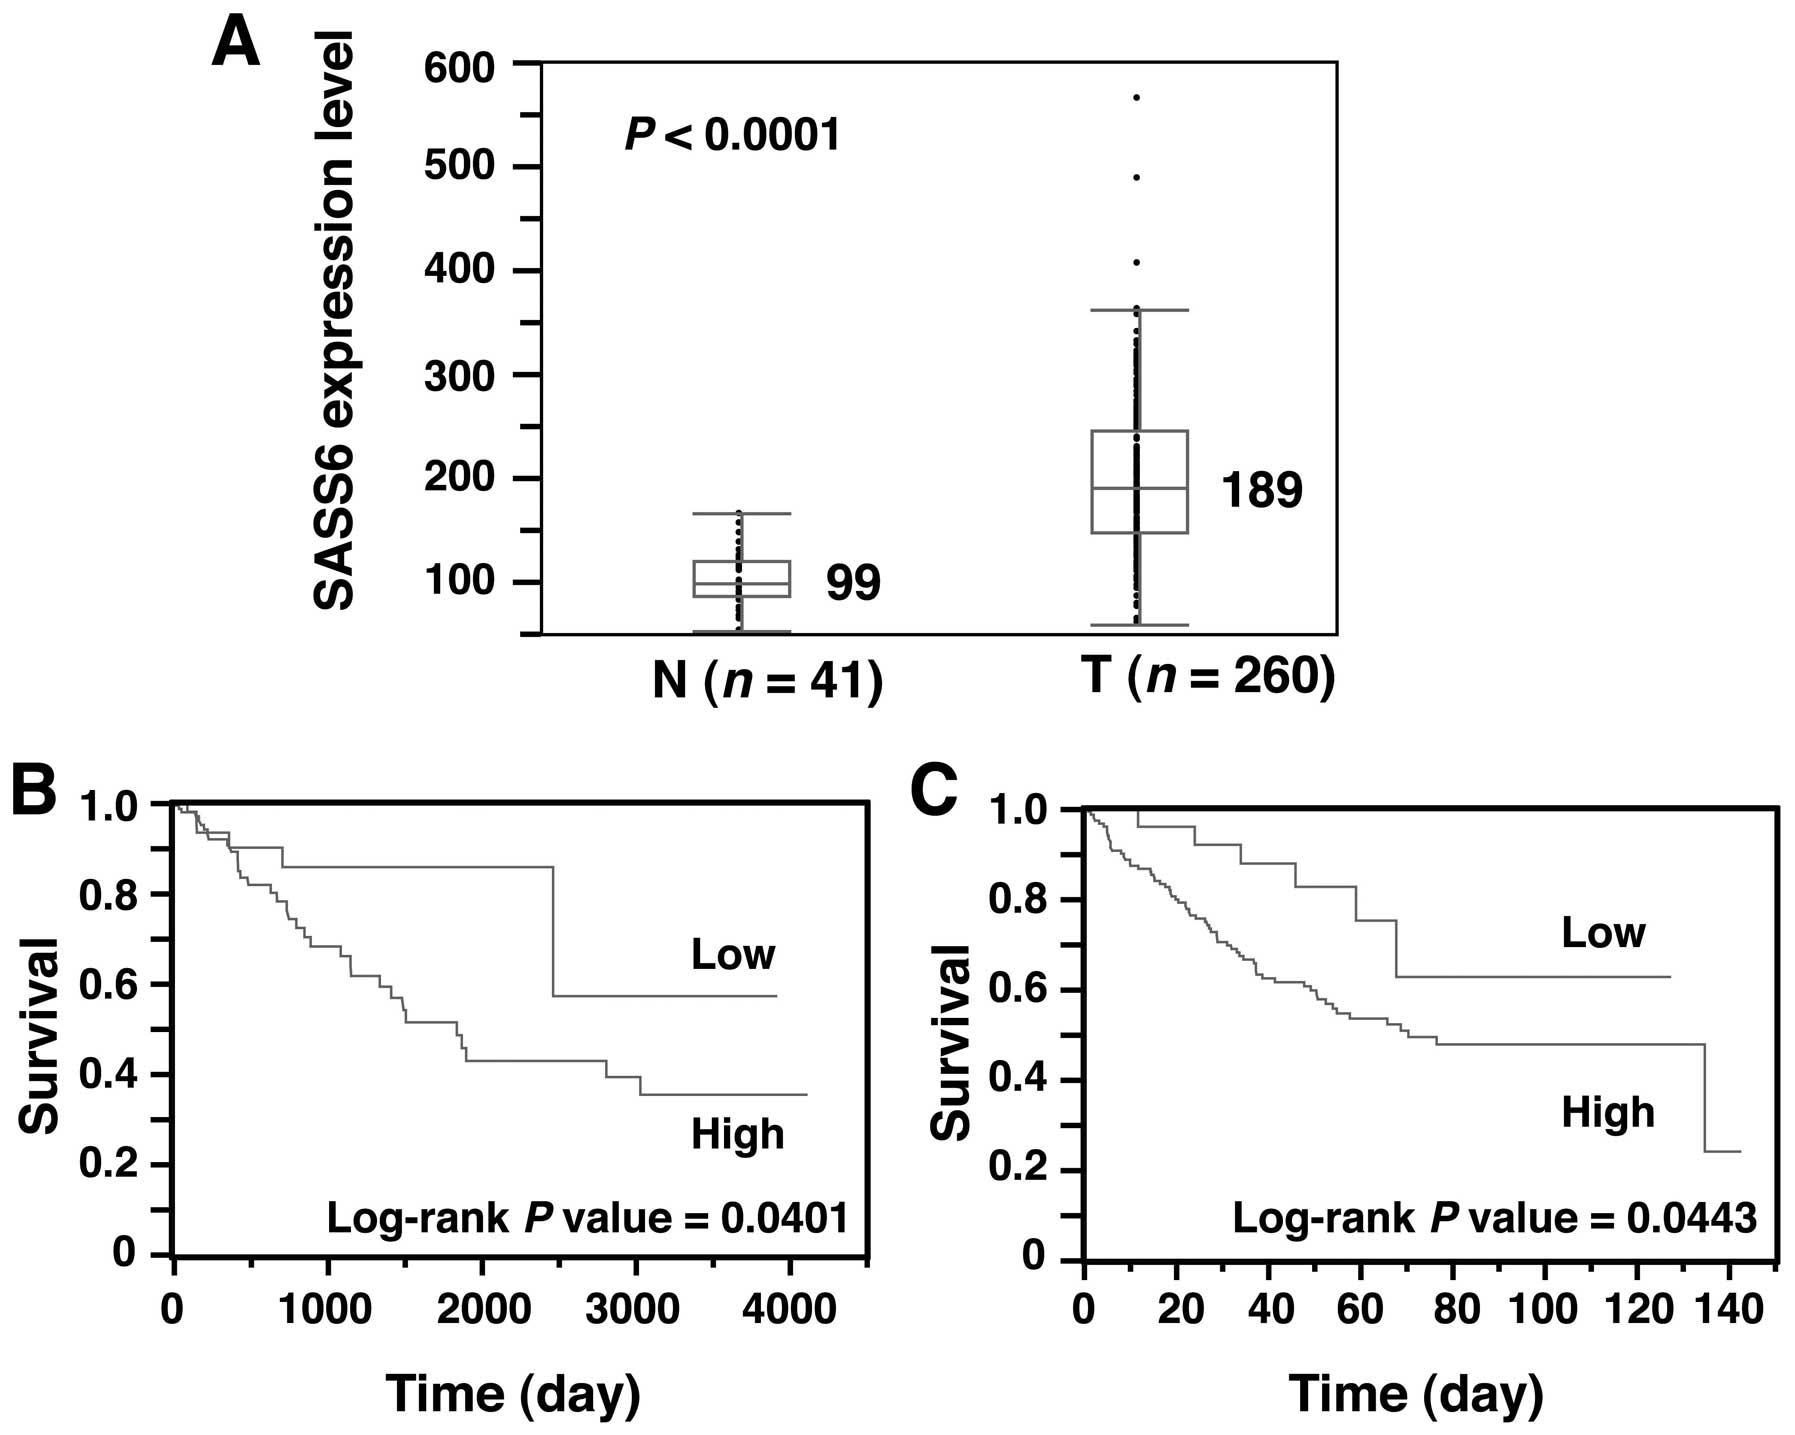
Next, to obtain solid evidence of SASS6
overexpression in CRC, we examined the SASS6 expression level of
another cohort of colon cancer from the TCGA dataset (28). The SASS6 expression level, as
determined using an RNA-seq analysis, was significantly higher in
colon adenocarcinoma (n=260) than that in the non-cancerous colonic
tissues (n=41) (P<0.0001, Mann- Whitney U test) (Fig. 4A). These results support our
conclusion that SASS6 is overexpressed in CRC.
Next, we investigated whether the SASS6 level is
associated with survival in patients with colon cancer. A
Kaplan-Meier analysis for a total of 257 colon adenocarcinoma
patients showed that the prognosis of patients with colon
adenocarcinoma exhibiting a relatively high SASS6 expression level
was significantly poorer than the prognosis of patients with colon
adenocarcinoma exhibiting a relatively low SASS6 expression level
(P=0.0401, log-rank test) (Fig.
4B). To rule out potential factors that may have confounded the
SASS6 expression results, we conducted univariate and multivariate
analyses for overall survival, using the Cox proportional hazard
model (Table I). An advanced stage
(III and IV) and a high SASS6 expression level were associated with
significantly elevated risks of a poor survival outcome in both the
univariate and multivariate analyses. The HR of the former and
latter factors in the multivariate analyses were 2.372 [95%
confidence interval (CI), 1.236–4.694, P=0.0093] and 2.805 (95% CI,
1.244–7.512, P=0.0112), respectively. We also assessed the
prognostic impact of SASS6 overexpression on colon cancer in
another cohort collected by Smith et al (24). A Kaplan-Meier analysis of the
expression and clinical data for a total of 177 colon cancer
patients whose data were included in the GEO showed that SASS6
overex-pression was associated with a poorer survival outcome in
the patients with colon cancer (P=0.0443, log-rank test) (Fig. 4C). Moreover, multivariate analysis
examining overall survival using the Cox proportional hazard model
showed that SASS6 overexpression was associated with a
significantly increased risk of a poor survival outcome (HR, 2.134;
95% CI, 1.003–5.522; P=0.0489) (Table
II). Thus, the results of these two cohort studies both suggest
that SASS6 overexpression is an independent predictor of a poor
survival outcome in patients with colon cancer.
 | Table ICox proportional hazard analysis of
potential predictors of a poor prognosis in colon adenocarcinoma
patients (n=257) using data from the TCGA database. |
Table I
Cox proportional hazard analysis of
potential predictors of a poor prognosis in colon adenocarcinoma
patients (n=257) using data from the TCGA database.
| Variable | Univariate analysis
| Multivariate
analysis
|
|---|
| HR (95% CI) | P-value | HR (95% CI) | P-value |
|---|
| Gender | | | | |
| Male | 1.619
(0.867–3.137) | 0.1317 | | |
| Female | 1 | | | |
| Age (years) | | | | |
| ≥60 | 1.525
(0.740–3.551) | 0.2656 | | |
| <60 | 1 | | | |
| Stage | | | | |
| III, IV | 1.999
(1.054–3.914) | 0.0337 | 2.372
(1.236–4.694) | 0.0093 |
| I, II | 1 | | 1 | |
| SASS6
expressiona | | | | |
| High | 2.415
(1.090–6.396) | 0.0284 | 2.805
(1.244–7.512) | 0.0112 |
| Low | 1 | | 1 | |
| Table IICox proportional hazard analysis of
potential predictors of a poor prognosis in colorectal cancer
patients (n=177) using data from the GEO database. |
Table II
Cox proportional hazard analysis of
potential predictors of a poor prognosis in colorectal cancer
patients (n=177) using data from the GEO database.
| Variable | Univariate analysis
| Multivariate
analysis
|
|---|
| HR (95% CI) | P-value | HR (95% CI) | P-value |
|---|
| Gender | | | | |
| Male | 1.179
(0.741–1.899) | 0.4901 | | |
| Female | 1 | | | |
| Age (years) | | | | |
| ≥60 | 0.881
(0.548–1.451) | 0.6106 | | |
| <60 | 1 | | | |
| Stage | | | | |
| III, IV | 4.220
(2.454–7.733) | <0.0001 | 4.140
(2.406–7.589) | <0.0001 |
| I, II | 1 | | 1 | |
| SASS6
expressiona | | | | |
| High | 2.302
(1.084–5.954) | 0.0283 | 2.134
(1.003–5.522) | 0.0489 |
| Low | 1 | | 1 | |
SASS6 overexpression in diverse human
cancers
Next, to investigate the SASS6 expression level in
various human cancers, we examined the SASS6 expression level
determined using an RNA-seq analysis across a panel of 11 distinct
cancer types utilizing the TCGA data. The results showed that SASS6
expression was significantly upregulated in a modest manner in the
cancerous tissues of the following 8 cancer types, compared with
non-cancerous tissues (Mann-Whitney U test): bladder urothelial
carcinoma (P<0.0001), breast invasive carcinoma (P<0.0001),
head and neck squamous cell carcinoma (P<0.0001), kidney renal
clear cell carcinoma (P<0.0001), lung adenocarcinoma
(P<0.0001), lung squamous cell carcinoma (P<0.0001), prostate
adenocarcinoma (P=0.0012), and uterine corpus endometrial carcinoma
(P<0.0001) (Fig. 5). The result
suggested that SASS6 expression is upregulated in diverse human
cancers.
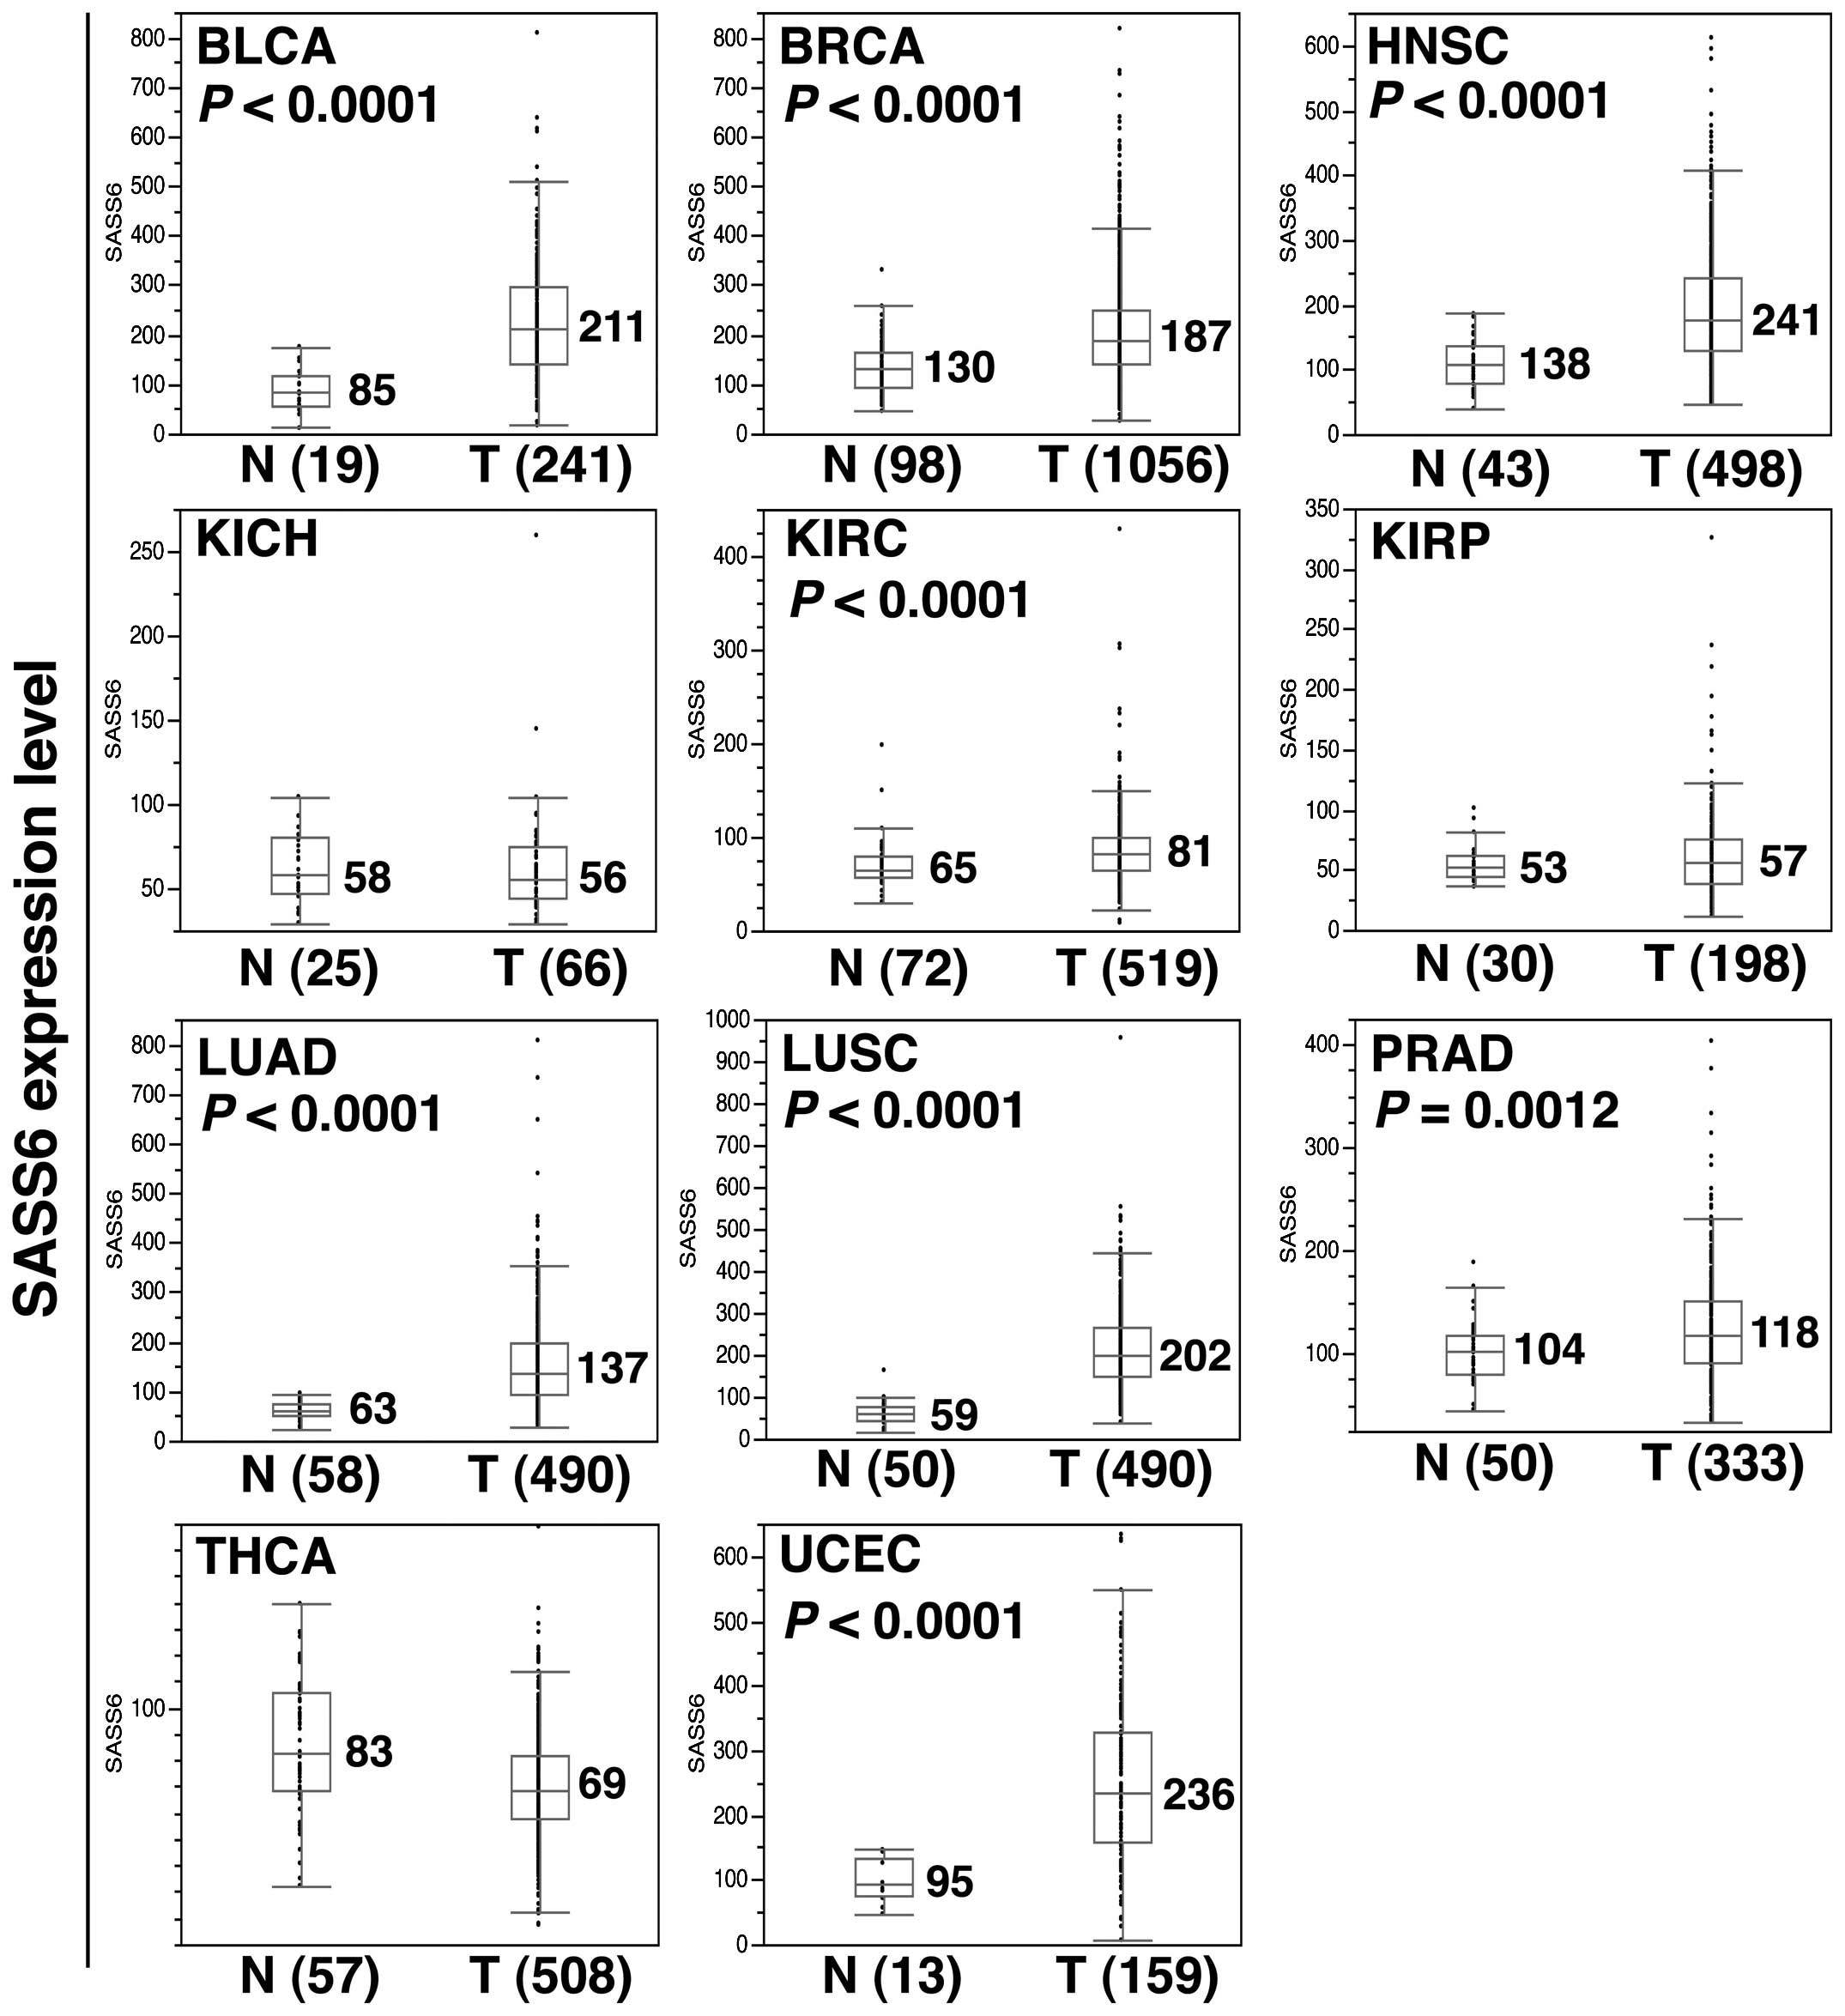 | Figure 5Upregulation of SASS6 mRNA expression
in diverse human cancers. A box-plot analysis was performed for
SASS6 mRNA expression data (RSEM data) from the following 11 cancer
types: BLCA, bladder urothelial carcinoma; BRCA, breast invasive
carcinoma; HNSC, head and neck squamous cell carcinoma; KICH,
kidney chromophobe renal cell carcinoma; KIRC, kidney renal clear
cell carcinoma; KIRP, kidney renal papillary cell carcinoma; LUAD,
lung adenocarcinoma; LUSC, lung squamous cell carcinoma; PRAD,
prostate adenocarcinoma; THCA, thyroid carcinoma; and UCEC, uterine
corpus endometrial carcinoma. A Mann-Whitney U test was used to
perform the statistical analysis and a P-value was provided if the
upregulation of SASS6 expression was detected in the tumor. |
Association between SASS6 overexpression
and a poor survival outcome in cancers other than colon cancer
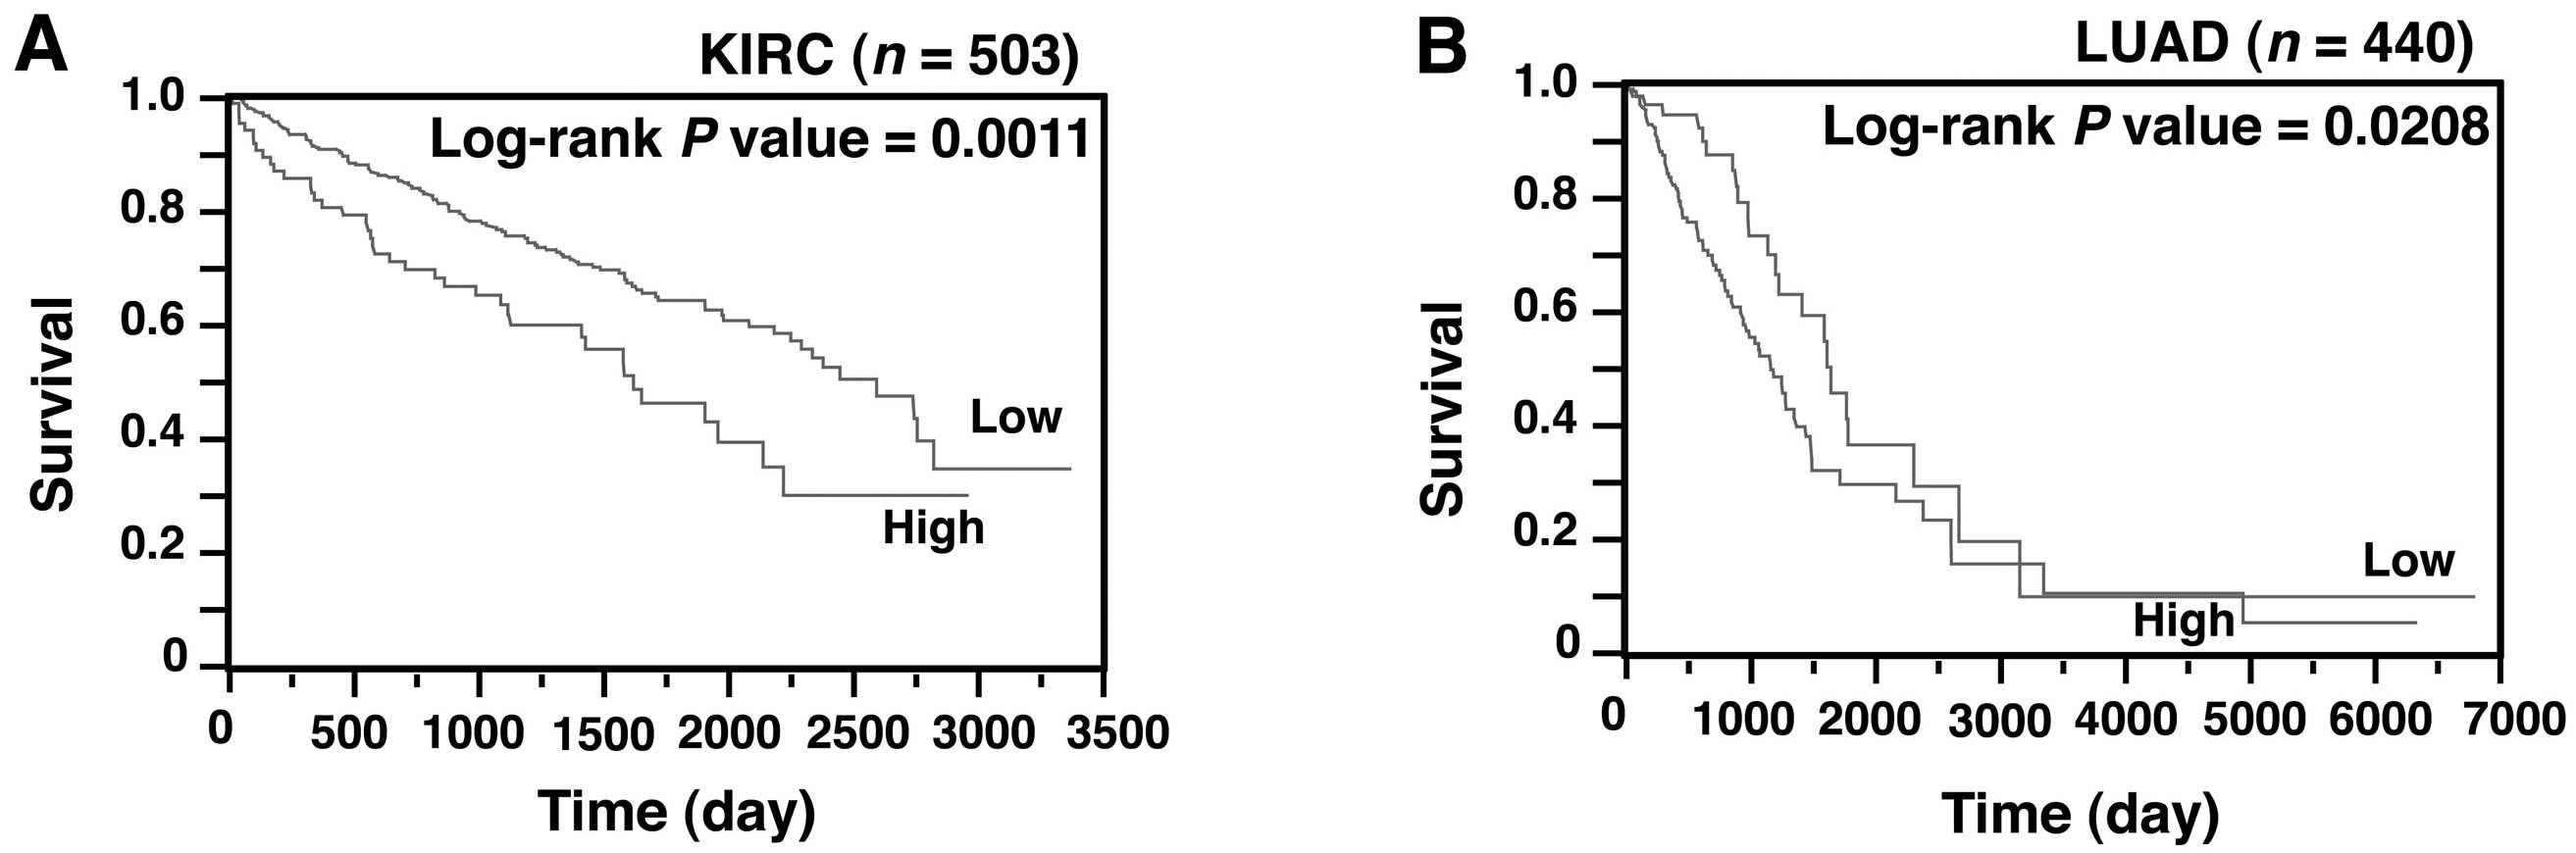
We next investigated whether the SASS6 level was
also associated with survival in patients with cancer other than
colon cancer. A Kaplan-Meier analysis showed that SASS6
overexpression was associated with a poorer outcome in patients
with kidney renal clear cell carcinoma (P=0.0011) (Fig. 6A) and those with lung adenocarcinoma
(P=0.0208) (Fig. 6B). Moreover, a
multivariate analysis using the Cox proportional hazard model
showed that SASS6 overexpression was associated with a
significantly increased risk of a poor outcome in patients with
kidney renal clear cell carcinoma (HR, 1.515, 95% CI, 1.039–2.162,
P=0.0316) (Table III) and those
with lung adenocarcinoma (HR, 1.599; 95% CI, 1.030–2.578; P=0.0359)
(Table IV). These results, along
with the results for colon cancer, suggest that SASS6
overexpression is an independent predictor of a poor survival
outcome in patients with some types of cancers.
| Table IIICox proportional hazard analysis of
potential predictors of a poor prognosis in kidney renal clear cell
carcinoma patients (n=503) using data from the TCGA database. |
Table III
Cox proportional hazard analysis of
potential predictors of a poor prognosis in kidney renal clear cell
carcinoma patients (n=503) using data from the TCGA database.
| Variable | Univariate analysis
| Multivariate
analysis
|
|---|
| HR (95% CI)a | P-value | HR (95% CI) | P-value |
|---|
| Gender | | | | |
| Male | 0.926
(0.673–1.287) | 0.6444 | | |
| Female | 1 | | | |
| Years | | | | |
| ≥60 | 1.800
(1.294–2.538) | 0.0004 | 1.536
(1.101–2.170) | 0.0112 |
| <60 | 1 | | | |
| Stage | | | | |
| III, IV | 4.194
(3.012–5.919) | <0.0001 | 3.824
(2.733–5.423) | <0.0001 |
| I, II | 1 | | 1 | |
| SASS6
expressionb | | | | |
| High | 1.805
(1.245–2.561) | 0.0022 | 1.515
(1.039–2.162) | 0.0316 |
| Low | 1 | | 1 | |
| Table IVCox proportional hazard analysis of
potential predictors of a poor prognosis in lung adenocarcinoma
patients (n=440) using data from the TCGA database. |
Table IV
Cox proportional hazard analysis of
potential predictors of a poor prognosis in lung adenocarcinoma
patients (n=440) using data from the TCGA database.
| Variable | Univariate analysis
| Multivariate
analysis
|
|---|
| HR (95% CI)a | P-value | HR (95% CI) | P-value |
|---|
| Gender | | | | |
| Male | 0.954
(0.652–1.387) | 0.8040 | | |
| Female | 1 | | | |
| Years | | | | |
| ≥60 | 0.989
(0.655–1.533) | 0.9596 | | |
| <60 | 1 | | | |
| Stage | | | | |
| III, IV | 2.712
(1.835–3.974) | <0.0001 | 2.640
(1.783–3.873) | <0.0001 |
| I, II | 1 | | 1 | |
| SASS6
expressiona | | | | |
| High | 1.698
(1.097–2.732) | 0.0167 | 1.599
(1.030–2.578) | 0.0359 |
| Low | 1 | | 1 | |
Low incidence of somatic SASS6 mutations
in human cancer
Finally, the presence of a somatic SASS6
mutation, another type of cancer-specific genetic alteration, was
examined in 12 cancer types including colon cancer using TCGA data.
The incidence of somatic nonsynonymous mutations of the
SASS6 gene was 0 to 3.2% among the cancers; if all the
cancer cases were combined, the incidence was 0.7% (29 out of 4,025
analyzed cases) (Table V). These
results indicate that the influence of somatic mutations on SASS6
activation or inactivation is extemely limited.
| Table VIncidence of somatic nonsynonymous
mutations of the SASS6 gene in human cancers using data from
the TCGA database. |
Table V
Incidence of somatic nonsynonymous
mutations of the SASS6 gene in human cancers using data from
the TCGA database.
| Cancer type | TCGA ID | No. of cases
analyzed | No. of cases with
nonsynonymous mutations | Incidence (%) |
|---|
| Bladder urothelial
carcinoma | BLCA | 130 | 0 | 0.0 |
| Breast invasive
carcinoma | BRCA | 991 | 4 | 0.4 |
| Colon
adenocarcinoma | COAD | 269 | 7 | 2.6 |
| Head and neck
squamous cell carcinoma | HNSC | 509 | 1 | 0.2 |
| Kidney chromophobe
renal cell carcinoma | KICH | 66 | 0 | 0.0 |
| Kidney renal clear
cell carcinoma | KIRC | 235 | 1 | 0.4 |
| Kidney renal
papillary cell carcinoma | KIRP | 171 | 1 | 0.6 |
| Lung
adenocarcinoma | LUAD | 561 | 5 | 0.9 |
| Lung squamous cell
carcinoma | LUSC | 178 | 2 | 1.1 |
| Prostate
adenocarcinoma | PRAD | 261 | 0 | 0.0 |
| Thyroid
carcinoma | THCA | 406 | 0 | 0.0 |
| Uterine corpus
endometrial carcinoma | UCEC | 248 | 8 | 3.2 |
| Total | | 4,025 | 29 | 0.7 |
Discussion
In the present study, the SASS6 mRNA and protein
expression levels were shown to be upregulated in ~60% of primary
CRCs. To clarify the effect of SASS6 overexpression on colonic
cells, we established DLD-1 colon cancer cells inducibly expressing
SASS6; using this cell system, we then showed that SASS6
overexpression induced centrosome amplification, mitotic
abnormalities such as chromosomal misalignment and lagging
chromosome and CIN. In primary CRCs, moreover, SASS6 overexpression
was shown to be associated with an increase in anaphase bridge
formation. SASS6 upregulation in colon cancer was also revealed
using TCGA data and was associated with a relatively poor survival
outcome in analyses using both the TCGA and GEO data. Finally,
SASS6 expression was shown to be upregulated in a modest manner not
only in colon cancer, but also in 8 other distinct cancer types and
SASS6 upregulation was also associated with a relatively poor
survival outcome in patients with two cancer types other than colon
cancer. These results suggest that SASS6 overexpression may be
involved in the pathogenesis of CRC through the induction of
centrosome amplification, mitotic abnormalities and CIN and SASS6
overexpression may be a predictor of a poor survival outcome in
patients with colon cancer. The TCGA data also suggested that SASS6
overexpression is a phenomenon that is relatively common in human
cancer. These findings may partly explain the earlier observation
of a high prevalence of centrosome amplification and CIN in human
cancers. According to our knowledge, the present study is the first
study to describe aberrant SASS6 expression in human cancer.
In the present study, SASS6 overexpression was
observed in primary CRCs from both our patient series and the TCGA
dataset. As demonstrated in our analysis, centrosome amplification,
mitotic chromosome abnormalities, and CIN were induced by SASS6
overexpression in colonic cells, and the frequent appearance of
centrosome and chromosome abnormalities in CRC has been previously
reported (3,5,29,30).
Thus, SASS6 overexpression may contribute to the development of CRC
via the induction of centrosome and chromosome abnormalities.
Notably, SASS6 overexpression was also observed in 8 other cancer
types including cancers of the urinary bladder, breast, uterus,
head and neck, kidney, liver, lung and prostate, indicating that
SASS6 upregulation is a relatively common genetic abnormality in
human cancer. At present, the mechanism underlying the upregulation
of SASS6 expression remains uncertain. However, some possibilities,
such as the cancer-specific abnormal expression of miRNAs
controlling the level of SASS6 mRNA transcripts or transcription
factors regulating SASS6 expression or cancer-specific SASS6
gene amplification, can be suggested in view of previous studies
regarding gene overexpression in cancer (31–33).
Future studies examining these points should help to clarify the
cause of SASS6 upregulation.
Our demonstration of the induction of centrosome
amplifi-cation by SASS6 overexpression in colonic cells was
consistent with the results of previous studies describing the
induction of centrosome amplification by the ectopic expression of
SASS6 in U2OS osteosarcoma cells (11,12,15,16).
As possible mechanisms linking centrosome amplification to CIN,
centrosome amplification has been suggested to result in abnormal
mitotic spindle formation and merotelic kinetochore-microtubule
attachment errors leading to the formation of lagging chromosomes
and these mitotic abnormalities evoke chromosome missegregation,
such as the occurrence of chromosomal numerical changes (6–10,34,35).
Thus, centrosome amplifi-cation as a result of SASS6 overexpression
was believed to have induced CIN in the colonic cells in the
present study. In our analysis of the incidence of anaphase bridges
in primary CRC, a higher incidence of anaphase bridges was
associated with SASS6 overexpression. To date, several causative
events leading to anaphase bridge formation are known, including
centrosome amplification as a result of the expression of oncogenic
MET, the expression of human papilloma virus-16 E6 and E7
oncoprotein, the mutation of genes involved in the function of the
BAF complex, replication stress, and chromosome breakage (36–40).
Thus, centrosome amplification as a result of SASS6 overexpression
may be related to anaphase bridge formation in primary CRC.
However, we cannot completely deny the possibility that some
unknown event that co-occurs with SASS6 overexpression may be
responsible for anaphase bridge formation.
In the present study, SASS6 overexpression was
clearly shown to be an independent predictor of a poor survival
outcome among patients with cancer of the colon, kidney, and lung.
In all the analyses, the disease stage was identified as an
independent predictor of a poor survival outcome, suggesting that
the presently performed analyses were valid. Since previous studies
have shown that CIN is associated with a poor patient prognosis
(3,5) and an association between SASS6
overexpression and CIN was shown in the present study, CIN may be
involved in the relationship between SASS6 overexpression and the
poor prognosis of patients with the above-mentioned cancers.
Additionally, since centrosome amplification has recently been
shown to be capable of mimicking and strengthening the effects of
oncogenes in triggering cellular invasion (41), this phenotype arising from
centrosome amplification induced by SASS6 overexpression may also
be involved in the relationship between SASS6 overexpression and a
poor prognosis.
In contrast to SASS6 overexpression, the incidence
of somatic SASS6 nonsynonymous mutations was extremely low
across the 12 human cancers that were examined in this study. An
activating BRAF p.V600E mutation is known to be common in
cancer and to cause centrosome amplification and CIN (42) and an inactivating BUB1B mutation
noted in premature chromatid separation (PCS) syndrome is also
known to cause centrosome amplification (43). Nevertheless, the low incidence of
SASS6 mutations observed in our investigation suggests that
a similar activating or inactivating mutation in the SASS6
gene is either rare or non-existent in human cancer. In conjunction
with the SASS6 expression data, the above findings suggest that
SASS6 overexpression, but not SASS6 mutation, is likely to
be frequently involved in the pathogenesis of human cancer.
In conclusion, we demonstrated that SASS6 expression
is upregulated in primary CRC and that SASS6 overexpression induces
centrosome amplification, mitotic abnormalities, and CIN in colonic
cells and is thus a predictor of a poor survival outcome among
patients with colon cancer. We also demonstrated that SASS6
overexpression is common in diverse human cancers and is associated
with a poor prognosis in two more cancers. These findings suggest
that SASS6 overexpression may be involved in the pathogenesis of
diverse human cancers, particularly CRC.
Acknowledgments
We would like to thank Professor T.K. Tang
(Institute of Biomedical Sciences, Academia Sinica, Taiwan, ROC)
for providing us with the GFP-SASS6 vector. The present study was
supported in part by a Grant-in-Aid from the Ministry of Health,
Labour and Welfare (21–1, 10103838), the Japan Society for the
Promotion of Science (25460476), the Ministry of Education,
Culture, Sports, Science and Technology (221S0001), the Takeda
Science Foundation and the Smoking Research Foundation.
References
|
1
|
Thompson SL, Bakhoum SF and Compton DA:
Mechanisms of chromosomal instability. Curr Biol. 20:R285–R295.
2010. View Article : Google Scholar : PubMed/NCBI
|
|
2
|
Pfau SJ and Amon A: Chromosomal
instability and aneuploidy in cancer: From yeast to man. EMBO Rep.
13:515–527. 2012. View Article : Google Scholar : PubMed/NCBI
|
|
3
|
Watanabe T, Kobunai T, Yamamoto Y, Matsuda
K, Ishihara S, Nozawa K, Yamada H, Hayama T, Inoue E, Tamura J, et
al: Chromosomal instability (CIN) phenotype, CIN high or CIN low,
predicts survival for colorectal cancer. J Clin Oncol.
30:2256–2264. 2012. View Article : Google Scholar : PubMed/NCBI
|
|
4
|
Vincent-Salomon A, Benhamo V, Gravier E,
Rigaill G, Gruel N, Robin S, de Rycke Y, Mariani O, Pierron G,
Gentien D, et al: Genomic instability: A stronger prognostic marker
than proliferation for early stage luminal breast carcinomas. PLoS
One. 8:e764962013. View Article : Google Scholar : PubMed/NCBI
|
|
5
|
Hveem TS, Merok MA, Pretorius ME, Novelli
M, Bævre MS, Sjo OH, Clinch N, Liestøl K, Svindland A, Lothe RA, et
al: Prognostic impact of genomic instability in colorectal cancer.
Br J Cancer. 110:2159–2164. 2014. View Article : Google Scholar : PubMed/NCBI
|
|
6
|
Ganem NJ, Godinho SA and Pellman D: A
mechanism linking extra centrosomes to chromosomal instability.
Nature. 460:278–282. 2009. View Article : Google Scholar : PubMed/NCBI
|
|
7
|
Fukasawa K: Oncogenes and tumour
suppressors take on centrosomes. Nat Rev Cancer. 7:911–924. 2007.
View Article : Google Scholar : PubMed/NCBI
|
|
8
|
Krämer A, Maier B and Bartek J: Centrosome
clustering and chromosomal (in)stability: A matter of life and
death. Mol Oncol. 5:324–335. 2011. View Article : Google Scholar : PubMed/NCBI
|
|
9
|
Nigg EA and Raff JW: Centrioles,
centrosomes, and cilia in health and disease. Cell. 139:663–678.
2009. View Article : Google Scholar : PubMed/NCBI
|
|
10
|
Shinmura K and Sugimura H: Centrosome
abnormality and human lung cancer. Lung Diseases - Selected State
of the Art Reviews. Irusen EM: InTech; Rijeka: pp. 171–188.
2012
|
|
11
|
Leidel S, Delattre M, Cerutti L, Baumer K
and Gönczy P: SAS-6 defines a protein family required for
centrosome duplication in C. elegans and in human cells. Nat Cell
Biol. 7:115–125. 2005. View
Article : Google Scholar : PubMed/NCBI
|
|
12
|
Arquint C, Sonnen KF, Stierhof YD and Nigg
EA: Cell-cycle-regulated expression of STIL controls centriole
number in human cells. J Cell Sci. 125:1342–1352. 2012. View Article : Google Scholar : PubMed/NCBI
|
|
13
|
Lin YC, Chang CW, Hsu WB, Tang CJ, Lin YN,
Chou EJ, Wu CT and Tang TK: Human microcephaly protein CEP135 binds
to hSAS-6 and CPAP, and is required for centriole assembly. EMBO J.
32:1141–1154. 2013. View Article : Google Scholar : PubMed/NCBI
|
|
14
|
Keller D, Orpinell M, Olivier N, Wachsmuth
M, Mahen R, Wyss R, Hachet V, Ellenberg J, Manley S and Gönczy P:
Mechanisms of HsSAS-6 assembly promoting centriole formation in
human cells. J Cell Biol. 204:697–712. 2014. View Article : Google Scholar : PubMed/NCBI
|
|
15
|
Strnad P, Leidel S, Vinogradova T,
Euteneuer U, Khodjakov A and Gönczy P: Regulated HsSAS-6 levels
ensure formation of a single procentriole per centriole during the
centrosome duplication cycle. Dev Cell. 13:203–213. 2007.
View Article : Google Scholar : PubMed/NCBI
|
|
16
|
Comartin D, Gupta GD, Fussner E, Coyaud É,
Hasegan M, Archinti M, Cheung SW, Pinchev D, Lawo S, Raught B, et
al: CEP120 and SPICE1 cooperate with CPAP in centriole elongation.
Curr Biol. 23:1360–1366. 2013. View Article : Google Scholar : PubMed/NCBI
|
|
17
|
Macmillan JC, Hudson JW, Bull S, Dennis JW
and Swallow CJ: Comparative expression of the mitotic regulators
SAK and PLK in colorectal cancer. Ann Surg Oncol. 8:729–740. 2001.
View Article : Google Scholar : PubMed/NCBI
|
|
18
|
Liu L, Zhang CZ, Cai M, Fu J, Chen GG and
Yun J: Downregulation of polo-like kinase 4 in hepatocellular
carcinoma associates with poor prognosis. PLoS One. 7:e412932012.
View Article : Google Scholar : PubMed/NCBI
|
|
19
|
Zhou H, Kuang J, Zhong L, Kuo WL, Gray JW,
Sahin A, Brinkley BR and Sen S: Tumour amplified kinase STK15/BTAK
induces centrosome amplification, aneuploidy and transformation.
Nat Genet. 20:189–193. 1998. View
Article : Google Scholar : PubMed/NCBI
|
|
20
|
Li J, Xuan JW, Khatamianfar V, Valiyeva F,
Moussa M, Sadek A, Yang BB, Dong BJ, Huang YR and Gao WQ: SKA1
over-expression promotes centriole over-duplication, centrosome
amplification and prostate tumourigenesis. J Pathol. 234:178–189.
2014.PubMed/NCBI
|
|
21
|
Shinmura K, Goto M, Suzuki M, Tao H,
Yamada H, Igarashi H, Matsuura S, Maeda M, Konno H, Matsuda T, et
al: Reduced expression of MUTYH with suppressive activity against
mutations caused by 8-hydroxyguanine is a novel predictor of a poor
prognosis in human gastric cancer. J Pathol. 225:414–423. 2011.
View Article : Google Scholar : PubMed/NCBI
|
|
22
|
Shinmura K, Iwaizumi M, Igarashi H, Nagura
K, Yamada H, Suzuki M, Fukasawa K and Sugimura H: Induction of
centrosome amplification and chromosome instability in
p53-deficient lung cancer cells exposed to benzo[a]pyrene diol
epoxide (B[a]PDE). J Pathol. 216:365–374. 2008. View Article : Google Scholar : PubMed/NCBI
|
|
23
|
Li B and Dewey CN: RSEM: Accurate
transcript quantification from RNA-Seq data with or without a
reference genome. BMC Bioinformatics. 12:3232011. View Article : Google Scholar : PubMed/NCBI
|
|
24
|
Smith JJ, Deane NG, Wu F, Merchant NB,
Zhang B, Jiang A, Lu P, Johnson JC, Schmidt C, Bailey CE, et al:
Experimentally derived metastasis gene expression profile predicts
recurrence and death in patients with colon cancer.
Gastroenterology. 138:958–968. 2010. View Article : Google Scholar
|
|
25
|
Ding S, Wu X, Li G, Han M, Zhuang Y and Xu
T: Efficient transposition of the piggyBac (PB) transposon in
mammalian cells and mice. Cell. 122:473–483. 2005. View Article : Google Scholar : PubMed/NCBI
|
|
26
|
Joshi HC: Microtubule organizing centers
and gamma-tubulin. Curr Opin Cell Biol. 6:54–62. 1994. View Article : Google Scholar : PubMed/NCBI
|
|
27
|
Oakley BR: gamma-Tubulin. Curr Top Dev
Biol. 49:27–54. 2000. View Article : Google Scholar : PubMed/NCBI
|
|
28
|
Muzny DM, Bainbridge MN, Chang K, Dinh HH,
Drummond JA, Fowler G, Kovar CL, Lewis LR, Morgan MB, Newsham IF,
et al: Cancer Genome Atlas Network: Comprehensive molecular
characterization of human colon and rectal cancer. Nature.
487:330–337. 2012. View Article : Google Scholar
|
|
29
|
Stewénius Y, Gorunova L, Jonson T, Larsson
N, Höglund M, Mandahl N, Mertens F, Mitelman F and Gisselsson D:
Structural and numerical chromosome changes in colon cancer develop
through telomere-mediated anaphase bridges, not through mitotic
multipolarity. Proc Natl Acad Sci USA. 102:5541–5546. 2005.
View Article : Google Scholar : PubMed/NCBI
|
|
30
|
Chan JY: A clinical overview of centrosome
amplification in human cancers. Int J Biol Sci. 7:1122–1144. 2011.
View Article : Google Scholar : PubMed/NCBI
|
|
31
|
Yang SB, Zhou XB, Zhu HX, Quan LP, Bai JF,
He J, Gao YN, Cheng SJ and Xu NZ: Amplification and overexpression
of Aurora-A in esophageal squamous cell carcinoma. Oncol Rep.
17:1083–1088. 2007.PubMed/NCBI
|
|
32
|
Gañán-Gómez I, Wei Y, Yang H,
Boyano-Adánez MC and García-Manero G: Oncogenic functions of the
transcription factor Nrf2. Free Radic Biol Med. 65:750–764. 2013.
View Article : Google Scholar : PubMed/NCBI
|
|
33
|
Tsai KW, Hu LY, Chen TW, Li SC, Ho MR, Yu
SY, Tu YT, Chen WS and Lam HC: Emerging role of microRNAs in
modulating endothelin-1 expression in gastric cancer. Oncol Rep.
33:485–493. 2015.
|
|
34
|
Thompson SL and Compton DA: Chromosome
missegregation in human cells arises through specific types of
kinetochore-microtubule attachment errors. Proc Natl Acad Sci USA.
108:17974–17978. 2011. View Article : Google Scholar : PubMed/NCBI
|
|
35
|
Nigg EA and Stearns T: The centrosome
cycle: Centriole biogenesis, duplication and inherent asymmetries.
Nat Cell Biol. 13:1154–1160. 2011. View Article : Google Scholar : PubMed/NCBI
|
|
36
|
Nam HJ, Chae S, Jang SH, Cho H and Lee JH:
The PI3K-Akt mediates oncogenic Met-induced centrosome
amplification and chromosome instability. Carcinogenesis.
31:1531–1540. 2010. View Article : Google Scholar : PubMed/NCBI
|
|
37
|
Duensing S and Münger K: The human
papillomavirus type 16 E6 and E7 oncoproteins independently induce
numerical and structural chromosome instability. Cancer Res.
62:7075–7082. 2002.PubMed/NCBI
|
|
38
|
Dykhuizen EC, Hargreaves DC, Miller EL,
Cui K, Korshunov A, Kool M, Pfister S, Cho YJ, Zhao K and Crabtree
GR: BAF complexes facilitate decatenation of DNA by topoisomerase
IIα. Nature. 497:624–627. 2013. View Article : Google Scholar : PubMed/NCBI
|
|
39
|
Burrell RA, McClelland SE, Endesfelder D,
Groth P, Weller MC, Shaikh N, Domingo E, Kanu N, Dewhurst SM,
Gronroos E, et al: Replication stress links structural and
numerical cancer chromosomal instability. Nature. 494:492–496.
2013. View Article : Google Scholar : PubMed/NCBI
|
|
40
|
Gisselsson D, Pettersson L, Höglund M,
Heidenblad M, Gorunova L, Wiegant J, Mertens F, Dal Cin P, Mitelman
F and Mandahl N: Chromosomal breakage-fusion-bridge events cause
genetic intratumor heterogeneity. Proc Natl Acad Sci USA.
97:5357–5362. 2000. View Article : Google Scholar : PubMed/NCBI
|
|
41
|
Godinho SA, Picone R, Burute M, Dagher R,
Su Y, Leung CT, Polyak K, Brugge JS, Théry M and Pellman D:
Oncogene-like induction of cellular invasion from centrosome
amplification. Nature. 510:167–171. 2014. View Article : Google Scholar : PubMed/NCBI
|
|
42
|
Liu J, Cheng X, Zhang Y, Li S, Cui H,
Zhang L, Shi R, Zhao Z, He C, Wang C, et al: Phosphorylation of
Mps1 by BRAFV600E prevents Mps1 degradation and contributes to
chromosome instability in melanoma. Oncogene. 32:713–723. 2013.
View Article : Google Scholar
|
|
43
|
Izumi H, Matsumoto Y, Ikeuchi T, Saya H,
Kajii T and Matsuura S: BubR1 localizes to centrosomes and
suppresses centrosome amplification via regulating Plk1 activity in
interphase cells. Oncogene. 28:2806–2820. 2009. View Article : Google Scholar : PubMed/NCBI
|