Introduction
Cluster of differentiation 90 (CD90) is a 25- to 37-
kDa heavily N-glycosylated, glycophosphatidylinositol anchored
conserved cell surface protein with a single V-like immunoglobulin
domain, originally discovered as a thymocyte antigen (1–3). In
humans, CD90 is expressed by endothelial cells (ECs), smooth muscle
cells, a subset of CD34+ bone marrow cells, cardiac
fibroblasts and fetal liver-derived hemopoietic cells (4–6). As a
tumor marker, CD90 has been shown to have significantly high
expression in esophageal cancer and other digestive cancers
(7,8). CD90 expression was found to be
valuable in the differential diagnosis between epithelioid
mesothelioma and lung adenocarcinoma (2,9). CD90
contributes to the metastasis of melanoma cells by mechanisms
likely involving a CD90-mediated adhesion of melanoma cells to ECs
(4,10,11).
CD90 could serve as a promising marker for pancreatic
adeno-carcinoma where desmoplastic stroma plays an important role
in tumor growth and angiogenesis (12). CD90 was found to be expressed in 95%
of clinical gastric tumor samples by immunohistochemical staining.
CD90+ cells possess a higher ability to initiate tumors
in vivo and self-renewal properties. These cells could be
undermined by trastuzumab treatment in vivo (13,14).
Although some evidence has been reported, the mechanism of CD90 in
gastric cancer is not fully understood.
Cell apoptosis is a crucial mechanism for all
multicellular organisms to control cell proliferation and maintain
tissue homeostasis (15–17). Identification of the mechanisms of
apoptosis and the effector molecules responsible for apoptosis has
provided a new opportunity to explore and develop novel agents
which can increase the sensitivity of cancer cells to undergo
apoptosis or reset their apoptotic threshold (15,18,19).
Cell apoptosis is closely related with a reduction in mitochondrial
membrane potential (ΔΨm) and an increase in intracellular reactive
oxygen species (ROS) and calcium ion (Ca2+)
concentrations. Mitochondria are important cellular structures that
supply cellular energy by generating adenosine triphosphate (ATP)
(20). Furthermore, mitochondria
act as internal calcium stores through the uptake of
intracellular-free Ca2+, and this is critical for
calcium buffering (20).
Mitochondrial calcium buffering is important during continuous
calcium-induced calcium release in submandibular acinar cells,
directly modulates agonist-induced calcium signals, and can
functionally interact with calcium stores to regulate cytosolic
calcium signals. When mitochondrial membranes are damaged,
mitochondria lose their calcium buffering capability and
mitochondria-related proteins, such as cytochrome c and
Smac/DIABLO, are released from the mitochondria into the cytosol,
resulting in cellular apoptosis (21–25).
In this study, we examined the expression levels of
CD90 in gastric cancer tissues. At the same time, we studied the
influence of CD90 on cell apoptosis and explored the possible
mechanism in a gastric cancer cell line.
Materials and methods
Cell culture
One identified general human gastric cancer cell
line AGS, was cultured in Ham's/F-12 (HyClone, Logan, UT, USA)
supplemented with 10% fetal bovine serum (FBS) (Gibco Life
Technologies™, Grand Island, NY, USA), 100 U/ml penicillin and 100
μg/ml streptomycin (GE Healthcare Life Sciences, Logan, UT,
USA) at 37°C in the presence of 5% CO2.
Patient samples
Twelve participants were recruited at Xiangya
Hospital, Central South University (Changsha, Hunan, China).
Consent forms were obtained from individual patients, and
experimental protocols were approved by the Institutional Review
Board of Xiangya Hospital. All subjects enrolled in the study were
Chinese. All clinical and biological data were available for the
samples (Table I). Gastric cancer
tissues and corresponding non-tumor normal tissues were collected,
and each biopsy sample was divided into two sections; one was
submitted for routine histological diagnosis and the remaining
section was used for q-PCR, immunohistochemistry and western blot
experiments.
 | Table ICharacteristics of the gastric cancer
patients. |
Table I
Characteristics of the gastric cancer
patients.
| Patient no. | Age (years) | Gender | Histological
diagnosis |
|---|
| 1 | 54 | Male | Gastric poorly
differentiated adenocarcinoma |
| 2 | 59 | Male | Gastric poorly
differentiated adenocarcinoma |
| 3 | 63 | Female | Gastric
intermediately differentiated adenocarcinoma |
| 4 | 53 | Female | Gastric poorly
differentiated adenocarcinoma |
| 5 | 71 | Male | Gastric
intermediately differentiated adenocarcinoma |
| 6 | 67 | Male | Gastric poorly
differentiated adenocarcinoma |
| 7 | 55 | Male | Gastric
intermediately differentiated adenocarcinoma |
| 8 | 58 | Female | Gastric poorly
differentiated adenocarcinoma |
| 9 | 70 | Male | Gastric poorly
differentiated adenocarcinoma |
| 10 | 61 | Female | Gastric poorly
differentiated adenocarcinoma |
| 11 | 51 | Male | Gastric
intermediately differentiated adenocarcinoma |
| 12 | 62 | Male | Gastric poorly
differentiated adenocarcinoma |
Total RNA extraction and quantitative
real-time PCR (qRT-PCR) analysis
Total RNA was extracted from the gastric cancer
tissues and corresponding non-tumor normal tissues using TRIzol
reagent (CWBio, Beijing, China) and cDNA synthesis was carried out
using the RevertAid First Strand cDNA synthesis kit (CWBio)
according to the manufacturer's recommendations. qRT-PCR was
carried out with GoTaq qPCR Master Mix (Promega, Fitchburg, WI,
USA). For detection of CD90 mRNA expression levels, GAPDH was
amplified in parallel as an internal control. The sequences of the
primers used for qPCR were as follows: CD90 forward,
5′-gcatgggctaaggatttgaa-3′ and reverse, 5′-tcccaaatttagcctgttgg-3′;
GAPDH forward, 5′-cgaccactttgtcaagctca-3′ and reverse,
5′-actgagtgtggcagggactc-3′. The expression of mRNA was assessed by
evaluated threshold cycle (CT) values. The CT values were
normalized to the expression levels of GAPDH and the relative
amount of mRNA specific to each of the target genes was calculated
using the 2−ΔΔCt method (26–31).
qPCR was carried out using the Bio-Rad CFK96™ Real-Time System
(Bio-Rad, Hercules, CA, USA). The data were analyzed by Bio-Rad CFK
Manager software (Bio-Rad). Expression of mRNA was assessed by
evaluated CT values and GAPDH was used as an internal control.
Immunohistochemistry (IHC) and evaluation
of staining
Immunohistochemistry was conducted using the
peroxidase anti-peroxidase technique following a microwave antigen
retrieval procedure. The antibody for CD90 was purchased
from Boster Biotechnology Co., Ltd. (Wuhan, China). The antibody
against CD90 (1:100) was overlaid on gastric cancer and
corresponding non-tumor normal tissue sections and incubated
overnight at 4°C. Secondary antibody incubation (Santa Cruz
Biotechnology, Inc., Santa Cruz, CA, USA) was performed at room
temperature for 30 min. Color reaction was developed using
3,3′-diaminobenzidine tetrachloride (DAB) chromogen solution. All
slides were counterstained with hematoxylin. Positive control
slides were included in every experiment in addition to the
internal positive controls. The specificity of the antibody was
determined with a matched IgG isotype antibody as a negative
control.
Sections were evaluated by two investigators in a
blinded manner in an effort to provide a consensus on staining
patterns by light microscopy (Olympus, Tokyo, Japan). CD90 staining
was assessed according to the methods described by Hara and Okayasu
(32) with minor modifications.
Each case was rated according to a score that was the sum of a
scale of intensity of staining and the area of staining. At least
10 high-power fields were chosen randomly, and >1,000 cells were
counted for each section. The intensity of staining was graded on
the following scale: 0, no staining; 1+, mild staining; 2+,
moderate staining; 3+, intense staining. The area of staining was
evaluated as follows: 0, no staining of cells in any microscopic
fields; 1+, <30% of the tissue was stained positive; 2+, between
30 and 60% was stained positive; 3+, >60% stained positive. The
minimum score when summed (extension + intensity) was 0 and the
maximum, 6. A combined staining score (extension + intensity) of ≤2
was considered to be negative staining (low staining); a score
between 3 and 4 was considered to be moderate staining; whereas a
score between 5 and 6 was considered to be strong staining. An
optimal cut-off level was identified as follows: a staining index
score of 0–2 was used to define tumors with negative expression and
3–7 indicated positive expression of these two proteins. Agreement
between the two evaluators was 95%, and all scoring discrepancies
were resolved through discussion between the two evaluators.
Construction of the pEGFP-N1-CD90 vector
and cell transfection
The coding region of the CD90 gene was generated by
PCR with the primer pair 5′-atactcgaatgaacctggccatcagcat-3′ and
5′-gcggaattctcacagggacatgaaatccg-3′. PCR was performed under the
following conditions: one cycle for 5 min at 94°C; 30 cycles for 45
sec at 94°C, 45 sec at 55°C, and 90 sec at 72°C and ending with 10
min at 72°C. The fragments were cloned into the TA vector (Promega,
Fitchburg, WI, USA) and used to transform E. coli JM109
(Takara, Dalian, China). Following selection and propagation, the
pure plasmid DNA was prepared by standard methods. The DNA
fragments were removed from the TA vector by restriction enzyme
digestion with XhoI and EcoR1 (Promega) to subclone
into the pEGFP-N1 vector. The fusion sequences were verified by DNA
sequencing using ABI 3730. To establish a stable CD90-expressing
cell line, the plasmid pEGFP-N1/CD90 or control empty vector
pEGFP-N1 was transfected into AGS cells, using Lipofectin
(Invitrogen Life Technologies, Carlsbad, CA, USA) according to the
manufacturer's instruction, followed by G418 selection. The stable
transfectants, AGS/CD90 and AGS/vector, were isolated, and
transcription of the CD90 protein was determined by qPCR and
western blot experiments.
Synthesis and transfection of siRNAs
siRNAs were designed and synthesized by RiboBio
(Guangzhou, China). The siRNAs targeting the CD90 gene were
designed and synthesized. The most effective siRNA (siCD90)
identified by qPCR was applied for subsequent experiments. The
sequence of siCD90 was: sense, 5′-UCCAGGCCACGGAUUUCAU dTdT-3′ and
antisense, 3′-dTdTAGGUCCGGUGCCUAAAGUA-5′. Twenty-four hours prior
to transfection, the cells were plated onto a 6-well plate
(Greiner, Stuttgart, Germany) at ~40–60% conf luency. Transfection
was per for med with Lipofectamine 2000 (Invitrogen Life
Technologies) according to the manufacturer's protocol. The medium
was replaced 4–6 h after transfection with new culture medium,
except in the case of AGS cells, for which the medium was not
replaced after transfection. After an additional 48 h of culture,
the cells were harvested for the following apoptosis,
Ca2+ and ROS experiments.
Effect of CD90 on gastric cancer cell
apoptosis
Cell apoptosis was analyzed by flow cytometric
analysis using a Moflo™ XDP High-Performance Cell Sorter (Beckman
Coulter, Brea, CA, USA), propidium iodide (PI) and Hoechst 33342
double-staining (Nanjing KeyGEN Biotech Co., Ltd., Nanjing, China).
Briefly, AGS cells (AGS, AGS/vector, AGS/CD90) were seeded at a
density of 1×10⁶ cells per well in 6-well culture
plates. The cells were collected in an Eppendorf tube (24 h) and
washed twice with PBS by centrifugation. The supernatants were
discarded. To detect apoptosis, 500 μl of PBS, 5 μl
of Hoechst 33342 and 5 μl PI were added to each tube, and
the contents of the tube were mixed in the dark at room temperature
for 15 min, followed by FCM testing (Beckman Coulter). Data were
acquired and analyzed with Summit v5.2 software (Beckman
Coulter).
Detection of mitochondrial membrane
potential by JC-1
The impact of CD90 was measured by flow cytometry
using the sensitive and relatively mitochondrion-specific
lipophilic cationic probe fluorochrome JC-1. JC-1 accumulates to
form J-aggregates and emits red fluorescence in the mitochondria
with higher membrane potential, yet dissociates into monomers and
emits green fluorescence in those that lose cross-membrane
electrochemical gradient. The cells were suspended in 1 ml warm
staining buffer at ~1×10⁶ cells/ml and incubated at 37°C
for 5 min. Then 1 μl of 2 mM JC-1 (2 μM final
concentration was added) and the cells were incubated at 37°C in 5%
CO2 for 15–30 min. The cells were pelleted by
centrifugation, resuspended by gently flicking the tubes, and 500
μl PBS was added to each tube. Cells were analyzed with
Moflo™ XDP High-Performance Cell Sorter (Beckman Coulter). Data
were acquired and analyzed with Summit v5.2 software.
Intracellular ROS measurement
The production of intracellular reactive oxygen
species (ROS) was measured by performing flow cytometry using the
oxidation-sensitive probe, 2′,7′-dichlorofluorescein diacetate
(DCFH-DA) (Applygen, Beijing, China). Briefly, 10 mM DCFH-DA stock
solution (in methanol) was diluted 4,000-fold in cell culture
medium without serum or other additive to yield a 2.5 mM working
solution. After the exposure of HUVECs to silica nanoparticles for
3 h and 24 h, respectively, the cells in 6-well plates were washed
twice with PBS and incubated in 2 ml working solution of DCFH-DA at
37°C in the dark for 30 min. Then the cells were washed twice with
cold PBS and resuspended in PBS for analysis of intracellular ROS
by FACS (Beckman Coulter).
Intracellular Ca2+
concentration assay
Intracellular Ca2+ concentration was
measured by means of the fluorescent Ca2+ chelator
Fura-2 AM, which permeates into cells where it is cut into Fura-2.
Fura-2 combines with intracellular Ca2+ to form a
fluorescent compound, whose fluorescent intensity was determined at
an excitation wave length of 340 nm and an emission wave length of
510 nm in FACS (Beckman Coulter). After treatment, the cells were
harvested and rinsed with PBS. The harvested cells were suspended
in PBS and incubated with 5 μM Fura-2 AM for 60 min at 37°C.
During the session of incubation with Fura-2 AM, cell cultures were
mildly shaken at intervals of 10 min aimed to facilitate the
combination of Fura-2 and Ca2+ to form the fluorescent
compound. Then, cells were washed twice and resuspended in PBS for
FACS measurement (Beckman Coulter). Data were acquired and analyzed
with Summit v5.2 software (Beckman Coulter).
Identification of co-expressed genes by
bioinformatic analysis
The RNA-Seq data of stomach adenocarcinoma,
including 274 tumor samples and 33 normal samples, were retrieved
from the Cancer Genome Atlas (TCGA). We obtained these data from
Broad GDAC FIREHOSE (https://confluence.broadinstitute.org/display/GDAC/Home)
on 2014-05-18. In these data, gene expression index was quantified
and normalized using reads per kilobase per million reads
(RPKM).
The Spearman's correlation (rs) (33) was introduced to measure the
co-expression between gene CD90 and another gene (gy)
across the stomach samples. For a given sample size n, we defined
Xi as the expression index of gene CD90 and
Yi as the expression index of gene gy
(i=1.2n). Raw expression indices Xi and Yi
were converted to ranks xi and yi, and
rs was defined as follows: Where is the difference
between ranks (?)(clarify) To explore the biological relationships
of genes that were co-expressed with CD90, a functional enrichment
analysis was introduced using DAVID (34). The goal of the enrichment analysis
was to determine the biological functions that might be associated
with CD90, as well as to narrow down various co-expressed genes
that were mapped onto the specific functions concerned. We employed
the Gene Ontology, KEGG and other functional categories as the
background knowledge base to acquire the functional concepts for
those co-expressed genes.
Identification of differential proteins
in CD90-overexpressed AGS cells by LC-MS/MS analysis
The cell lysate was obtained using a protein
extraction buffer consisting of 50 mM Tris (pH 7.4), 150 mM NaCl,
1% Triton X-100, 1% sodium deoxycholate, 0.1% SDS and sodium
orthovanadate, sodium fluoride, EDTA, leupeptin supplemented with
1X halt protease inhibitor cocktail (CWBio) and 1X halt phosphatase
inhibitor cocktail (BestBio, Shanghai, China). The protein
concentration was estimated by the bicinchoninic acid (BCA) method.
The gel was run at 80 V for 40 min, then 120 V for 90 min. Then, 50
μg of each preparation was loaded onto a 10% SDS-PAGE gel.
SDS-PAGE was run at 80 V for 40 min, then 120 V for 90 min. Protein
bands were visualized using Coomassie brilliant blue G-250
(Sigma-Aldrich, Carlsbad, CA, USA) and excised. The protein spots
were destained using 15 mM K4Fe(CN)6 and 50
mM sodium thiosulfate and 1.25 μg trypsin (1:20
enzyme/substrate ratio) was added to each band and in-gel digestion
was performed at 37°C overnight (~16 h). The generated peptides
were extracted by sonication (15 min, ice cooling) of the gel
pieces in ~20 μl of 50% acetonitrile in 0.1% FA, twice.
After extraction from the gel pieces, the peptides were dried by
vacuum centrifugation to ensure a complete removal of acetonitrile
and then reconstituted in 20 μl 0.1% FA (35–37).
LC-MS/MS analyses were performed on an Ultimate™
3000 RSLC Nano system online coupled to an LTQ Orbitrap Velos Pro
mass spectrometer (both from Thermo Scientific, Bremen, Germany).
Peptides were diluted with 0.1% FA; for each analysis 30 μl
of sample was injected. After injection, peptides were
pre-concentrated with 0.1% FA, 3% ACN on a trap column
(μ-Precolumn C18 PepMap 100, 300 μm × 5 mm, 5
μm, 100 Å; Thermo Scientific) at a flow rate of 300 nl/min
for 5 min. Subsequently, the analyte was transferred to the
analytical column (Acclaim® PepMap RSLC, 75 μm ×
15 cm, nano Viper, C18, 2 μm, 100 Å, Thermo Scientific) and
separated using a 120 min gradient from 5 to 40% solvent B at a
flow rate of 300 nl/min (solvent A: 0.1% formic acid, solvent B:
0.08% FA 80% acetonitrile). The mass spectrometer was operated in a
data-dependent mode. The general mass spectrometric parameters were
as follows: spray voltage, 2.0 kV; capillary temperature, 275°C.
For data-dependent MS/MS analyses, the software XCalibur (Thermo
Fisher Scientific, Waltham, MA, USA) was used. Full scan MS spectra
were acquired at a mass resolution of 60,000 (mass range 350–2000
m/z) in the Orbitrap analyzer. For label-free analyses, tandem mass
spectra of the 10 most abundant peaks were acquired in the linear
ion trap by peptide fragmentation using collision-induced
dissociation (CID). Normalized collision energy (NCE) was set to
35%, and an isolation width of 2 m/z was chosen (35–37).
Protein identifications were performed with Proteome
Discoverer software. Briefly, Thermo raw-files were imported and
searched against UniProt KB/Swiss-Prot database (release 2014_10).
For database searches, mass tolerances were set to 10 ppm and 0.8
Da for precursor and fragment ions, respectively. Taxonomy was
restricted to human, and one enzymatic miscleavage was allowed. For
label-free analyses, modifications of cysteine (carbamidomethyl,
static) and methionine (oxidation, variable) were considered.
Confidence of peptide identification was estimated using the
percolator function, implemented in Proteome Discoverer. Instead of
determining the peptide confidence based on a single metric-like
Mascot ion score, we decided to use percolator as it discriminates
correct from incorrect peptide spectrum matches based on multiple
orthogonal score criteria leading to accurate and sensitive peptide
identifications. Peptide identifications with false discovery rates
N 1% (q-value N 0.01) were discarded (35–37).
Western blot analysis
The gastric cancer tissues, corresponding non-tumor
normal tissues and AGS cells were lysed in RIPA buffer (CWBio), and
the total protein concentration was determined using
Pierce® BCA Protein Assay kit (Thermo Scientific, Inc.,
Rockford, IL, USA). Extracts containing 50 μg of proteins
were separated on 10% SDS-PAGE gels, and electroblotted onto
nitrocellulose membranes (HyClone Laboratories, Inc., Logan, UT,
USA). The membranes were incubated using Tris-buffered
saline/Tween-20 (25 mM Tris-HCl, 150 mM NaCl, pH 7.5 and 0.05%
Tween-20) containing 5% non-fat milk followed by overnight
incubation at 4°C with primary antibodies [rabbit anti-CD90
antibody, 1:200; rabbit anti-SPARC antibody, 1:100; rabbit
anti-COL1A2 antibody, 1:300 (Wuhan Boster Biological Engineering
Co., Ltd., Wuhan, China)]. Following three washes, the membranes
were incubated with horseradish peroxidase-conjugated secondary
antibodies (Santa Cruz Biotechnology, Inc.), and the specific
signals were visualized using an ECL detection system. Anti-GAPDH
antibody 1:3,000 (Santa Cruz Biotechnology, Inc.) was used as a
loading control.
Statistical analysis
Differences in non-parametric variables were
analyzed by the Mann-Whitney U test. Differences in the
quantitative variables between groups were analyzed by the
Student's t-test using SPSS 11.0 program (SPSS, Chicago, IL, USA).
P<0.05 was considered to indicate a statistically significant
difference.
Results
CD90 is highly expressed in the gastric
cancer tissues
To detect the mRNA expression levels of the CD90
molecule in gastric cancer and the adjacent non-cancerous tissues,
12 samples of each were selected to perform qPCR of the CD90 gene.
The data were analyzed using the 2−ΔΔCT method, and the
fold-change in expression of these genes relative to the internal
control gene, GAPDH, was analyzed. The expression of the CD90 gene
was higher in the gastric cancer samples compared with the adjacent
non-cancerous tissues and the normalized CD90 gene expression in
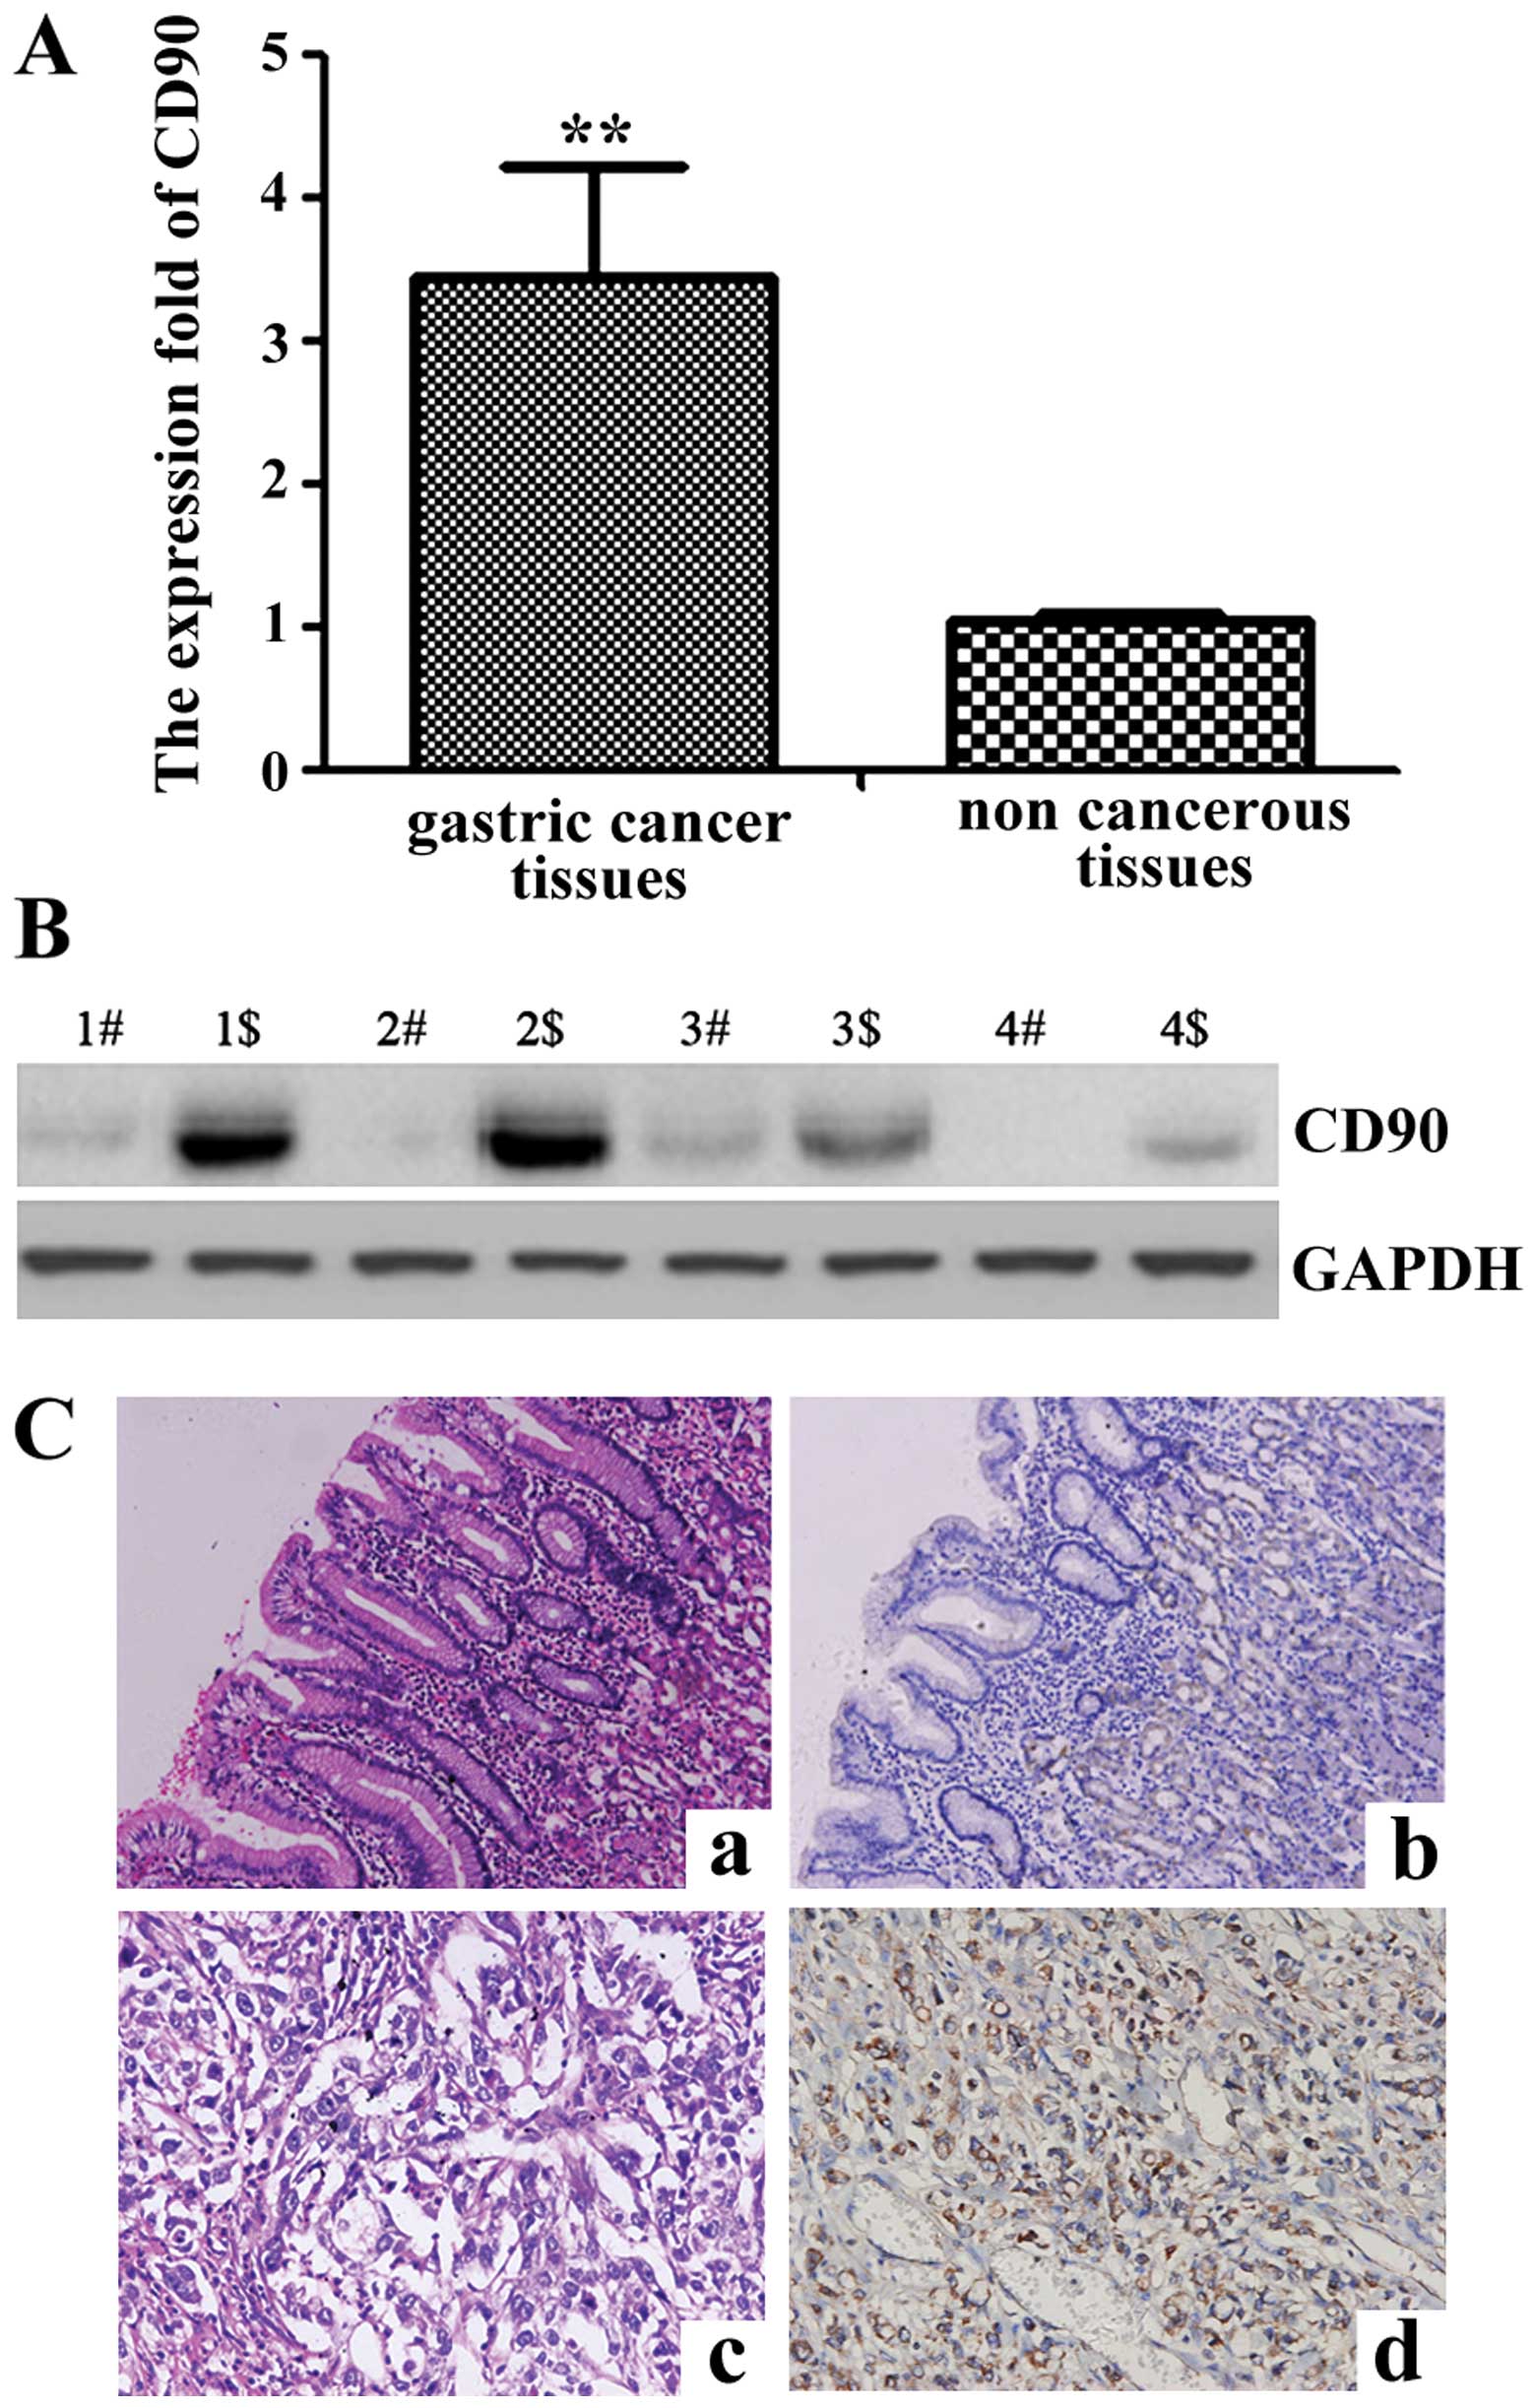
gastric cancer was upregulated by 3.46-fold (P=0.0018) (Fig. 1A).
To determine whether the CD90 gene was expressed at
a higher level in gastric cancer compared with the adjacent
non-cancerous tissues, the protein expression levels of CD90 were
further examined by western blot analysis in 4 pair of samples
(Fig. 1B). In comparison with the
adjacent non-cancerous tissues, the expression level was identified
to be higher in the gastric cancer tissues, which corresponded with
the qPCR results.
To confirm the pattern of CD90 in gastric cancer,
immunohistochemistry (IHC) was carried out with antibodies against
CD90 protein in gastric cancer and the adjacent non-cancerous
tissues. CD90 was identified as differentially expressed between
gastric cancer tissues vs. the adjacent non-cancerous tissues. IHC
showed a similar pattern in protein expression with the western
blot results. A total of 61.5% (16/26) of the gastric cancer
tissues had a high score of CD90 in contrast to 26.9% (7/26) of the
adjacent non-cancerous tissues. The distribution of low score was
23.1% (6/26) and 42.3% (11/26) in the gastric cancer and the
adjacent non-cancerous tissues, respectively (P=0.02) (Fig. 1C and Table II). The results corresponded with
the qPCR results.
| Table IIDifference in CD90 expression between
gastric cancer and the adjacent non-cancerous tissues by
immunohistochemistry (IHC). |
Table II
Difference in CD90 expression between
gastric cancer and the adjacent non-cancerous tissues by
immunohistochemistry (IHC).
| Tissue type | n | Score
| χ2 | P-value |
|---|
| Low (0–2) n
(%) | Moderate (3–4) n
(%) | High (5–6) n
(%) |
|---|
| Gastric cancer
tissues | 26 | 6 (23.1) | 4 (15.4) | 16 (61.5) | 6.33 | 0.04 |
| Non-cancerous
tissues | 26 | 11 (42.3) | 8 (30.8) | 7 (26.9) | | |
CD90 inhibits the apoptosis of gastric
cancer cells in vitro
We found that CD90 was highly expressed in gastric
cancer tissues by qPCR, western blot analysis and IHC technologies.
To elucidate the function of CD90 in the apoptosis of gastric
cancer cells, AGS cells were transfected with the plasmid
pEGFP-N1/CD90 or the control vector to generate CD90
stable-expressing AGS/CD90 and control AGS/vector cell lines. After
assessing CD90 protein by qPCR and western blot technologies, we
performed a Hoechst 33342/PI double-staining experiment to test the
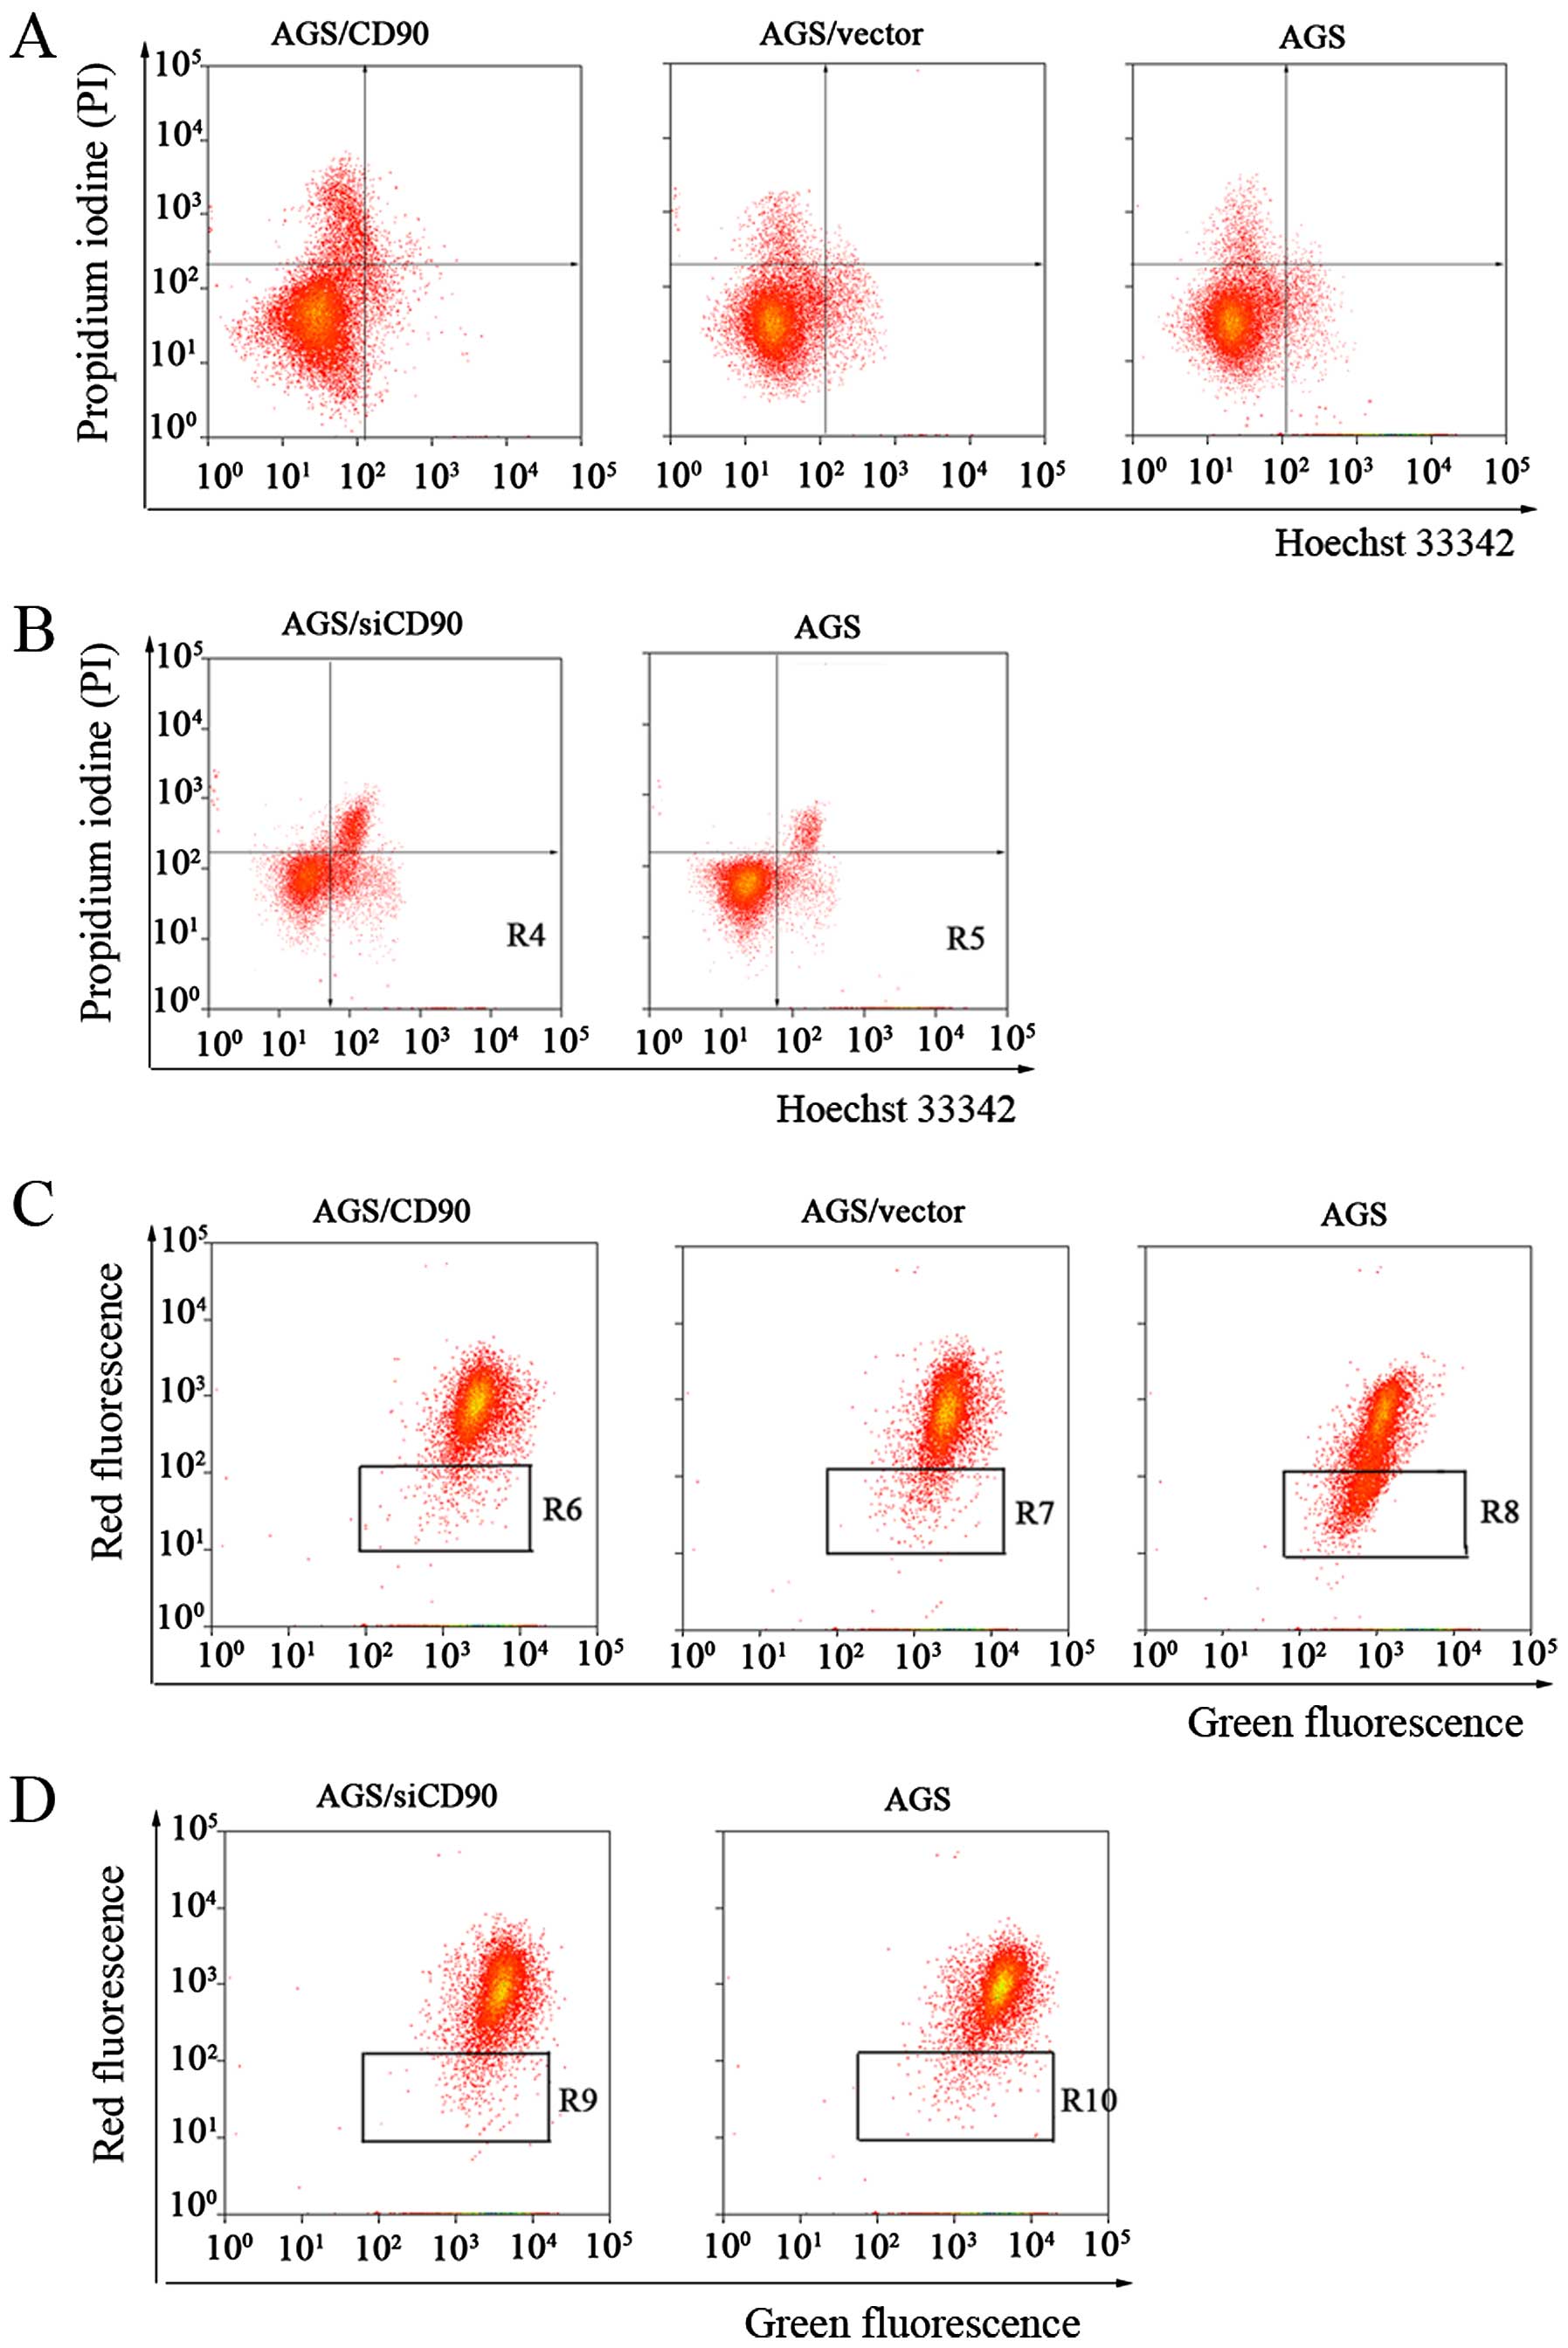
rate of apoptosis in the AGS, AGS/vector and AGS/CD90 cells. A
considerable decrease in apoptotic cells was observed in the
AGS/CD90 cells (5.37±0.34%), AGS/vector cells (10.4±0.96%) and AGS
cells (11.21±0.99%) (Fig. 2A). At
the same time, we detected the effect of the knockdown of the
expression level of CD90 (siRNA) and found that the rate of
apoptosis was increased in the AGS/siCD90 cells compared with the
AGS cells; 15.94±0.84 and 10.02±1.01% for the AGS/siCD90 and AGS
cells, respectively (Fig. 2B).
CD90 affects mitochondrial membrane
potential (ΔΨm), ROS and calcium ion (Ca2+)
concentrations in the gastric cancer cells in vitro
Cell apoptosis is closely related with a reduction
in mitochondrial membrane potential (ΔΨm) and an increase in
intracellular reactive oxygen species (ROS) and calcium ion
(Ca2+) concentrations. Thus, we tested the effect of
CD90 on these three parameters. Our results showed that
overexpression of CD90 in AGS gastric cancer cells, led to an
increase in ΔΨm and inhibited cell apoptosis (Fig. 2C). Moreover, siCD90 reduced the ΔΨm
and induced apoptosis (Fig. 2D).
ROS results showed that overexpression of CD90 in the AGS gastric
cancer cells, led to a decrease in intracellular reactive oxygen
species (ROS) (Fig. 3A). Meanwhile,
siCD90 increased the intracellular ROS and induced apoptosis
(Fig. 3B). Ca2+
experimental results showed that overexpression of CD90 in the AGS
gastric cancer cells led to a decrease in calcium ion
(Ca2+) concentrations and suppressed the apoptosis of
gastric cancer cells (Fig. 3C).
Moreover, siCD90 increased calcium ion (Ca2+)
concentrations and induced apoptosis (Fig. 3D).
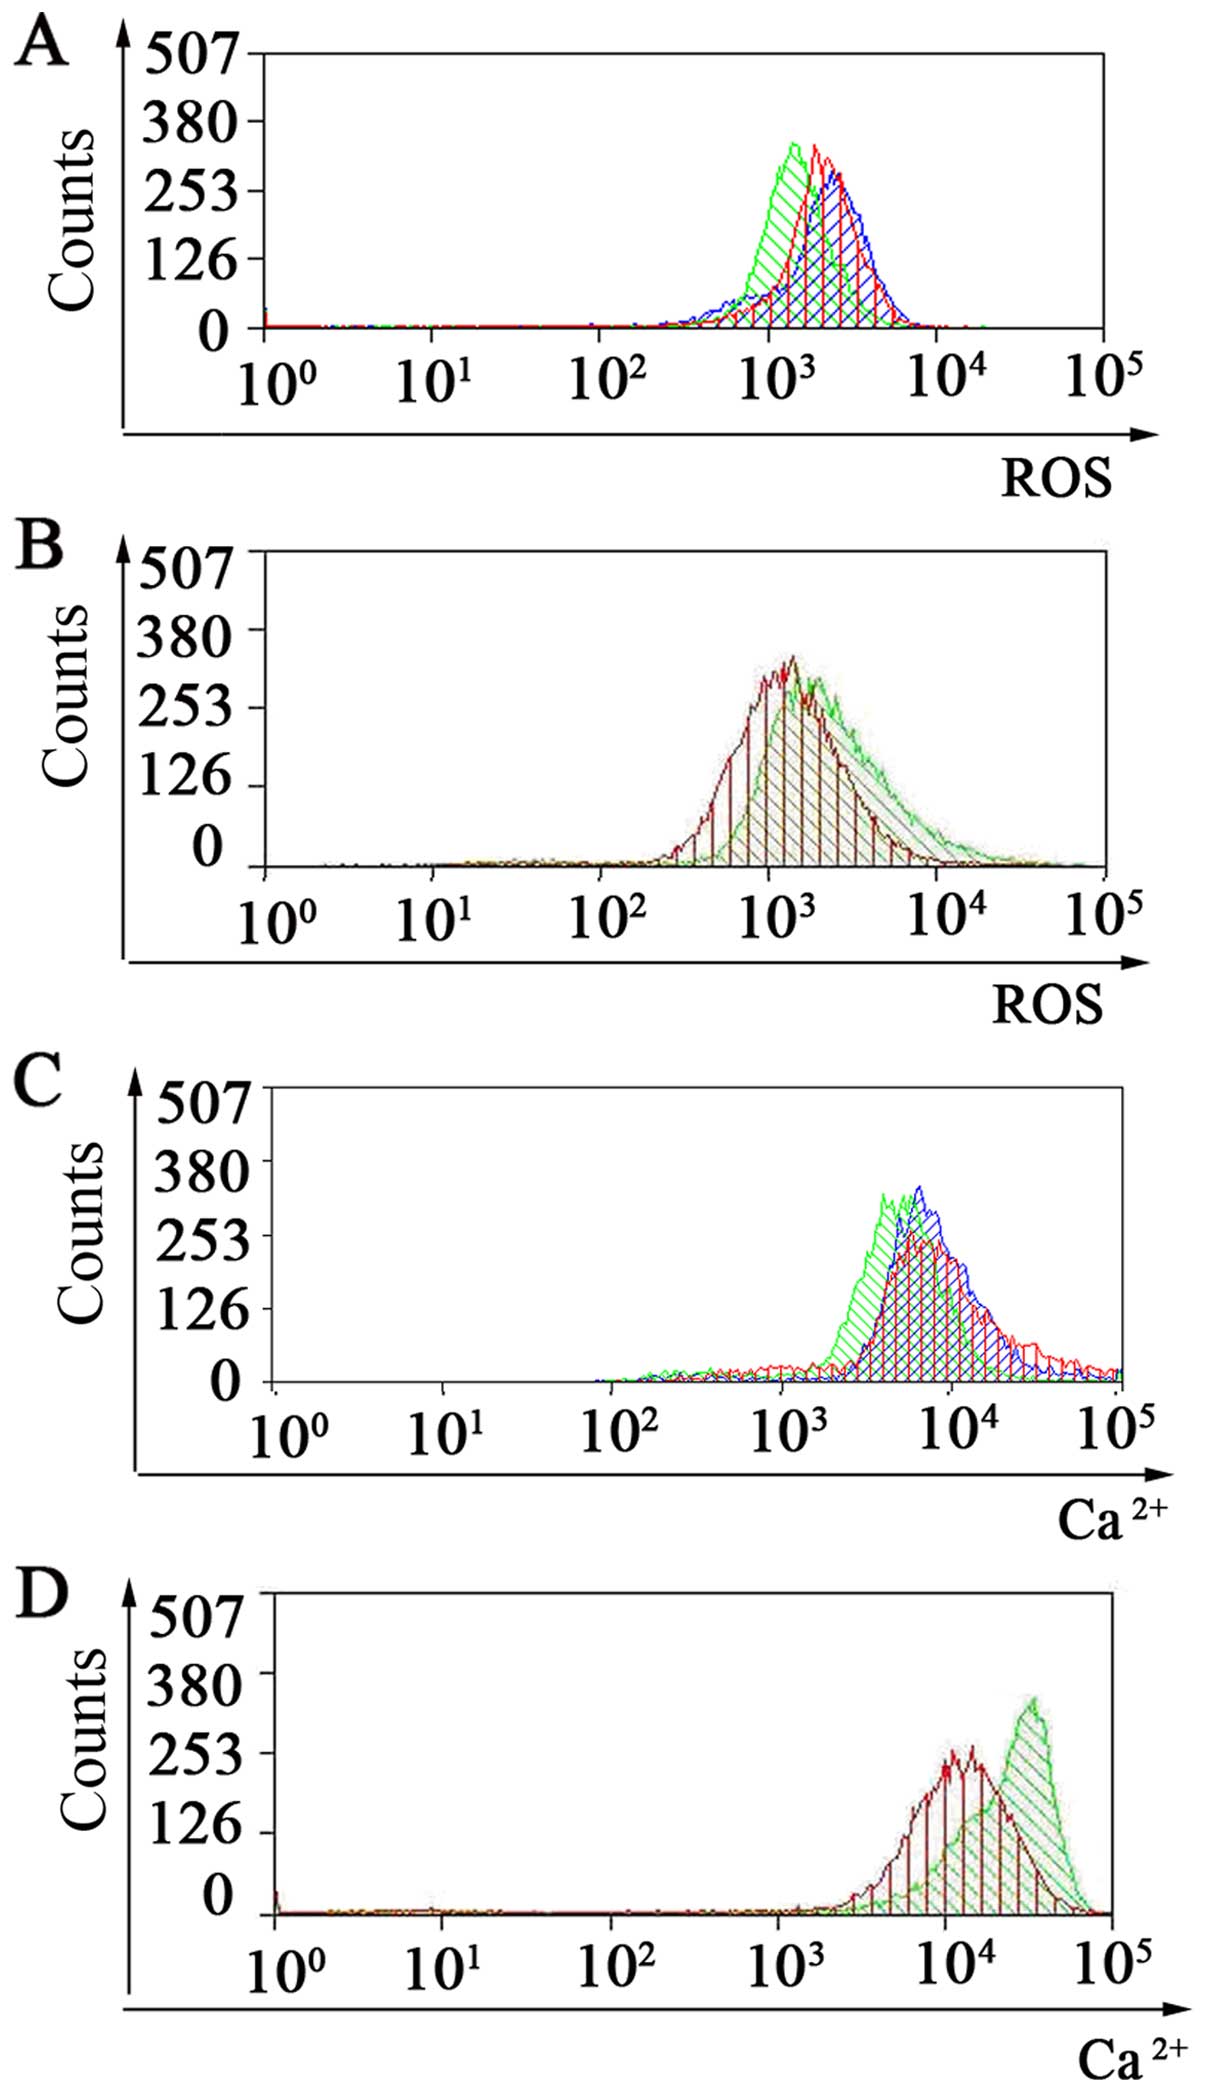 | Figure 3Detection of intracellular reactive
oxygen species (ROS) and calcium ion (Ca2+)
concentrations in gastric cancer cell line, AGS, by flow cytometry.
(A) ROS of AGS/CD90, AGS/vector and AGS cells was assessed by flow
cytometry. Green indicates AGS/CD90 cells, red indicates AGS cells,
blue means AGS/vector cells. (B) ROS of AGS/siCD90 and AGS cells
were assessed by flow cytometry. Green indicates AGS/siCD90 cells,
red indicates AGS cells. (C) Ca2+ concentrations of
AGS/CD90, AGS/vector and AGS cells were assessed by flow cytometry.
Green indicates AGS/CD90 cells, red indicates AGS cells, blue
indicates AGS/vector cells. (D) Ca2+ concentrations of
AGS/siCD90 and AGS cells were assessed by flow cytometry. Green
indicates AGS/siCD90 cells, red indicates AGS cells. Data are
representative of three independent experiments. |
CD90 is correlated with dysregulation of
SPARC and COL1A2 in gastric cancer tissues
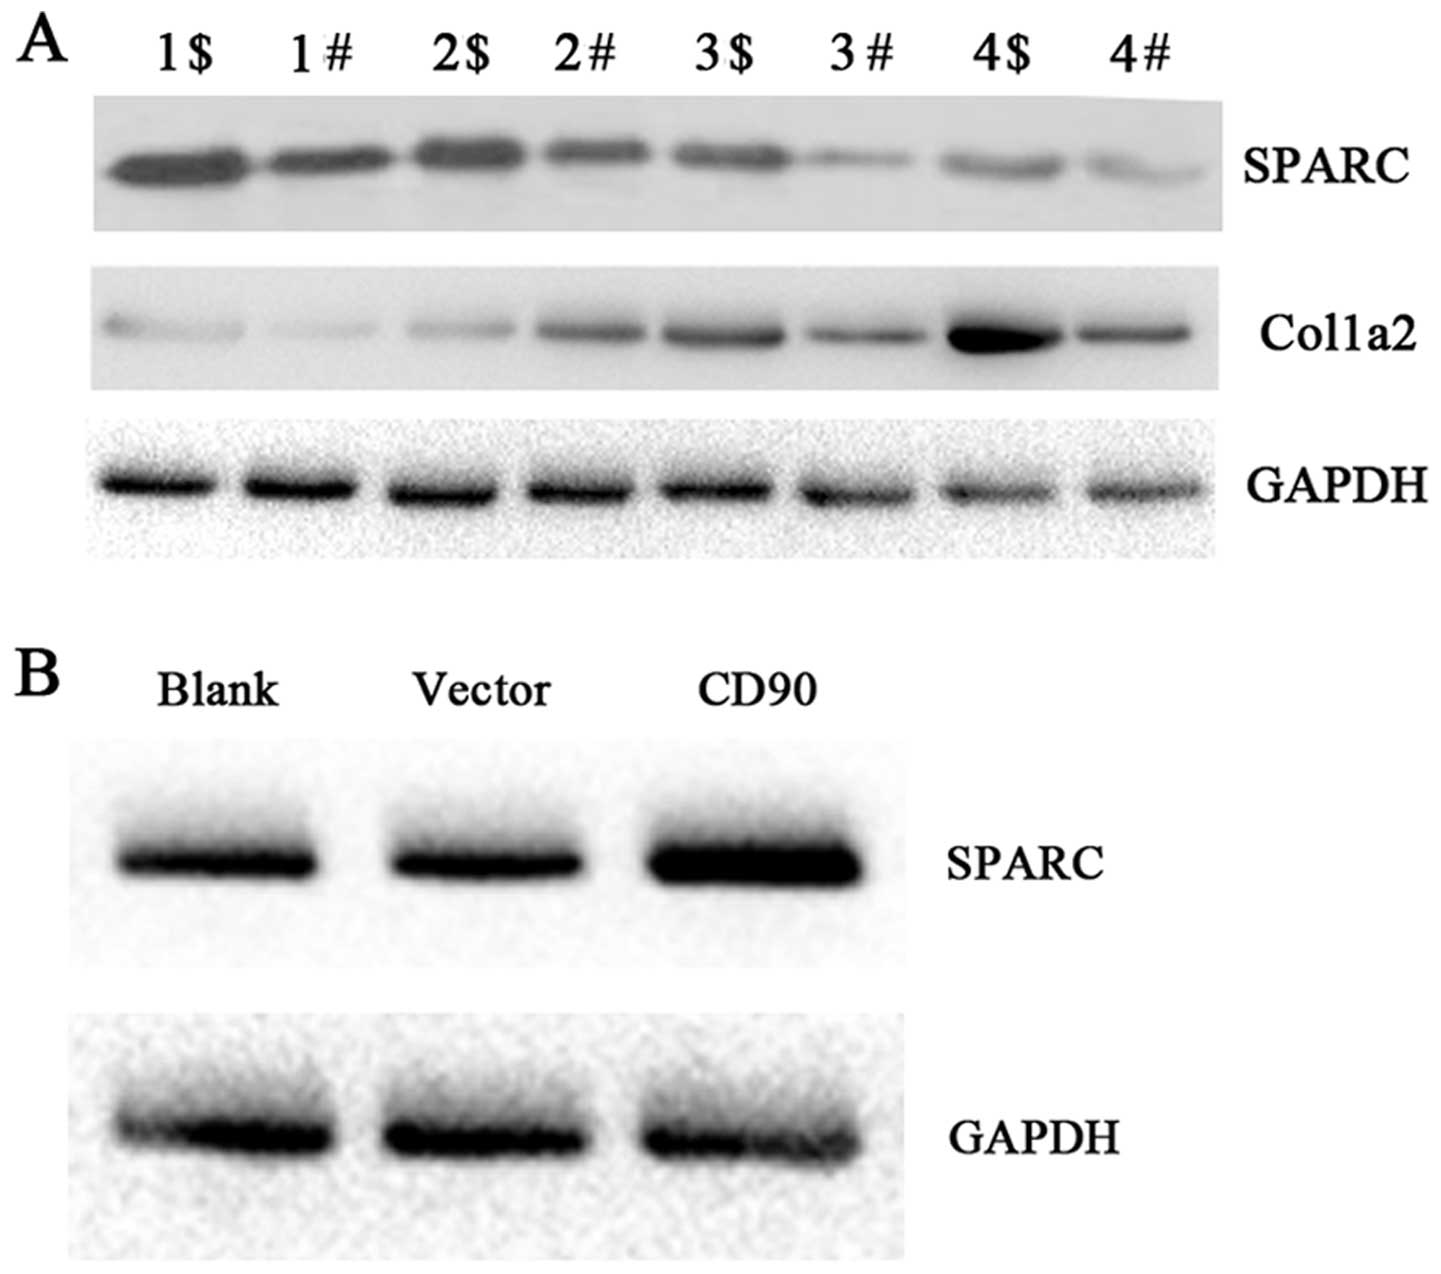
To discover the molecules affected by CD90, we
analyzed the genes co-expressed with CD90 by bioinformatic
analysis. We found that SPARC, COL1A2 and BGN were the most
relevant molecules with CD90. To test the results of the
bioinformatic analysis, we tested the expression levels of SPARC
and COL1A2 by western blot technology in the gastric cancer and the
adjacent non-cancerous tissues. SPARC and COL1A2 were upregulated
in the gastric cancer tissues when compared with the levels in the
adjacent non-cancerous tissues. Based on the findings that CD90 is
highly expressed in gastric cancer, we inferred that CD90 is
correlated with the dysregulation of SPARC and COL1A2 in gastric
cancer tissues (Fig. 4A).
Identification of differential proteins
affected by CD90 through LC-MS/MS analyses
We found that CD90 was highly expressed in gastric
cancer tissues and inhibited the apoptosis of gastric cancer cells
in vitro. Furthermore, our results suggested that CD90 was
correlated with dysregulation of SPARC and COL1A2 in gastric cancer
tissues. To confirm that CD90 inhibits cell apoptosis by modulating
the expression of SPARC and to screen other molecules affected by
CD90, we identified the different molecules affected by CD90
through LC-MS/MS analyses. The results showed that there were 132
proteins which were only present in the AGS/CD90 cells and there
were 155 proteins which were only present in the AGS/vector cells.
According to the frequency of unique peptides, the FLNB protein was
the highest in the AGS/CD90 cells, and the following included
EEF1D, HSPA8 and CCAR1 (Table
III). The SPARC protein was in the list of the top 30
differential proteins in the AGS/CD90 cells when compared with the
AGS/vector cells (Table III).
EEF1B2 protein was the highest in the AGS/vector cells (Table III).
| Table IIIThe differential proteins in AGS/CD90
and AGS/vector cells affected by CD90 through LC-MS/MS
analyses. |
Table III
The differential proteins in AGS/CD90
and AGS/vector cells affected by CD90 through LC-MS/MS
analyses.
| Νο. | AGS/CD90
| AGS/vector
|
|---|
| Protein | Unique
peptides | Coverage (%) | Protein score | Protein | Unique
peptides | Coverage (%) | Protein score |
|---|
| 1 | FLNB | 48 | 25.05 | 262.99 | EEF1B2 | 44 | 23.05 | 231.28 |
| 2 | EEF1D | 33 | 21.63 | 171.87 | KPNA6 | 42 | 11.23 | 224.82 |
| 3 | HSPA8 | 33 | 19.64 | 132.1 | DECR1 | 30 | 24.68 | 150.08 |
| 4 | CCAR1 | 32 | 9.13 | 114.32 | MGEA5 | 29 | 23.47 | 156.81 |
| 5 | LEPRE1 | 31 | 24.33 | 179.56 | RBM25 | 28 | 43.83 | 119.16 |
| 6 | OGFOD1 | 31 | 25.90 | 157.76 | ACAD9 | 26 | 16.73 | 137.39 |
| 7 | RGPD1 | 30 | 46.99 | 149.72 | OTUB2 | 26 | 16.30 | 72.34 |
| 8 | ACSL3 | 27 | 20.13 | 144.92 | LETM1 | 25 | 44.80 | 153.84 |
| 9 | CTTN | 26 | 45.72 | 184.4 | MRPL43 | 25 | 18.73 | 110.75 |
| 10 | MDH1 | 26 | 14.31 | 158.29 | BCAS2 | 24 | 28.79 | 121.47 |
| 11 | DEK | 24 | 48.59 | 151.03 | PFKFB3 | 23 | 47.65 | 168.64 |
| 12 | NDRG1 | 23 | 17.38 | 132.3 | IARS | 23 | 32.13 | 96.54 |
| 13 | RPL26 | 21 | 26.11 | 104.45 | SART3 | 21 | 37.00 | 175.58 |
| 14 | ACTBL2 | 20 | 36.47 | 158.23 | GATAD2B | 21 | 51.35 | 167.67 |
| 15 | MAGED2 | 20 | 46.78 | 124.36 | NADK2 | 21 | 12.18 | 102.87 |
| 16 | PABPN1 | 20 | 29.51 | 105.72 | TEX9 | 20 | 39.47 | 157.66 |
| 17 | SERPIND1 | 20 | 17.95 | 101.27 | CACNA1S | 20 | 25.64 | 135.74 |
| 18 | BZW1 | 19 | 39.36 | 216.67 | U2SURP | 20 | 35.64 | 107.69 |
| 19 | SIL1 | 19 | 48.45 | 135.76 | SMARCC2 | 20 | 9.62 | 103.38 |
| 20 | TMEM109 | 19 | 35.49 | 117.77 | DCTN2 | 20 | 45.92 | 87.19 |
| 21 | EIF4G2 | 19 | 32.71 | 95.42 | H3F3B | 19 | 39.07 | 107.83 |
| 22 | TRIM25 | 19 | 19.61 | 69.7 | VPS26A | 19 | 14.30 | 88.43 |
| 23 | DSG2 | 18 | 24.66 | 115.12 | ZC3HAV1 | 18 | 38.67 | 246.08 |
| 24 | PDCD4 | 18 | 43.28 | 93.35 | ALDH9A1 | 18 | 57.58 | 143.72 |
| 25 | SNX1 | 18 | 32.02 | 87.33 | UGP2 | 18 | 16.61 | 98.50 |
| 26 | LEPRE1 | 17 | 33.07 | 153.2 | GRPEL1 | 17 | 45.85 | 382.17 |
| 27 | ITGA5 | 17 | 42.52 | 118.48 | ZBTB17 | 17 | 31.98 | 185.06 |
| 28 | SPARC | 17 | 35.95 | 92.55 | CTSA | 17 | 42.52 | 95.30 |
| 29 | AP1B1 | 17 | 7.83 | 91.62 | TNKS1BP1 | 17 | 34.19 | 86.02 |
| 30 | CDC73 | 17 | 22.96 | 84.67 | FASN | 17 | 13.29 | 54.73 |
CD90 affects the expression of SPARC in
vitro
To confirm whether CD90 functions by modulating the
expression level of SPARC in vitro, we tested the expression
of SPARC protein using CD90 stable-expressing AGS/CD90 and control
AGS/vector cell lines by western blot analysis. The results showed
that SPARC was upregulated in the AGS cells which overexpressed
CD90 (Fig. 4B). Our results suggest
that CD90 overexpression affects the expression of SPARC in
vivo.
Discussion
Gastric cancer (GC) is the second most common cause
of cancer-related death according to the World Health Organization,
and 800,000 cancer-related deaths are caused by GC each year
globally (38). Over 70% of cases
occur in developing countries, particularly in East Asian countries
(38). Thus, identifying molecular
aberrations in GC may improve our understanding of gastric
carcinogenesis and help us subdivide patients into biologically and
clinically relevant subgroups, as well as to develop novel
therapeutic strategies.
In the present study, we found that the expression
of the CD90 gene was higher in gastric cancer samples compared with
that to the adjacent non-cancerous tissues and the normalized CD90
gene expression in gastric cancer was upregulated by 3.46-fold
(P<0.01); the same trend was found by western blot experiments.
IHC showed a pattern in protein expression similar with the qPCR
and western blotting results. A total of 61.5% (16/26) of gastric
cancer tissues had a high score of CD90 and 26.9% (7/26) of the
adjacent non-cancerous tissues. The distribution of low score was
23.1% (6/26) and 42.3% (11/26) in gastric cancer and the adjacent
non-cancerous tissues, respectively. Oikonomou et al found
that Thy-1 was detected in the majority of 57 gastrointestinal
stromal tumor (GIST) samples (54 out of 57 patients, 95%) and
Thy-1-negative patients had a better prognosis. Our results
corresponded with these results (13).
To uncover the potential mechanism of CD90 in GC, we
studied the effect of CD90 on the apoptosis of AGS gastric cancer
cells. Our results showed that there was a considerable decrease in
apoptosis in the AGS cells with CD90 overexpression. Compared with
the AGS cells, the rate of apoptotic cells was increased in the AGS
cells with CD90 interference (siCD90). Thy-1 is a versatile
modulator of signaling affecting cellular adhesion, proliferation,
survival and cytokine/growth factor responses (39). Thy-1 is an important regulator of
cell-cell and cell-matrix interactions, with important roles in
nerve regeneration, metastasis, inflammation and fibrosis (1). Previous findings and our results
suggest that CD90 affects cell apoptosis.
Cell apoptosis is closely related with a reduction
in mitochondrial membrane potential (ΔΨm) and an increase in
intracellular ROS and calcium ion (Ca2+) concentrations
(20–25). In this study, we found that
overexpression of CD90 in AGS gastric cancer cells led to an
increase in ΔΨm and a decrease in intracellular ROS and
Ca2+concentrations. Furthermore, siCD90 provided reverse
results. Wang et al (40)
found that overexpression of Mfn2 induced HepG2 cell apoptosis,
reduced the ΔΨm and endoplasmic reticulum (ER) calcium ion
(Ca2+) concentrations, and elevated intracellular ROS
and mitochondrial Ca2+ concentrations. The rise in the
intracellular calcium concentration Ca2+ caused
mitochondrial Ca2+ overload, thereby triggering
apoptosis (41).
In the present study, we identified and confirmed
that CD90 functions by modulated the expression level of SPARC
in vitro through LC-MS/MS analyses and western blot
technology. SPARC promoter methylation is an important factor in
the tumorigenesis of gastric carcinomas and provides new insights
into the potential use of SPARC as a novel biomarker and the
potential clinical importance in human gastric cancers (42). Overexpression of the SPARC gene may
be a useful independent predictor of outcomes in patients with
gastric cancer (43). Yin et
al found that downregulation of SPARC inhibited the invasion
and growth of human gastric cancer cells (44). Thus, the targeting of SPARC could be
an effective therapeutic approach against gastric cancer. Wang
et al reported the potential of SPARC as a prognostic marker
for gastric cancer (45). In
summary, our results suggest that CD90 is upregulated in gastric
cancer and inhibits gastric cancer cell apoptosis by modulating the
expression level of SPARC protein.
Abbreviations:
|
GC
|
gastric cancer
|
|
Thy-1 (also known as CD90)
|
Thy-1 cell surface antigen
|
|
SPARC
|
secreted protein, acidic,
cysteine-rich (osteonectin)
|
|
ROS
|
reactive oxygen species
|
|
FBS
|
fetal bovine serum
|
|
DCFH-DA
|
2′,7′-dichlorofluorescein
diacetate
|
|
PI
|
propidium iodide
|
|
IHC
|
immunohistochemistry
|
|
GADPH
|
glycer-aldehyde-3-phosphate
dehydrogenase
|
Acknowledgments
This study was supported by the National Natural
Science Foundation of China (81272975, 81172302 and 81402270); the
Key Project of Hunan Provincial Natural Science Foundation
(12JJ2044); the Project of Hunan Provincial Natural Science
Foundation (12JJ3121); the Project of Hunan Provincial Development
and Reform Commission; the Planned Science and Technology Project
of Hunan Province (2010FJ3088 and 2012FJ2014).
References
|
1
|
Rege TA and Hagood JS: Thy-1 as a
regulator of cell-cell and cell-matrix interactions in axon
regeneration, apoptosis, adhesion, migration, cancer and fibrosis.
FASEB J. 20:1045–1054. 2006. View Article : Google Scholar : PubMed/NCBI
|
|
2
|
Scognamiglio G, D'Antonio A, Rossi G,
Cavazza A, Camerlingo R, Pirozzi G, La Mantia E, Anniciello AM,
Morabito A, Cantile M, et al: CD90 expression in atypical
meningiomas and meningioma metastasis. Am J Clin Pathol.
141:841–849. 2014. View Article : Google Scholar : PubMed/NCBI
|
|
3
|
Kitayama J, Emoto S, Yamaguchi H, Ishigami
H, Yamashita H, Seto Y, Matsuzaki K and Watanabe T: CD90(+)CD45(-)
intra-peritoneal mesothelial-like cells inhibit T cell activation
by production of arginase I. Cell Immunol. 288:8–14. 2014.
View Article : Google Scholar : PubMed/NCBI
|
|
4
|
Ohmura-Kakutani H, Akiyama K, Maishi N,
Ohga N, Hida Y, Kawamoto T, Iida J, Shindoh M, Tsuchiya K,
Shinohara N, et al: Identification of tumor endothelial cells with
high aldehyde dehydrogenase activity and a highly angiogenic
phenotype. PLoS One. 9:e1139102014. View Article : Google Scholar : PubMed/NCBI
|
|
5
|
Liu JY, Peng HF, Gopinath S, Tian J and
Andreadis ST: Derivation of functional smooth muscle cells from
multipotent human hair follicle mesenchymal stem cells. Tissue Eng.
16:2553–2564. 2010. View Article : Google Scholar
|
|
6
|
Gorantla VS, Schneeberger S, Moore LR,
Donnenberg VS, Zimmerlin L, Lee WP and Donnenberg AD: Development
and validation of a procedure to isolate viable bone marrow cells
from the vertebrae of cadaveric organ donors for composite organ
grafting. Cytotherapy. 14:104–113. 2012. View Article : Google Scholar
|
|
7
|
Tang KH, Dai YD, Tong M, Chan YP, Kwan PS,
Fu L, Qin YR, Tsao SW, Lung HL, Lung ML, et al: A CD90(+)
tumor-initiating cell population with an aggressive signature and
metastatic capacity in esophageal cancer. Cancer Res. 73:2322–2332.
2013. View Article : Google Scholar : PubMed/NCBI
|
|
8
|
Sukowati CH, Anfuso B, Torre G,
Francalanci P, Crocè LS and Tiribelli C: The expression of
CD90/Thy-1 in hepatocellular carcinoma: An in vivo and in vitro
study. PLoS One. 8:e768302013. View Article : Google Scholar : PubMed/NCBI
|
|
9
|
Kawamura K, Hiroshima K, Suzuki T, Chai K,
Yamaguchi N, Shingyoji M, Yusa T, Tada Y, Takiguchi Y, Tatsumi K,
et al: CD90 is a diagnostic marker to differentiate between
malignant pleural mesothelioma and lung carcinoma with
immunohistochemistry. Am J Clin Pathol. 140:544–549. 2013.
View Article : Google Scholar : PubMed/NCBI
|
|
10
|
Schubert K, Gutknecht D, Köberle M,
Anderegg U and Saalbach A: Melanoma cells use Thy-1 (CD90) on
endothelial cells for metastasis formation. Am J Pathol.
182:266–276. 2013. View Article : Google Scholar
|
|
11
|
Wandel E, Saalbach A, Sittig D, Gebhardt C
and Aust G: Thy-1 (CD90) is an interacting partner for CD97 on
activated endothelial cells. J Immunol. 188:1442–1450. 2012.
View Article : Google Scholar : PubMed/NCBI
|
|
12
|
Zhu J, Thakolwiboon S, Liu X, Zhang M and
Lubman DM: Overexpression of CD90 (Thy-1) in pancreatic
adenocarcinoma present in the tumor microenvironment. PLoS One.
9:e1155072014. View Article : Google Scholar : PubMed/NCBI
|
|
13
|
Oikonomou D, Hassan K, Kaifi JT, Fiegel
HC, Schurr PG, Reichelt U, Aridome K, Yekebas EF, Mann O, Kluth D,
et al: Thy-1 as a potential novel diagnostic marker for
gastrointestinal stromal tumors. J Cancer Res Clin Oncol.
133:951–955. 2007. View Article : Google Scholar : PubMed/NCBI
|
|
14
|
Jiang J, Zhang Y, Chuai S, Wang Z, Zheng
D, Xu F, Zhang Y, Li C, Liang Y and Chen Z: Trastuzumab (Herceptin)
targets gastric cancer stem cells characterized by CD90 phenotype.
Oncogene. 31:671–682. 2012. View Article : Google Scholar
|
|
15
|
Goldar S, Khaniani MS, Derakhshan SM and
Baradaran B: Molecular mechanisms of apoptosis and roles in cancer
development and treatment. Asian Pac J Cancer Prev. 16:2129–2144.
2015.PubMed/NCBI
|
|
16
|
Paul I and Jones JM: Apoptosis block as a
barrier to effective therapy in non small cell lung cancer. World J
Clin Oncol. 5:588–594. 2014. View Article : Google Scholar : PubMed/NCBI
|
|
17
|
Beesoo R, Neergheen-Bhujun V, Bhagooli R
and Bahorun T: Apoptosis inducing lead compounds isolated from
marine organisms of potential relevance in cancer treatment. Mutat
Res. 768:84–97. 2014. View Article : Google Scholar : PubMed/NCBI
|
|
18
|
Li X, Li H, Zhang R and Liu J and Liu J:
MicroRNA-449a inhibits proliferation and induces apoptosis by
directly repressing E2F3 in gastric cancer. Cell Physiol Biochem.
35:2033–2042. 2015. View Article : Google Scholar : PubMed/NCBI
|
|
19
|
Marczak A, Denel-Bobrowska M, Łukawska M
and Oszczapowicz I: Formamidinodoxorubicins are more potent than
doxorubicin as apoptosis inducers in human breast cancer cells.
Anticancer Res. 35:1935–1940. 2015.PubMed/NCBI
|
|
20
|
Hacker K and Medler KF: Mitochondrial
calcium buffering contributes to the maintenance of basal calcium
levels in mouse taste cells. J Neurophysiol. 100:2177–2191. 2008.
View Article : Google Scholar : PubMed/NCBI
|
|
21
|
Ogura T, Margolskee RF and Kinnamon SC:
Taste receptor cell responses to the bitter stimulus denatonium
involve Ca2+ influx via store-operated channels. J
Neurophysiol. 87:3152–3155. 2002.PubMed/NCBI
|
|
22
|
Akabas M, Dodd J and al-Awqati Q:
Identification of electrophysiologically distinct subpopulations of
rat taste cells. J Membr Biol. 114:71–78. 1990. View Article : Google Scholar : PubMed/NCBI
|
|
23
|
Pulkkinen V, Manson ML, Säfholm J, Adner M
and Dahlén SE: The bitter taste receptor (TAS2R) agonists
denatonium and chloroquine display distinct patterns of relaxation
of the guinea pig trachea. Am J Physiol Lung Cell Mol Physiol.
303:L956–L966. 2012. View Article : Google Scholar : PubMed/NCBI
|
|
24
|
Ruiz-Avila L, McLaughlin SK, Wildman D,
McKinnon PJ, Robichon A, Spickofsky N and Margolskee RF: Coupling
of bitter receptor to phosphodiesterase through transducin in taste
receptor cells. Nature. 376:80–85. 1995. View Article : Google Scholar : PubMed/NCBI
|
|
25
|
Li Y, Su X, Wang X, Leung AW, Xu C, Wang P
and Liu Q: Cytotoxic effect of protoporphyrin IX to human leukemia
U937 cells under ultrasonic irradiation. Cell Physiol Biochem.
33:1186–1196. 2014. View Article : Google Scholar : PubMed/NCBI
|
|
26
|
Livak KJ and Schmittgen TD: Analysis of
relative gene expression data using real-time quantitative PCR and
the 2(-Delta Delta C(T)) method. Methods. 25:402–408. 2001.
View Article : Google Scholar
|
|
27
|
Zhou Y, Wang W, Zheng D, Peng S, Xiong W,
Ma J, Zeng Z, Wu M, Zhou M, Xiang J, et al: Risk of nasopharyngeal
carcinoma associated with polymorphic lactotransferrin haplotypes.
Med Oncol. 29:1456–1462. 2012. View Article : Google Scholar
|
|
28
|
Xiao S, Zhou Y, Yi W, Luo G, Jiang B, Tian
Q, Li Y and Xue M: Fra-1 is downregulated in cervical cancer
tissues and promotes cervical cancer cell apoptosis by p53
signaling pathway in vitro. Int J Oncol. 46:1677–1684.
2015.PubMed/NCBI
|
|
29
|
Zheng D, Liao S, Zhu G, Luo G, Xiao S, He
J, Pei Z, Li G and Zhou Y: CD38 is a putative functional marker for
side population cells in human nasopharyngeal carcinoma cell lines.
Mol Carcinog. Jan 28–2015.Epub ahead of print. View Article : Google Scholar
|
|
30
|
Liao S, Xiao S, Zhu G, Zheng D, He J, Pei
Z, Li G and Zhou Y: CD38 is highly expressed and affects the
PI3K/Akt signaling pathway in cervical cancer. Oncol Rep.
32:2703–2709. 2014.PubMed/NCBI
|
|
31
|
Zhu W, Li J, Su J, Li J, Li J, Deng B, Shi
Q, Zhou Y and Chen X: FOS-like antigen 1 is highly expressed in
human psoriasis tissues and promotes the growth of HaCaT cells in
vitro. Mol Med Rep. 10:2489–2494. 2014.PubMed/NCBI
|
|
32
|
Hara A and Okayasu I: Cyclooxygenase-2 and
inducible nitric oxide synthase expression in human astrocytic
gliomas: Correlation with angiogenesis and prognostic significance.
Acta Neuropathol. 108:43–48. 2004. View Article : Google Scholar : PubMed/NCBI
|
|
33
|
Spearman C: The proof and measurement of
association between two things. Int J Epidemiol. 39:1137–1150.
2010. View Article : Google Scholar : PubMed/NCBI
|
|
34
|
Huang W, Sherman BT and Lempicki RA:
Systematic and integrative analysis of large gene lists using DAVID
bioinformatics resources. Nat Protoc. 4:44–57. 2009. View Article : Google Scholar
|
|
35
|
Heo S, Spoerk S, Birner-Gruenberger R and
Lubec G: Gel-based mass spectrometric analysis of hippocampal
transmembrane proteins using high resolution LTQ Orbitrap Velos
Pro. Proteomics. 14:2084–2088. 2014. View Article : Google Scholar : PubMed/NCBI
|
|
36
|
Haddad T and Kümmerer K: Characterization
of photo-transformation products of the antibiotic drug
Ciprofloxacin with liquid chromatography-tandem mass spectrometry
in combination with accurate mass determination using an
LTQ-Orbitrap. Chemosphere. 115:40–46. 2014. View Article : Google Scholar : PubMed/NCBI
|
|
37
|
Zhang JY, Wang F, Zhang H, Lu JQ and Qiao
YJ: Rapid identification of polymethoxylated flavonoids in
traditional Chinese medicines with a practical strategy of stepwise
mass defect filtering coupled to diagnostic product ions analysis
based on a hybrid LTQ-Orbitrap mass spectrometer. Phytochem Anal.
25:405–414. 2014. View Article : Google Scholar : PubMed/NCBI
|
|
38
|
Jemal A, Bray F, Center MM, Ferlay J, Ward
E and Forman D: Global cancer statistics. CA Cancer J Clin.
61:69–90. 2011. View Article : Google Scholar : PubMed/NCBI
|
|
39
|
Rege TA and Hagood JS: Thy-1, a versatile
modulator of signaling affecting cellular adhesion, proliferation,
survival, and cytokine/growth factor responses. Biochim Biophys
Acta. 1763:991–999. 2006. View Article : Google Scholar : PubMed/NCBI
|
|
40
|
Wang W, Xie Q, Zhou X, Yao J, Zhu X, Huang
P, Zhang L, Wei J, Xie H, Zhou L, et al: Mitofusin-2 triggers
mitochondria Ca2+ influx from the endoplasmic reticulum
to induce apoptosis in hepatocellular carcinoma cells. Cancer Lett.
358:47–58. 2015. View Article : Google Scholar
|
|
41
|
Liu KH, Yang ST, Lin YK, Lin JW, Lee YH,
Wang JY, Hu CJ, Lin EY, Chen SM, Then CK, et al: Fluoxetine, an
antidepressant, suppresses glioblastoma by evoking AMPAR-mediated
calcium-dependent apoptosis. Oncotarget. 6:5088–5101. 2015.
View Article : Google Scholar : PubMed/NCBI
|
|
42
|
Chen ZY, Zhang JL, Yao HX, Wang PY, Zhu J,
Wang W, Wang X, Wan YL, Chen SW, Chen GW, et al: Aberrant
methylation of the SPARC gene promoter and its clinical implication
in gastric cancer. Sci Rep. 4:70352014. View Article : Google Scholar : PubMed/NCBI
|
|
43
|
Sato T, Oshima T, Yamamoto N, Yamada T,
Hasegawa S, Yukawa N, Numata K, Kunisaki C, Tanaka K, Shiozawa M,
et al: Clinical significance of SPARC gene expression in patients
with gastric cancer. J Surg Oncol. 108:364–368. 2013. View Article : Google Scholar : PubMed/NCBI
|
|
44
|
Yin J, Chen G, Liu Y, Liu S, Wang P, Wan
Y, Wang X, Zhu J and Gao H: Downregulation of SPARC expression
decreases gastric cancer cellular invasion and survival. J Exp Clin
Cancer Res. 29:592010. View Article : Google Scholar : PubMed/NCBI
|
|
45
|
Wang CS, Lin KH, Chen SL, Chan YF and
Hsueh S: Overexpression of SPARC gene in human gastric carcinoma
and its clinic-pathologic significance. Br J Cancer. 91:1924–1930.
2004. View Article : Google Scholar : PubMed/NCBI
|