Introduction
Pancreatic cancer is now the fifth leading cause of
cancer-related deaths, and the annual mortality is estimated to be
more than 20,000 in Japan. The 5-year survival rate of pancreatic
cancer is as low as 5.5%, and the poor prognosis is attributed to
the difficulty of detecting the disease at an early stage, the high
malignant potential and the propensity of the cancer to
metastasize, and the high resistance level to antitumor agents.
Metformin is an oral biguanide drug introduced into
clinical practice in the 1950s for the treatment of type 2
diabetes. According to a recent epidemiological survey, metformin
has significant effects on tumorigenesis (1). For instance, it is reported that
patients with type 2 diabetes who are prescribed metformin have a
lower risk of cancer compared to patients who do not take metformin
(2). In addition, numerous
interventional clinical trials have tested the efficacy of
metformin in various human cancers, including pancreatic cancer.
Basic investigations have also been performed, and have shown that
metformin may inhibit the proliferation of prostate (3), breast (4,5), colon
(5,6) and pancreatic cancer (7) cells. Metformin was also found to
inhibit the tumor growth of prostate (3) and pancreatic cancer (8) in xenograft models. In a recent study,
we reported that metformin inhibited the proliferation of gastric
cancer cells in vitro and in vivo (9). However, the detailed mechanism of the
suppression of pancreatic cancer growth by metformin remains
relatively unknown.
MicroRNAs (miRNAs) are small, non-coding RNA
molecules of 17–27 nucleotides in length, and are involved in gene
regulation at the post-transcriptional level. miRNAs play critical
roles in diverse biological processes, such as development and
differentiation, control of cellular proliferation, stress response
and metabolism (10). Recent
studies have shown that miRNAs are aberrantly expressed in
virtually all types of human cancer; that miRNAs may function as
tumor suppressors or oncogenes; and that alteration in miRNA
expression may play a critical role in tumorigenesis and cancer
progression (11). miRNAs seem to
be very significant prognostic factors in patients with different
tumors and thus could be useful biomarkers for treatment (12).
In the present study, we showed that metformin has
an effective anticancer effect on pancreatic cancer, and we
examined the expression of cell cycle-related molecules in relation
to the mechanism of the antitumor effect of metformin. In addition,
we identified several miRNAs associated with the antitumor effects
of metformin.
Materials and methods
Chemicals
Metformin (1,1-dimethylbiguanide) was purchased from
Dainippon Sumitomo Pharma Inc. (Osaka, Japan). The Cell Counting
Kit-8 (CCK-8) was purchased from Dojindo Laboratories (Kumamoto,
Japan), and all other chemicals were obtained from Sigma Chemical
Co. (Tokyo, Japan).
Antibodies
The antibodies used were anti-β-actin monoclonal
antibody (A5441, used at 1:3,000; Sigma-Aldrich Co., St. Louis, MO,
USA), cyclin D1 (RB-9041, used at 1:1,000; Thermo Fisher Scientific
K.K., Waltham, MA, USA), cyclin E (used at 1:1,000; BD Biosciences,
San Jose, CA, USA), CDK6 (sc-177, used at 1:1,000), CDK4 (sc-749,
used at 1:2,500), phosphorylated retinoblastoma protein (Rb)
(sc-50, used at 1:1,000) (all from Santa Cruz Biotechnology, Santa
Cruz, CA, USA), and secondary horseradish peroxidase-linked
anti-mouse and anti-rabbit IgG antibodies (used at 1:2,000; GE
Healthcare, Ltd., Buckinghamshire, UK).
Cell lines and culture
The human pancreatic cancer cell lines PK1, PK9 and
Panc1 were obtained from the Japanese Cancer Research Resources
Bank (Tokyo, Japan). Cells were grown in RPMI-1640 medium (Gibco
Invitrogen, Carlsbad, CA, USA) supplemented with 10% fetal bovine
serum (FBS) (533-69545; Wako, Japan), and penicillin-streptomycin
(100 mg/l; Gibco Invitrogen) in a humidified atmosphere of 5%
CO2 at 37°C.
Cell proliferation assay
Cell proliferation assays were performed with a
CCK-8 kit according to the manufacturer's instructions. Cells of
each cell line (1×10⁴) were seeded into the well of a
96-well plate and were cultured in 100 µl of RPMI-1640
supplemented with 10% FBS. After 24 h, the seeded cells were
treated by addition of metformin (5 or 10 mM) to the culture medium
or left untreated (controls). At the indicated time points, the
medium was exchanged for 110 µl of RPMI-1640 with CCK-8
reagent (10 µl CCK-8 and 100 µl RPMI-1640), and the
cells were incubated for 2 h. Absorbance was measured for each well
at a wavelength of 450 nm using an auto-microplate reader.
Cell and tissue lysates
The lysate assay was performed according to the
methods described in our previous studies (9,13). All
steps were carried out at 4°C. Protein concentrations were measured
using a dye-binding protein assay based on the Bradford method.
Gel electrophoresis and western blot
analysis
Sodium dodecyl sulfate-polyacrylamide gel
electrophoresis (SDS-PAGE) was performed according to the method of
Laemmli (14), and the western blot
analysis was performed as described by Towbin et al
(15) using primary antibodies and
HRP-conjugated secondary antibodies. Immunoreactive proteins were
visualized with an enhanced chemiluminescence detection system
(Amersham Life Sciences, Tokyo, Japan) on X-ray film.
Xenograft model analysis
Animal experiments were performed according to the
guidelines of the Committee on Experimental Animals of Kagawa
University. We purchased 30 male athymic mice (BALB/c-nu/nu, 8
weeks old, 20–25 g) from Japan SLC (Hamamatsu, Japan). The animals
were maintained under specific pathogen-free conditions using a
laminar airflow rack and had continuous free access to sterilized
food [γ-ray-irradiated food CL-2 (Clea, Tokyo, Japan)] and
autoclaved water. Each mouse was inoculated with Panc1 cells
(5×10⁷ cells/animal) subcutaneously in the flank region.
Two weeks later, the xenografts were identifiable as masses of
>5 mm in maximal diameter in all recipients.
The animals were randomly assigned to three groups.
Animals in the metformin-treated groups received intraperitoneal
(i.p.) administration of 1 or 2 mg/body metformin/day, 5 times a
week for 5 weeks. Animals of the control group were administered
only phosphate-buffered saline (PBS) (n=10). After initiation of
the administration of metformin, the tumor growth was monitored by
the same investigator (K.K. and T.M.), and the tumorigenesis of the
pancreatic cancer was monitored every day. The tumor size was
measured weekly by measuring the two greatest perpendicular tumor
dimensions. To examine the significance of the differences between
growth curves in the present study, all the measurements of tumor
volume for each growth curve from the start of the treatment to the
end, typically ~30 observations, were analyzed by one-way analysis.
The tumor volume was calculated as follows: Tumor volume
(mm3) = [tumor length (mm) × tumor width
(mm)2]/2. All animals were sacrificed on day 35 after
treatment. All animals were alive during the observation.
Antibody arrays of phospho-RTK
A RayBio™ Human Phospho Array kit (catalog no. ARY
001) was purchased from RayBiotech Inc. (Norcross, GA, USA). The
assay for the phospho-RTK array was performed according to the
manufacturer's instructions. This assay allows the screening of 42
different phosphorylated human RTKs. Capture and control antibodies
were spotted in duplicate on nitrocellulose membranes. Lysates
prepared from the cells and tumor tissues were diluted and
incubated with the array's membranes. After allowing the material
to bind with the extracellular domain of both phosphorylated and
unphosphorylated RTKs, the unbound material was washed away. A pan
anti-phospho-tyrosine antibody conjugated to horseradish peroxidase
was then used to detect phosphorylated tyrosines on activated
receptors by chemiluminescence. Finally, the density of the
immunoreactive band obtained on the RTK arrays was analyzed by
densitometric scanning with a Tlc scanner (Shimizu Co., Ltd.,
Kyoto, Japan).
EGFR phosphorylation antibody array
To assess whether the phosphorylation sites of
epidermal growth factor receptor (EGFR) are regulated by the
antitumor effect of metformin, the RayBio Human EGFR
Phosphorylation Antibody Array (RayBiotech Inc.) was used according
to the manufacturer's protocol. This method is a dot-blot-based
assay which enables detection and comparison of 17 different
specific phosphorylation sites in the human EGFR family. This array
was used to add metformin-treated or untreated cell and tumor
tissue lysates to the antibody array membranes. The antibody array
membranes were washed and a cocktail of biotin-conjugated anti-EGFR
was used to detect phosphorylated ErbB1-B4 and pan ErbB1-B4. After
incubation with HRP-streptavidin, the signals were visualized by
chemiluminescence.
Finally, the densities of the immunoreactive bands
obtained on the RTK arrays were analyzed by densitometric scanning
with a Tlc scanner.
Analysis of the miRNA microarray
The samples of tumor tissues and cancer cell lines
were processed for total RNA extraction with an miRNeasy Mini kit
(Qiagen) according to the manufacturer's instructions. RNA samples
typically showed A260/280 ratios between 1.9 and 2.1. The RNA
integrity was further confirmed by use of an Agilent 2100
Bioanalyzer (Agilent Technologies, Palo Alto, CA, USA).
After RNA measurement on an RNA 6000 Nano kit, the
samples were labeled using a miRCURY Hy3/Hy5 Power labeling kit and
were hybridized on a human miRNA Oligo chip (v.14.0; Toray
Industries Inc., Kanagawa, Japan). Scanning was performed with a
3D-Gene Scanner 3000 (Toray Industries Inc.). 3D-Gene extraction
software, version 1.2 (Toray Industries Inc.) was used to read the
raw intensity of the image. To determine the change in microRNA
expression between metformin-treated and control samples, the raw
data were analyzed via GeneSpringGX version 10.0 (Agilent
Technologies). Samples were first normalized relative to 28sRNA and
baseline corrected to the median of all samples.
Replicate data were consolidated into two groups
based on metformin treatment and control, and were organized using
the hierarchical clustering and analysis of variance (ANOVA)
functions in the GeneSpring software. Hierarchical clustering was
carried out by use of the clustering function (condition tree) and
Euclidean correlation as a distance metric. Two-way ANOVA analysis
and asymptotic P-value computation without any error correction on
the samples was performed to search for miRNAs which varied most
prominently across the different groups. The cut-off for the
P-values was set to 0.05. Only changes >50% in at least one of
the time points for each sample were considered significant. All
the analyzed data were scaled by global normalization. The
statistical significance of differentially expressed miRNA was
analyzed by the Student's t-test.
Statistical analysis
All analyses were performed using the
computer-assisted JMP8.0 (SAS Institute, Cary, NC, USA). Paired
analysis between two groups was performed using a t-test. A P-value
of 0.05 was considered to indicate a significant difference between
groups.
Results
Metformin inhibits the proliferation of
human pancreatic cancer cells
To evaluate the effect of the growth activity of
metformin on human pancreatic cancer cells in vitro, we
examined the effect of metformin on proliferation in three
pancreatic cancer cell lines, namely, PK1, PK9 and Panc1. Cells
were grown in 10% FBS and were treated with 5 or 10 mM metformin or
left untreated (controls; see Materials and methods). To
investigate the possibility of a direct relationship between the
decrease in cell viability and the inhibition of cell
proliferation, we followed the course of proliferation over 3 days
after the addition of metformin. As shown in Fig. 1A, metformin (0, 5 and 10 mM) led to
a decrease in cell proliferation in a dose- and time-dependent
manner. These results showed that metformin inhibits the
proliferation of pancreatic cancer cells.
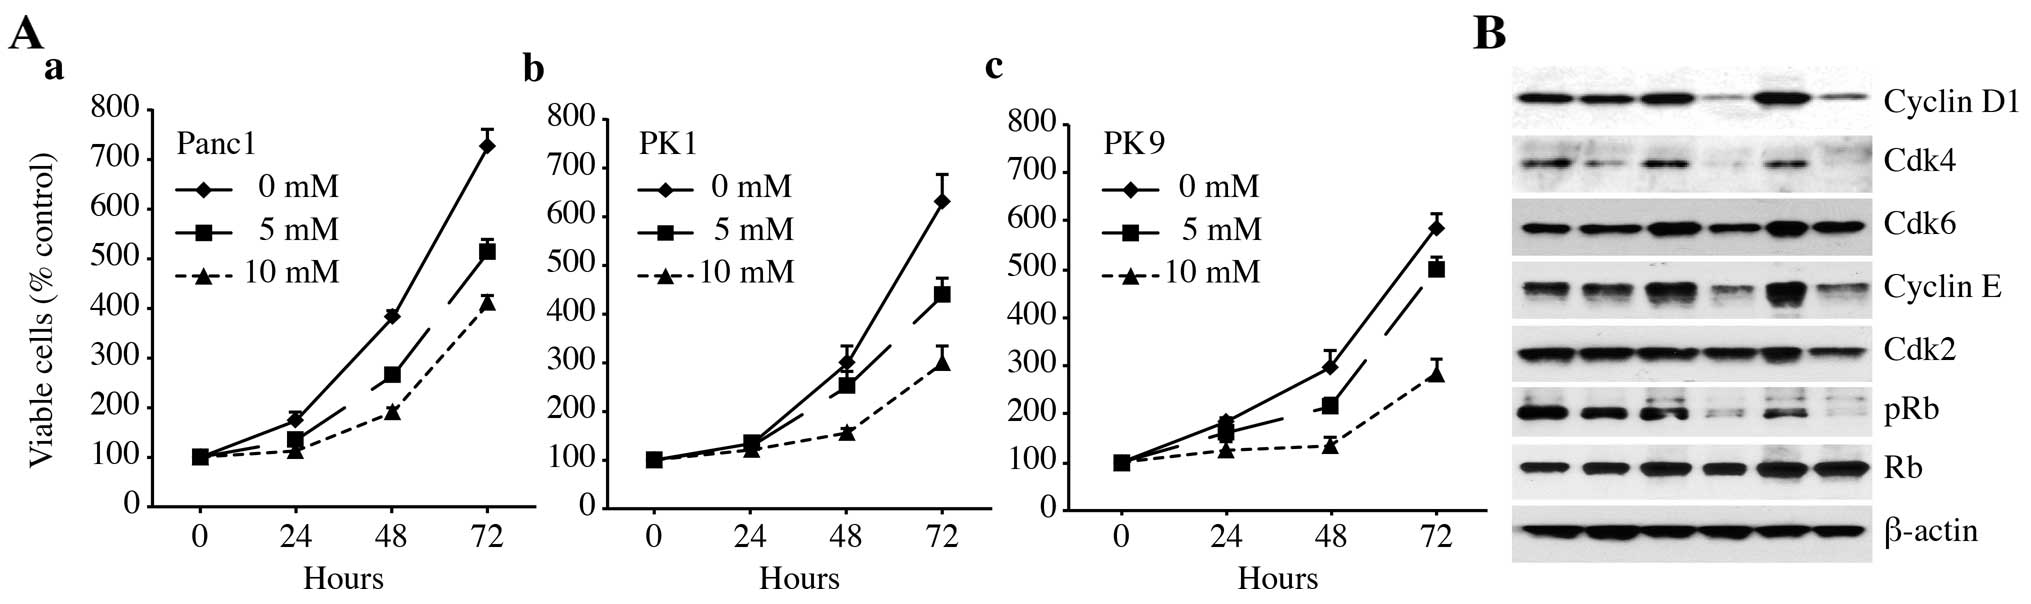 | Figure 1Metformin inhibits the proliferation
of cultured pancreatic cancer cells. (A) (a) Panc1, (b) PK1 and (c)
PK9 cells were seeded at 10,000 cells/well in a 96-well plate and
the agents were added at time 0 h. A Cell Counting Kit-8 assay was
performed daily from time 0 to 72 h as described in Materials and
methods. The data points represent the mean cell number from three
independent cultures, and the error bars represent standard
deviations. For each cell line, the conditions at 48 and 72 h were
significantly different when compared to the control (0 mM), based
on an analysis using Student's t-test (P<0.05). (B) Metformin
affects the expression levels of the various cell cycle-regulatory
proteins in the G0/G1 cycle in Panc1 cells. Western blotting of
cyclin D1, Cdk4, Cdk6, cyclin E, Cdk2, phosphorylated Rb (pRb) and
Rb in Panc1 cells was performed at 24, 48 and 72 h after the
addition of 10 mM metformin (Met) for the indicated times. β-actin
was used as a loading control. |
To study whether metformin affects the cell cycle in
Panc1 cells, western blot analysis was used to examine the
expression of various cell cycle-related molecules in Panc1 cells
with and without treatment of metformin. Cells were treated with 10
mM metformin or left untreated for 24–72 h. The most remarkable
change was the loss of cyclin D1 and Cdk4 protein. Cyclin D1 is a
key protein implicated in the transition of the G0/G1 phase. The
cyclin D1 and Cdk4 levels declined slightly at 24 h after the
addition of metformin and were no longer detectable after 48 and 72
h. Cdk6, the catalytic subunit of cyclin D1, as well as Cdk4, were
decreased at 48 and 72 h in the metformin-treated cells compared
with the untreated cells. As shown in Fig. 1B, we then studied the expression of
other cell cycle-related proteins (pRb, Cdk 2 and cyclin E). The
protein levels of Cdk2 and cyclin E in the cells treated with
metformin for 24–72 h decreased slightly when compared with the
corresponding levels in the cells not treated with metformin
(Fig. 1B). Although the Rb protein
level did not change, the phosphorylated pRb levels decreased
progressively in the metformin-treated cells.
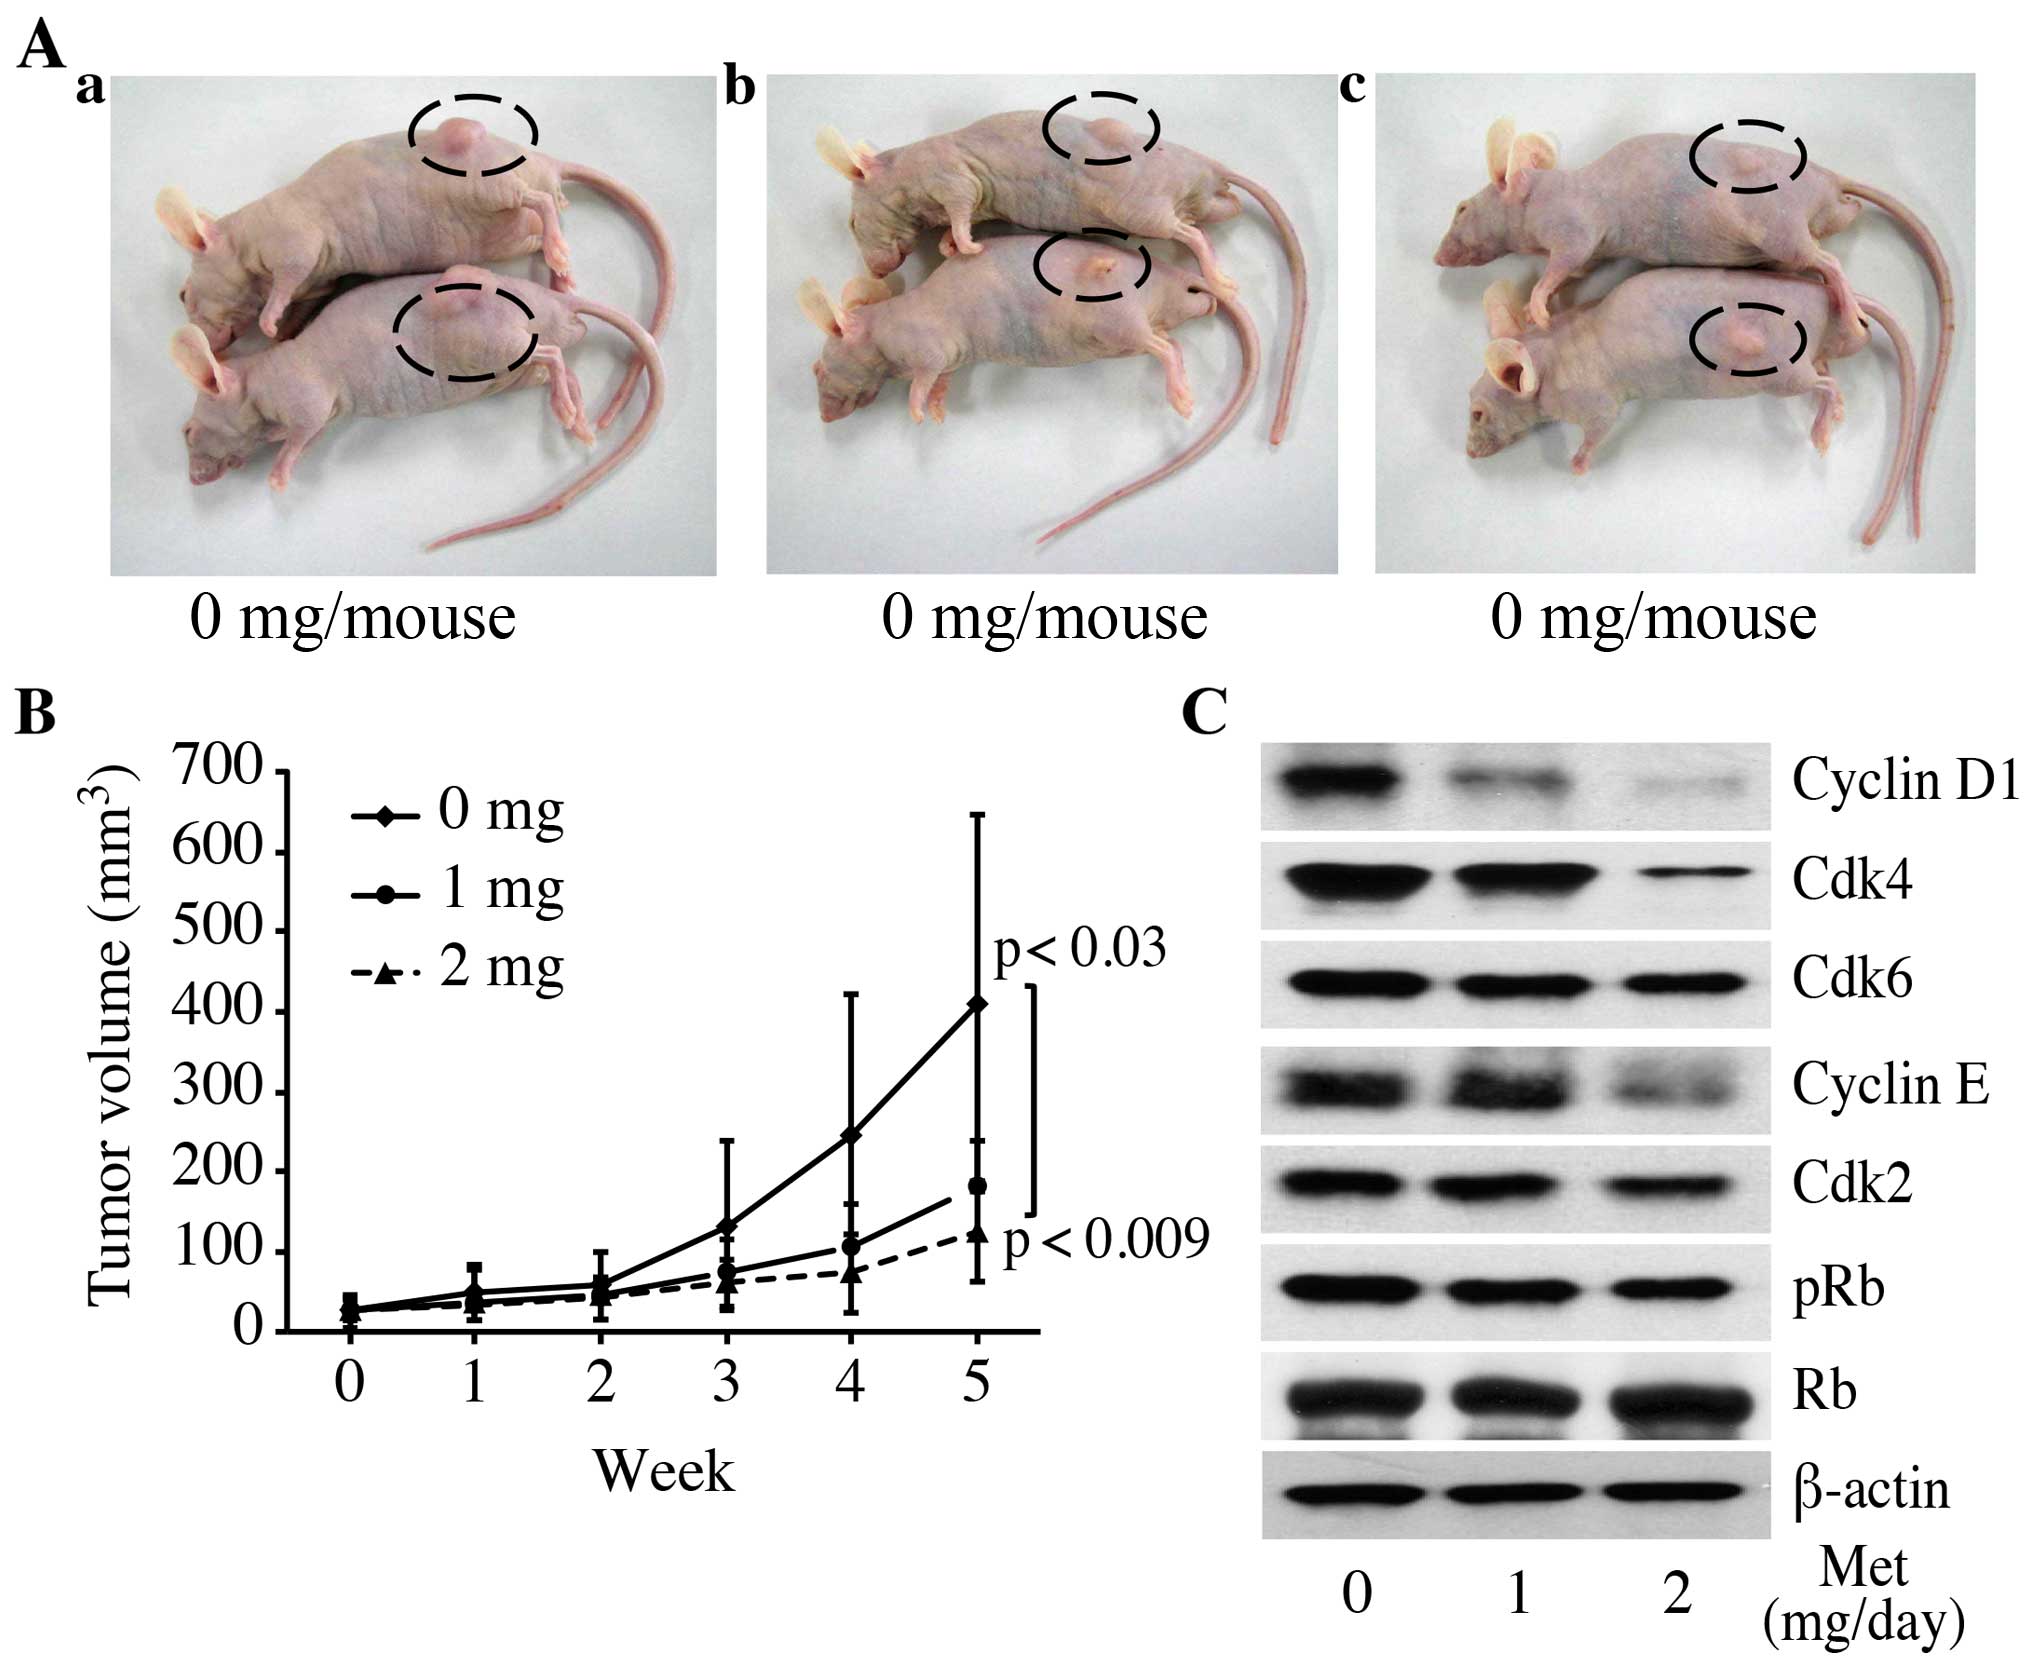
Metformin inhibits tumor proliferation
in vivo
In order to determine whether or not metformin
affects tumor growth in vivo, we injected nude mice
subcutaneously (s.c.) with Panc1 cells. Metformin was injected
daily intraperitoneally (i.p.) at 1 or 2 mg/day. On the basis of
the integrated values of the tumor growth curves, i.p.
administration of metformin led to substantial inhibition of tumor
growth, by 43.9% (1 mg/day) and 30.5% (2 mg/day) (Fig. 2A and B; P=0.0089, one-way ANOVA).
These growth rates were significantly above those of the control
(P<0.03 for 1 mg/day and P<0.01 for 2 mg/day). In addition,
treatment with 2 mg of metformin significantly inhibited tumor
growth compared with the mice treated with 1 mg of metformin
(P<0.07). In the present study, metformin exhibited no apparent
changes in mice and did not affect their weight (data not shown).
All animals were alive during the experiment.
In order to determine whether or not metformin also
affects cell cycle-regulatory protein levels in vivo, we
analyzed protein expression using western blot analysis in tumors
obtained from the xenograft experiments. Metformin significantly
reduced the levels of these proteins (phosphorylated Rb, cyclin D1,
Cdk2, Cdk4, Cdk6 and cyclin E) in the treated tumors compared to
the levels in controls (Fig. 2C).
In contrast, total Rb was the same irrespective of metformin
treatment. These results suggest that, similar to the results of
the in vitro observations (Fig.
1B), metformin decreased tumor growth by reducing cell
cycle-regulatory protein levels, resulting in G1 cell cycle
arrest.
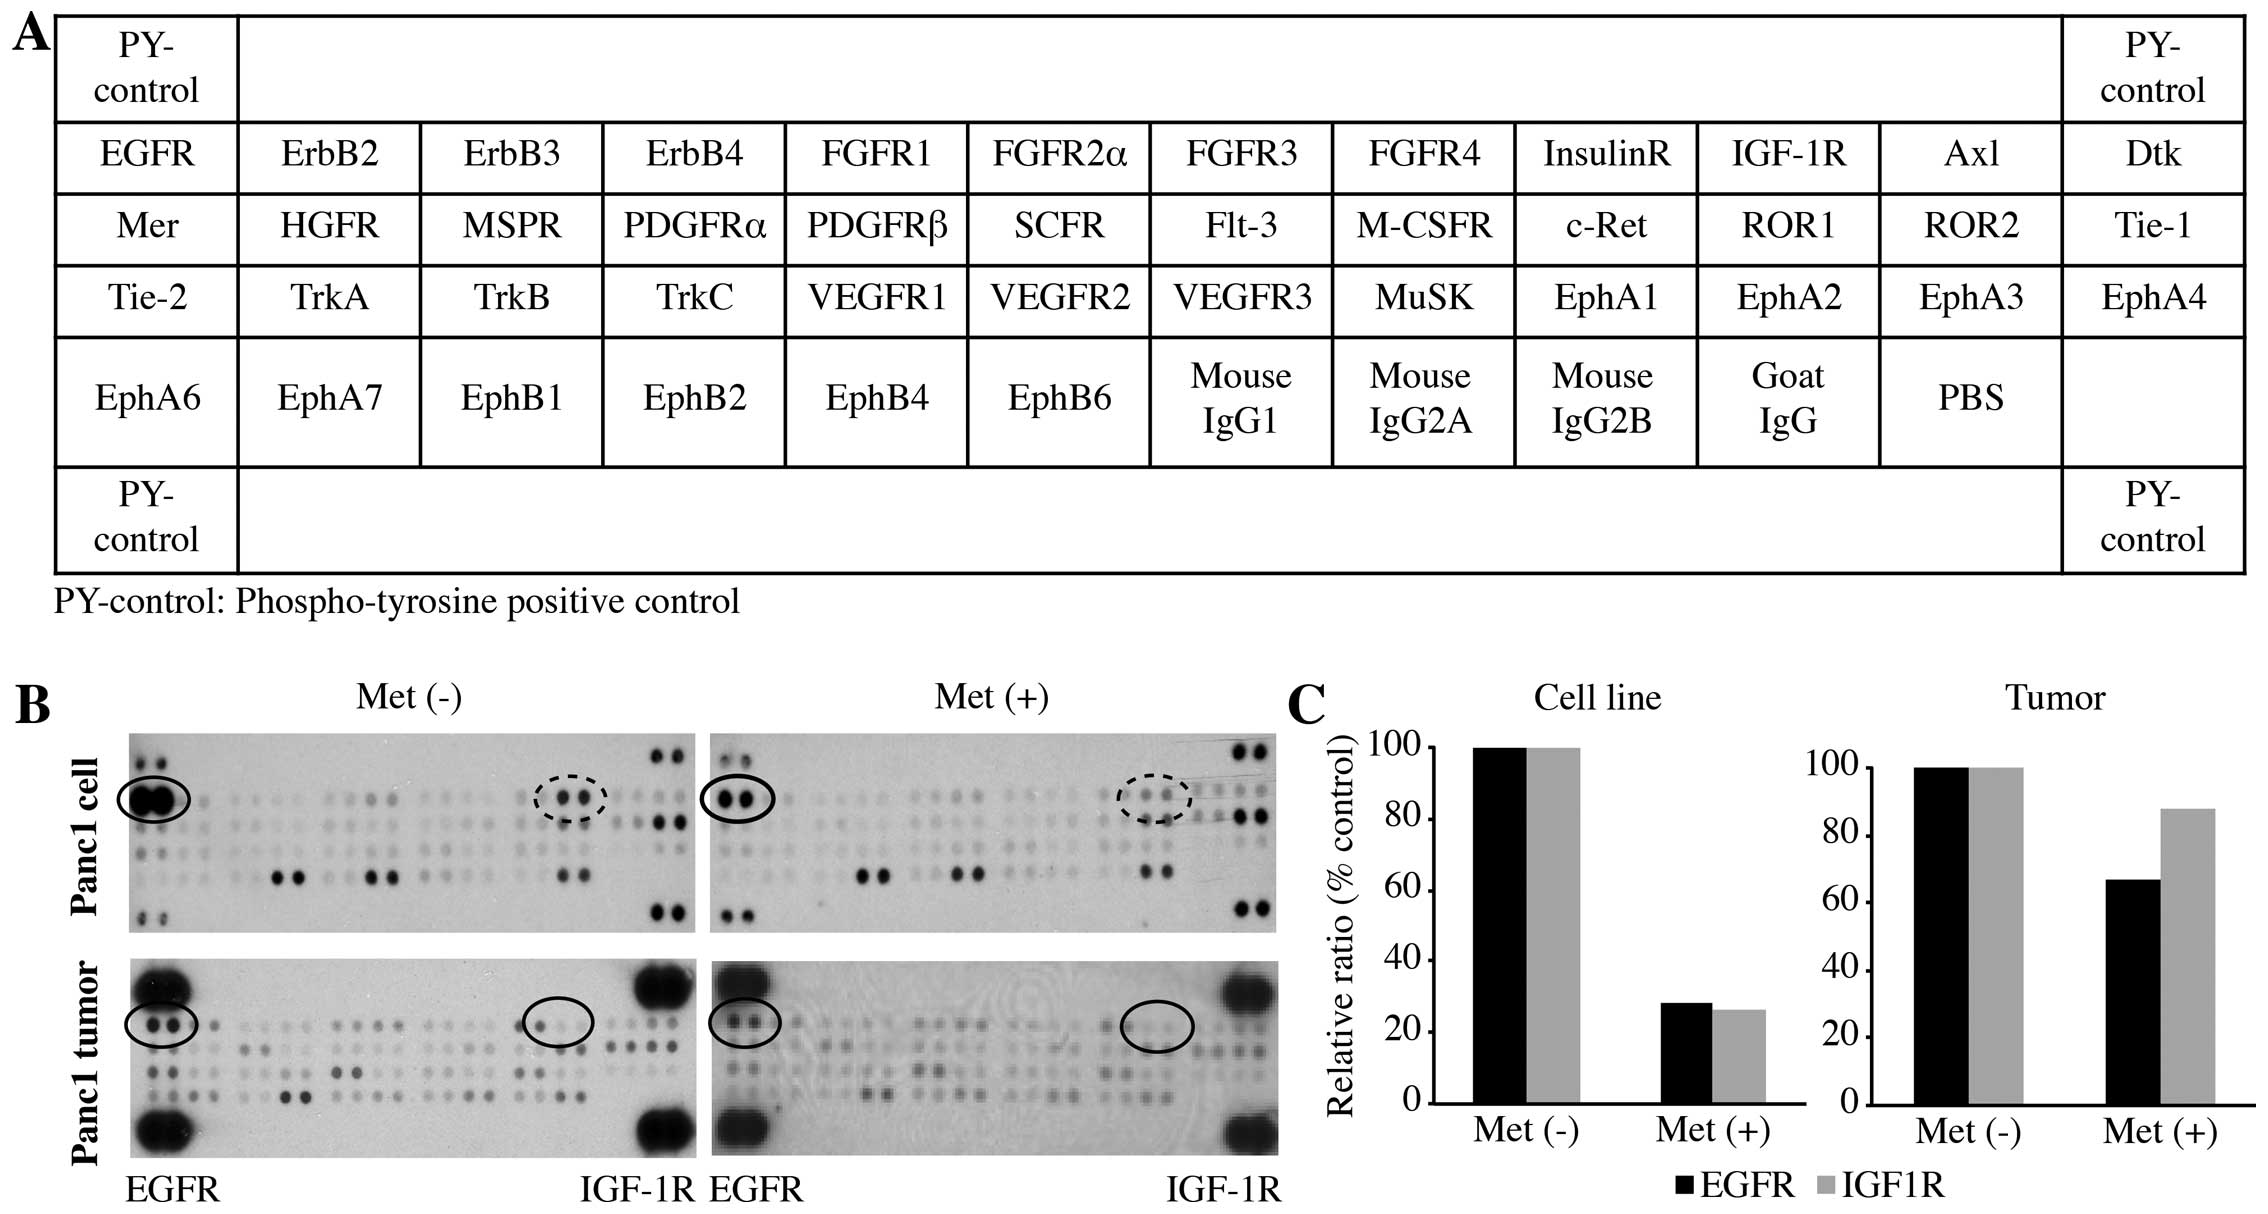
The activity level of tyrosine-activated
receptor tyrosine kinases (RTKs) is associated with pancreatic
carcinoma
We used a phospho-RTK array system to identify the
key RTKs associated with pancreatic carcinoma. The antibody array
allowed us to simultaneously screen the expression level of 42
different activated RTKs in Panc1 cells and tumors, with or without
metformin treatment. Compared with the RTK levels in the cell lines
and tumors not treated with metformin, p-EGFR was downregulated in
the Panc1 cell line and tumors treated with metformin. p-IGF-1R was
significantly down-regulated in the Panc1 cell line treated with
metformin, but was only slightly downregulated in the tumors.
The densitometric densities of p-EGFR and p-IGF-1R
in the cell lines and tumor tissue were visualized in black and
white, respectively. The density of the p-EGFR and that of p-IGF-1R
obtained from the membrane array were analyzed by means of an Image
Station (Eastman Kodak, Rochester, NY, USA). The densitometric
ratios of the p-EGFR and p-IGF-1R spots for the metformin-treated
cells to cells not treated with metformin were 28.1 and 26.3%,
respectively (Fig. 3C). In
addition, the ratios of p-EGFR and p-IGFR for metformin-treated
tumor tissues to non-treated metformin tumor tissues were 66.7 and
87.8%, respectively (Fig. 3C).
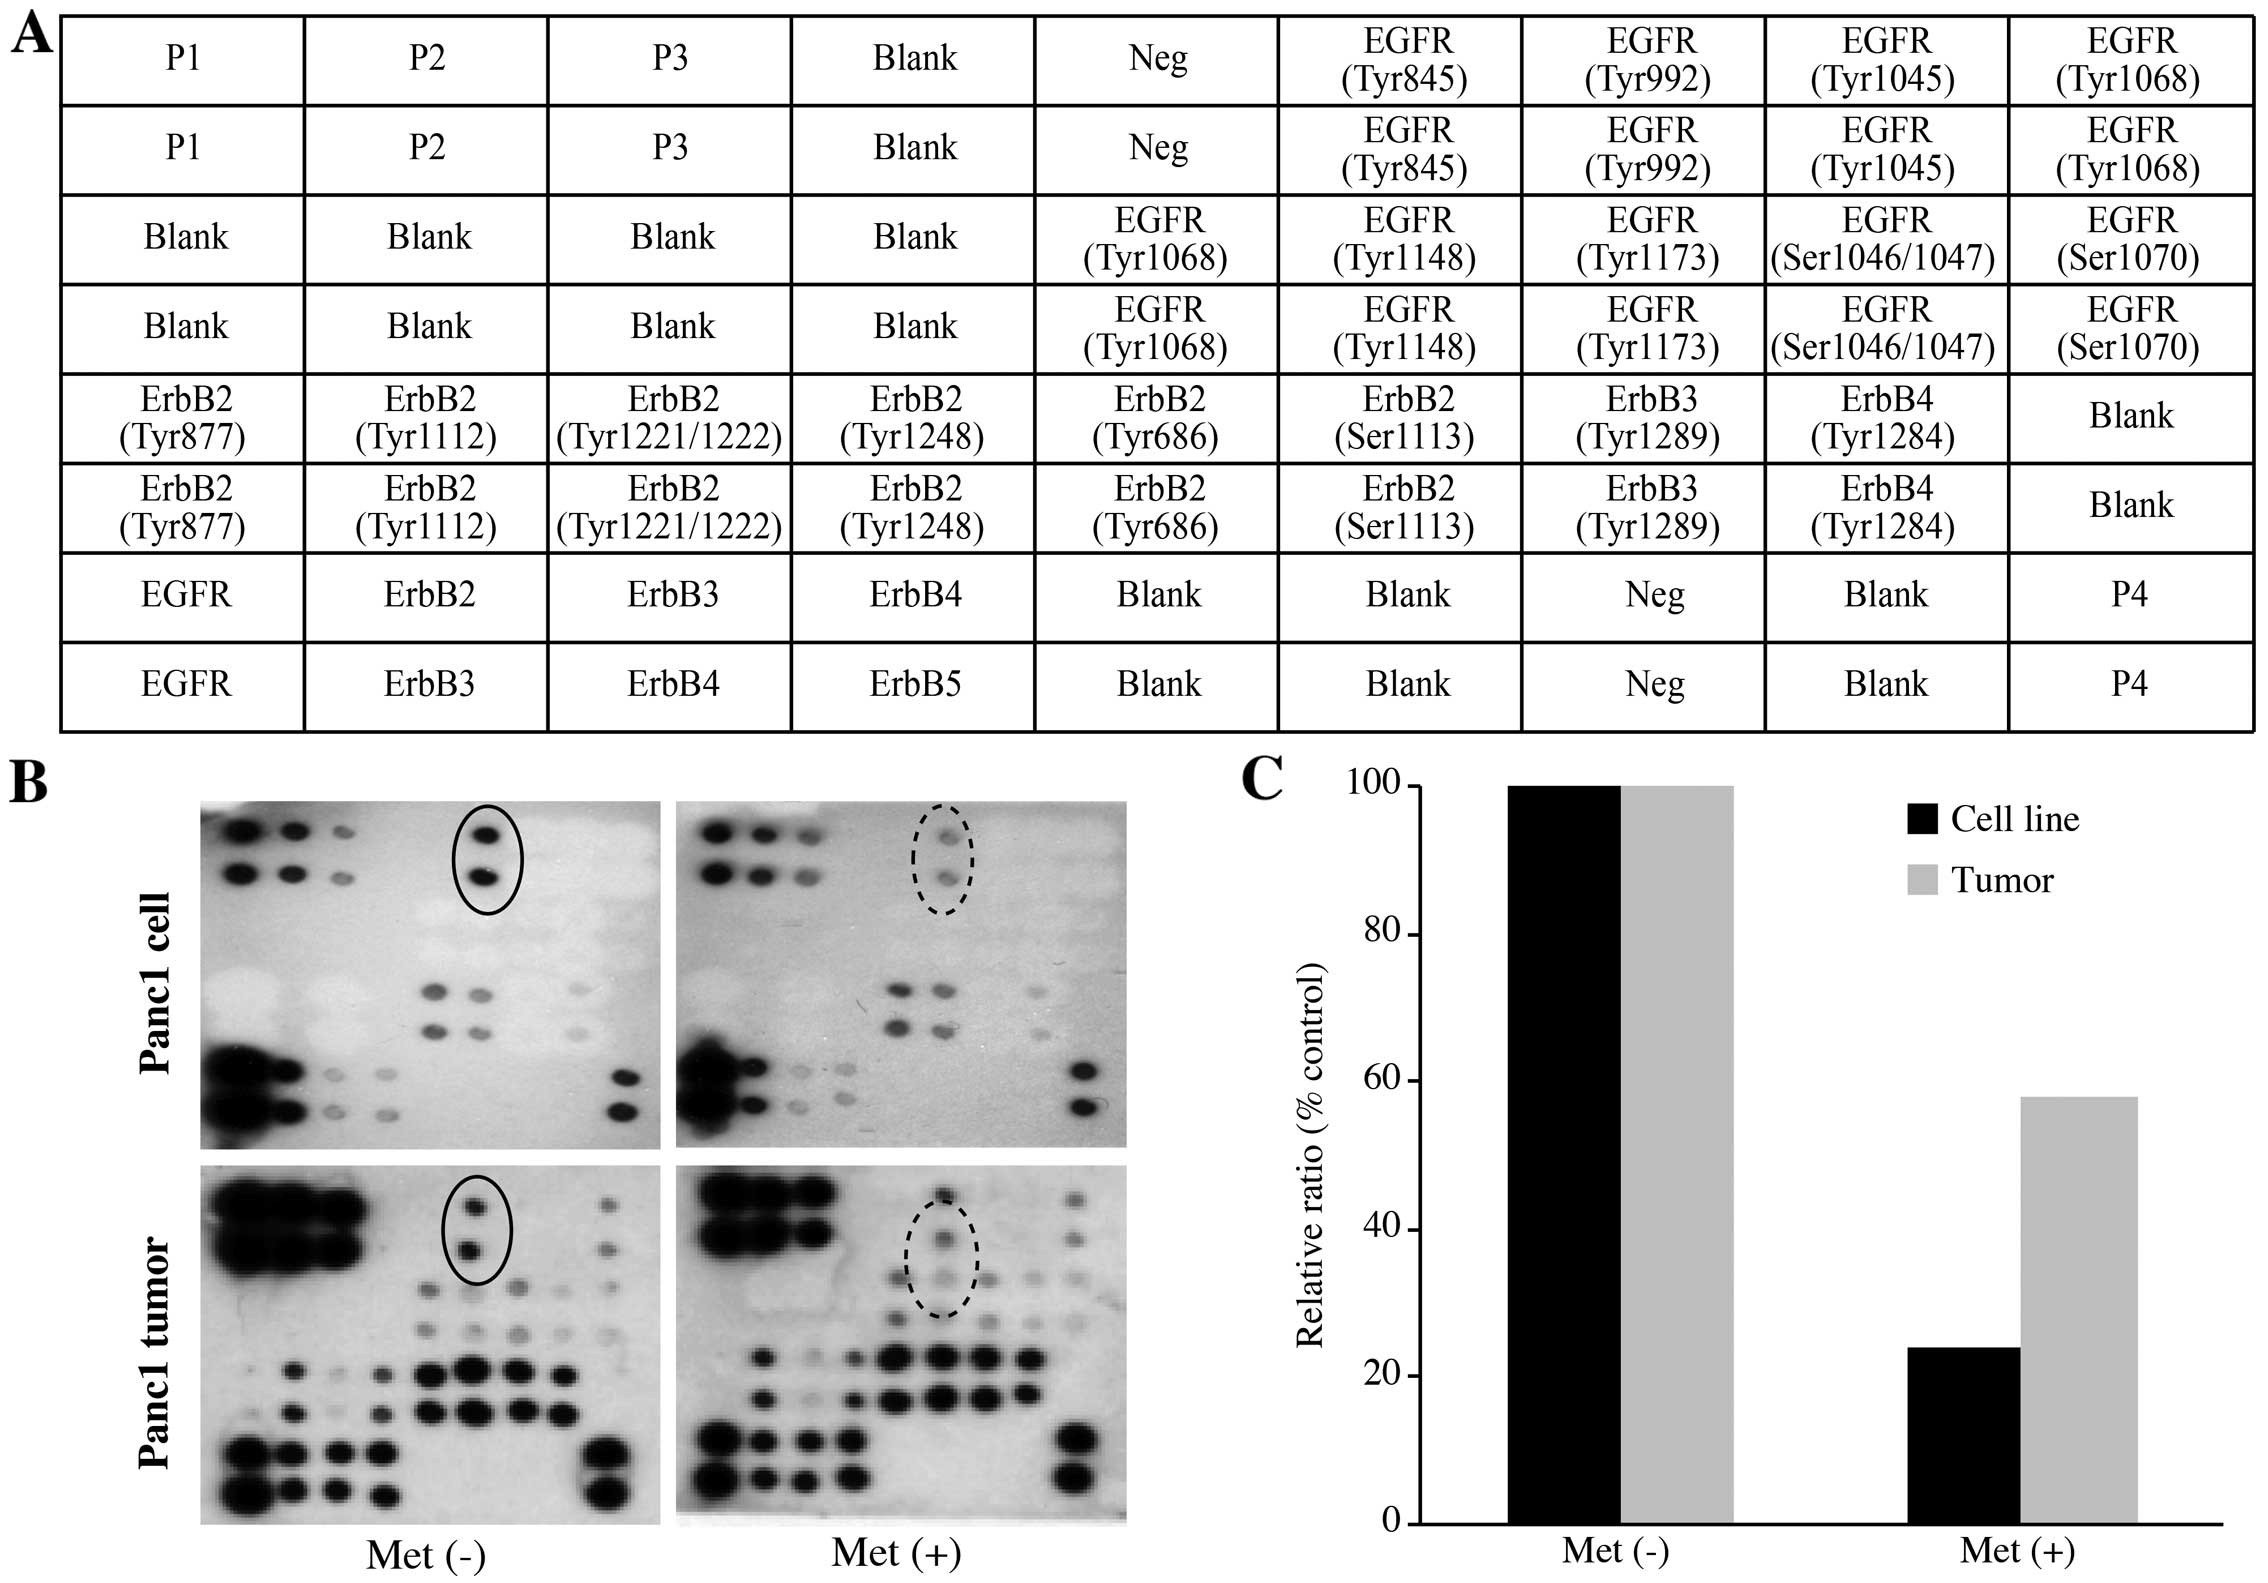
Metformin inhibits the phosphorylation
site of EGFR at tyrosine 845
Next, we used the RayBio Human EGFR Phosphorylation
Antibody Arrays to assess which of the phosphorylation sites of
EGFR are regulated by the anti-tumor effect of metformin (Fig. 4A). Using this array, we
simultaneously detected the relative level of phosphorylation of 17
different specific sites for the human EGFR family in Panc1 cells
and tumors with or without metformin treatment. Metformin
significantly reduced the phosphorylation of the classical EGFR
target residues, EGFR-Y845, as determined by the protein array
in vitro and in vivo.
The densitometric densities of EGFR-Y845 in the cell
lines and tumor tissues were visualized in black and white,
respectively. The density of the EGFR-Y845 obtained from the
membrane array was analyzed by means of an Image Station. The
densitometric ratio of the EGFR-Y845 spots of the metformin-treated
cells to the non-treated metformin cells was 24.1% (Fig. 4C). In addition, the ratio of
EGFR-Y845 in the metformin-treated tumorous tissues to that of the
non-treated metformin tumor tissues was 58.0% (Fig. 4C).
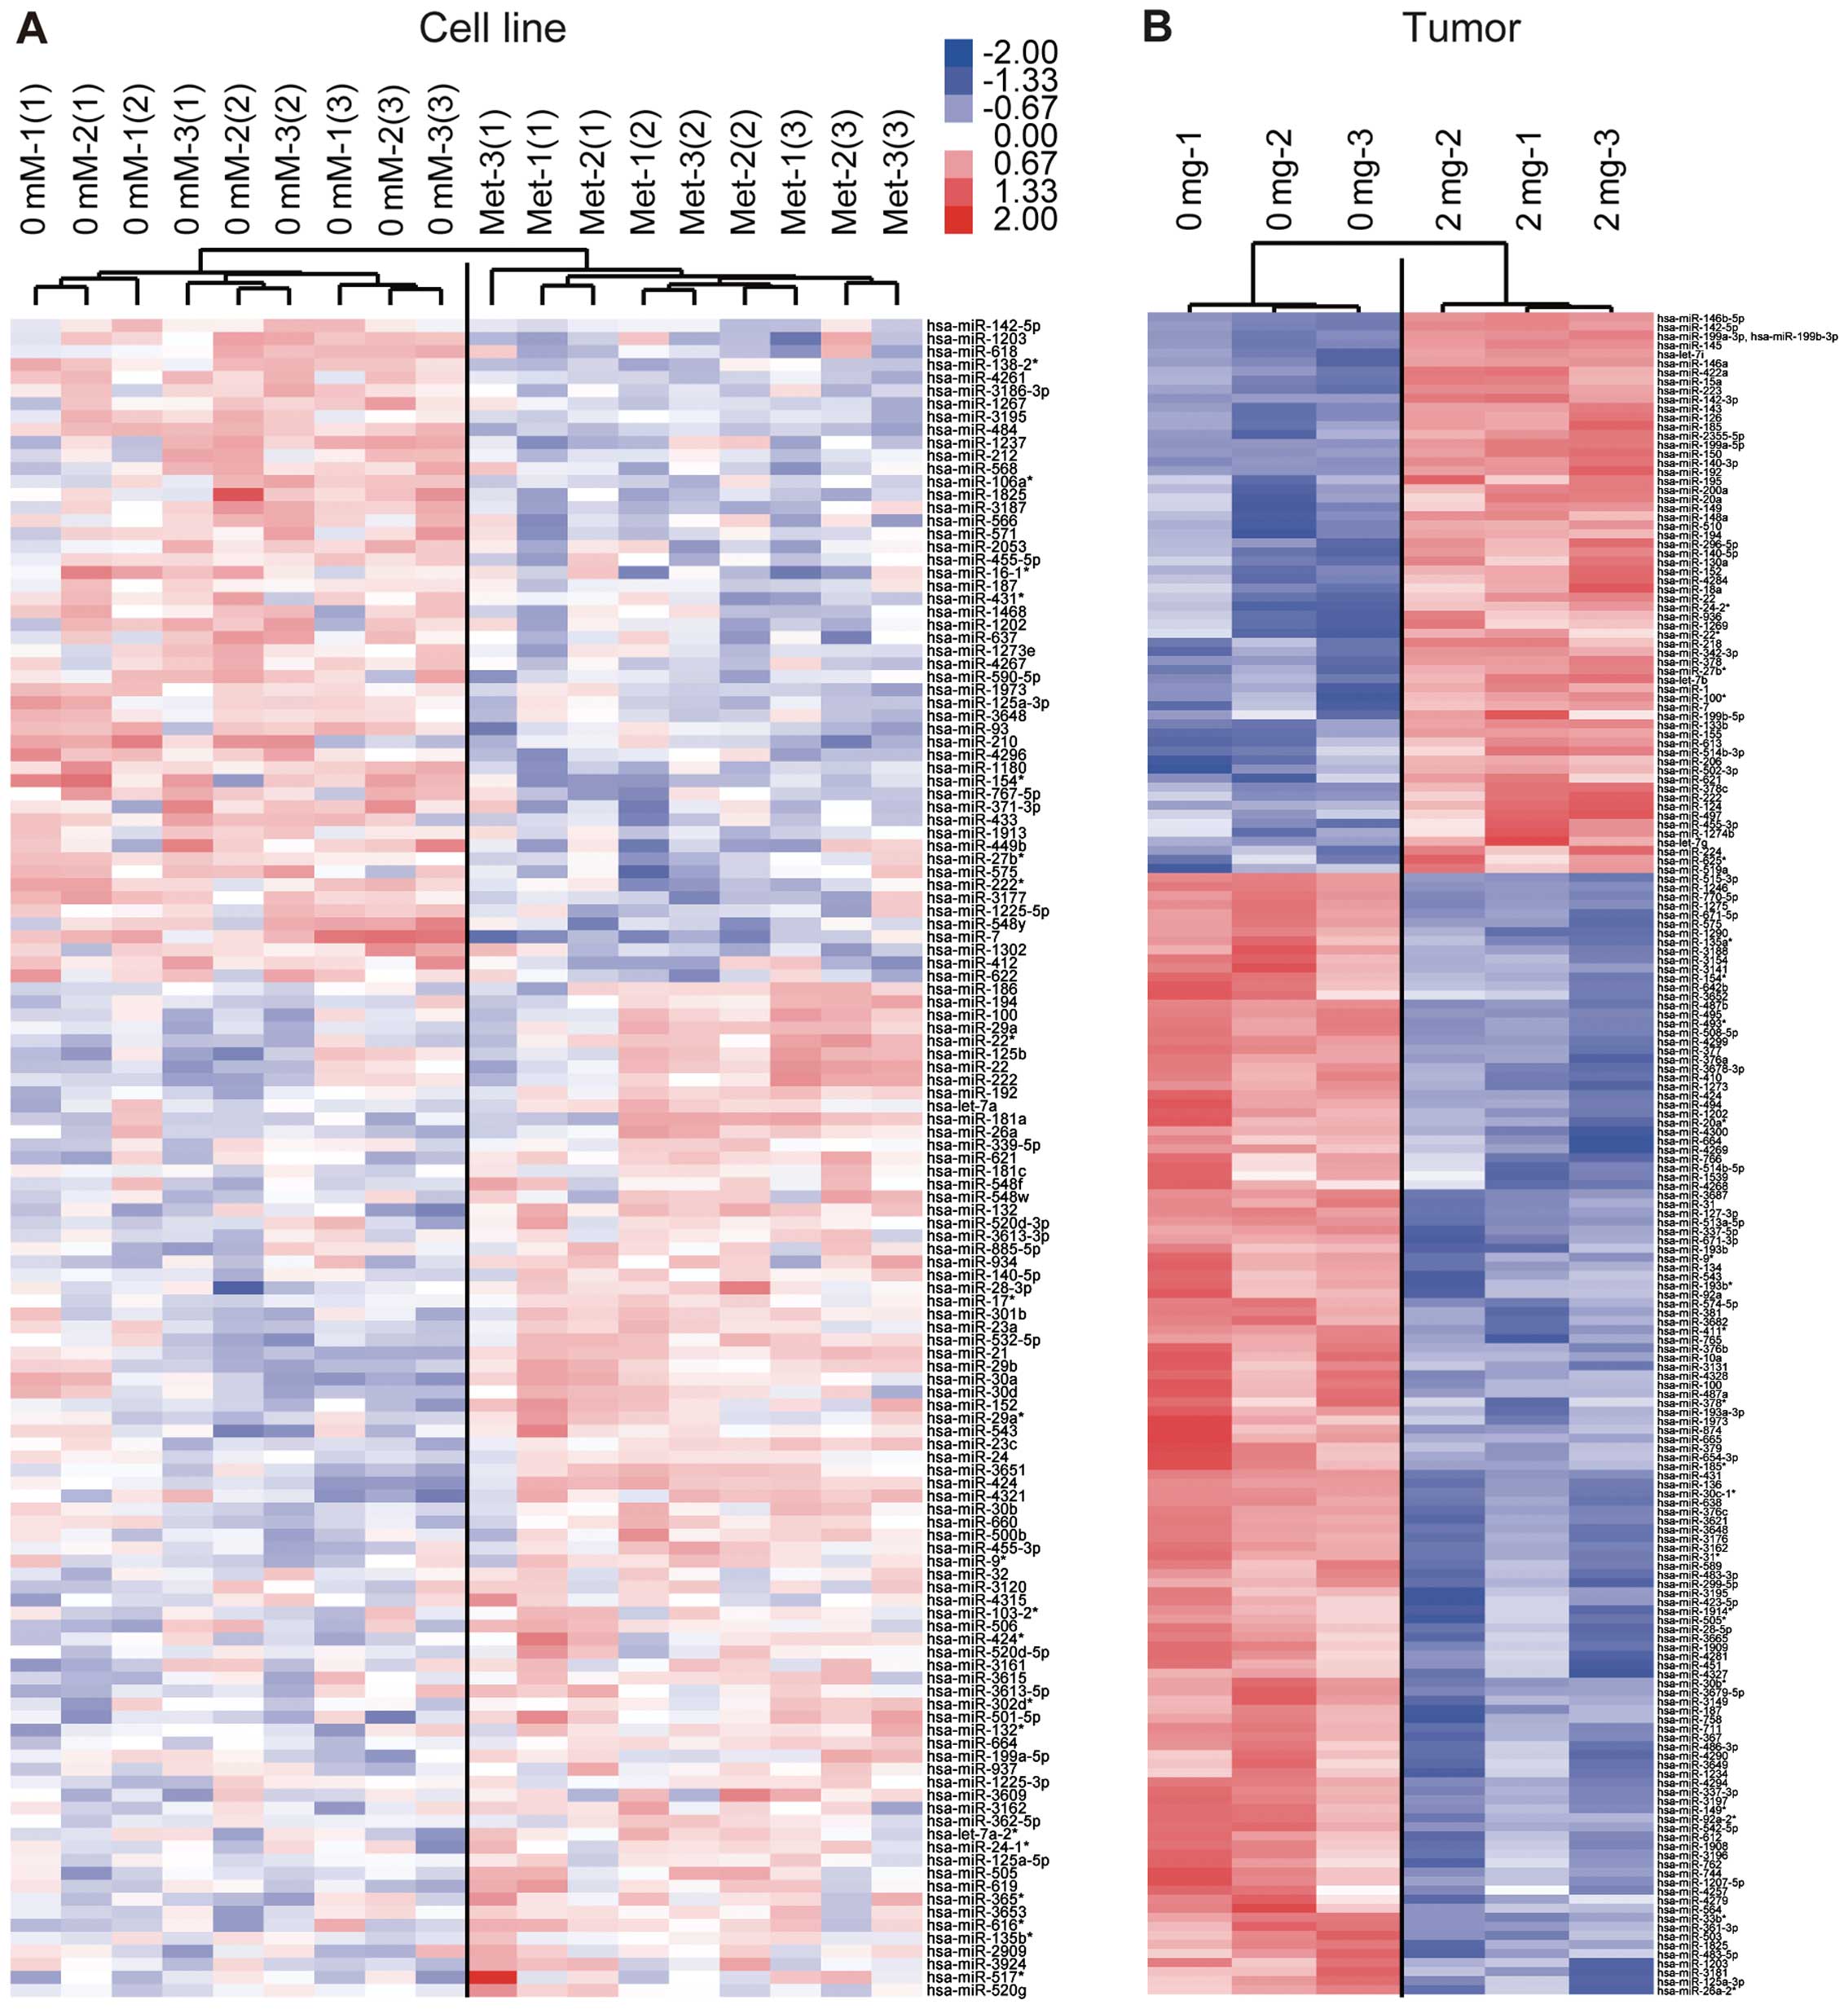
An miRNA expression signature
discriminates metformin-treated from untreated cells
Using a custom microarray platform, we analyzed the
expression levels of 1,212 human miRNA probes in the Panc1 cells
in vitro and tumor tissues in vivo that were treated
with metformin or left untreated. When the expression of miRNAs was
studied in the Panc1 cells treated with 10 mM metformin or left
untreated in vitro, 78 miRNAs were significantly upregulated
in the Panc1 cells after 72 h of metformin treatment, while 51
miRNAs were downregulated. In the tumor xenograft model, in the
metformin group, there were 62 upregulated and 124 down-regulated
miRNAs among the total 1,212 miRNAs [Gene Expression Omnibus (GEO)
accession no. GSE37406]. As shown in Tables I and II, we identified 20 downregulated and
upregulated miRNAs, when comparing the metformin-treated cells and
tissues and untreated cells and tissues in vitro and in
vivo. The 19 miRNAs were matched with miRNAs from both cultured
cells and xenograft tissues after metformin treatment.
 | Table IStatistical results, chromosomal
locations and putative targets of miRNAs in the Panc1 cells treated
with metformin, compared with the non-treated cells. |
Table I
Statistical results, chromosomal
locations and putative targets of miRNAs in the Panc1 cells treated
with metformin, compared with the non-treated cells.
| No. | miRNA | Fold-change
(treated/non-treated) mean ± SD | P-value | Chromosomal
localization | No. | miRNA | Fold-change
(treated/non-treated) mean ± SD | P-value | Chromosomal
localization |
|---|
| Downregulated | | | | Upregulated | | | |
| 1 | hsa-miR-7 | 0.494±0.082 | 8.91681E-05 | 9q21.32 | 1 | hsa-miR-28-3p | 1.695±1.318 | 0.0125 | 3q28 |
| 2 | hsa-miR-484 | 0.662±0.114 | 5.63397E-06 | 16p13.11 | 2 | hsa-miR-501-5p | 1.659±0.437 | 0.0009 | Xq11.23 |
| 3 |
hsa-miR-154* | 0.671±0.314 | 0.0047 | 14q32.31 | 3 | hsa-miR-132 | 1.657±0.472 | 0.0004 | 17q13.3 |
| 4 | hsa-miR-1825 | 0.693±0.193 | 0.0040 | 20 | 4 | hsa-miR-424 | 1.644±0.366 | 0.0003 | Xq26.3 |
| 5 | hsa-miR-1180 | 0.711±0.173 | 0.0004 | 17 | 5 |
hsa-miR-517* | 1.640±1.023 | 0.0382 | 19q13.42 |
| 6 | hsa-miR-210 | 0.720±0.182 | 0.0352 | 11p15.5 | 6 | hsa-miR-4321 | 1.639±0.670 | 0.0050 | 19 |
| 7 |
hsa-miR-138-2* | 0.721±0.130 | 0.0004 | 16q13 | 7 | hsa-miR-21 | 1.631±0.324 | 0.0002 | 17q23.1 |
| 8 | hsa-miR-3177 | 0.726±0.233 | 0.0016 | 16 | 8 |
hsa-miR-22* | 1.570±0.375 | 0.0019 | 17p13.3 |
| 9 | hsa-miR-3187 | 0.728±0.132 | 0.0004 | 19 | 9 | hsa-miR-152 | 1.566±0.414 | 0.0005 | 17q21.32 |
| 10 | hsa-miR-93 | 0.728±0.112 | 0.0165 | 7q22.1 | 10 | hsa-miR-532-5p | 1.551±0.377 | 0.0017 | Xq11.23 |
| 11 | hsa-miR-548y | 0.730±0.185 | 0.0107 | 14 | 11 | hsa-miR-29b | 1.502±0.211 | 0.0015 | 7q32.3 |
| 12 | hsa-miR-4296 | 0.733±0.194 | 0.0042 | 10 | 12 | hsa-miR-22 | 1.487±0.279 | 0.0157 | 17p13.3 |
| 13 |
hsa-miR-222* | 0.736±0.162 | 0.0054 | Xq11.3 | 13 | hsa-miR-621 | 1.481±0.363 | 0.0011 | 13q14.11 |
| 14 | hsa-miR-1203 | 0.742±0.266 | 0.0162 | 17 | 14 | hsa-miR-181a | 1.473±0.470 | 0.0229 | 9q33.3 |
| 15 | hsa-miR-449b | 0.753±0.236 | 0.0277 | 5q11.2 | 15 | hsa-miR-3651 | 1.473±0.229 | 0.0004 | 9 |
| 16 | hsa-miR-433 | 0.753±0.200 | 0.0042 | 14q32.2 | 16 | hsa-miR-29a | 1.471±0.314 | 0.0023 | 7q32.3 |
| 17 | hsa-miR-4261 | 0.758±0.169 | 0.0002 | 2 | 17 | hsa-miR-125b | 1.465±0.345 | 0.0257 | 11q24.1 |
| 18 | hsa-miR-412 | 0.762±0.283 | 0.0112 | 12 | 18 | hsa-miR-30a | 1.452±0.345 | 0.0280 | 6q13 |
| 19 | hsa-miR-767-5p | 0.763±0.259 | 0.0040 | Xq28 | 19 | hsa-miR-934 | 1.449±0.413 | 0.0050 | Xq26.3 |
| 20 |
hsa-miR-16-1* | 0.765±0.256 | 0.0266 | 13q14.2 | 20 |
hsa-miR-616* | 1.443±0.334 | 0.0044 | 12q13.3 |
| Table IIStatistical results, chromosomal
locations and putative targets of miRNAs in Panc1 tumors treated
with metformin, compared with non-treated cells. |
Table II
Statistical results, chromosomal
locations and putative targets of miRNAs in Panc1 tumors treated
with metformin, compared with non-treated cells.
| No. | miRNA | Fold-change
(treated/non-treated) mean ± SD | P-value | Chromosomal
localization | No. | miRNA | Fold-change
(treated/non-treated) mean ± SD | P-value | Chromosomal
localization |
|---|
| Upregulated | | | | Downregulated | | | |
| 1 | hsa-miR-150 | 3.561±0.487 | 0.0050 | 19q13.33 | 1 |
hsa-miR-30c-1* | 0.395±0.028 | 0.0009 | 1p34.2 |
| 2 | hsa-miR-142-5p | 3.548±0.289 | 0.0002 | 17q22 | 2 | hsa-miR-508-5p | 0.412±0.050 | 0.0010 | Xq27.3 |
| 3 | hsa-miR-155 | 3.213±0.716 | 0.0091 | 21q21.3 | 3 | hsa-miR-1290 | 0.425±0.042 | 0.0050 | 1 |
| 4 | hsa-miR-146a | 3.178±0.737 | 0.0088 | 5q34 | 4 | hsa-miR-4294 | 0.426±0.035 | 0.0011 | 10 |
| 5 | hsa-miR-142-3p | 2.597±0.395 | 0.0051 | 17q22 | 5 | hsa-miR-1275 | 0.449±0.057 | 0.0013 | 6 |
| 6 | hsa-miR-342-3p | 2.273±0.381 | 0.0072 | 14q32.2 | 6 | hsa-miR-1246 | 0.451±0.025 | 0.0012 | 2q31.1 |
| 7 | hsa-miR-206 | 2.167±0.680 | 0.0435 | 6p12.2 | 7 | hsa-miR-376c | 0.482±0.024 | 0.0009 | 14q32.31 |
| 8 | hsa-miR-223 | 2.078±0.168 | 0.0026 | Xq12 | 8 | hsa-miR-431 | 0.487±0.022 | 8.97825E-05 | 14q32.2 |
| 9 |
hsa-miR-146b-5p | 1.910±0.034 | 5.06432E-05 | 10q24.32 | 9 | hsa-miR-377 | 0.495±0.026 | 0.0015 | 14q32.31 |
| 10 | hsa-miR-145 | 1.907±0.049 | 0.0003 | 5q32 | 10 | hsa-miR-376a | 0.500±0.067 | 0.0061 | 14q32.31 |
| 11 |
hsa-miR-199a-3p | 1.844±0.094 | 0.0001 | 19q13.2 | 11 | hsa-miR-495 | 0.505±0.040 | 0.0001 | 14q32.31 |
| 12 | hsa-miR-133b | 1.797±0.090 | 0.0009 | 6p12.2 | 12 | hsa-miR-542-5p | 0.512±0.091 | 0.0093 | Xq26.3 |
| 13 | hsa-miR-1 | 1.783±0.268 | 0.0121 | 18q11.2 | 13 |
hsa-miR-154* | 0.518±0.036 | 0.0085 | 14q32.31 |
| 14 |
hsa-miR-514b-3p | 1.782±0.401 | 0.0167 | Xq27.3 | 14 |
hsa-miR-493* | 0.525±0.050 | 0.0009 | 14q32.2 |
| 15 | hsa-miR-1269 | 1.771±0.535 | 0.0288 | 4 | 15 | hsa-miR-376b | 0.527±0.100 | 0.0064 | 14q32.31 |
| 16 | hsa-miR-124 | 1.760±0.288 | 0.0265 | 8p23.1 | 16 | hsa-miR-4300 | 0.531±0.111 | 0.0258 | 11 |
| 17 |
hsa-miR-199a-5p | 1.752±0.100 | 0.0029 | 19p13.2 | 17 | hsa-miR-711 | 0.540±0.092 | 0.0030 | 3 |
| 18 | hsa-miR-224 | 1.648±0.372 | 0.0118 | Xq28 | 18 | hsa-miR-3197 | 0.550±0.037 | 0.0045 | 21 |
| 19 | hsa-miR-143 | 1.645±0.137 | 0.0007 | 5q32 | 19 |
hsa-miR-513a-5p | 0.562±0.045 | 0.0017 | Xq27.3 |
| 20 | hsa-miR-218 | 1.642±0.186 | 0.0064 | 4p15.31 | 20 | hsa-miR-424 | 0.567±0.072 | 0.0046 | Xq26.3 |
Unsupervised hierarchical clustering analysis using
Pearson's correlation showed that the metformin-treated cell lines
in vitro and tumor tissues in vivo clustered together
and separately from the untreated cell lines (Fig. 5A) and tissues (Fig. 5B). These subsets of 129 miRNAs in
the cells and 186 miRNAs in the tissues were found to exhibit
significant alterations in expression levels between the
metformin-treated and control groups.
Discussion
Pancreatic cancer is one of the most
life-threatening cancers; in 2009, for example, this cancer
accounted for 35,240 deaths in the US, or 6% of all cancer deaths
in that country (16). In spite of
the recent progress in surgical procedures, the operative
resectability rate of pancreatic cancer remains unsatisfactory at
9–20% (17,18). Apart from potentially curative
surgery, chemotherapy may be applied at advance stages in
pancreatic cancer, but is not curative in such cases, and generally
has a poor prognosis. Accordingly, there is a strong demand for new
curative approaches to pancreatic cancer therapy (19).
Metformin is the drug most commonly used to treat
type 2 diabetes, particularly among overweight or obese patients.
Metformin lowers circulating glucose levels by reducing hepatic
glucose production and increasing the muscle intake of glucose,
thereby decreasing circulating levels of insulin (20). Recent data suggest that metformin
could protect against cancer and inhibit the proliferation in
various cancer cell lines, such as breast, glial and prostate
cancer. In addition, we recently reported that metformin inhibits
gastric cancer proliferation in vitro and in vivo
(9). In addition, another recent
study indicated that the use of metformin for diabetes was
associated with a decreased risk of pancreatic cancer in women
(21). Therefore, various clinical
trials on the use of metformin for pancreatic cancer have been
conducted worldwide. However, the detailed mechanisms underlying
the antitumor effect of metformin on pancreatic cancer remain
unknown. In the present study we showed that metformin not only is
a very potent inhibitor of human pancreatic cancer cell growth, but
also inhibits tumorigenesis in a xenograft model when it is
administrated i.p.
The present study was the first to examine the
effects of metformin on the proliferation of pancreatic cancer
cells. In vitro, a cell proliferation assay indicated that
metformin achieved a remarkable decrease in cell viability.
Furthermore, in nude mice in vivo the tumor growth of
pancreatic cancer was significantly decreased by metformin
treatment as compared with that in a control group. These data
suggest that metformin may indeed play an inhibitory role in the
proliferation of pancreatic cells and tumor growth in vitro
and in vivo.
To determine the molecular basis for the inhibitory
effects of metformin on the proliferation of pancreatic cancer
cells, we analyzed the effect of metformin on the expression of the
cell proliferation-regulating proteins cyclin D1, Cdk4, Cdk6, Cdk2,
cyclin E and phosphorylated pRb. Specific cyclin/cyclin-dependent
kinase (Cdk) complexes are activated at different intervals during
the cell cycle. Complexes of Cdk4 and Cdk6 with cyclin D1 are
required for G1 phase progression, whereas complexes of Cdk2 with
cyclin E are required for G1/S transition. In previous studies,
downregulation of cyclin D1 in response to metformin has been
demonstrated in various cancer cell lines, such as colon, breast,
prostate and gastric cancer (9). In
the present study, the major cell cycle regulators (cyclin D1,
Cdk4, Cdk6, cyclin E, Cdk2, phosphorylated pRb) could be
intracellular targets of the metformin-mediated antproliferative
effect in human pancreatic cancers in vitro and in
vivo. These data suggest that the antitumor effect of metformin
may be related to the reduction of various cell cycle-related
proteins, particularly cyclin D1. Previous studies have shown the
enhanced expression of various cell cycle-related molecules (cyclin
D1, Cdk4, Cdk6, cyclin E and Cdk2) in various types of cancers,
including pancreatic cancer. Therefore, inhibition of these cell
cycle-related molecules, including cyclin D1, may be an important
molecular target for controlling tumor proliferation.
Our in vitro study was performed using a
higher dose of metformin than the human therapeutic concentration
(6–30 µM). The use of such a high doses has been the subject
of criticism of similar studies in other cancer cell types, such as
breast, prostate and colon cancer cell lines. However, it is
important to consider that cells in culture are grown under
hyperglycemic conditions. Tissue culture medium alone contains high
concentrations of glucose, and 5–10% fetal bovine serum is
typically added, resulting in excessive growth stimulation. This
may explain why, in order to observe the antitumor effects of
metformin in cell culture systems, it is necessary to use higher
doses than are used in diabetic patients.
Metformin leads to changes in the phosphorylation of
various proteins. In breast cancer cells, Liu et al reported
that metformin reduced p-EGFR, p-MAPK and p-Src (22). We also detected a reduction in
p-EGFR and p-IGF-1R in pancreatic cancers with metformin treatment
using protein arrays, particularly in vitro. In the tumor
tissue, the decrease in expression in p-EGFR and p-IGF-1R with
metformin treatment was mild. The difference in the amount of this
reduction reflects the differences between the in vitro and
in vivo models. These data suggest that the expression
levels of p-EGFR and p-IGF-1R in pancreatic cancer cells are
reduced by metformin treatment. The EGFR pathway is important in
controlling cell cycle events. The role of EGFR in the cell cycle
progression of several human cancers has been studied. Cyclin D1
over-expression in the tumor cells of pancreatic carcinoma tissue
is at least partly dependent on the mitogenic effects of EGF
signaling through the EGFR (23).
Moreover, c-Src is involved in the phosphorylation of EGFR at
Tyr845, the expression of which was decreased by the addition of
metformin in our studies (24).
Similar to EGFR, IGF-1R has been shown to regulate both the
expression and activity of many proteins involved in cell cycle
progression (25). Decreased
expression of IGF-1R induced an antiproliferative effect on human
pancreatic cancer cells (26,27).
Therefore, metformin blocks the cell cycle in G0/G1 in vitro
and in vivo through the reduction of EGFR and IGF-1R
activity.
To identify miRNAs associated with the antitumor
effect of metformin, we used miRNA expression arrays to detect
variations in miRNA profiles in pancreatic cancer cell lines both
in culture and in xenograft tumor tissues treated with metformin
compared to those not treated with metformin. The cluster analyses
we performed clearly demonstrated that metformin treatment affects
the extent of miRNA expression in cultured cells and in tumor
tissues. In the analyses, we selected sets of miRNAs whose
expression levels were altered significantly after metformin
treatment. We identified 129 miRNAs differentially expressed (78
upregulated and 51 downregulated) in culture (Table I) and 186 miRNAs differentially
expressed (62 upregulated and 124 downregulated) in xenograft tumor
tissues (Table II). These miRNAs
are meaningful candidates to gauge the effectiveness of metformin
treatment and to provide clues to the molecular basis of the
anticancer effects of metformin, particularly when mediated with
miRNAs.
The expression of hsa-miR-150 was particularly
upregulated in metformin-treated tumor tissues, being 3.56 times
higher than that in the untreated tumor tissues. Although the
expression of hsa-miR-150 is upregulated in gastric and colorectal
cancer (28,29), it acts as a tumor-suppressor in
malignant melanoma (30). These
studies indicate the cell type-specific and context-dependent
functions of hsa-miR-150. In pancreatic cancer, hsa-miR-150
overexpression was found to inhibit growth, clonogenicity,
migration and invasion, and enhance intercellular adhesion by
downregulation of MUC4 (31).
Moreover, c-Myb, P2X7 and EGR2 are among the important targets of
hsa-miR-150 that have been experimentally validated, since all
three factors mediate the tumor-promoting functions of hsa-miR-150
(28,32,33).
Zhang et al demonstrated that the overexpression of
hsa-miR-150 in CD133+ hepatocellular carcinoma cells
induced cell cycle arrest and apoptosis by decreasing c-Myb, cyclin
D1 and Bcl-2 (34). Thus, our
results suggest that the metformin-induced inhibition of human
pancreatic cancer cell proliferation was mediated in part by the
tumor-suppression activities caused by upregulation of
hsa-miR-150.
In the present study, we found that the expression
of hsa-miR-7 extracted from cultured cells was decreased to
0.49-fold in metformin-treated cells. hsa-miR-7 acts as an
important modulator of EGFR-mediated oncogenesis, with potential
applications as a novel prognostic biomarker and therapeutic target
in multiple human cancer cell types (35–37).
In the present study, one reason for the inhibition of EGFR in
metformin-treated cells may be mediated by the downregulation of
hsa-miR-7.
We also found that members of the let-7 family were
upregulated in both cultured cells and tumor tissues treated with
metformin (2 genes in cultured cells and 3 genes in tumor tissue).
The human let-7 family, which contains 13 members, is widely
recognized as a class of miRNAs producing a tumor-suppressing
effect (38). The members of the
let-7 family act as tumor suppressors by binding to target
oncogenes, including Ras (39),
HMGA2 (40), c-Myc (41) and various cell cycle regulators. In
a recent study, we reported that members of the let-7 family are
upregulated in metformin-treated gastric cancer cells and tumor
tissues (9). Among the let-7 family
members upregulated in the metformin-treated tumor tissue in the
present study, let-7g, which was 1.3 times higher than that in the
untreated tissues, targets cell cycle control genes such as cyclin
D1, E2F1, Ras and c-myc and restrains the growth of hepatoma cells
(42). In addition, let-7b, the
level of which was 1.2 times higher than that in untreated tissue,
is overexpressed in melanoma cells in vitro, was found to
lead to downregulation of the expression of cyclins D1, D3 and A,
as well as to the downregulation of cyclin-dependent kinase (Cdk) 4
(43,44). Thus, our data suggest that let-7
family members may be candidates for new therapeutic targets in
pancreatic cancer.
In the present study, we found only 27 matched
miRNAs extracted from cultured cells and tumor tissues after
treatment with metformin. Although many miRNAs were significantly
altered after metformin treatment, we found several differences in
the profiles of miRNA expression between the cultured cells and
tumor tissues. This discrepancy could reflect the differences
between in vitro and in vivo models. In short,
metformin is directly exposed to in vitro cultured cells,
while intraperitoneally administered metformin is metabolized in
vivo. Additionally, tumor cells in mice are affected by the
host immune response. Furthermore, there were differences in
exposure times and metformin concentrations between the in
vitro and in vivo models. Therefore, differences in
exposure times and concentrations of metformin may have resulted in
the differential expression profiles of miRNAs.
In conclusion, our results revealed that metformin
inhibits human pancreatic cancer cell proliferation and tumor
growth, possibly by suppressing cell cycle-related molecules via
alteration of miRNAs. Metformin is a drug widely used for the
treatment of type 2 diabetes with limited side-effects. Therefore,
metformin may become a novel and effective therapy for the
treatment and long-term management of pancreatic cancer, providing
additional benefits at low cost.
Acknowledgments
We thank Madoka Seguchi, Yuuko Miyawaki and Fuyuko
Kokado (Kagawa University) for their excellent technical
assistance.
Abbreviations:
|
miRNAs
|
microRNAs
|
|
Cdk4
|
cyclin-dependent kinase 4
|
|
Cdk6
|
cyclin-dependent kinase 6
|
|
Rb
|
retinoblastoma protein
|
References
|
1
|
Li D, Yeung SC, Hassan MM, Konopleva M and
Abbruzzese JL: Antidiabetic therapies affect risk of pancreatic
cancer. Gastroenterology. 137:482–488. 2009. View Article : Google Scholar : PubMed/NCBI
|
|
2
|
Noto H, Goto A, Tsujimoto T and Noda M:
Cancer risk in diabetic patients treated with metformin: A
systematic review and meta-analysis. PLoS One. 7:e334112012.
View Article : Google Scholar : PubMed/NCBI
|
|
3
|
Ben Sahra I, Laurent K, Loubat A,
Giorgetti-Peraldi S, Colosetti P, Auberger P, Tanti JF, Le
Marchand-Brustel Y and Bost F: The antidiabetic drug metformin
exerts an antitumoral effect in vitro and in vivo through a
decrease of cyclin D1 level. Oncogene. 27:3576–3586. 2008.
View Article : Google Scholar : PubMed/NCBI
|
|
4
|
Col NF, Ochs L, Springmann V, Aragaki AK
and Chlebowski RT: Metformin and breast cancer risk: A
meta-analysis and critical literature review. Breast Cancer Res
Treat. 135:639–646. 2012. View Article : Google Scholar : PubMed/NCBI
|
|
5
|
Zhang P, Li H, Tan X, Chen L and Wang S:
Association of metformin use with cancer incidence and mortality: A
meta-analysis. Cancer Epidemiol. 37:207–218. 2013. View Article : Google Scholar : PubMed/NCBI
|
|
6
|
Din FV, Valanciute A, Houde VP, Zibrova D,
Green KA, Sakamoto K, Alessi DR and Dunlop MG: Aspirin inhibits
mTOR signaling, activates AMP-activated protein kinase, and induces
autophagy in colorectal cancer cells. Gastroenterology.
142:1504–15.e3. 2012. View Article : Google Scholar : PubMed/NCBI
|
|
7
|
Wang LW, Li ZS, Zou DW, Jin ZD, Gao J and
Xu GM: Metformin induces apoptosis of pancreatic cancer cells.
World J Gastroenterol. 14:7192–7198. 2008. View Article : Google Scholar : PubMed/NCBI
|
|
8
|
Kisfalvi K, Eibl G, Sinnett-Smith J and
Rozengurt E: Metformin disrupts crosstalk between G protein-coupled
receptor and insulin receptor signaling systems and inhibits
pancreatic cancer growth. Cancer Res. 69:6539–6545. 2009.
View Article : Google Scholar : PubMed/NCBI
|
|
9
|
Kato K, Gong J, Iwama H, Kitanaka A, Tani
J, Miyoshi H, Nomura K, Mimura S, Kobayashi M, Aritomo Y, et al:
The antidiabetic drug metformin inhibits gastric cancer cell
proliferation in vitro and in vivo. Mol Cancer Ther. 11:549–560.
2012. View Article : Google Scholar : PubMed/NCBI
|
|
10
|
van Rooij E, Sutherland LB, Liu N,
Williams AH, McAnally J, Gerard RD, Richardson JA and Olson EN: A
signature pattern of stress-responsive microRNAs that can evoke
cardiac hypertrophy and heart failure. Proc Natl Acad Sci USA.
103:18255–18260. 2006. View Article : Google Scholar : PubMed/NCBI
|
|
11
|
Iorio MV and Croce CM: MicroRNAs in
cancer: Small molecules with a huge impact. J Clin Oncol.
27:5848–5856. 2009. View Article : Google Scholar : PubMed/NCBI
|
|
12
|
Iorio MV and Croce CM: MicroRNA
dysregulation in cancer: Diagnostics, monitoring and therapeutics.
A comprehensive review. EMBO Mol Med. 4:143–159. 2012. View Article : Google Scholar : PubMed/NCBI
|
|
13
|
Masaki T, Tokuda M, Yoshida S, Nakai S,
Morishita A, Uchida N, Funaki T, Kita Y, Funakoshi F, Nonomura T,
et al: Comparison study of the expressions of myristoylated
alanine-rich C kinase substrate in hepatocellular carcinoma, liver
cirrhosis, chronic hepatitis, and normal liver. Int J Oncol.
26:661–671. 2005.PubMed/NCBI
|
|
14
|
Laemmli UK: Cleavage of structural
proteins during the assembly of the head of bacteriophage T4.
Nature. 227:680–685. 1970. View
Article : Google Scholar : PubMed/NCBI
|
|
15
|
Towbin H, Staehelin T and Gordon J:
Electrophoretic transfer of proteins from polyacrylamide gels to
nitrocellulose sheets: Procedure and some applications. Proc Natl
Acad Sci USA. 76:4350–4354. 1979. View Article : Google Scholar : PubMed/NCBI
|
|
16
|
Jemal A, Siegel R, Ward E, Hao Y, Xu J and
Thun MJ: Cancer statistics, 2009. CA Cancer J Clin. 59:225–249.
2009. View Article : Google Scholar : PubMed/NCBI
|
|
17
|
Chua YJ and Cunningham D: Adjuvant
treatment for resectable pancreatic cancer. J Clin Oncol.
23:4532–4537. 2005. View Article : Google Scholar : PubMed/NCBI
|
|
18
|
Oettle H, Post S, Neuhaus P, Gellert K,
Langrehr J, Ridwelski K, Schramm H, Fahlke J, Zuelke C, Burkart C,
et al: Adjuvant chemotherapy with gemcitabine vs observation in
patients undergoing curative-intent resection of pancreatic cancer:
A randomized controlled trial. JAMA. 297:267–277. 2007. View Article : Google Scholar : PubMed/NCBI
|
|
19
|
Komori S, Osada S and Yoshida K: Novel
strategy with gemcitabine for advanced pancreatic cancer. ISRN
Oncol. 2011:9368932011.PubMed/NCBI
|
|
20
|
Vazquez-Martin A, López-Bonetc E, Cufí S,
Oliveras-Ferraros C, Del Barco S, Martin-Castillo B and Menendez
JA: Repositioning chloroquine and metformin to eliminate cancer
stem cell traits in pre-malignant lesions. Drug Resist Updat.
14:212–223. 2011. View Article : Google Scholar : PubMed/NCBI
|
|
21
|
Bodmer M, Becker C, Meier C, Jick SS and
Meier CR: Use of antidiabetic agents and the risk of pancreatic
cancer: A case-control analysis. Am J Gastroenterol. 107:620–626.
2012. View Article : Google Scholar : PubMed/NCBI
|
|
22
|
Liu B, Fan Z, Edgerton SM, Deng XS,
Alimova IN, Lind SE and Thor AD: Metformin induces unique
biological and molecular responses in triple negative breast cancer
cells. Cell Cycle. 8:2031–2040. 2009. View Article : Google Scholar : PubMed/NCBI
|
|
23
|
Poch B, Gansauge F, Schwarz A, Seufferlein
T, Schnelldorfer T, Ramadani M, Beger HG and Gansauge S: Epidermal
growth factor induces cyclin D1 in human pancreatic carcinoma:
Evidence for a cyclin D1-dependent cell cycle progression.
Pancreas. 23:280–287. 2001. View Article : Google Scholar : PubMed/NCBI
|
|
24
|
Biscardi JS, Maa MC, Tice DA, Cox ME, Leu
TH and Parsons SJ: c-Src-mediated phosphorylation of the epidermal
growth factor receptor on Tyr845 and Tyr1101 is associated with
modulation of receptor function. J Biol Chem. 274:8335–8343. 1999.
View Article : Google Scholar : PubMed/NCBI
|
|
25
|
Moschos SJ and Mantzoros CS: The role of
the IGF system in cancer: From basic to clinical studies and
clinical applications. Oncology. 63:317–332. 2002. View Article : Google Scholar : PubMed/NCBI
|
|
26
|
Naidu KA, Karl RC, Naidu KA and Coppola D:
Antiproliferative and proapoptotic effect of ascorbyl stearate in
human pancreatic cancer cells: Association with decreased
expression of insulin-like growth factor 1 receptor. Dig Dis Sci.
48:230–237. 2003. View Article : Google Scholar : PubMed/NCBI
|
|
27
|
Min Y, Adachi Y, Yamamoto H, Ito H, Itoh
F, Lee CT, Nadaf S, Carbone DP and Imai K: Genetic blockade of the
insulin-like growth factor-I receptor: A promising strategy for
human pancreatic cancer. Cancer Res. 63:6432–6441. 2003.PubMed/NCBI
|
|
28
|
Wu Q, Jin H, Yang Z, Luo G, Lu Y, Li K,
Ren G, Su T, Pan Y, Feng B, et al: MiR-150 promotes gastric cancer
proliferation by negatively regulating the pro-apoptotic gene EGR2.
Biochem Biophys Res Commun. 392:340–345. 2010. View Article : Google Scholar : PubMed/NCBI
|
|
29
|
Lin M, Chen W, Huang J, Gao H, Ye Y, Song
Z and Shen X: MicroRNA expression profiles in human colorectal
cancers with liver metastases. Oncol Rep. 25:739–747. 2011.
|
|
30
|
Watanabe A, Tagawa H, Yamashita J, Teshima
K, Nara M, Iwamoto K, Kume M, Kameoka Y, Takahashi N, Nakagawa T,
et al: The role of microRNA-150 as a tumor suppressor in malignant
lymphoma. Leukemia. 25:1324–1334. 2011. View Article : Google Scholar : PubMed/NCBI
|
|
31
|
Srivastava SK, Bhardwaj A, Singh S, Arora
S, Wang B, Grizzle WE and Singh AP: MicroRNA-150 directly targets
MUC4 and suppresses growth and malignant behavior of pancreatic
cancer cells. Carcinogenesis. 32:1832–1839. 2011. View Article : Google Scholar : PubMed/NCBI
|
|
32
|
Zhou L, Qi X, Potashkin JA, Abdul-Karim FW
and Gorodeski GI: MicroRNAs miR-186 and miR-150 down-regulate
expression of the pro-apoptotic purinergic P2X7 receptor
by activation of instability sites at the 3′-untranslated region of
the gene that decrease steady-state levels of the transcript. J
Biol Chem. 283:28274–28286. 2008. View Article : Google Scholar : PubMed/NCBI
|
|
33
|
Lin YC, Kuo MW, Yu J, Kuo HH, Lin RJ, Lo
WL and Yu AL: c-Myb is an evolutionary conserved miR-150 target and
miR-150/c-Myb interaction is important for embryonic development.
Mol Biol Evol. 25:2189–2198. 2008. View Article : Google Scholar : PubMed/NCBI
|
|
34
|
Zhang J, Luo N, Luo Y, Peng Z, Zhang T and
Li S: microRNA-150 inhibits human CD133-positive liver cancer stem
cells through negative regulation of the transcription factor
c-Myb. Int J Oncol. 40:747–756. 2012.
|
|
35
|
Webster RJ, Giles KM, Price KJ, Zhang PM,
Mattick JS and Leedman PJ: Regulation of epidermal growth factor
receptor signaling in human cancer cells by microRNA-7. J Biol
Chem. 284:5731–5741. 2009. View Article : Google Scholar
|
|
36
|
Duex JE, Comeau L, Sorkin A, Purow B and
Kefas B: Usp18 regulates epidermal growth factor (EGF) receptor
expression and cancer cell survival via microRNA-7. J Biol Chem.
286:25377–25386. 2011. View Article : Google Scholar : PubMed/NCBI
|
|
37
|
Chou YT, Lin HH, Lien YC, Wang YH, Hong
CF, Kao YR, Lin SC, Chang YC, Lin SY, Chen SJ, et al: EGFR promotes
lung tumorigenesis by activating miR-7 through a Ras/ERK/Myc
pathway that targets the Ets2 transcriptional repressor ERF. Cancer
Res. 70:8822–8831. 2010. View Article : Google Scholar : PubMed/NCBI
|
|
38
|
Boyerinas B, Park SM, Hau A, Murmann AE
and Peter ME: The role of let-7 in cell differentiation and cancer.
Endocr Relat Cancer. 17:F19–F36. 2010. View Article : Google Scholar
|
|
39
|
Johnson SM, Grosshans H, Shingara J, Byrom
M, Jarvis R, Cheng A, Labourier E, Reinert KL, Brown D and Slack
FJ: RAS is regulated by the let-7 microRNA family. Cell.
120:635–647. 2005. View Article : Google Scholar : PubMed/NCBI
|
|
40
|
Lee YS and Dutta A: The tumor suppressor
microRNA let-7 represses the HMGA2 oncogene. Genes Dev.
21:1025–1030. 2007. View Article : Google Scholar : PubMed/NCBI
|
|
41
|
Osada H and Takahashi T: let-7 and
miR-17-92: Small-sized major players in lung cancer development.
Cancer Sci. 102:9–17. 2011. View Article : Google Scholar
|
|
42
|
Lan FF, Wang H, Chen YC, Chan CY, Ng SS,
Li K, Xie D, He ML, Lin MC and Kung HF: Hsa-let-7g inhibits
proliferation of hepatocellular carcinoma cells by downregulation
of c-Myc and upregulation of p16INK4A. Int J Cancer.
128:319–331. 2011. View Article : Google Scholar
|
|
43
|
Fu TY, Chang CC, Lin CT, Lai CH, Peng SY,
Ko YJ and Tang PC: Let-7b-mediated suppression of basigin
expression and metastasis in mouse melanoma cells. Exp Cell Res.
317:445–451. 2011. View Article : Google Scholar
|
|
44
|
Schultz J, Lorenz P, Gross G, Ibrahim S
and Kunz M: MicroRNA let-7b targets important cell cycle molecules
in malignant melanoma cells and interferes with
anchorage-independent growth. Cell Res. 18:549–557. 2008.
View Article : Google Scholar : PubMed/NCBI
|