Introduction
As the third most common type of cancer worldwide,
colorectal cancer (CC) is a prevalent digestive malignancy, with
the second highest mortality rate (1). In 2022, ~590,000 new cases of CC were
diagnosed in China, with an upward trend (2). Surgical treatment and neoadjuvant
chemotherapy are widely used to treat CC (3). However, the surgical indications are
strictly limited and the quality of life of a large proportion of
patients with low rectal cancer is seriously affected following
surgery (4). Therefore, studying
the pathogenesis of CC is of great importance.
Microtubule interacting and trafficking domain
containing 1 (MITD1) encodes a protein that regulates endosomal
sorting complexes required for transport III protein activity and
is required for normal cell division. In addition, it has been
reported that MITD1 is involved in cytokinesis (5). A previous study suggested that MITD1
dysregulation could promote tumorigenesis and gene instability,
especially when it coincided with oncogene-induced mitotic stress
(6). Another study demonstrated
that long non-coding RNA (lncRNA) SLC16A1-AS1 knockdown
downregulated MITD1 and promoted the progression of hepatocellular
cancer via regulating the micro-RNA (miR)-411/MITD1 axis (7). MITD1 expression is markedly
strengthened in renal clear cell carcinoma. Therefore, MITD1
silencing could mediate tafazzin (TAZ)/solute carrier family 7
member 11 (SLC7A11) pathway-induced ferroptosis to inhibit the
growth and migration of clear cell renal cell carcinoma cells
(8). However, the effects of MITD1
on CC and its underlying mechanism on ferroptosis have not been
reported, to the best of the authors' knowledge.
Therefore, the present study aimed to investigate
the role and regulatory mechanism of MITD1 in CC, thus providing a
useful theoretical basis for the clinical treatment of CC.
Materials and methods
Clinical tumor tissues
CC tumor and adjacent normal tissues were obtained
from Wenling First People’s Hospital (Zhejiang, China). A total of
20 patients diagnosed with CC at Wenling First People’s Hospital
between June 2022 and December 2022 were enrolled in the present
study. This group comprised 11 males and 9 females, with an average
age of 35±9 years. The samples were formalin-fixed,
paraffin-embedded and sectioned for the immunohistochemistry (IHC)
assay according to the manufacturer's instructions. All patients
provided informed written consent and the study was approved by the
local institutional medical ethics review boards of Wenling First
People’s Hospital (approval no. KY-2023-2005-01).
Databases
The Encyclopedia of RNA Interactomes (ENCORI)
database (http://starbase.sysu.edu.cn/index.php) was used to
predict the expression levels of MITD1 in patients with CC
(9). In addition, the Gene
Expression Profiling Interactive Analysis (GEPIA) database
(http://gepia.cancer-pku.cn/) was used to
predict the association between the expression of MITD1 with the
overall survival of patients with CC (10).
IHC assay
Following sectioning at 4 µm and deparaffinization,
the paraffin-embedded tissue specimens were rehydrated in gradient
ethanol. Antigen retrieval was performed in 10 mM citrate at 95˚C
for 20 min. Following blocking in goat serum (cat. no. R37624;
Thermo Fisher Scientific, Inc.), the tissue specimens were first
incubated with MITD1 antibody (cat. no. 17264-1-AP; 1:50 dilution;
Proteintech) overnight at 4˚C and then with the corresponding
secondary antibody (cat. no. 30000-0-AP; 1:500 dilution;
Proteintech) for 1 h at room temperature. After hematoxylin
counterstaining for 2 min at room temperature and dehydration,
images of the tissue sections in three randomly selected fields of
view were captured under a light microscope (magnification,
x200).
Cell culture
The normal intestinal epithelial cell line HIEC
(cat. no. MZ-0792; Ningbo Mingzhou Biotechnology Co., Ltd.) and the
CC cell lines Caco2 (cat. no. B164108), SW480 (cat. no. MZ-3240;
both from Ningbo Mingzhou Biotechnology Co., Ltd.) and HCT116 (cat.
no. BNCC287750; BeNa Culture Collection) were cultured in RPMI-1640
medium (Gibco; Thermo Fisher Scientific, Inc.) supplemented with
10% FBS (Gemini Bio Products) at 37˚C in an incubator with 5%
CO2.
Reverse transcription-quantitative
(RT-q) PCR
Prior to DNase I treatment, total RNA was extracted
from cells (1x10⁴ cells) using the RNeasy Mini Kit
(Qiagen GmbH) according to the manufacturer's instructions. The
total RNA was then reverse transcribed into cDNA using a cDNA
Synthesis kit (Thermo Fisher Scientific, Inc.) according to the
manufacturer's instructions. The qPCR experiments were performed
using SYBR-Green reagents (Takara Bio, Inc.) according to the
manufacturer's instructions. The thermocycling condition used for
qPCR were as follows: 95˚C for 3 min (enzyme activation), followed
by 40 cycles at 95˚C for 20 sec (denaturation), 60˚C for 20 sec
(primer annealing) and 72˚C for 20 sec (extension). The mRNA
expression levels were quantified using the comparative CT method
(11) and GAPDH served as the
calibrator gene. The PCR primers used were as follows: MITD1
forward, 5'-GTGCTAAAGCGGGCAGTAGA-3' and reverse,
5'-CAGCAGGAACCAGCTCCTTT-3', SRSF1 forward,
5'-GTTGTCTCTGGACTGCCTCC-3' and reverse, 5'-ACTTGGACAACCTTGCCTGA-3'
and GAPDH forward, 5'-AATGGGCAGCCGTTAGGAAA-3' and reverse,
5'-GCGCCCAATACGACCAAATC-3'. The experiments were replicated three
times.
Cell Counting Kit 8 (CCK-8) assay
Cells were seeded into a 96-well plate at a density
of 2x10³ cells/well. Following induction with the
corresponding compound, cells were supplemented with 10 µl CCK-8
reagent (Dojindo Molecular Technologies, Inc.) and incubated for 4
h. Finally, the absorbance at a wavelength of 450 nm was measured
in each well at 24, 48 and 72 h.
Western blot analysis
Following homogenization of A549 cells in RIPA
buffer (Auragene), the protein concentration was quantified using a
bicinchoninic acid kit (BCA; Beyotime Institute of Biotechnology).
Subsequently, 30 µg protein extracts were separated by 12% SDS-PAGE
and were then transferred onto PVDF membranes. Following blocking
with 5% BSA (Thermo Fisher Scientific, Inc.) for 2 h, the membranes
were first incubated with primary antibodies (all from Proteintech)
targeting MITD1 (cat. no. 17264-1-AP; 1:1,000 dilution), E-cadherin
(cat. no. 20874-1-AP; 1:20,000 dilution), N-cadherin (cat. no.
22018-1-AP; 1:2,000 dilution), Snail (cat. no. 13099-1-AP; 1:1,000
dilution), SRSF1 (cat. no. 12929-2-AP; 1:1,000 dilution), p53 (cat.
no. 60283-2-Ig; 1:5,000 dilution), p21 (cat. no. 10355-1-AP;
1:1,000 dilution), SLC7A11 (cat. no. 26864-1-AP; 1:1,000 dilution),
GPX4 (cat. no. 30388-1-AP; 1:1,000 dilution) or GAPDH (cat. no.
10494-1-AP; 1:5,000 dilution) at 4˚C overnight and then with the
corresponding secondary antibody (cat. no. ab6721; 1:5,000
dilution; Abcam) at room temperature for 1 h. An ECL kit
(MilliporeSigma) was applied to visualize blots. ImageJ software
(version 1.42; National Institutes of Health) was employed for band
quantification.
Cell transfection
HCT116 cells were transfected with 50 nM serine and
arginine rich splicing factor 1 (SRSF1) overexpression plasmid
(Oe-SRSF1) and negative control vector (Oe-NC), small hairpin RNAs
(shRNAs) targeting SRSF1 (sh-SRSF1#1 or sh- SRSF1#2), shRNAs
targeting MITD1 (sh-MITD1#1 or sh-MITD1#2) and the scrambled NCs
(sh-NC) at 37˚C for 48 h, all purchased from Shanghai GeneChem Co.,
Ltd., using Lipofectamine® RNAiMAX (Thermo Fisher
Scientific, Inc.), according to the manufacturer's protocol. At 48
h following transfection, the cell transfection efficiency was
assessed with RT-qPCR and western blot. The target sequence of
sh-MITD1#1 was 5'-TTGGATAGAAGATCCTTATAT-3'; sh-MITD1#2 was
5'-TGGATAGAAGATCCTTATATT-3'; sh-SRSF1#1 was
5'-GTGGAAGTTGGCAGGATTTAA-3'; sh-SRSF1#2 was
5'-TGGAAGTTGGCAGGATTTAAA-3'; shRNA-NC,
5'-CAACAAGATGAAGAGCACCAA-3'.
Cell colony formation assay
Following incubation for two weeks in 6-well plates
(density, 200 cells/well), cells were treated with 3.7%
paraformaldehyde at room temperature for 15 min, followed by
staining with 0.1% crystal violet at room temperature for 30 min.
Finally, colonies with a diameter of >0.05 mm were recorded and
analyzed.
EdU staining
Following HCT116 cell treatment with the indicated
compounds in 6-well plates (density, 4x10⁴ cells/well),
cells were immobilized, blocked and treated with EdU stain at 37˚C
for 2 h (Wuhan Servicebio Technology Co., Ltd.). Nuclear staining
was performed for 30 min at room temperature with Hoechst dye 33342
(Beijing Solarbio Science and Technology Co., Ltd.). Images were
captured under a fluorescence microscope (DMI8; Leica Microsystems
GmbH).
Invasion assay
Treated cells resuspended in 200 µl serum-free
medium were added to the upper chamber of the Transwell insert
pre-coated with Matrigel® (BD Biosciences) at 37˚C for 1
h. The bottom chamber was supplemented with complete medium. Cells
invading the lower chamber were immediately fixed by methanol for
48 h at 37˚C, prior to staining with 0.1% crystal violet solution
at room temperature for 10 min. Cell morphology was observed under
an optical microscope.
Wound healing assay
Cells were seeded into 6-well plates at a density of
4x10⁴ cells/well and wounds were created on the cell
nanolayer using a 200-µl pipette tip. Following cell washing and
incubation for 24 h in serum-free medium, images of the wounded
gaps were captured at different time points (0 h and 24 h).
Detection of lipid reactive oxygen
species (ROS) levels
The lipid ROS levels were determined using the
BODIPY 581/591 C11 kit (Thermo Fisher Scientific, Inc.). Cells were
seeded into 6-well plates at a density of 4x10⁴
cells/well and were then treated with 2 µM C11-BODIPY (581/591)
probe, according to the manufacturer's instructions. The cells were
visualized using a fluorescent inverted microscope. Image J
software (version 1.42; National Institutes of Health) was used for
analysis.
Glutathione (GSH) and malondialdehyde
(MDA) content
GSH and MDA levels were detected using the
corresponding GSH (cat. no. S0053) and MDA (cat. no. S0131M; both
from Beyotime Institute of Biotechnology) assay kits, according to
the manufacturer's instructions.
Iron assays
The total iron concentrations in HCT116 cells were
assessed using an iron assay kit (cat. no. ab83366; Abcam),
according to the manufacturer's instructions. Following the
indicated treatment, the cell supernatant was isolated after
centrifugation at 16,000 x g at room temperature for 10 min and was
then supplemented with the iron probe, followed by incubation at
25˚C for 1 h in the dark. The absorbance at a wavelength of 593 nm
was measured using a microplate reader.
RNA immunoprecipitation (RIP)
assay
RIP assay was performed using the corresponding RNA
Immunoprecipitation Kit (BersinBio), according to the
manufacturer's instructions. HCT116 cells (1x10⁷ cells)
were lysed in RIPA lysis buffer. Following the lysis, 100 µl cell
lysates incubated with RIPA buffer containing magnetic beads
conjugated with 1 µg anti-MITD1 (cat. no. 17264-1-AP; 0.5 µg;
Proteintech) or 2 µg IgG (cat. no. 30000-0-AP; 0.5 µg; Proteintech)
at 4˚C overnight. Subsequently, proteinase K buffer was applied for
the digestion of the protein from samples and the
immunoprecipitated RNA was extracted using TRIzol reagent
(Invitrogen; Thermo Fisher Scientific, Inc.). After purification,
the precipitated RNA was analyzed by RT-qPCR analysis as
aforementioned.
Actinomycin D assay
To evaluate the stability of linear RNA, the
transcription of RNA was inhibited following cell treatment with 1
µg/ml actinomycin D (MedChemExpress) or DMSO (control) for 0, 3, 6,
9 and 12 h. RNA was then extracted for RT-qPCR analysis as
aforementioned.
Statistical analysis
All data were analyzed by SPSS software (version
20.0; IBM Corp.). All results are expressed as the mean ± standard
deviation. Intergroup comparison of the mean values was implemented
employing one-way ANOVA followed by Tukey's post-hoc test.
P<0.05 was considered to indicate a statistically significant
difference.
Results
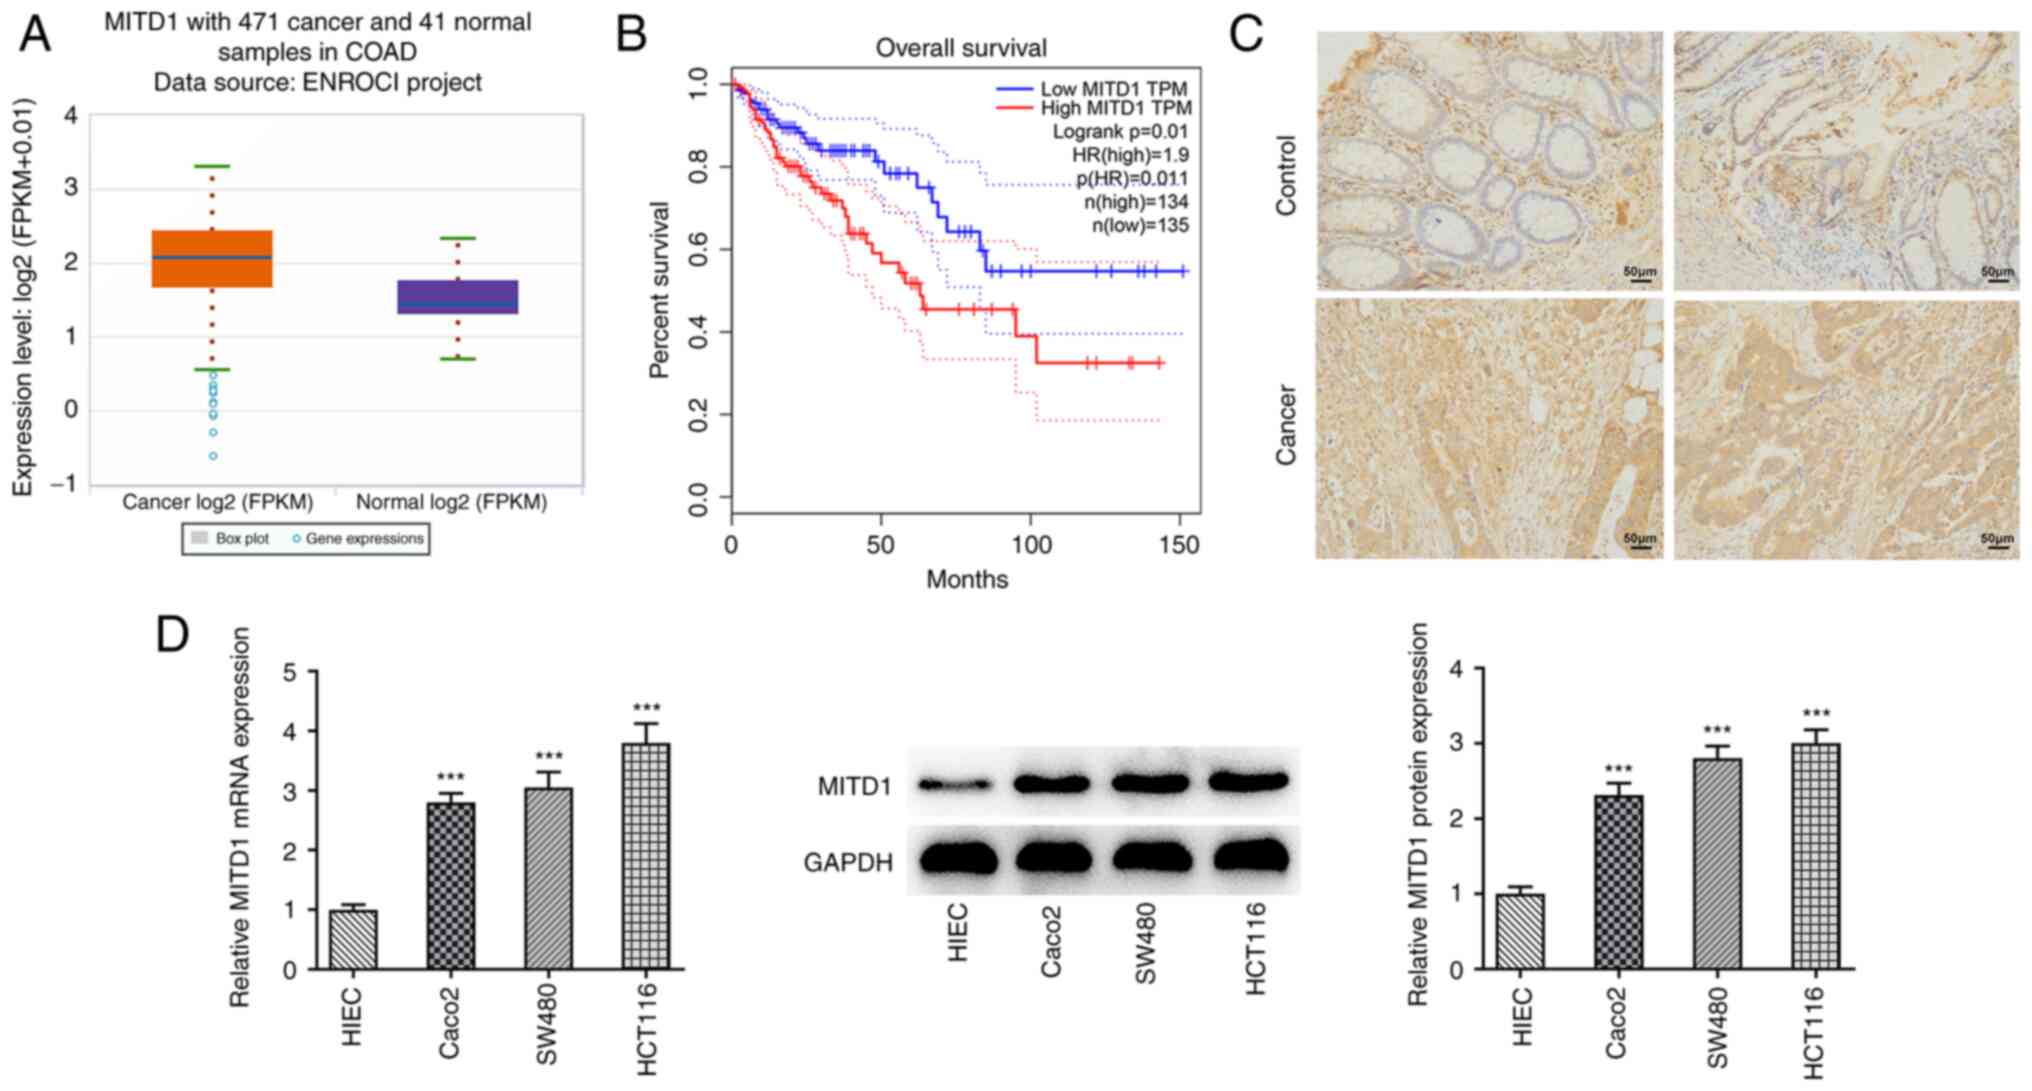
MITD1 is upregulated in CC
The ENCORI database showed that MITD1 was highly
expressed in tumor tissues derived from patients with CC (Fig. 1A). Additionally, the GEPIA database
demonstrated that elevated MITD1 expression was notably associated
with lower overall survival in patients with CC (Fig. 1B). IHC staining showed that the
expression of MITD1 in cancer tissues from patients with CC was
abnormally elevated (Fig. 1C). In
addition, the mRNA and protein expression levels of MITD1 in
different CC cell lines were detected by RT-qPCR and western blot
analysis, respectively. The results showed that compared with HIEC
cells, MITD1 was significantly upregulated in CC cell lines. More
specifically, the expression levels of MITD1 were more notably
increased in HCT116 cells. Therefore, HCT116 cells were selected
for the subsequent experiments (Fig.
1D).
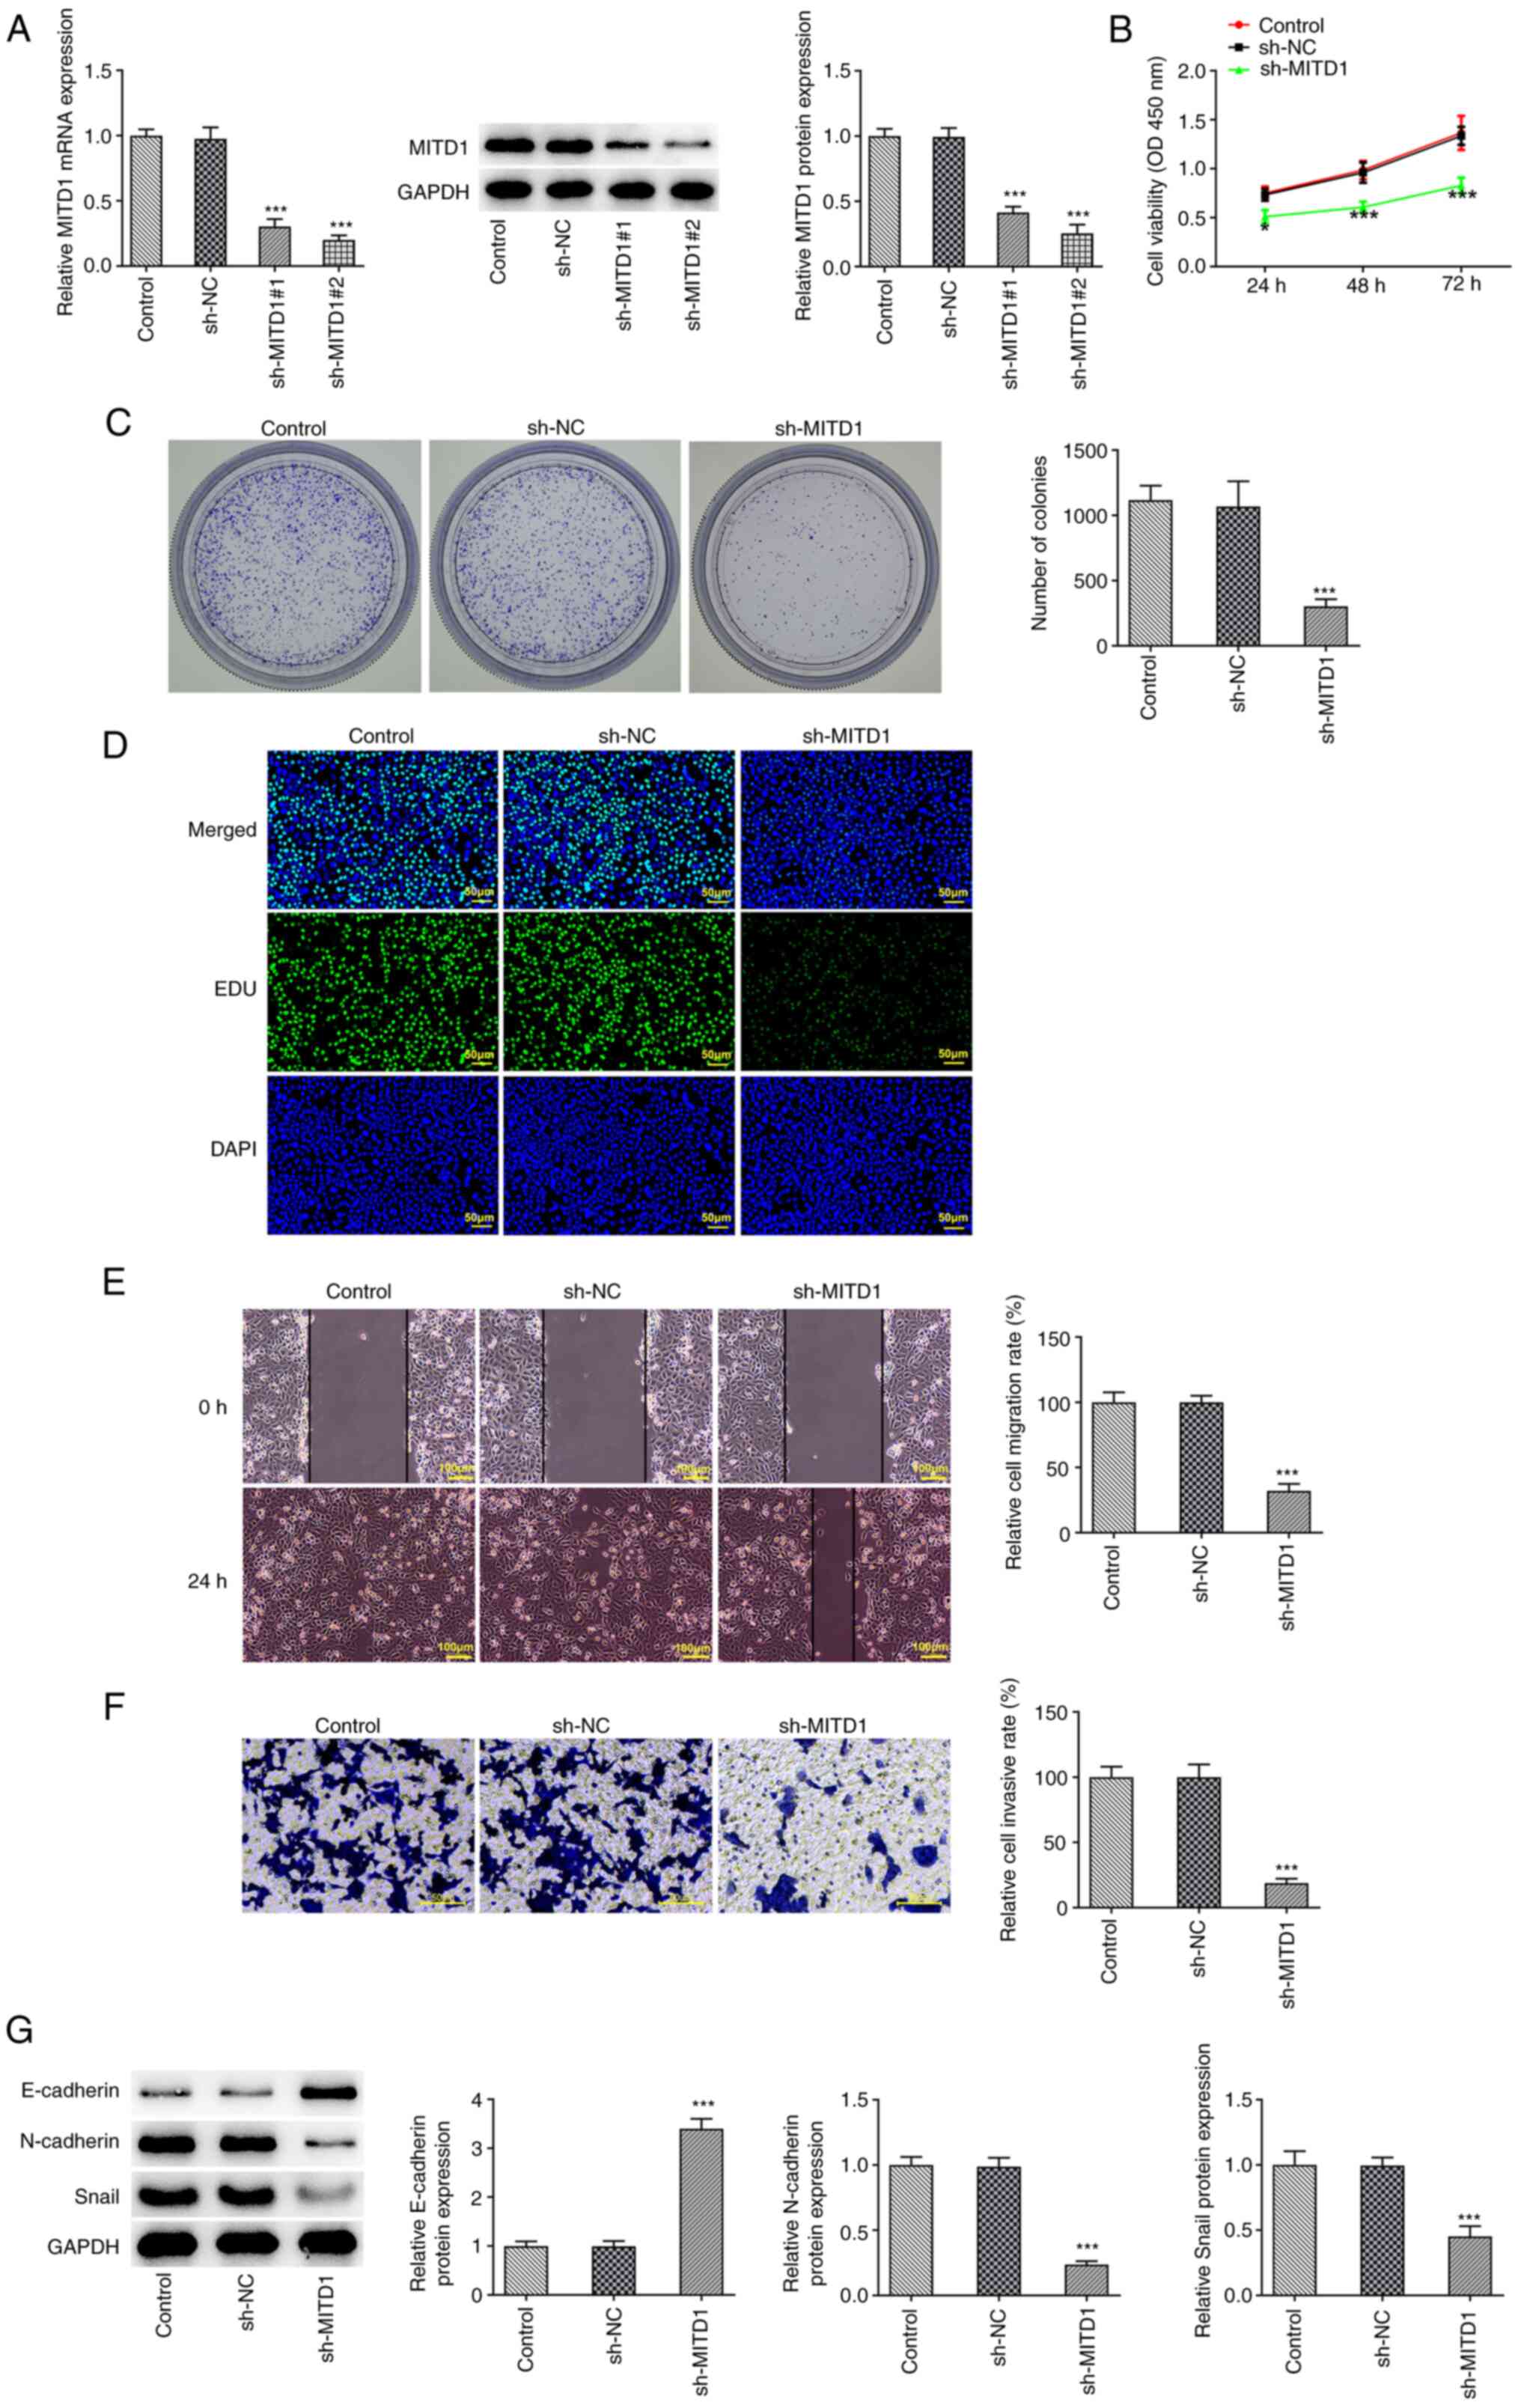
MITD1 knockdown attenuates CC cell
proliferation and metastasis
A MITD1 interference plasmid was constructed and the
transfection efficiency was evaluated via RT-qPCR and western blot
analysis. Since MITD1 expression was more notably reduced in the
sh-MITD1#2 group compared with the sh-MITD1#1 group, sh-MITD1#2 was
selected for the follow-up experiments (Fig. 2A). CCK-8, colony formation and EdU
staining assays revealed that compared with the sh-NC group, cell
viability and proliferation were markedly diminished in the
sh-MITD1 group (Fig. 2B-D).
Additionally, the wound healing and Transwell assay results
elaborated that the invasion and migration capacities of CC cells
were distinctly attenuated following MITD1 silencing (Fig. 2E and F). Furthermore, western blot analysis was
performed to detect the expression levels of
epithelial-to-mesenchymal transition (EMT)-related proteins. The
results showed that E-cadherin was upregulated and N-cadherin and
Snail were downregulated in MITD1-depleted CC cells (Fig. 2G).
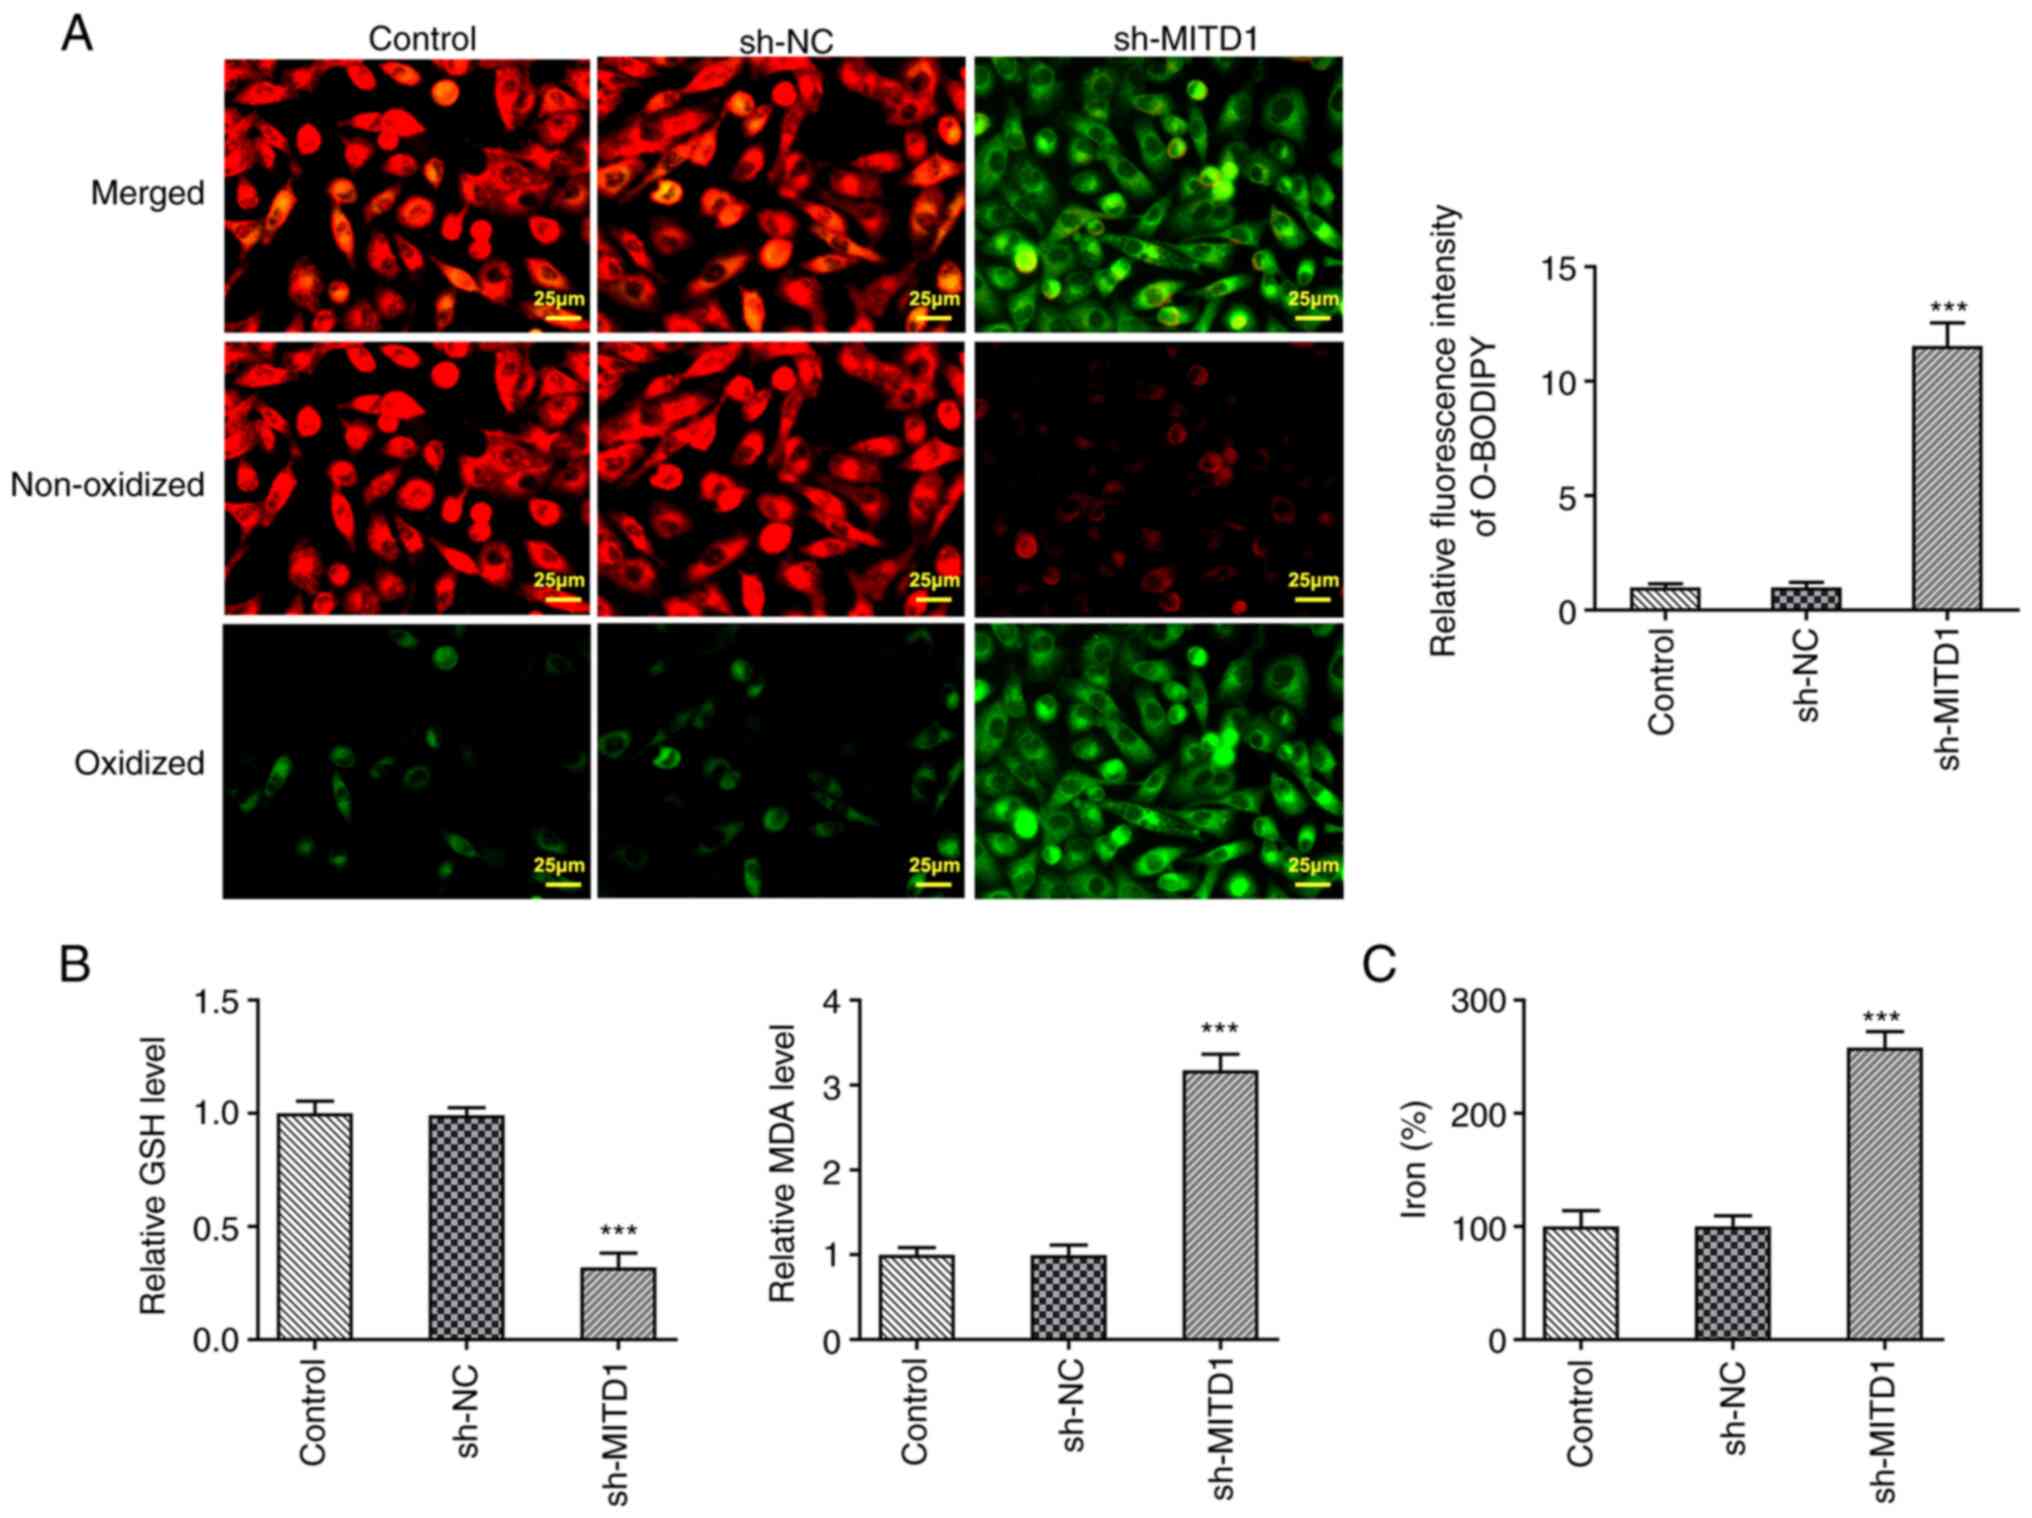
MITD1 interference promotes
ferroptosis in CC cells
BODIPY (581/591) C11 staining was used to determine
the levels of lipid ROS. The experimental data showed that lipid
ROS content was markedly increased in the sh-MITD1 group compared
with the sh-NC group (Fig. 3A). In
addition, compared with the sh-NC group, GSH generation was
declined and MDA content was enhanced in the sh-MITD1 group
(Fig. 3B). Finally, total iron
levels were detected using the corresponding kit and the results
showed that they were significantly increased following MITD1
silencing (Fig. 3C).
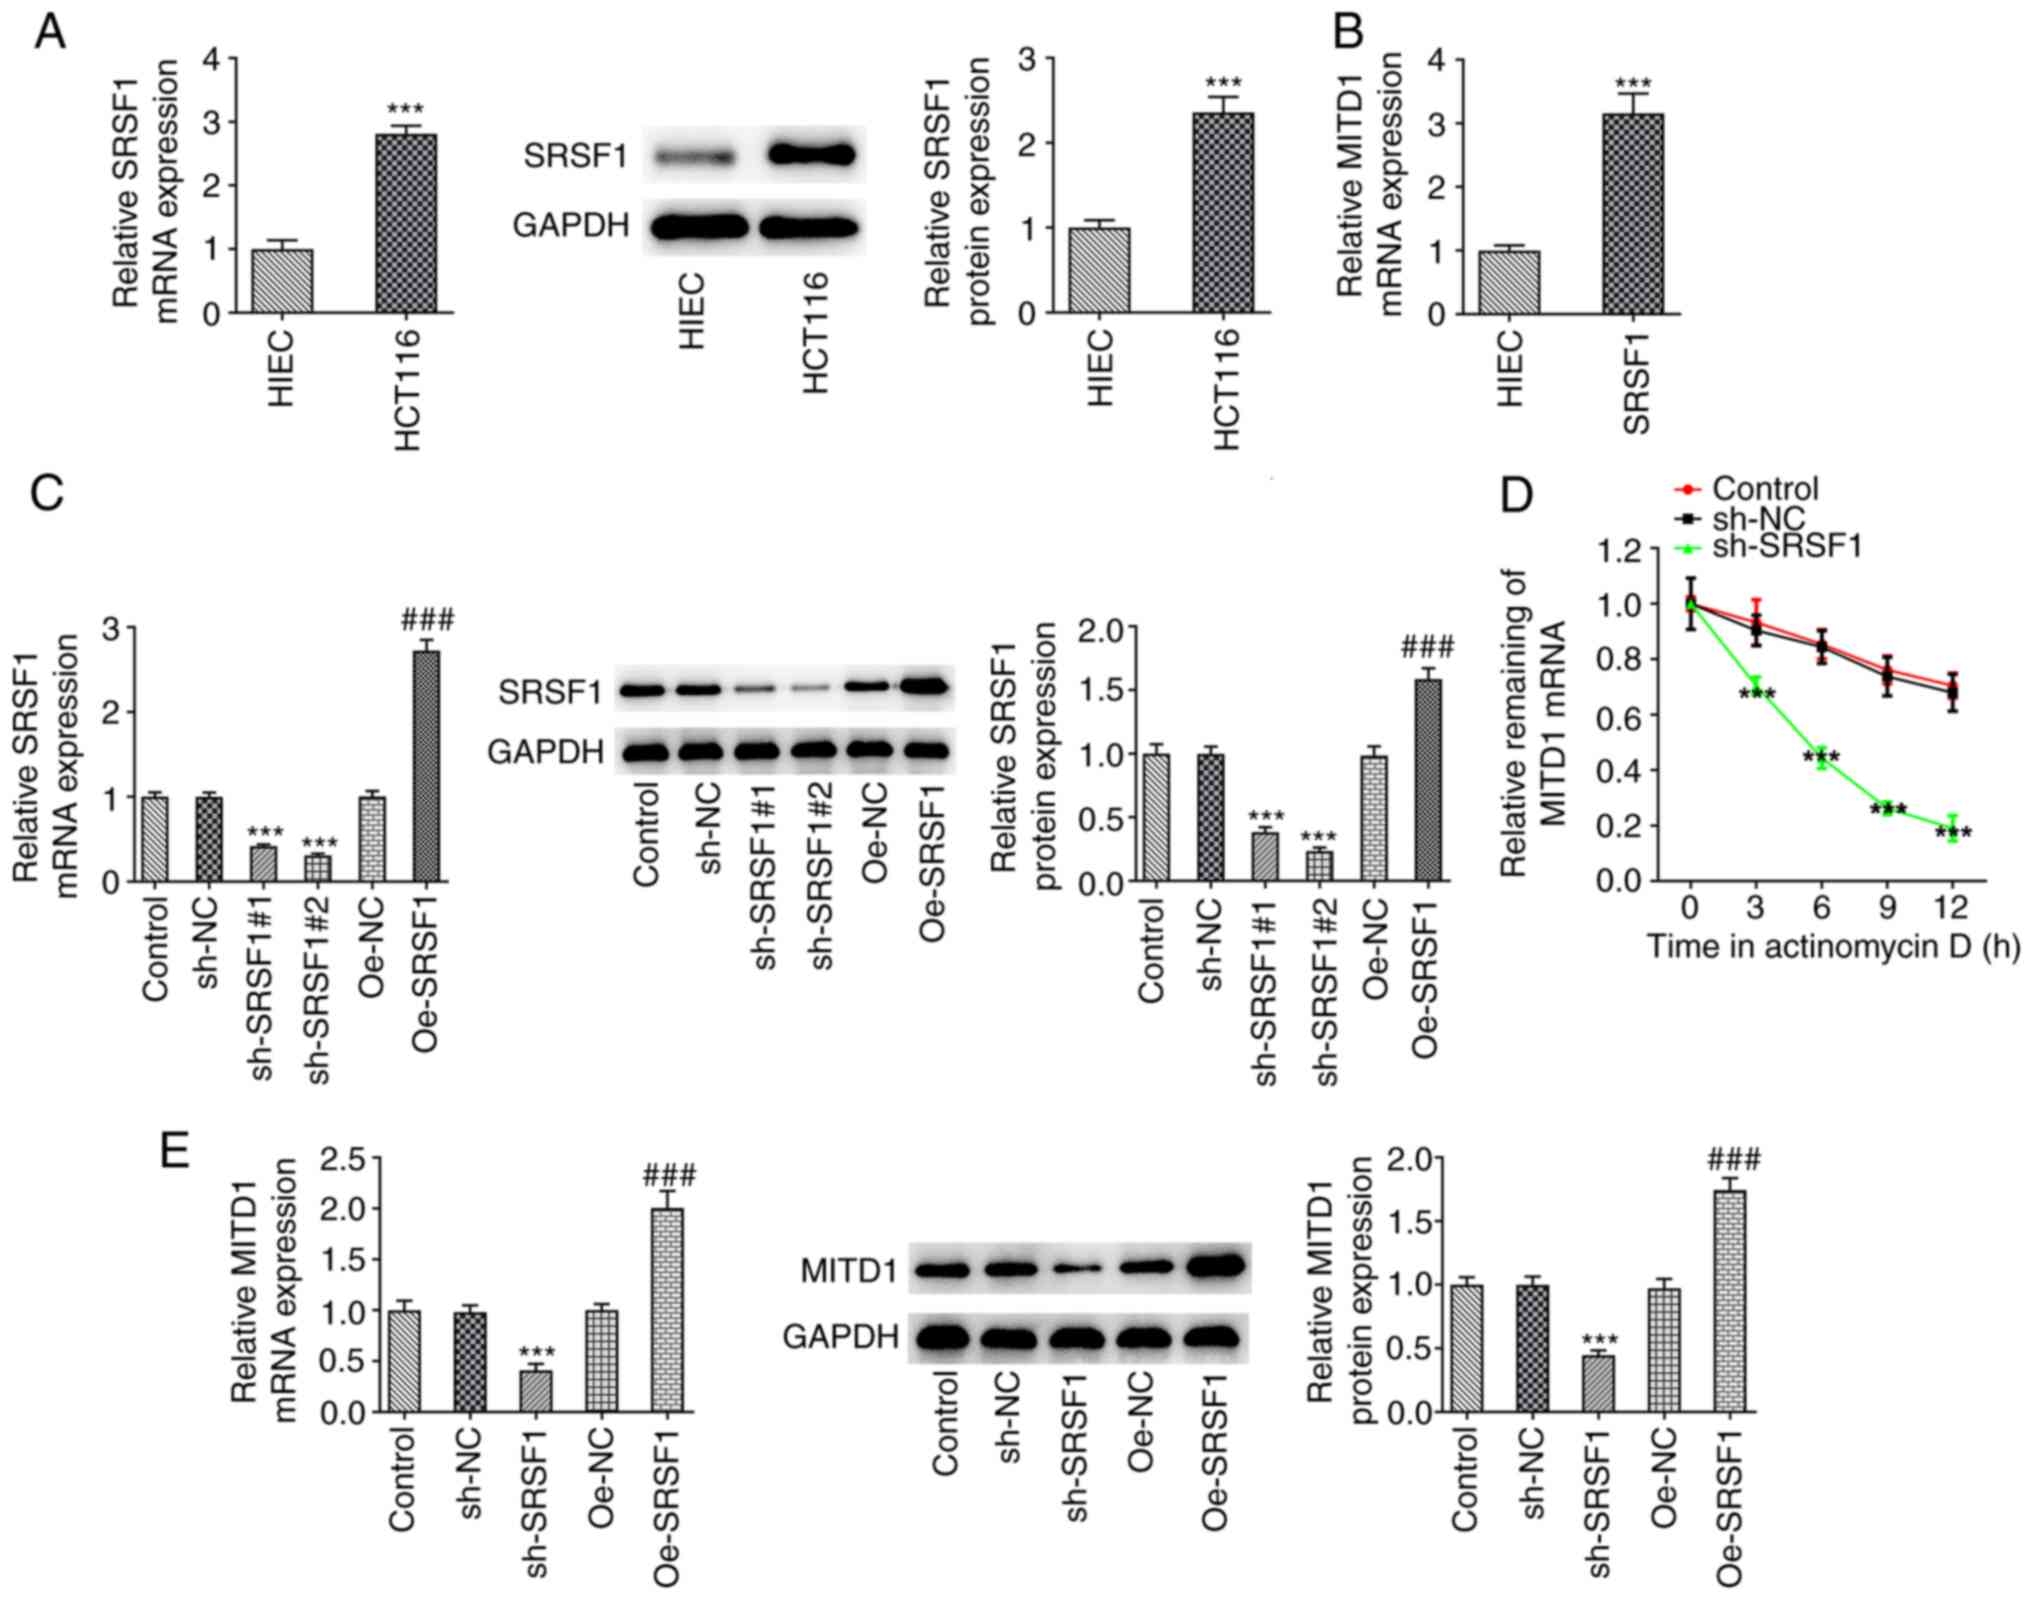
SRSF1 stabilizes MITD1 mRNA
RT-qPCR and western blot analysis revealed that the
expression levels of SRSF1 were abnormally elevated in CC cell
lines (Fig. 4A). RIP assay
verified the binding capability of SRSF1 with MITD1 mRNA (Fig. 4B). Subsequently, SRSF1 was silenced
and overexpressed separately, and the transfection efficiency was
assessed by RT-qPCR and western blot analysis. The results
demonstrated that cells were successfully transfected (Fig. 4C). Subsequently, RT-qPCR showed
that following SRSF1 knockdown in cells treated with actinomycin D,
the stability of MITD1 mRNA was significantly decreased (Fig. 4D). Furthermore, SRSF1 silencing
could significantly inhibit the expression of MITD1 in CC cells,
while SRSF1 overexpression exerted the opposite effect (Fig. 4E).
SRSF1 regulates MITD1 to affect the
progression and ferroptosis of CC via p53/SLC7A11/GPX4
signaling
Subsequently, MITD1 was silenced and SRSF1 was
overexpressed in CC cells, concurrently. The CCK-8 results showed
that cell viability in the sh-MITD1 + Oe-SRSF1 group was notably
increased compared with the sh-MITD1 + Oe-NC group (Fig. 5A). Colony formation and EdU
staining assays indicated that the proliferation capacity of CC
cells in the sh-MITD1 + Oe-SRSF1 group was overtly enhanced
compared with the sh-MITD1 + Oe-NC group (Fig. 5B and C). Additionally, wound healing and
Transwell assays showed that the simultaneous SRSF1 overexpression
and MITD1 silencing significantly enhanced the invasion and
migration abilities of CC cells (Fig.
5D and E). Western blot
analysis suggested that compared with the sh-MITD1 + Oe-NC group,
E-cadherin expression declined, while that of N-cadherin and Snail
was elevated in the sh-MITD1 + Oe-SRSF1 group (Fig. 5F). Furthermore, following SRSF1
overexpression and MITD1 knockdown, lipid ROS and MDA contents were
prominently reduced, while those of GSH were notably enhanced
(Fig. 6A and B). In addition, total iron levels were
also apparently decreased (Fig.
6C). Finally, western blot analysis was performed to detect the
expression levels of proteins involved in the p53/SLC7A11/GPX4
signaling pathway. The results demonstrated that p53 and p21 were
noticeably upregulated in the sh-MITD1 group compared with the
control group. However, SLC7A11 and GPX4 were evidently
downregulated. Compared with the sh-MITD1 + Oe-NC group, the
expression levels of the p53/SLC7A11/GPX4 signaling pathway-related
proteins were partially reversed in the sh-MITD1 + Oe-SRSF1 group
(Fig. 6D).
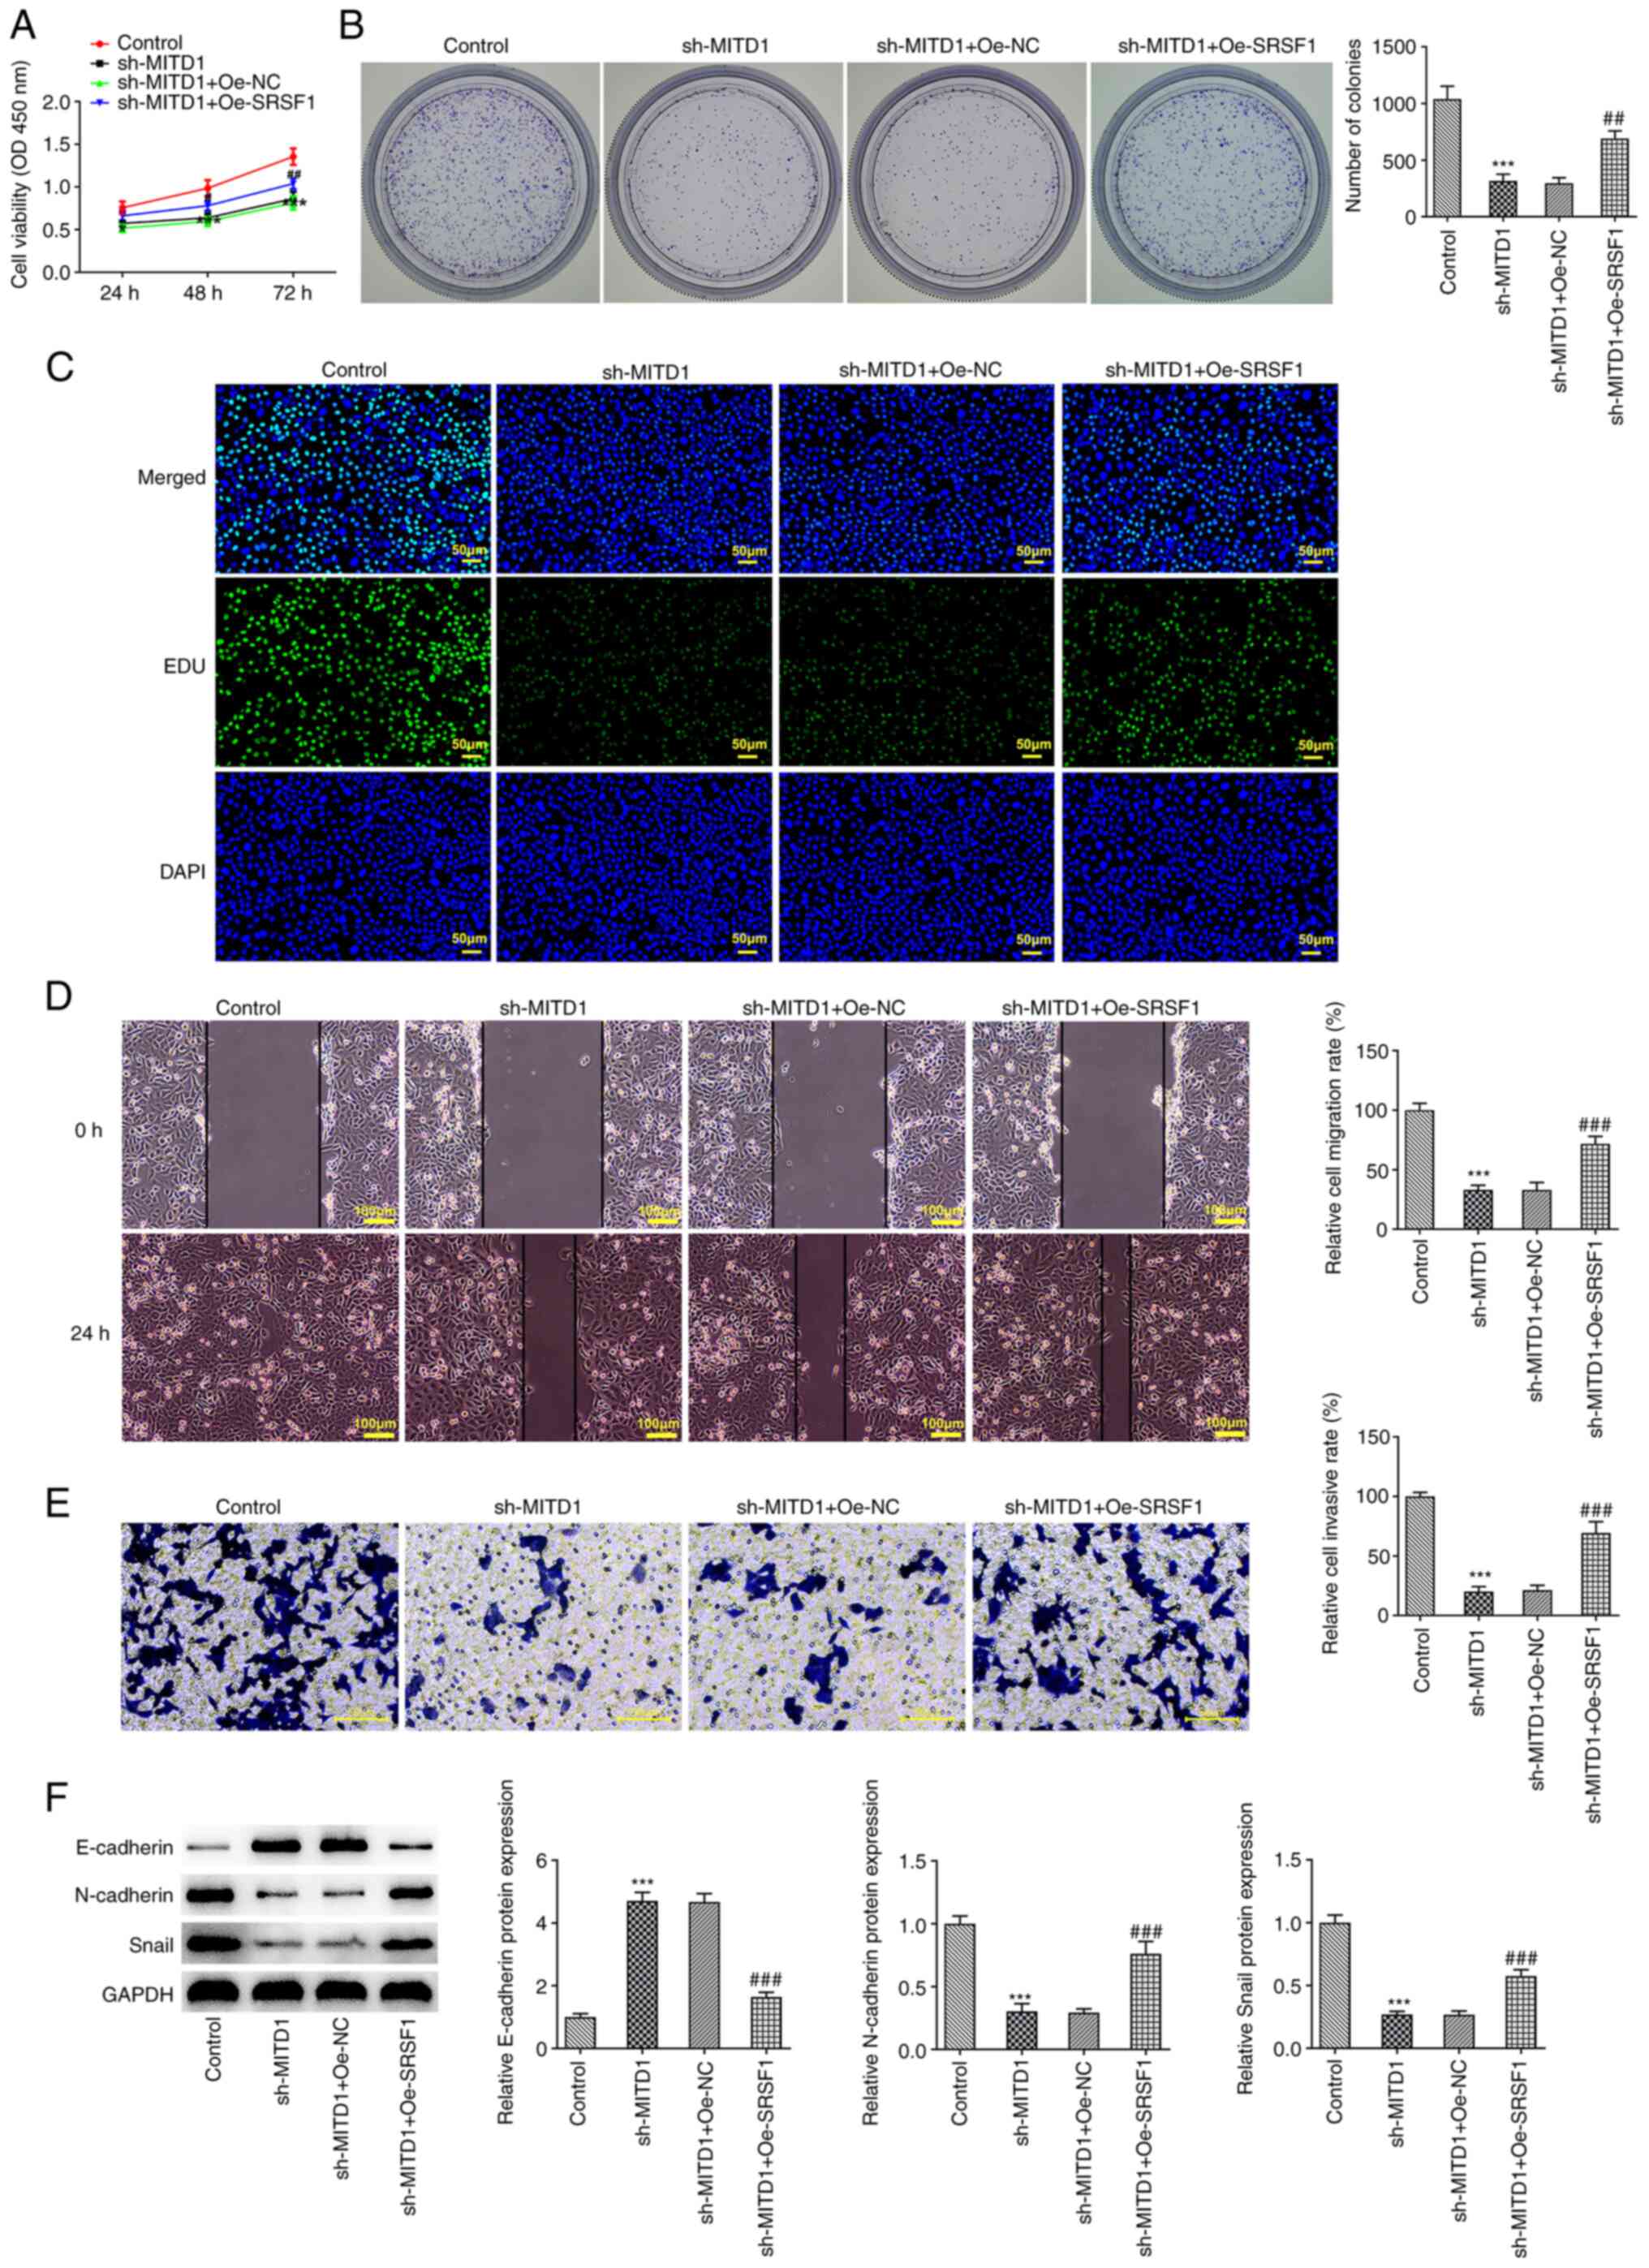 | Figure 5SRSF1 regulates MITD1 to affect the
progression of CC via p53/solute carrier family 7 member
11/glutathione peroxidase 4 signaling. (A) Cell viability was
assessed by Cell Counting Kit 8 assay. The proliferation ability of
CC cells was evaluated using (B) colony formation and (C) EdU
assays (scale bar, 50 µm). (D) Wound-healing (scale bar, 100 µm)
and (E) Transwell assays (scale bar, 50 µm) were performed to
assess cell migration and invasion. (F) The expression levels of
epithelial-to-mesenchymal transition-related proteins were detected
using western blot analysis. ***P<0.001 vs. the sh-NC
group; ##P<0.01, ###P<0.001 vs. the
Oe-NC group. SRSF1, serine and arginine rich splicing factor 1; CC,
colorectal cancer; MITD1, microtubule interacting and trafficking
domain containing 1; sh, small hairpin; NC, negative control; Oe,
overexpression. |
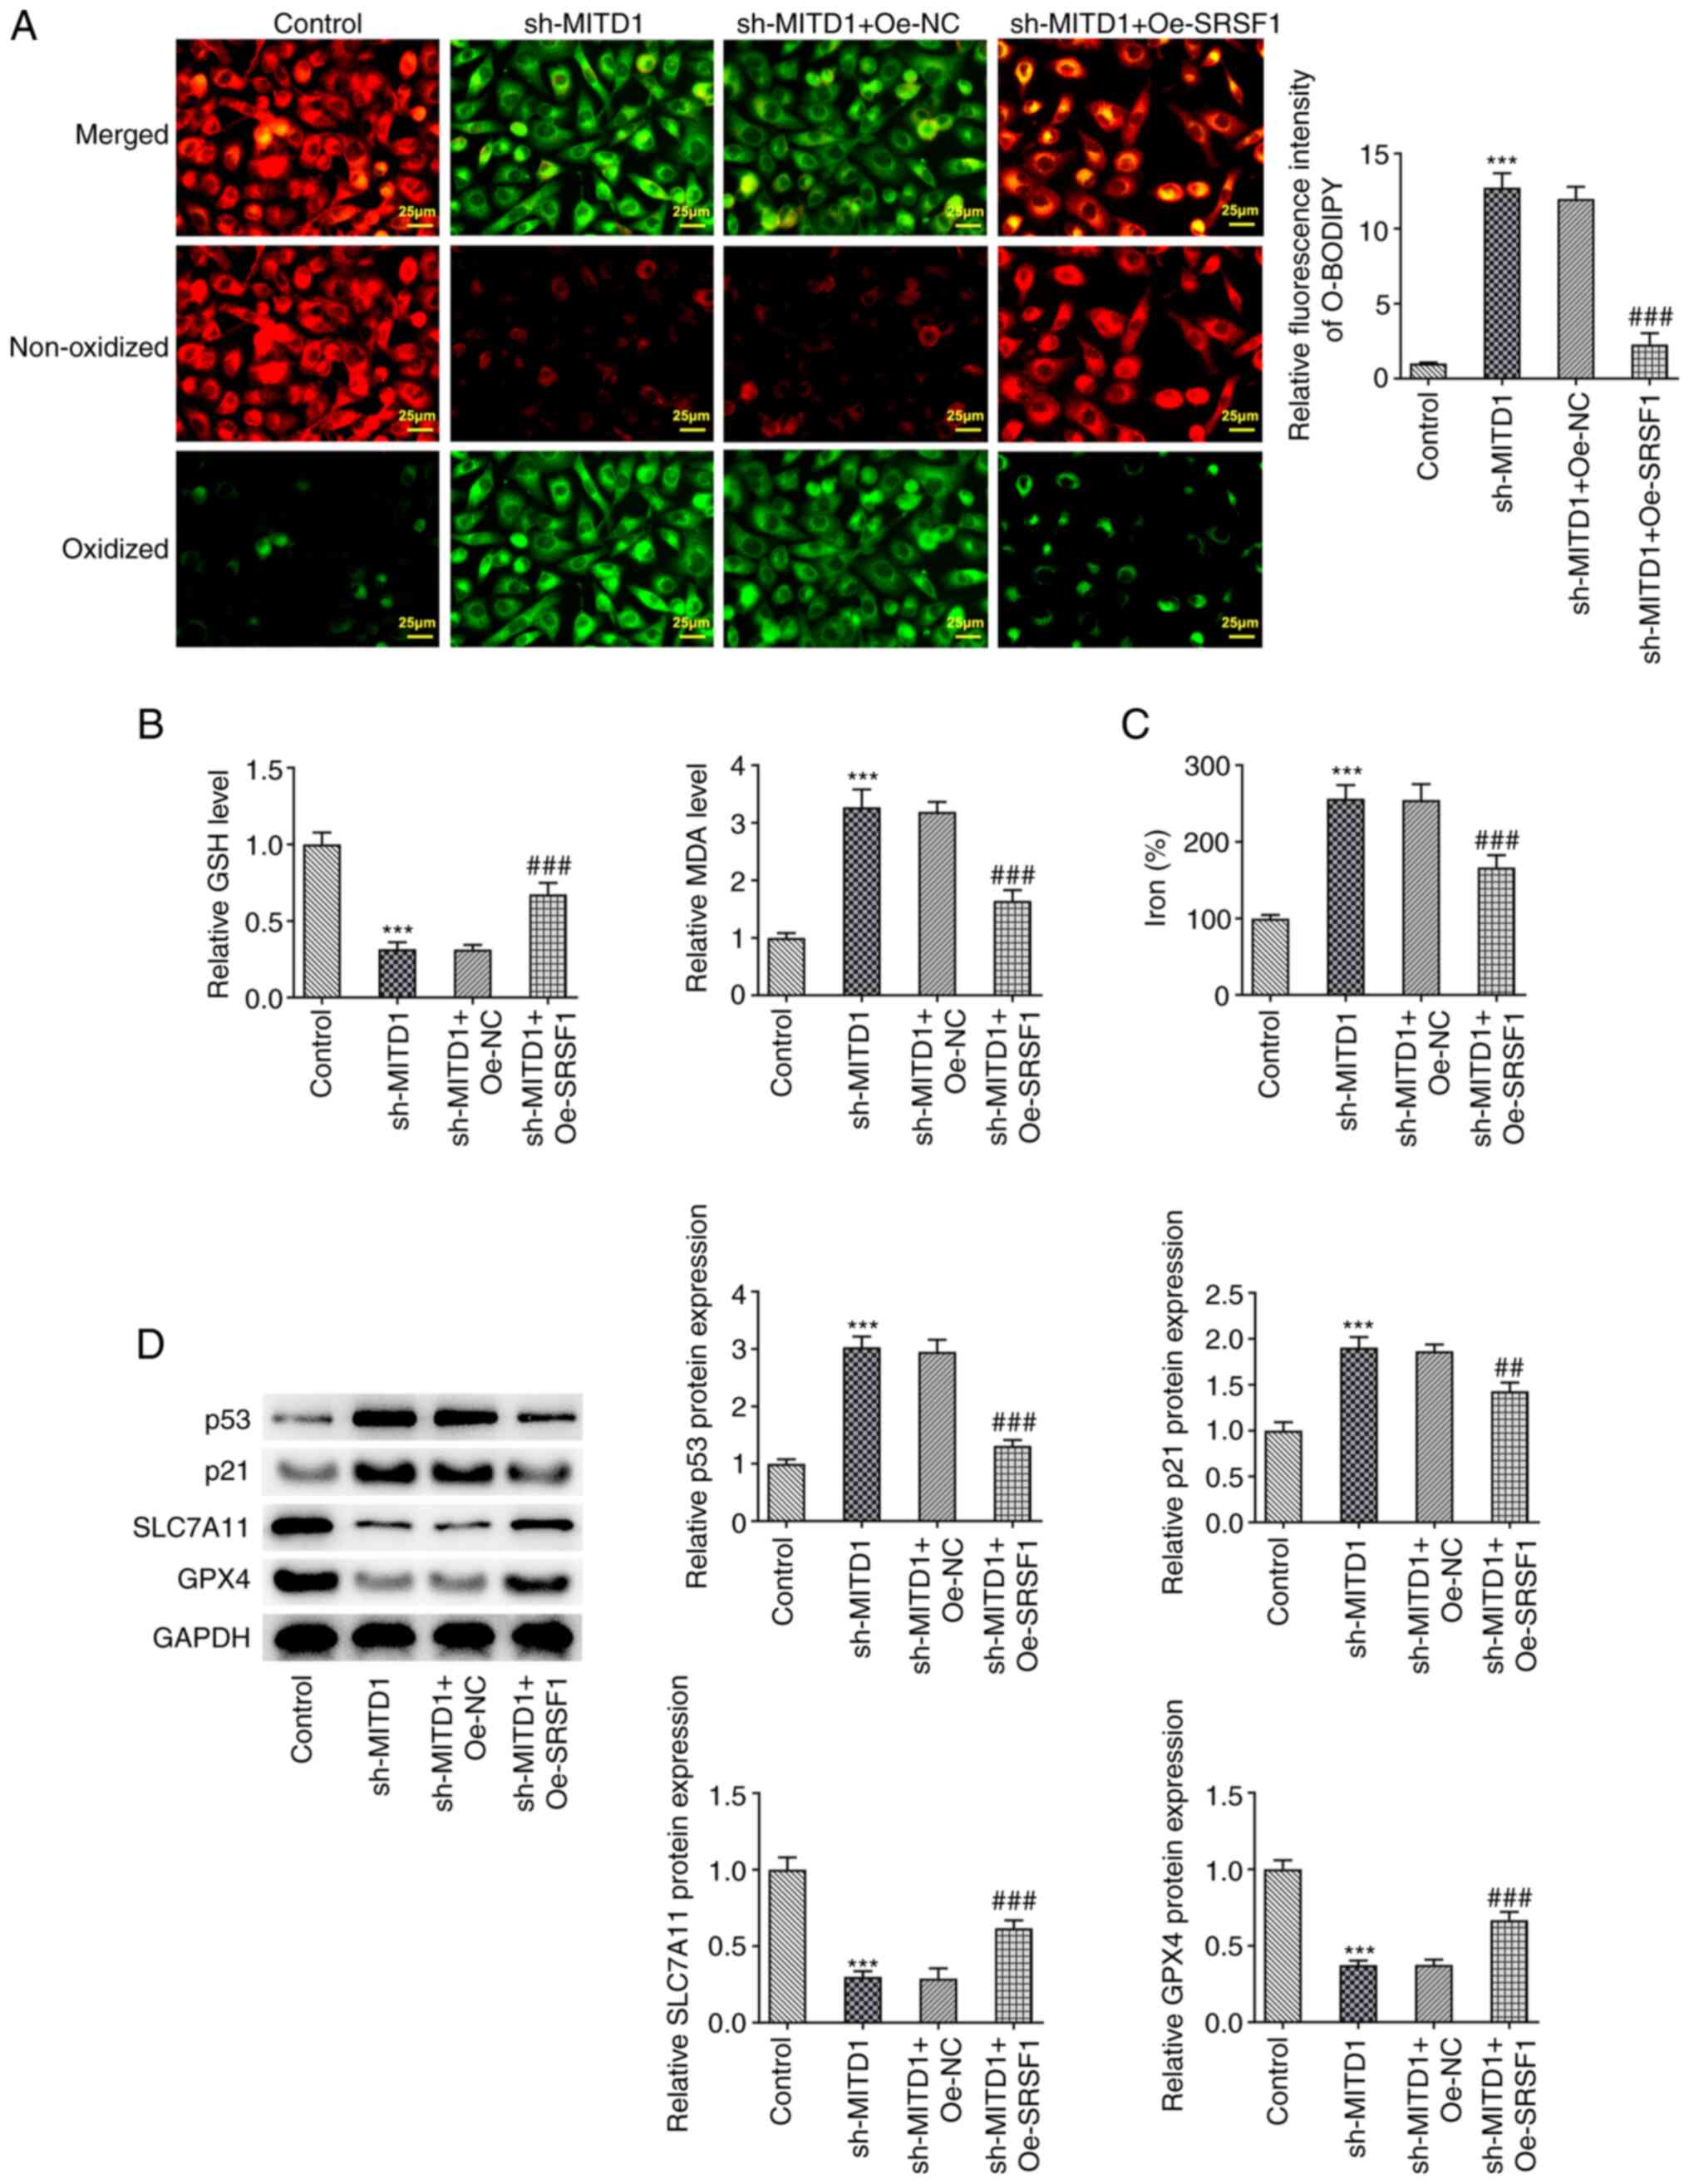 | Figure 6SRSF1 regulates MITD1 to affect
ferroptosis in colorectal cancer cells via p53/SLC7A11/GPX4
signaling. (A) Lipid reactive oxygen species levels were measured
by BODIPY (581/591) C11 staining (scale bar, 25 µm). (B) GSH and
MDA contents were measured using the corresponding kits. (C) Total
iron levels were detected using the corresponding kit. (D) The
expression levels of p53/SLC7A11/GPX4 signaling-related proteins
were detected using western blot analysis. ***P<0.001
vs. the sh-NC group; ##P<0.01,
###P<0.001 vs. the sh-MITD1 + Oe-NC group. SLC7A11,
solute carrier family 7 member 11; GPX4, glutathione peroxidase 4;
SRSF1, serine and arginine rich splicing factor 1; CC, colorectal
cancer; MITD1, microtubule interacting and trafficking domain
containing 1; GSH, glutathione; MDA, malondialdehyde; GPX4,
glutathione peroxidase 4; sh, small hairpin; NC, negative control;
Oe, overexpression. |
Discussion
Although the current diagnostic and treatment
approaches for CC are constantly improving, the 5-year survival
rate remains <12%, suggesting the extremely poor prognosis of
patients with CC diagnosed at advanced stages (12). Therefore, understanding the
initiation and progression of CC is of great importance for
providing particular insights into the clinical diagnosis and
treatment of CC.
In the present study, bioinformatics analysis using
the ENCORI database revealed that MITD1 was upregulated in CC
tissues. Additionally, the GEPIA database also suggested that
increased MITD1 expression was closely associated with low overall
survival rate of patients with CC. Emerging evidence has suggested
that MITD1 can be considered as a molecular marker for predicting
the prognosis of several types of cancers, including hepatocellular
carcinoma and renal cell carcinoma (6,13).
However, the expression and mechanism of MITD1 in CC have not been
previously investigated to the best of the authors' knowledge. The
results of the present study demonstrated that the expression
levels of MITD1 were increased in CC tumor tissues compared with
adjacent normal tissues. Furthermore, MITD1 expression was also
abnormally elevated in CC cell lines, highlighting the potential of
MITD1 as a prognostic marker for CC. To elucidate the specific
regulatory effect of MITD1 on CC growth, MITD1 was silenced. The
results showed that CC cell proliferation, invasion and migration
were notably decreased. The above findings were consistent with the
results reported by Chen et al (14), demonstrating that MITD1 knockdown
could significantly inhibit bladder cancer cell migration and
proliferation.
In recent years, relevant clinical studies have
suggested that ferroptosis has significant translational research
potential for the occurrence, development and clinical treatment of
several types of malignant tumors (15,16).
A previous study showed that tagitinin C could induce ferroptosis
via the protein kinase RNA-like ER kinase/nuclear factor-erythroid
2-related factor 2/heme oxygenase-1 signaling pathway in CC cells,
ultimately suppressing CC growth (17). N-acetyltransferase 10 could promote
colon cancer progression via inhibiting ferroptosis through
N4-acetylation and stabilization of ferroptosis suppressor protein
1 mRNA (18). Therefore, inducing
ferroptosis in tumor cells could be considered as a novel strategy
for the clinical treatment of malignant tumors. In the current
study, MITD1 silencing promoted ferroptosis in CC cells. Consistent
with the above results, a previous study revealed that MITD1
knockdown could induce ferroptosis and inhibit tumor growth and
migration via the TAZ/SLC7A11 signaling pathway in clear cell renal
cell carcinoma (8).
In the present study, the ENCORI database was used
to predict the potential interaction between the RNA binding
protein SRSF1 and MITD1. In addition, the regulatory interaction
between SRSF1 and MITD1 in CC cells was verified by relevant
experiments. A previous study showed that SRSF1 could prevent DNA
damage and promote colon cancer via regulating DBF4B pre-mRNA
splicing (19). LncRNA AGAP2-AS1
targeted the miR-4668-3p/SRSF1 axis to exacerbate CC cell
proliferation, migration, invasion and EMT (20). Another study also showed that
propofol could downregulate circular RNA PABPN1, upregulate miR-638
or downregulate SRSF1 in a dose-dependent manner to inhibit the
development of CC (21). In the
current study, SRSF1 expression was aberrantly increased in CC
cells. Therefore, it was hypothesized that SRSF1 could be involved
in cell viability, migration and invasion via activating MITD1
expression. Another study demonstrated that LINC01564 could promote
the resistance of glioma cells to temozolomide via binding with
SRSF1. Additionally, LINC01564 promoted the mRNA stability of
mitogen-activated protein kinase 8 (MAPK8) via recruiting SRSF1,
thus promoting the MAPK8/nuclear factor (erythroid derived 2) like
2 phosphorylation and inhibiting ferroptosis in glioma cells.
Overall, the study suggested that LINC01564 and SRSF1 could inhibit
ferroptosis in glioma cells (22).
In the present study, SRSF1 overexpression reversed the activation
of ferroptosis in CC cells following MITD1 knockdown.
A previous study showed that MITD1 knockdown
inhibited the TAZ/SLC7A11 pathway and induced ferroptosis, while
TAZ could block the inhibition of p53 and enhance cancer cell
proliferation (8,23). In addition, shank-associated RH
domain interactor promoted the proliferation of bile duct carcinoma
cells and inhibited ferroptosis via p53/SLC7A11/GPX4 signaling
(24). By interacting with SRSF1,
lncRNA-626 could inactivate the p53 pathway to exert its oncogenic
activity in gastric cancer (25).
Therefore, it was reasonable to hypothesize that MITD1 regulated by
SRSF1 could affect the growth of CC via p53/SLC7A11/GPX4 signaling.
The present study showed that MITD1 silencing in CC cells could
promote the activation of p53 and p21 expression and members of the
p53/SLC7A11/GPX4 signaling pathway and downregulate SLC7A11 and
GPX4. The expression levels of the p53/SLC7A11/GPX4-related
proteins were further reversed by SRSF1 overexpression. These
results indicated that SRSF1 could regulate MITD1 and affect CC
progression and ferroptosis and this process may be achieved by
modifying the regulation of p53/SLC7A11/GPX4 signaling. Future
experiments will further explore the regulatory mechanism by adding
p53/SLC7A11/GPX4 pathway activators or pathway inhibitors.
Overall, the results of the present study suggested
that SRSF1-regulated MITD1 could affect the progression and
ferroptosis in CC, which may be via the p53/SLC7A11/GPX4 signaling
pathway.
Acknowledgements
Not applicable.
Funding
Funding: The present study was supported by the Wenling City
social development science and technology project (grant no.
2022S00155).
Availability of data and materials
The datasets generated and/or analyzed during the
present study are available from the corresponding author on
reasonable request.
Authors' contributions
YM, YH and JZ wrote the manuscript and analyzed the
data. YaL, YiL, RJ and QZ performed the experiments and supervised
the study. YM searched the literature, and revised the manuscript
for important intellectual content. YH and YM confirmed the
authenticity of all the raw data. All authors have read and
approved the final manuscript.
Ethics approval and consent to
participate
All experimental procedures were approved by the
Wenling First People’s Hospital (Zhejiang, China; approval no.
KY-2023-2005-01) and all patients provided written informed consent
to participate.
Patient consent for publication
Not applicable.
Competing interests
The authors declare that they have no competing
interests.
References
|
1
|
Keum N and Giovannucci E: Global burden of
colorectal cancer: Emerging trends, risk factors and prevention
strategies. Nat Rev Gastroenterol Hepatol. 16:713–732.
2019.PubMed/NCBI View Article : Google Scholar
|
|
2
|
Xia C, Dong X, Li H, Cao M, Sun D, He S,
Yang F, Yan X, Zhang S, Li N and Chen W: Cancer statistics in China
and United States, 2022: Profiles, trends, and determinants. Chin
Med J (Engl). 135:584–590. 2022.PubMed/NCBI View Article : Google Scholar
|
|
3
|
Dekker E, Tanis PJ, Vleugels JLA, Kasi PM
and Wallace MB: Colorectal cancer. Lancet. 394:1467–1480.
2019.PubMed/NCBI View Article : Google Scholar
|
|
4
|
Cayrol C and Girard JP: Interleukin-33
(IL-33): A nuclear cytokine from the IL-1 family. Immunol Rev.
281:154–168. 2018.PubMed/NCBI View Article : Google Scholar
|
|
5
|
Lee S, Chang J, Renvoisé B, Tipirneni A,
Yang S and Blackstone C: MITD1 is recruited to midbodies by
ESCRT-III and participates in cytokinesis. Mol Biol Cell.
23:4347–4361. 2012.PubMed/NCBI View Article : Google Scholar
|
|
6
|
Shen H, Wang Z, Ren S, Wang W, Duan L, Zhu
D, Zhang C and Duan Y: Prognostic biomarker MITD1 and its
correlation with immune infiltrates in hepatocellular carcinoma
(HCC). Int Immunopharmacol. 81(106222)2020.PubMed/NCBI View Article : Google Scholar
|
|
7
|
Duan C: LncRNA SLC16A1-AS1 contributes to
the progression of hepatocellular carcinoma cells by modulating
miR-411/MITD1 axis. J Clin Lab Anal. 36(e24344)2022.PubMed/NCBI View Article : Google Scholar
|
|
8
|
Zhang Y, Li Y, Qiu Q, Chen Z, Du Y and Liu
X: MITD1 deficiency suppresses clear cell renal cell carcinoma
growth and migration by inducing ferroptosis through the
TAZ/SLC7A11 pathway. Oxid Med Cell Longev.
2022(7560569)2022.PubMed/NCBI View Article : Google Scholar
|
|
9
|
Li JH, Liu S, Zhou H, Qu LH and Yang JH:
starBase v2.0: Decoding miRNA-ceRNA, miRNA-ncRNA and protein-RNA
interaction networks from large-scale CLIP-Seq data. Nucleic Acids
Res. 42:D92–D97. 2014.PubMed/NCBI View Article : Google Scholar
|
|
10
|
Li C, Tang Z, Zhang W, Ye Z and Liu F:
GEPIA2021: Integrating multiple deconvolution-based analysis into
GEPIA. Nucleic Acids Res. 49:W242–W246. 2021.PubMed/NCBI View Article : Google Scholar
|
|
11
|
Livak KJ and Schmittgen TD: Analysis of
relative gene expression data using real-time quantitative PCR and
the 2(-Delta Delta C(T)) method. Methods. 25:402–408.
2001.PubMed/NCBI View Article : Google Scholar
|
|
12
|
Health Commission Of The People's Republic
Of China N. National guidelines for diagnosis and treatment of
colorectal cancer 2020 in China (English version). Chin J Cancer
Res. 32:415–445. 2020.PubMed/NCBI View Article : Google Scholar
|
|
13
|
Chen C and Sheng Y: Prognostic impact of
MITD1 and associates with immune infiltration in kidney renal clear
cell carcinoma. Technol Cancer Res Treat.
20(15330338211036233)2021.PubMed/NCBI View Article : Google Scholar
|
|
14
|
Chen Y, Xu T, Xie F, Wang L, Liang Z, Li
D, Liang Y, Zhao K, Qi X, Yang X and Jiao W: Evaluating the
biological functions of the prognostic genes identified by the
pathology atlas in bladder cancer. Oncol Rep. 45:191–201.
2021.PubMed/NCBI View Article : Google Scholar
|
|
15
|
Kong N, Chen X, Feng J, Duan T, Liu S, Sun
X, Chen P, Pan T, Yan L, Jin T, et al: Baicalin induces ferroptosis
in bladder cancer cells by downregulating FTH1. Acta Pharm Sin B.
11:4045–4054. 2021.PubMed/NCBI View Article : Google Scholar
|
|
16
|
Liang Y, Zhang L, Peng C, Zhang S, Chen S,
Qian X, Luo W, Dan Q, Ren Y, Li Y and Zhao B: Tumor
microenvironments self-activated nanoscale metal-organic frameworks
for ferroptosis based cancer chemodynamic/photothermal/chemo
therapy. Acta Pharm Sin B. 11:3231–3243. 2021.PubMed/NCBI View Article : Google Scholar
|
|
17
|
Wei R, Zhao Y, Wang J, Yang X, Li S, Wang
Y, Yang X, Fei J, Hao X, Zhao Y, et al: Tagitinin C induces
ferroptosis through PERK-Nrf2-HO-1 signaling pathway in colorectal
cancer cells. Int J Biol Sci. 17:2703–2717. 2021.PubMed/NCBI View Article : Google Scholar
|
|
18
|
Zheng X, Wang Q, Zhou Y, Zhang D, Geng Y,
Hu W, Wu C, Shi Y and Jiang J: N-acetyltransferase 10 promotes
colon cancer progression by inhibiting ferroptosis through
N4-acetylation and stabilization of ferroptosis suppressor protein
1 (FSP1) mRNA. Cancer Commun (Lond). 42:1347–1366. 2022.PubMed/NCBI View Article : Google Scholar
|
|
19
|
Chen L, Luo C, Shen L, Liu Y, Wang Q,
Zhang C, Guo R, Zhang Y, Xie Z, Wei N, et al: SRSF1 prevents DNA
damage and promotes tumorigenesis through regulation of DBF4B
Pre-mRNA splicing. Cell Rep. 21:3406–3413. 2017.PubMed/NCBI View Article : Google Scholar
|
|
20
|
Li H, Guo S, Zhang M, Li L, Wang F and
Song B: Long non-coding RNA AGAP2-AS1 accelerates cell
proliferation, migration, invasion and the EMT process in
colorectal cancer via regulating the miR-4,668-3p/SRSF1 axis. J
Gene Med. 22(e3250)2020.PubMed/NCBI View
Article : Google Scholar
|
|
21
|
Zhao A and Liu Y: Propofol suppresses
colorectal cancer development by the circ-PABPN1/miR-638/SRSF1
axis. Anal Biochem. 631(114354)2021.PubMed/NCBI View Article : Google Scholar
|
|
22
|
Luo C, Nie C, Zeng Y, Qian K, Li X and
Wang X: LINC01564 promotes the TMZ resistance of glioma cells by
upregulating NFE2L2 expression to inhibit ferroptosis. Mol
Neurobiol. 59:3829–3844. 2022.PubMed/NCBI View Article : Google Scholar
|
|
23
|
Miyajima C, Hayakawa Y, Inoue Y, Nagasaka
M and Hayashi H: HMG-CoA reductase inhibitor statins activate the
transcriptional activity of p53 by regulating the expression of
TAZ. Pharmaceuticals (Basel). 15(1015)2022.PubMed/NCBI View Article : Google Scholar
|
|
24
|
Zeng C, Lin J, Zhang K, Ou H, Shen K, Liu
Q, Wei Z, Dong X, Zeng X, Zeng L, et al: SHARPIN promotes cell
proliferation of cholangiocarcinoma and inhibits ferroptosis via
p53/SLC7A11/GPX4 signaling. Cancer Sci. 113:3766–3775.
2022.PubMed/NCBI View Article : Google Scholar
|
|
25
|
Wu ZH, Liu CC, Zhou YQ, Hu LN and Guo WJ:
OnclncRNA-626 promotes malignancy of gastric cancer via inactivated
the p53 pathway through interacting with SRSF1. Am J Cancer Res.
9:2249–2263. 2019.PubMed/NCBI
|