Introduction
Type 2 diabetes mellitus (DM) is characterized by an
increase in glucose levels or hyperglycemia due to pancreatic cell
dysfunction and insulin resistance (1,2).
In 2011, the prevalence of DM in Koreans aged 20–79 years was 7.5%
(adjusted to world population). The prevalence is estimated to
increase to 8.7% by 2030 (3).
Since DM is a multifactorial disease influenced by genetic as well
as environmental risk factors (4), the exact etiology of DM remains
elusive (5,6). Furthermore, the rate of progression
varies markedly between individuals (7) and little is known about the mode of
onset. It is important to understand the mechanisms or biomarkers
that are associated with the rapid progression of diabetes.
Delaying the onset of DM may specifically improve therapies and
understanding the characteristics of those who progress slowly may
aid in the management of patients with DM (8).
Recent technologies, including high-resolution
metabolomics (HRM), have enabled the discovery of potential
biomarkers that may be beneficial for the diagnosis, management and
treatment of various diseases (9–11).
HRM generates comprehensive metabolic profiles by simultaneously
measuring thousands of low-molecular weight metabolites in
biological fluids, cells and tissues associated with certain
diseases (12–14). The sensitivity and selectivity of
HRM are best suited to the analysis of highly complex metabolite
mixtures, such as biological extracts. HRM may also be used for the
identification of potentially affected metabolites and pathways
with the aid of the metabolite databases and in human metabolic
pathway analyses, such as the Kyoto Encyclopedia of Genes and
Genomes (KEGG) (15).
Metabolic profiling allows for the exploration of
different types of metabolites that may be affected by the
progression or development of diabetes (16). Various metabolites have been
correlated with insulin resistance and diabetes prediction in
studies that mainly focused on a general comparison of control and
case groups of DM during follow-up (17–21). A recent study from India reported
that 45.1% of subjects with normal glucose tolerance developed
dysglycemia. Various predictors of progression included advancing
age, family history of diabetes and cholesterol levels (22). Thus, when performing metabolomics
analyses, differences in the onset of DM among subjects must be
taken into account, and an inter-patient variability in the
affected metabolites is likely. The present study used HRM to
detect low-molecular weight metabolites by comparing samples
collected from subjects who subsequently developed DM. The aim was
to identify factors associated with the mode of onset of DM even
prior to the development of symptoms.
Materials and methods
Materials
Liquid chromatography-mass spectrometry (LC-MS)
grade water (Tedia, Fairfield, OH, USA), acetonitrile (Burdick
& Jackson, Muskegon, MI, USA) and formic acid (Fluka, St.
Louis, MO, USA) were used as the mobile phase. For quality control,
three isotopes were used: Caffeine (3-methyl-13C),
L-methionine (13C5, 15N) and
N,N-diethyl-M-toluamide (Cambridge Isotope Laboratories, Inc.,
Tewksbury, MA, USA).
Human participants
This pilot study was reviewed and approved by the
Korea University Institutional Review Board (Sejong City, Korea)
and conformed to the board's ethical guidelines (no.
KU-IRB-15-19-A-1). Written informed consent was obtained from all
participants. The subjects were from the Korean Cancer Prevention
Study (KCPS-II Biobank), a pool of 159,844 participants who
voluntarily underwent private health examinations and had provided
informed consent in one of 11 centers located in Seoul and Gyeonggi
provinces in South Korea from 2004 to 2013. Among all participants
(age, 30–60 years) were selected. Those with missing data on
essential or metabolic syndrome-associated variables were
excluded.
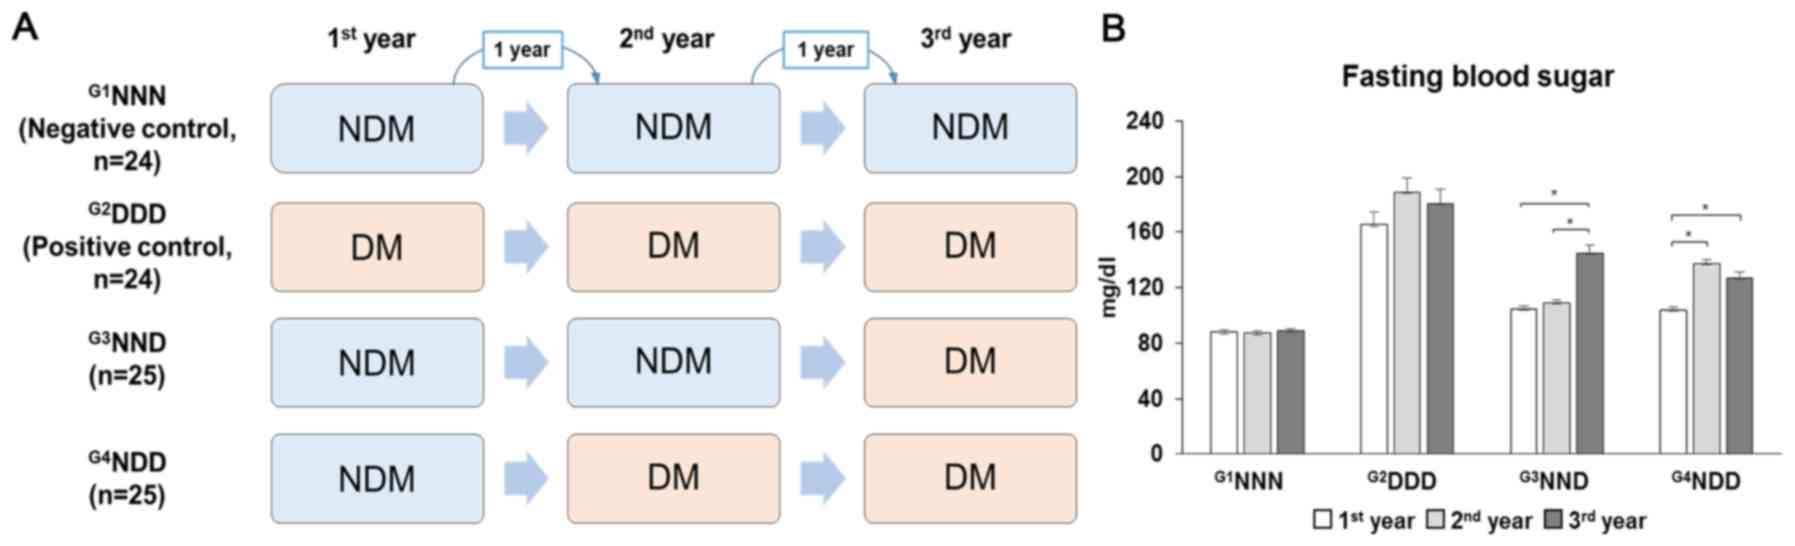
The included participants with or without type 2 DM
were classified into four groups based on fasting blood sugar
levels, with serum samples collected in a span of 3 years.
G1NNN was the negative control group comprising
non-diabetic (NDM) patients for the 3-year cohort study.
G2DDD represented the positive control group comprising
individuals who already had DM at the start of the study.
G3NND represented patients who developed DM in the third
year and G4NDD represented patients who developed DM in
the second year (Fig. 1A). Type 2
DM was defined as fasting blood sugar levels of >125 mg/dl
(Fig. 1B). The subjects' full
demographics in the first year (baseline) are provided in Table I. Measurements of the body mass
index (BMI) and fasting blood sugar were performed by utilizing
COBAS INTEGRA 800 and 7600 Analyzers (Hitachi, Tokyo, Japan)
(23). Data were analyzed for
significance using SPSS® 24 statistical software (IBM
Corp., Armonk, NY, USA).
 | Table IDemographics of subjects during the
first year. |
Table I
Demographics of subjects during the
first year.
| Characteristic |
G1NNN
(n=24) |
G2DDD
(n=24) |
G3NND
(n=25) |
G4NDD
(n=25) |
|---|
| Sex M/F (n) | 19/5 | 20/4 | 20/5 | 22/3 |
| Age (year) | 39.29±7.33 | 45.13±7.01a | 43.36±6.43 | 44.44±7.15 |
| BMI
(kg/m2) | 24.13±2.67 | 26.41±3.56 | 25.71±2.89 | 25.18±3.12 |
| Fasting blood sugar
(mg/dl) | 87.79±10.27 |
165.42±43.26a | 104.8±11.38b | 103.76±12.7b |
| Total cholesterol
(mg/dl) | 204.88±36.09 | 210.21±35.17 | 198.12±20.7 | 194.68±31.9 |
| Triglycerides
(mg/dl) | 149.33±71.53 | 215.17±138.3 | 194.04±125.59 | 183.36±107.36 |
| High-density
lipoproteins (mg/dl) | 48.16±8.18 | 45.44±9.18 | 49.00±4.03 | 48.6±5.94 |
| Low-density
lipoproteins (mg/dl) | 128.73±37.72 | 131.37±37.57 | 114.30±22.51 | 111.86±37.22 |
| Systolic blood
pressure (mmHg) | 118.88±13.06 | 125.58±14.65 | 121.08±16.9 | 119.32±15.34 |
| Diastolic blood
pressure (mmHg) | 74.29±10.24 | 79.54±8.86 | 76.72±11.22 | 78.64±10.36 |
LC-MS
The samples (50-µl aliquots) were diluted
with 200 µl acetonitrile and centrifuged at 14,000 × g for 5
min at 4°C to remove any protein (24). The samples were then randomized
and analyzed using ultra performance LC (C18 Synchronis aQ, 1.9
µm, 100×2.1 mm; Thermo Fisher Scientific, Inc., Waltham, MA,
USA) coupled with a quantitative time-of-flight MS using a model
6550 apparatus (Agilent Technologies, Santa Clara, CA, USA). The
mobile phases were water and acetonitrile, and contained 0.1%
formic acid. LC was run using the following gradient program: 95%
water for 1 min, a linear decrease to 55% water over 8 min, a
descending gradient to 10% water over 3 min, a 1.5-min hold and
return to 95% water over 0.1 min. Detection of the mass/charge
ratio (m/z) of ions set from 50 to 1,000 with a resolution of
20,000 over 15 min, LC runs with data extraction using the apLCMS
algorithm provided a minimum of 6,000 reproducible features, with
the mass accuracy being sufficient to allow for the prediction of
the elemental composition in numerous instances.
Statistical analyses for metabolic
profiling
After processing the data using apLCMS (25), all of the features of the samples
were retrieved. The features from the LC-MS analyses were
log2 transformed and quantile normalized prior to
applying bioinformatics. Statistical analysis was performed on the
extracted data using MetaboAnalyst 3.0 (http://www.metaboanalyst.ca/) for additional
statistical tests, including principal component analysis (PCA),
orthogonal signal correction/partial least squares-discriminant
analysis (OPLS-DA), hierarchical cluster analysis (HCA) and
Manhattan plot, to specifically differentiate between the profiles
of all four categories in one analysis. Feature intensities were
first log-transformed and auto-scaled prior to the performance of
PCA and OPLS-DA with a confidence level of 95%. Statistical
analyses, which included univariate analysis, Manhattan plot and
false discovery rate adjusted P-value (FDR) (26), were performed to determine the
metabolites that were significantly different between
G3NND and G4NDD in the first year. The
metabolic profiles were differentiated using Limma 2-HCA to
distinguish between the two groups based on their metabolites
(27).
Scheme of analysis
Utilizing samples from all 3 years, all groups were
analyzed by multivariate analysis to discern metabolic differences.
The present study focused on exploring the difference in metabolic
profiles in the first year between G3NND and
G4NDD, where the two groups were initially NDM but
subsequently developed DM in the prospective cohort. Thus, a
Manhattan plot and HCA were used to examine G3NND and
G4NDD in the first year, looking for potential
discriminating metabolites concerning diabetes progression. In
addition, it was examined whether the metabolic changes were
similar in the G3NND and G4NDD groups in the
second and third year compared with those in the first year.
Annotation using METLIN and KEGG
metabolic pathway analysis
An m/z feature is defined by m/z, ion intensity and
retention time. The m/z values were annotated using the METLIN Mass
Spectrometry Database (https://metlin.scripps.edu) to identify the
metabolites (28). Annotated
features from the METLIN database are mapped on human metabolic
pathways using the KEGG database. The human metabolic pathways of
the KEGG database (http://www.genome.jp/kegg/tool/map_pathway2.html)
were used for mapping the significant features from the Manhattan
plot with an FDR of q=0.05. The matched features were displayed as
black dots in the pathway maps to determine which pathways were
affected by each case condition.
Results
Statistical and group comparison
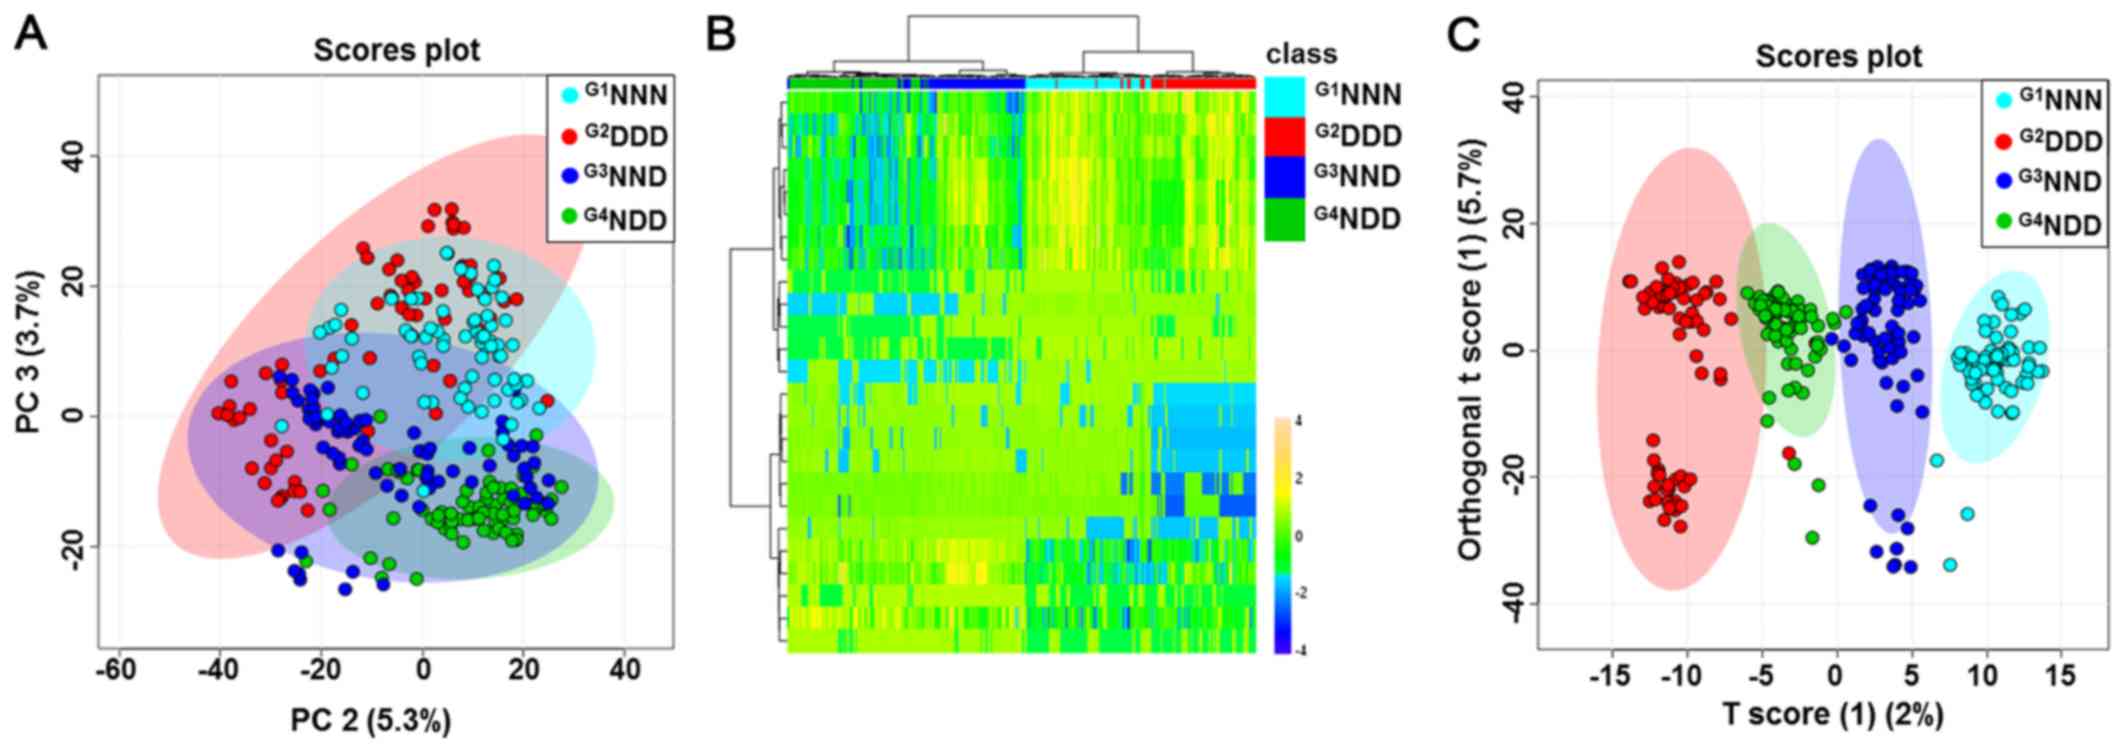
The four group categories were first analyzed using
the unsupervised, multivariate statistical PCA procedure to
determine whether any metabolic differences were present. PCA did
not provide a good separation of the four groups (Fig. 2A). HCA exhibited a tendency to
separate subjects into four groups based on auto-scaled and
log-transformed features (Fig.
2B). In addition, supervised OPLS-DA was then used to analyze
the data. As displayed in Fig.
2C, a score plot was generated to illustrate the metabolic
differences throughout the four stages of DM acquisition. This
OPLS-DA model demonstrated a clear separation of groups with an
R2 value of goodness of fit of 0.956 and a Q2
value of predictive ability of the model of 0.835. A clear
separation was expected to be evident between G1NNN,
G2DDD, G3NND and G4NDD, indicating
that groups could be distinguished based on certain serum
metabolites in their metabolic profiles. Further analyses focused
on the comparison between G3NND and G4NDD in
order to observe the effect of a different onset of DM on the
metabolic profile.
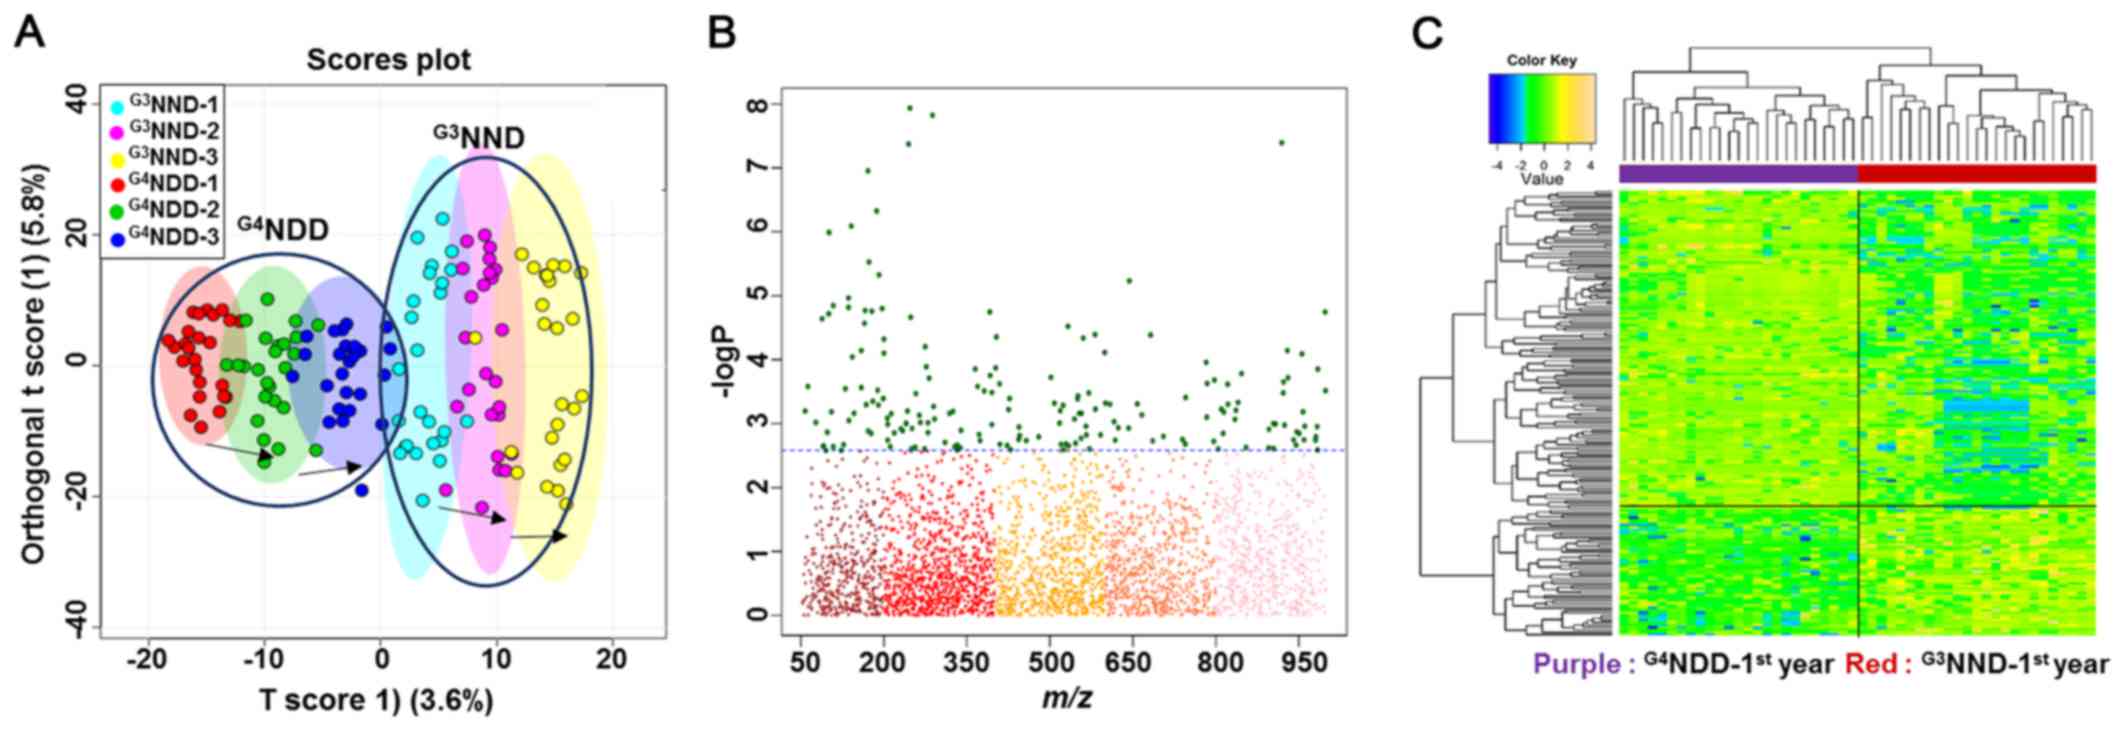
A good separation between G3NND and
G4NDD was clearly observed for each year on the OPLS-DA
score plot (Fig. 3A), indicating
that different onset times of DM caused metabolic alterations. A
subsequent examination focused only on the first year, where the
two groups had not developed DM, yet. A Manhattan plot and HCA were
used to detect significant metabolites based on which the two
groups could be distinguished.
The comparison was significantly different with an
FDR of q=0.05. The FDR is a multiple testing correction applied in
a statistical comparison to decrease the occurrences of false
positives. The plot provides a visual presentation of the
statistical test result with the application of multiple testing
corrections. The x-axis displays the m/z values with a range of
50-1,000, while the y-axis displays the −logP values. The FDR
criteria were indicated by the dashed lines. Features above the
line (green dots) are considered to be significant between each of
the two-way comparisons (samples and metabolites in HCA). Among a
total of 3,462 features, the two-way comparison between the first
year of G3NND and G4NDD revealed 183 to be
statistically significant (Fig.
3B).
A two-way HCA of the comparisons' significant
features indicated a clear separation of one group from the other,
as displayed by the upper bar (Fig.
3C). The top label indicates the separation distance among
samples and the left-hand labels indicate the clustering among
metabolites, which statistically differentiated between the two
groups.
The significant features were annotated using the
METLIN database and mapped on the KEGG human metabolic pathways.
Upon mapping the 183 significant features, 34 were matched to human
metabolic pathways. Among the possible affected pathways, the two
of greatest interest were the primary bile acid biosynthesis and
steroid biosynthesis metabolism pathways (data not shown).
Additional analyses for the second and third year of
G3NND and G4NDD were performed to observe the
profiles of the significant metabolites. Among the 183 significant
features in the first year, 80 features remained significant in the
second year and 90 features were significant in the third year.
Identification of potential biomarkers to
distinguish between G3NND and G4NDD
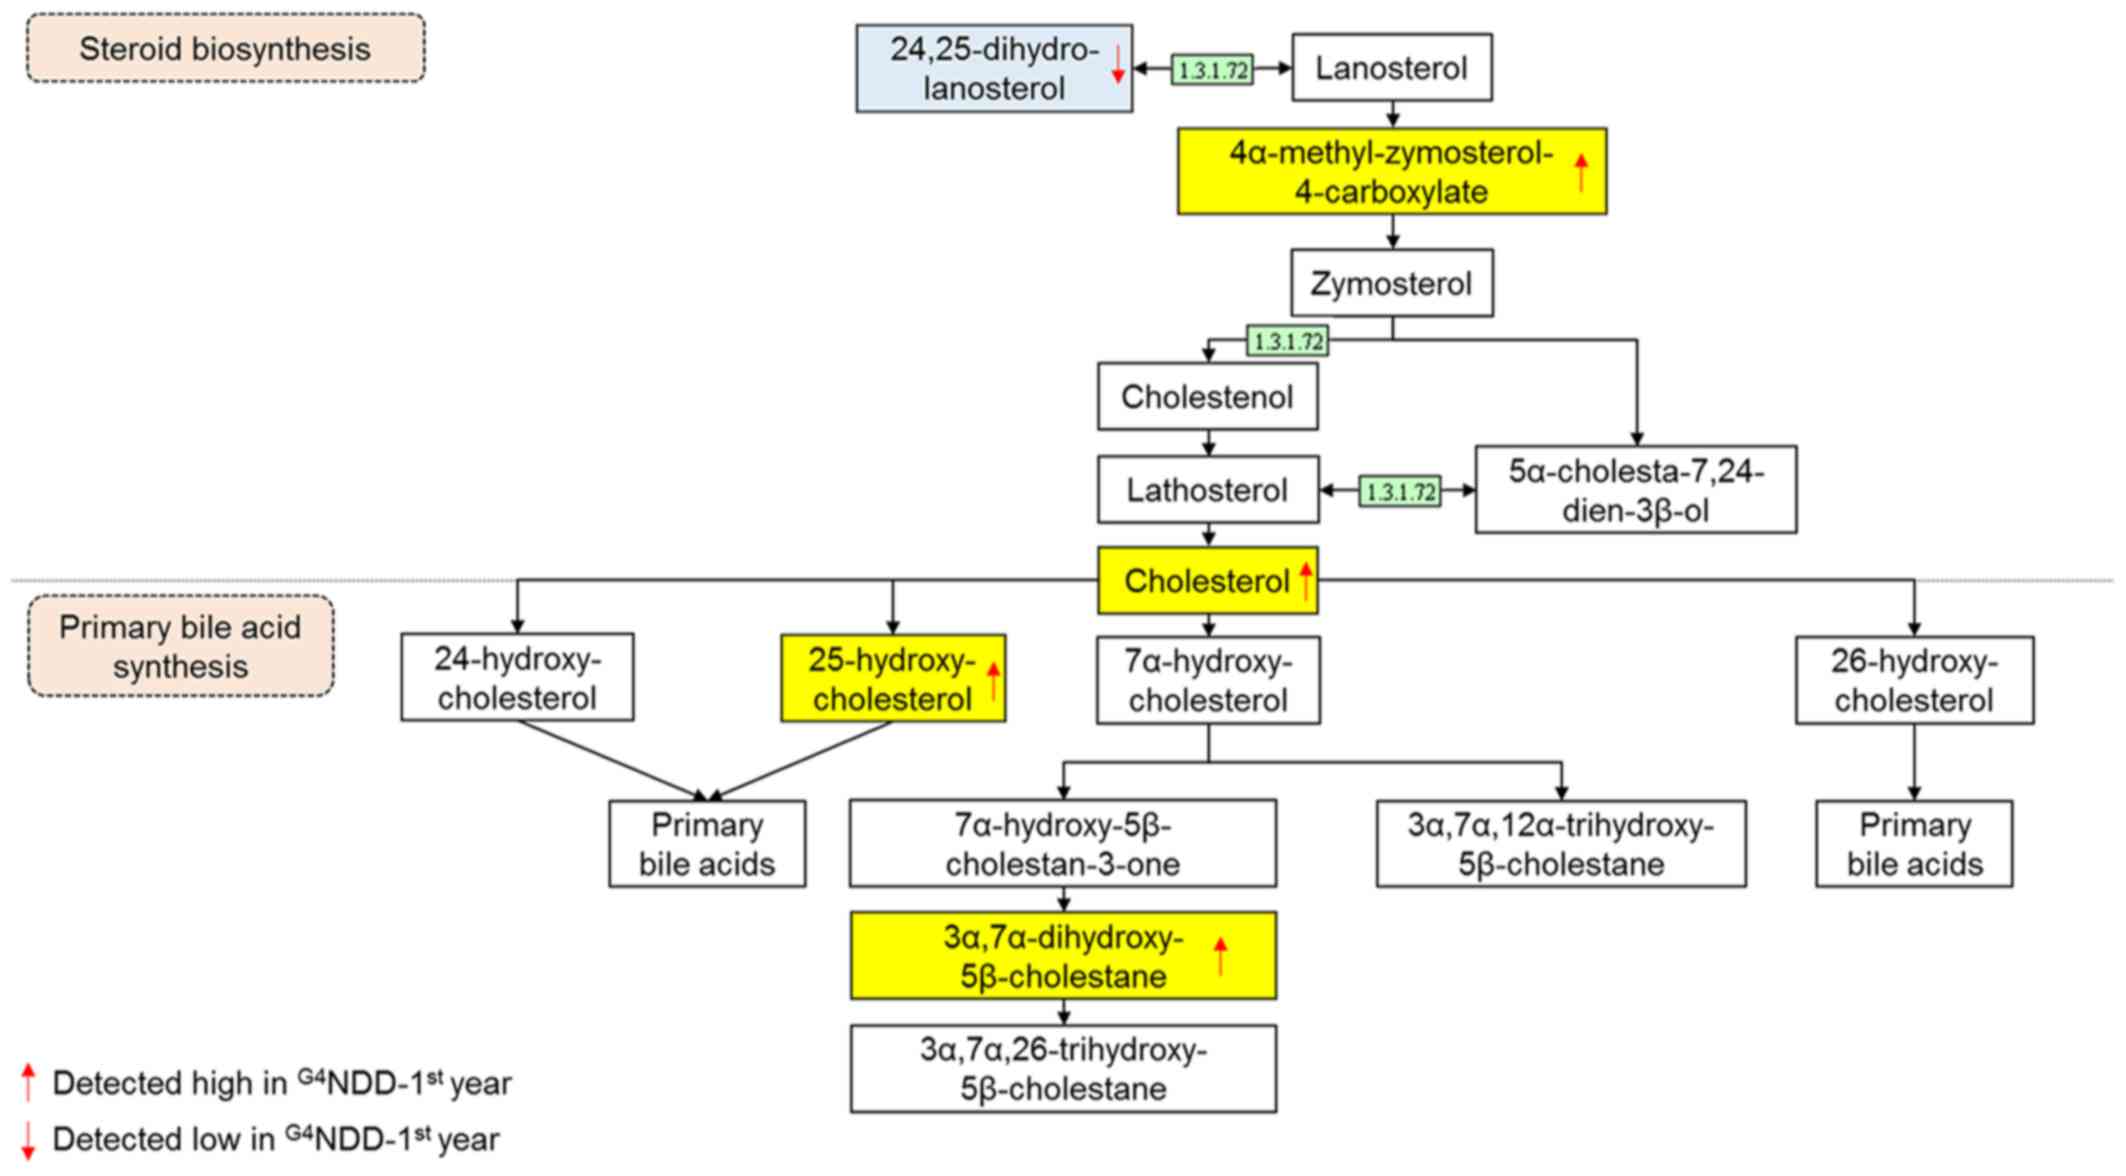
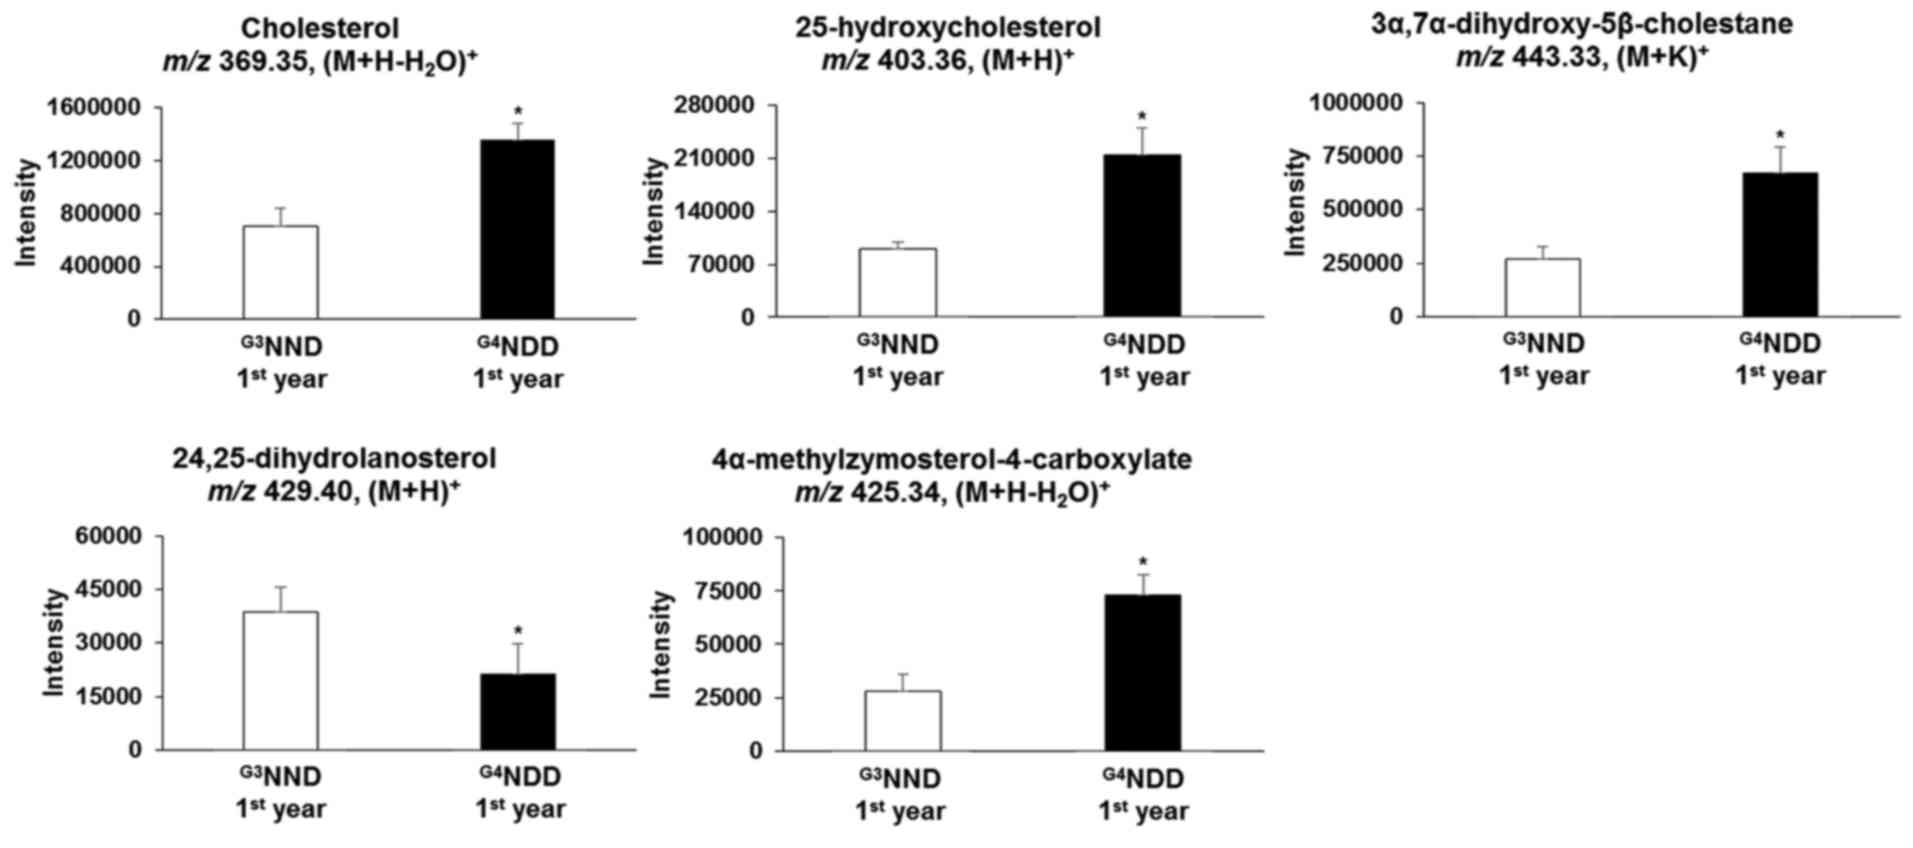
Endogenous compounds were identified and annotated
from the affected pathways (Table
II). From the primary bile acid biosynthesis pathway,
cholesterol, 25-hydroxycholesterol and
3α,7α-dihydroxy-5β-cholestane in the G3NND-first year
group were significantly different (P<0.05) from those of the
G4NDD-first year group, even though patients in the two
groups were NDM at the time. Similarly, in the steroid biosynthesis
pathway, cholesterol, 24,25-dihydrolanosterol and
4α-methylzymosterol-4-carboxylate were significantly altered in the
G3NND-first year group compared with those in the
G4NDD-first year group prior to development of DM
(P<0.05) (Figs. 4 and 5). These results indicated that only
cholesterol [m/z 369.35, (M+H-H2O)+] affected
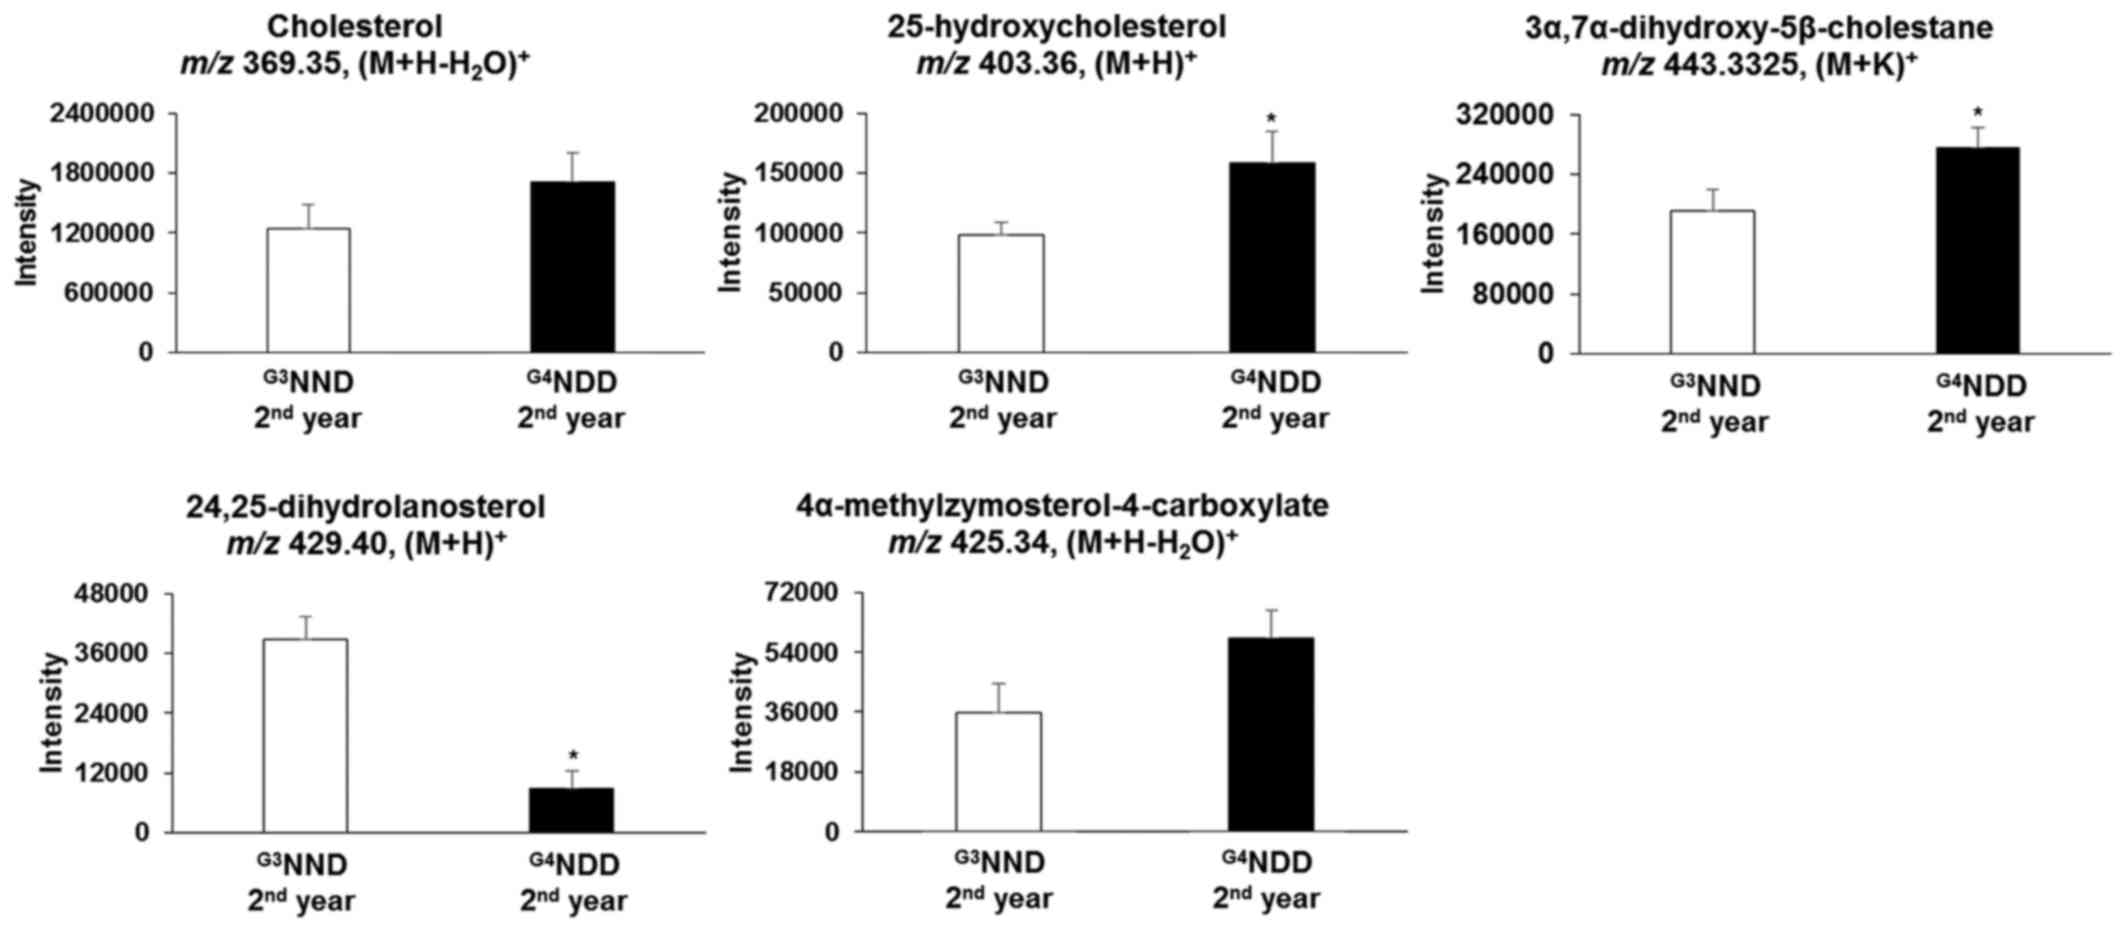
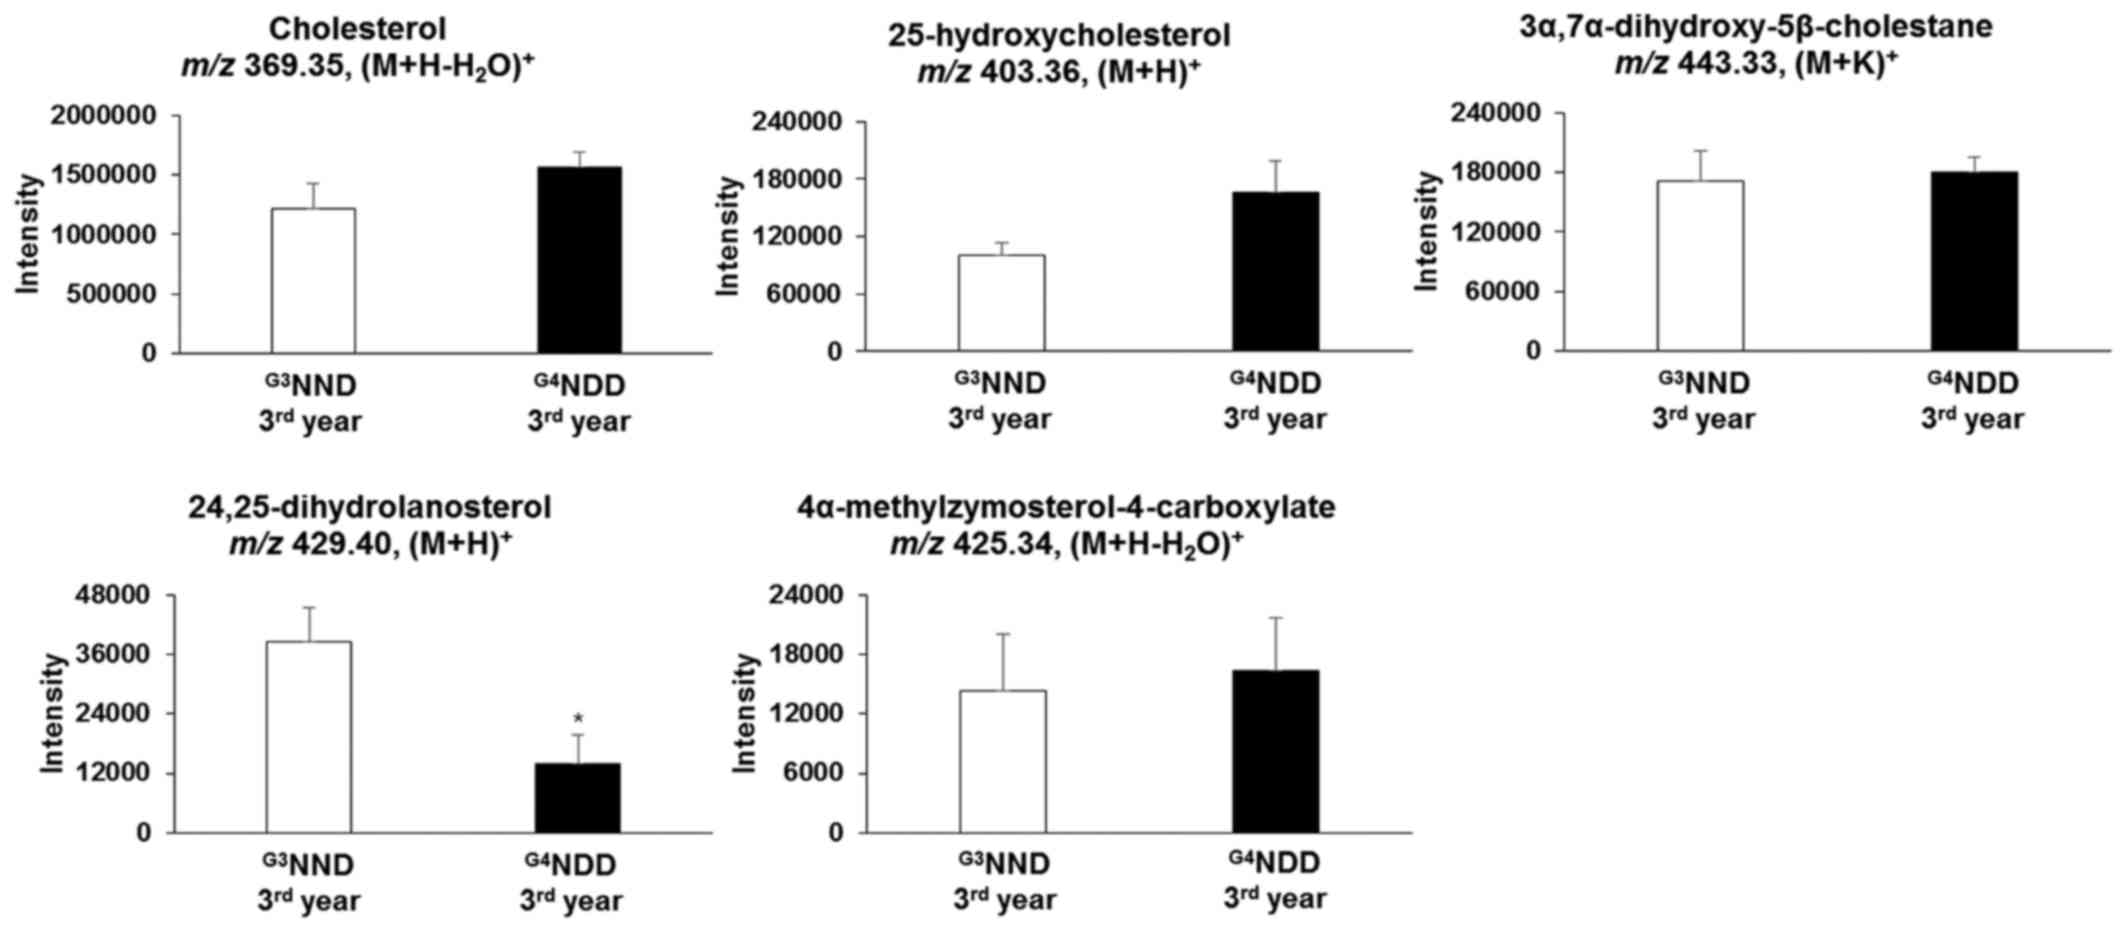
the two pathways. However, when NDM progressed to DM, cholesterol
and 4α-methylzymosterol-4-carboxylate [m/z 425.34,
(M+H-H2O)+] were not significantly different
in the second and third year (P<0.05). In the second year,
25-hydroxycholesterol [m/z 403.36, (M+H)+] and
3α,7α-dihydroxy-5β-cholestane [m/z 443.33, (M+K)+] were
still significantly altered (P<0.05). 24,25-Dihydrolanosterol
[m/z 429.40, (M+H)+] was significantly decreased
(P<0.05) throughout the 3-year time course (first, second and
third year) (Figs. 6 and 7).
| Table IISignificant compounds associated with
the two affected pathways. |
Table II
Significant compounds associated with
the two affected pathways.
|
Pathway/compound | m/z | Adduct | P-value |
|---|
| Primary bile acid
biosynthesis | | | |
| Cholesterol | 369.3507 |
(M+H-H2O)+ |
2.62×10⁻⁴ |
|
25-Hydroxycholesterol | 403.3593 |
(M+H)+ |
4.40×10⁻⁵ |
|
3α,7α-Dihydroxy-5β-cholestane | 443.3325 |
(M+K)+ |
1.77×10⁻³ |
| Steroid
biosynthesis | | | |
| Cholesterol | 369.3507 |
(M+H-H2O)+2 |
2.62×10⁻⁴ |
|
24,25-Dihydrolanosterol | 429.4042 |
(M+H)+ |
2.57×10⁻³ |
|
4α-Methylzymosterol-4-carboxylate | 425.3428 |
(M+H-H2O)+2 |
6.08×10⁻⁴ |
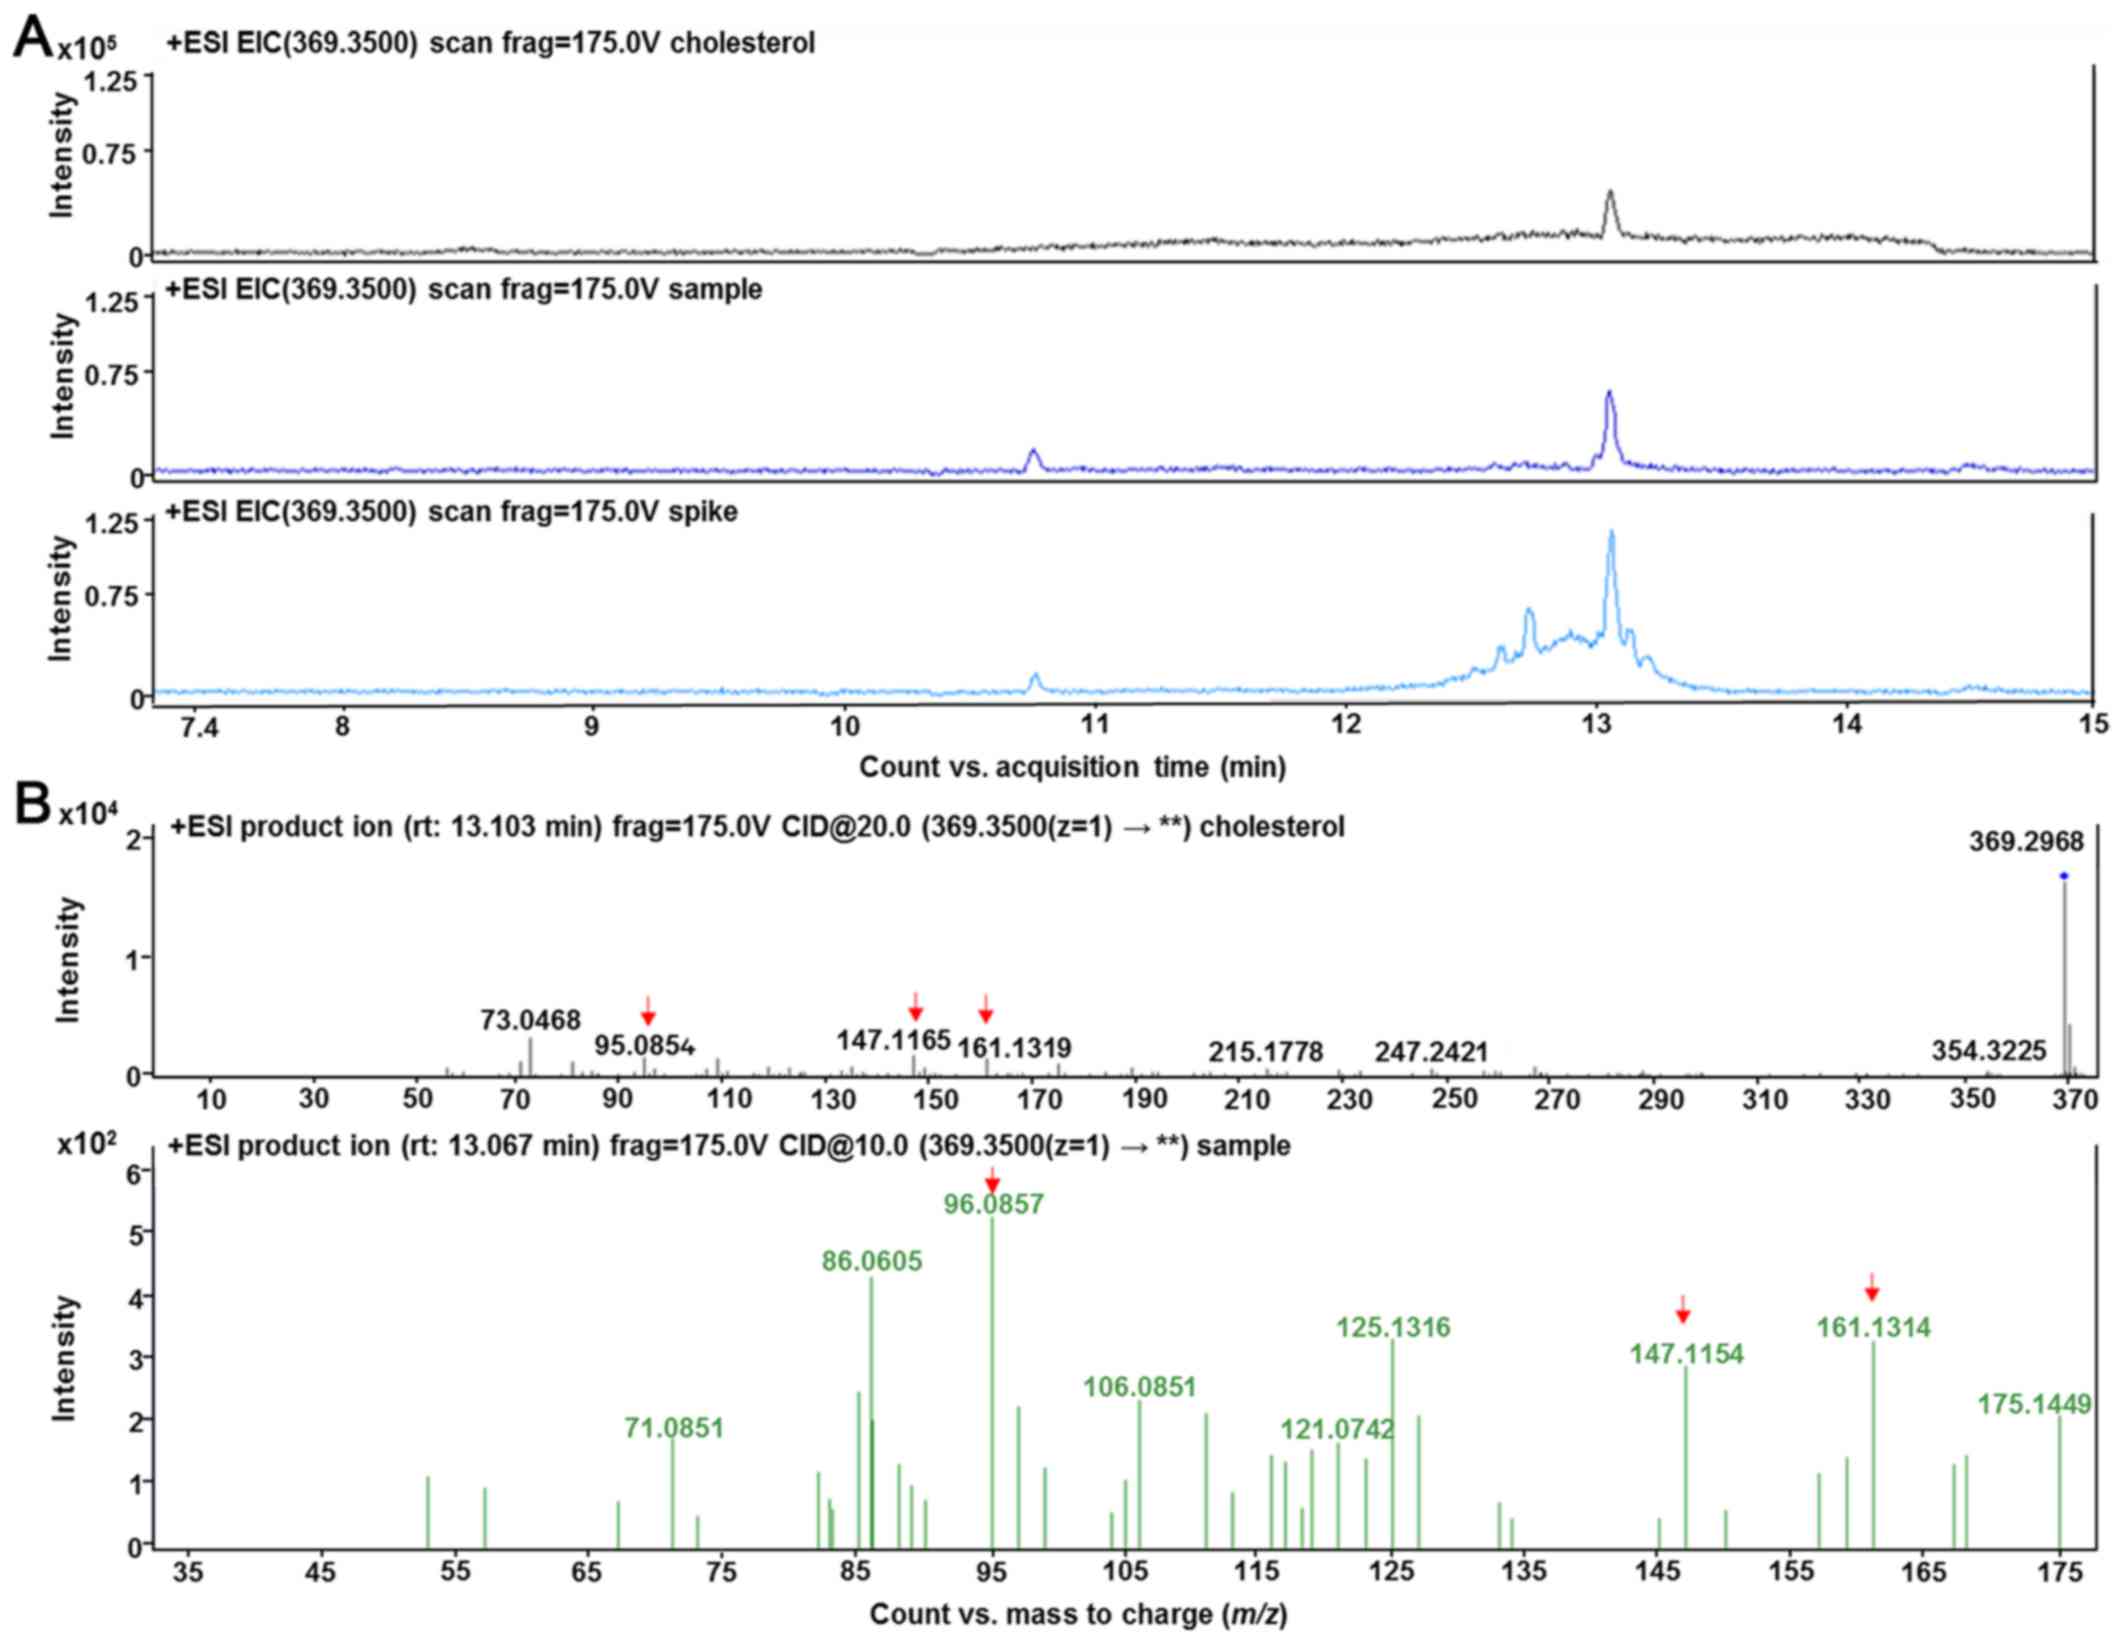
Validation of cholesterol was performed by selected
reaction monitoring by detecting specific precursor-product ion
transition using tandem MS mode and comparing the fragmentation
pattern to its chemical standard, when available. Cholesterol ion
fragmentation was detected: m/z 369.35 → m/z 147.11, m/z 161.13 and
m/z 95.08 (Fig. 8).
Discussion
The present study explored metabolic profiling by
comparing the mode of onset of type 2 DM in a 3-year prospective
cohort study. The results indicated the dysregulation of certain
pathways and metabolites prior to the development of DM. The
baseline value of fasting blood sugar in the G3NND-first
year and G4NDD-first year groups indicated that the
values in subjects who had not yet developed DM were significantly
different from those who had diabetes in the G2DDD
group. In addition, five m/z values, which were mainly assigned to
sterol compounds, exhibited statistical significance regarding the
mode of onset (P<0.05).
The results indicate that the primary bile acid
biosynthesis pathway was affected by the time of onset of DM (1 or
2 years prior to DM). Certain metabolites of the primary bile acid
pathway tended to be higher in the G4NDD group-first
year compared with those in the G3NND group-first year,
such that 25-hydroxycholesterol and 3α,7α-dihydroxy-5β-cholestane
were elevated. This was in agreement with other studies reporting
that bile acid synthesis was stimulated in association with DM,
obesity and insulin signaling (29–31). The intensity of cholesterol, which
is the precursor of bile acid biosynthesis, was elevated.
Cholesterol is a fundamental raw material for the
cell. It acts as the building block for the cell membrane and other
organelles (32). It serves as a
precursor of numerous biosynthetic processes in human metabolic
pathways, including steroid hormone and bile acid biosynthesis
(33). Fig. 4 (adapted from the KEGG database)
depicts the central function of cholesterol as a bridge connecting
the two pathways.
In the present study, cholesterol was significantly
higher in the G4NDD group-first year, in comparison with
that in the G3NND group-first year (P<0.05). This
result indicated that cholesterol biosynthesis is modulated by DM
progression. Fig. 4 presents part
of the steroid biosynthesis pathway involving the generation of
cholesterol, which stimulates primary bile acid synthesis in the
G4NDD group-first year. In the present study,
cholesterol production in the G4NDD group tended to be
higher than that in the G3NND group, and the metabolite
4α-methylzymosterol-4-carboxylate was also elevated in the first
year. In addition, 24,25-dihydrolanosterol was lower, explaining
for the boost in cholesterol production. Of note, differences in
this metabolite were significant in the first, second and third
years (P<0.05).
This upregulated downstream effect of cholesterol
production may be due to the activity of one enzyme, δ24-sterol
reductase (enzyme ID 1.3.1.72, also known as 24-dehydrocholesterol
reductase). This enzyme participates in numerous processes and is
regulated by the DHCR24 gene (34,35). This gene may be linked to diabetes
progression. Berisha et al (36) indicated that DHCR24 is one of the
transcripts affected by bariatric surgery in obese DM patients,
with enzyme activity being correlated with changes of body weight,
fasting plasma glucose and glycosylated hemoglobin content.
Although focusing on endometrial carcinoma, another study revealed
that the enzyme encoded by DHCR24 was induced by insulin
stimulation via signal transducer and activator of transcription 3,
which sensitizes to insulin signaling (37,38). This mechanism is possibly
associated with the pathology of diabetes due to its link with
hyperinsulinemia (39,40). Thus, these results indicated that
the dysregulation of the metabolism, at the genomics to
metabolomics level, had started to develop one year prior to the
onset of DM. Cholesterol detected in the present LC-MS analysis was
different from that determined by routine biochemical analysis,
since the latter was the total cholesterol value comprising
triglyceride, low-density lipoprotein (LDL) and high-density
lipoprotein (HDL) values. In addition, the adduct of cholesterol,
(M+H-H2O)+, had an m/z of 369.35 in the
present study, while lipoproteins of LDL and HDL containing
cholesterol have different m/z values (41).
The present study aimed to utilize HRM to further
assess the mode of onset of DM. Primary bile acid biosynthesis and
steroid biosynthesis metabolism, which focus on cholesterol
biosynthesis, have important roles in different modes prior to the
onset of DM. A future study on a larger population should be
performed to validate the clinical value of the present
results.
Acknowledgments
The authors would like to thank Dr Karan Uppal from
Emory University School of Medicine (Atlanta, GA, USA) for
providing the R-package to run the Metabolomics Wide Association
Study. ADP gratefully acknowledges the Indonesia Endowment Fund for
Education (grant no. A-3468/LPDP.3/2015) for the financial support
of his master degree program. This study was supported by the Korea
Health Industry Development Institute (grant no. HI14C2686) and the
National Foundation of Korea (grant nos. NRF-2017R1A2B4003890 and
NRF-2017M3A9F1031229).
References
|
1
|
American Diabetes Association: Diagnosis
and classification of diabetes mellitus. Diabetes Care. 28(Suppl
1): S37–S42. 2005. View Article : Google Scholar
|
|
2
|
Flier JS, Underhill LH, Polonsky KS,
Sturis J and Bell GI: Non-insulin-dependent diabetes mellitus-A
genetically programmed failure of the beta cell to compensate for
insulin resistance. N Engl J Med. 334:777–783. 1996. View Article : Google Scholar
|
|
3
|
Whiting DR, Guariguata L, Weil C and Shaw
J: IDF diabetes atlas: Global estimates of the prevalence of
diabetes for 2011 and 2030. Diabetes Res Clin Pract. 94:311–321.
2011. View Article : Google Scholar : PubMed/NCBI
|
|
4
|
Ling C and Groop L: Epigenetics: A
molecular link between environmental factors and type 2 diabetes.
Diabetes. 58:2718–2725. 2009. View Article : Google Scholar : PubMed/NCBI
|
|
5
|
Mahajan A, Go MJ, Zhang W, Below JE,
Gaulton KJ, Ferreira T, Horikoshi M, Johnson AD, Ng MC, Prokopenko
I, et al DIAbetes Genetics Replication And Meta-analysis (DIAGRAM)
Consortium; Asian Genetic Epidemiology Network Type 2 Diabetes
(AGEN-T2D) Consortium; South Asian Type 2 Diabetes (SAT2D)
Consortium; Mexican American Type 2 Diabetes (MAT2D) Consortium;
Type 2 Diabetes Genetic Exploration by Nex-generation sequencing in
muylti-Ethnic Samples (T2D-GENES) Consortium: Genome-wide
trans-ancestry meta-analysis provides insight into the genetic
architecture of type 2 diabetes susceptibility. Nat Genet.
46:234–244. 2014. View
Article : Google Scholar : PubMed/NCBI
|
|
6
|
Voight BF, Scott LJ, Steinthorsdottir V,
Morris AP, Dina C, Welch RP, Zeggini E, Huth C, Aulchenko YS,
Thorleifsson G, et al MAGIC investigators; GIANT Consortium: Twelve
type 2 diabetes susceptibility loci identified through large-scale
association analysis. Nat Genet. 42:579–589. 2010. View Article : Google Scholar : PubMed/NCBI
|
|
7
|
Ferrannini E, Nannipieri M, Williams K,
Gonzales C, Haffner SM and Stern MP: Mode of onset of type 2
diabetes from normal or impaired glucose tolerance. Diabetes.
53:160–165. 2004. View Article : Google Scholar
|
|
8
|
Zhou K, Donnelly LA, Morris AD, Franks PW,
Jennison C, Palmer CN and Pearson ER: Clinical and genetic
determinants of progression of type 2 diabetes: A DIRECT study.
Diabetes Care. 37:718–724. 2014. View Article : Google Scholar :
|
|
9
|
Mamas M, Dunn WB, Neyses L and Goodacre R:
The role of metabolites and metabolomics in clinically applicable
biomarkers of disease. Arch Toxicol. 85:5–17. 2011. View Article : Google Scholar
|
|
10
|
Kaddurah-Daouk R, Kristal BS and
Weinshilboum RM: Metabolomics: A global biochemical approach to
drug response and disease. Annu Rev Pharmacol Toxicol. 48:653–683.
2008. View Article : Google Scholar : PubMed/NCBI
|
|
11
|
Wilson ID, Nicholson JK, Castro-Perez J,
Granger JH, Johnson KA, Smith BW and Plumb RS: High resolution
'ultra performance' liquid chromatography coupled to oa-TOF mass
spectrometry as a tool for differential metabolic pathway profiling
in functional genomic studies. J Proteome Res. 4:591–598. 2005.
View Article : Google Scholar : PubMed/NCBI
|
|
12
|
Guo K, Bamforth F and Li L: Qualitative
metabolome analysis of human cerebrospinal fluid by
13C-/12C-isotope dansylation labeling combined with liquid
chromatography Fourier transform ion cyclotron resonance mass
spectrometry. J Am Soc Mass Spectrom. 22:339–347. 2011. View Article : Google Scholar : PubMed/NCBI
|
|
13
|
Nicholson JK and Lindon JC: Systems
biology: Metabonomics. Nature. 455:1054–1056. 2008. View Article : Google Scholar : PubMed/NCBI
|
|
14
|
Lee Y, Khan A, Hong S, Jee SH and Park YH:
A metabolomic study on high-risk stroke patients determines low
levels of serum lysine metabolites: A retrospective cohort study.
Mol Biosyst. 13:1109–1120. 2017. View Article : Google Scholar : PubMed/NCBI
|
|
15
|
Kanehisa M and Goto S: KEGG: Kyoto
encyclopedia of genes and genomes. Nucleic Acids Res. 28:27–30.
2000. View Article : Google Scholar
|
|
16
|
Suhre K: Metabolic profiling in diabetes.
J Endocrinol. 221:R75–R85. 2014. View Article : Google Scholar : PubMed/NCBI
|
|
17
|
Newgard CB, An J, Bain JR, Muehlbauer MJ,
Stevens RD, Lien LF, Haqq AM, Shah SH, Arlotto M, Slentz CA, et al:
A branched-chain amino acid-related metabolic signature that
differentiates obese and lean humans and contributes to insulin
resistance. Cell Metab. 9:311–326. 2009. View Article : Google Scholar : PubMed/NCBI
|
|
18
|
Wang TJ, Larson MG, Vasan RS, Cheng S,
Rhee EP, McCabe E, Lewis GD, Fox CS, Jacques PF, Fernandez C, et
al: Metabolite profiles and the risk of developing diabetes. Nat
Med. 17:448–453. 2011. View
Article : Google Scholar : PubMed/NCBI
|
|
19
|
Wang-Sattler R, Yu Z, Herder C, Messias
AC, Floegel A, He Y, Heim K, Campillos M, Holzapfel C, Thorand B,
et al: Novel biomarkers for pre-diabetes identified by
metabolomics. Mol Syst Biol. 8:6152012. View Article : Google Scholar : PubMed/NCBI
|
|
20
|
Cheng S, Rhee EP, Larson MG, Lewis GD,
McCabe EL, Shen D, Palma MJ, Roberts LD, Dejam A, Souza AL, et al:
Metabolite profiling identifies pathways associated with metabolic
risk in humans. Circulation. 125:2222–2231. 2012. View Article : Google Scholar : PubMed/NCBI
|
|
21
|
Drogan D, Dunn WB, Lin W, Buijsse B,
Schulze MB, Langenberg C, Brown M, Floegel A, Dietrich S,
Rolandsson O, et al: Untargeted metabolic profiling identifies
altered serum metabolites of type 2 diabetes mellitus in a
prospective, nested case control study. Clin Chem. 61:487–497.
2015. View Article : Google Scholar
|
|
22
|
Anjana RM, Shanthi Rani CS, Deepa M,
Pradeepa R, Sudha V, Divya Nair H, Lakshmipriya N, Subhashini S,
Binu VS, Unnikrishnan R, et al: Incidence of diabetes and
prediabetes and predictors of progression among Asian Indians:
10-Year follow-up of the Chennai Urban Rural Epidemiology Study
(CURES). Diabetes Care. 38:1441–1448. 2015. View Article : Google Scholar : PubMed/NCBI
|
|
23
|
Jee SH, Batty GD, Jang Y, Oh DJ, Oh BH,
Lee SH, Park SW, Seung KB, Kimm H, Kim SY, et al: The Korean Heart
Study: Rationale, objectives, protocol, and preliminary results for
a new prospective cohort study of 430,920 men and women. Eur J Prev
Cardiol. 21:1484–1492. 2014. View Article : Google Scholar
|
|
24
|
Want EJ, O'Maille G, Smith CA, Brandon TR,
Uritboonthai W, Qin C, Trauger SA and Siuzdak G: Solvent-dependent
metabolite distribution, clustering, and protein extraction for
serum profiling with mass spectrometry. Anal Chem. 78:743–752.
2006. View Article : Google Scholar : PubMed/NCBI
|
|
25
|
Yu T, Park Y, Johnson JM and Jones DP:
apLCMS - adaptive processing of high-resolution LC/MS data.
Bioinformatics. 25:1930–1936. 2009. View Article : Google Scholar : PubMed/NCBI
|
|
26
|
Benjamini Y and Hochberg Y: Controlling
the false discovery rate: A practical and powerful approach to
multiple testing. JR Stat Soc B. B57:289–300. 1995.
|
|
27
|
Ritchie ME, Phipson B, Wu D, Hu Y, Law CW,
Shi W and Smyth GK: limma powers differential expression analyses
for RNA-sequencing and microarray studies. Nucleic Acids Res.
43:e472015. View Article : Google Scholar : PubMed/NCBI
|
|
28
|
Smith CA, O'Maille G, Want EJ, Qin C,
Trauger SA, Brandon TR, Custodio DE, Abagyan R and Siuzdak G:
METLIN: A metabolite mass spectral database. Ther Drug Monit.
27:747–751. 2005. View Article : Google Scholar
|
|
29
|
Prawitt J, Caron S and Staels B: Bile acid
metabolism and the pathogenesis of type 2 diabetes. Curr Diab Rep.
11:160–166. 2011. View Article : Google Scholar : PubMed/NCBI
|
|
30
|
Li T, Francl JM, Boehme S, Ochoa A, Zhang
Y, Klaassen CD, Erickson SK and Chiang JY: Glucose and insulin
induction of bile acid synthesis: Mechanisms and implication in
diabetes and obesity. J Biol Chem. 287:1861–1873. 2012. View Article : Google Scholar :
|
|
31
|
Tomkin GH and Owens D: Obesity diabetes
and the role of bile acids in metabolism. J Transl Int Med.
4:73–80. 2016. View Article : Google Scholar
|
|
32
|
Russell DW: Cholesterol biosynthesis and
metabolism. Cardiovasc Drugs Ther. 6:103–110. 1992. View Article : Google Scholar : PubMed/NCBI
|
|
33
|
Simons K and Ikonen E: How cells handle
cholesterol. Science. 290:1721–1726. 2000. View Article : Google Scholar : PubMed/NCBI
|
|
34
|
Fernández C, Suárez Y, Ferruelo AJ,
Gómez-Coronado D and Lasunción MA: Inhibition of cholesterol
biosynthesis by Delta22-unsaturated phytosterols via competitive
inhibition of sterol Delta24-reductase in mammalian cells. Biochem
J. 366:109–119. 2002. View Article : Google Scholar : PubMed/NCBI
|
|
35
|
Luu W, Zerenturk EJ, Kristiana I, Bucknall
MP, Sharpe LJ and Brown AJ: Signaling regulates activity of DHCR24,
the final enzyme in cholesterol synthesis. J Lipid Res. 55:410–420.
2014. View Article : Google Scholar :
|
|
36
|
Berisha SZ, Serre D, Schauer P, Kashyap SR
and Smith JD: Changes in whole blood gene expression in obese
subjects with type 2 diabetes following bariatric surgery: A pilot
study. PLoS One. 6:e167292011. View Article : Google Scholar : PubMed/NCBI
|
|
37
|
Dai M, Zhu XL, Liu F, Xu QY, Ge QL, Jiang
SH, Yang XM, Li J, Wang YH, Wu QK, et al: Cholesterol synthetase
DHCR24 induced by insulin aggravates cancer invasion and
progesterone resistance in endometrial carcinoma. Sci Rep.
7:414042017. View Article : Google Scholar : PubMed/NCBI
|
|
38
|
Moh A, Zhang W, Yu S, Wang J, Xu X, Li J
and Fu XY: STAT3 sensitizes insulin signaling by negatively
regulating glycogen synthase kinase-3 beta. Diabetes. 57:1227–1235.
2008. View Article : Google Scholar : PubMed/NCBI
|
|
39
|
Weyer C, Bogardus C, Mott DM and Pratley
RE: The natural history of insulin secretory dysfunction and
insulin resistance in the pathogenesis of type 2 diabetes mellitus.
J Clin Invest. 104:787–794. 1999. View Article : Google Scholar : PubMed/NCBI
|
|
40
|
Weyer C, Funahashi T, Tanaka S, Hotta K,
Matsuzawa Y, Pratley RE and Tataranni PA: Hypoadiponectinemia in
obesity and type 2 diabetes: Close association with insulin
resistance and hyperinsulinemia. J Clin Endocrinol Metab.
86:1930–1935. 2001. View Article : Google Scholar : PubMed/NCBI
|
|
41
|
Schiller J, Zschörnig O, Petković M,
Müller M, Arnhold J and Arnold K: Lipid analysis of human HDL and
LDL by MALDI-TOF mass spectrometry and (31)P-NMR. J Lipid Res.
42:1501–1508. 2001.PubMed/NCBI
|