Introduction
Cholangiocarcinoma (CCA) is a malignant tumor
arising from the biliary tract epithelium, cholangiocyte. The
conditions associated with chronic biliary tract inflammation such
as primary sclerosing cholangitis (PSC), parasitic infection, viral
infection and chemical carcinogen exposure, are major risk factors
associated with the development of CCA (1). However, the specific etiology and
molecular pathogenesis of CCA remain to be comprehensively
elucidated.
Bile acids are endogenous substances which play a
role in several important physiological processes (2). Bile acid exposure has been reported
to be associated with an increasing incidence of gastrointestinal
cancers (3). Bile acids inducing
cancer cell proliferation via epidermal growth factor receptors
(EGFR), Farnesoid X receptors (FXR), sphingosine 1-phosphate
receptor 2 (S1PR2), and G-protein-coupled bile acid receptor 1
(TGR5) have been associated with many types of cancer such as
colon, liver and uterus (4–7).
Furthermore, deoxycholic acid (DCA), lithocholic acid (LCA) and
their taurine conjugates stimulate colon cancer cell proliferation
through muscarinic acetylcholine receptor subtype M3 (M3 mAChR)
(8–10). However, our knowledge of the roles
of bile acids on CCA cell growth is limited and more study is
needed.
Cholinergic systems are functionally present on
certain types of cancer cells including lung, colon, cervix,
prostate and breast cancers (11–15).
The cholinergic system plays a role in the regulation of important
cell functions, including proliferation, migration, cell-to-cell
communication and other features critical for cancer progression
(16,17). More importantly, it has been shown
that the expression of M3 mAChR plays a key role in the
proliferation and metastasis of CCA (18). Furthermore, the cholinergic
denervation of the liver results in the induction of cell death and
impairs proliferative response of cholangiocyte to cholestasis
(19). In the present study, we
focused on the effects of different bile acids and their
metabolites on the growth of two different intrahepatic CCA cell
lines. HuCCA-1 cells were obtained from a Thai-CCA patient with a
history of parasitic infection (Opisthorchis viverrini),
while RMCCA-1 cells were established from a Thai-CCA patient with a
history of non-parasitic infection. The mechanistic effect of bile
acids in CCA growth was also investigated.
Materials and methods
Materials
Eleven forms of bile acids and their metabolites
were purchased from Sigma-Aldrich (St. Louis, MO, USA). These
included cholic acid (CA, purity ≥98%), chenodeoxycholic acid
(CDCA, purity ≥97%), deoxycholic acid (DCA, purity ≥98%),
lithocholic acid (LCA, purity ≥97%), glycocholic acid (GCA, purity
≥97%), glycochenodeoxycholic acid (GCDCA, purity ≥97%),
glycodeoxycholic acid (GDCA, purity ≥97%), taurocholic acid (TCA,
purity ≥95%), taurochenodeoxycholic acid (TCDCA, purity ≥95%),
taurodeoxycholic acid (TDCA, purity ≥97%), and taurolithocholic
acid (TLCA, purity ≥97%). Carbachol and oxotremorine-M were also
purchased (Sigma-Aldrich). AG 1478 was obtained from Calbiochem
(Germany). U 0126 was ordered from Cell Signaling Technology
(Beverly, MA, USA).
Cell culture
The human intrahepatic CCA cell lines, including
HuCCA-1 and RMCCA-1 derived from bile duct tumor mass of Thai CCA
patients, were established and kindly provided by Professor Stitaya
Sirisinha (20), and Dr Kawin
Leelawat (21), respectively. Both
HuCCA-1 and RMCCA-1 cells were grown in Ham’s F-12 medium (Gibco,
Carlsbad, CA, USA), supplemented with 10% FBS (JR Sientific, Inc.,
Woodland, CA, USA), 2 mM L-glutamine, 100 U/ml penicillin and 100
μg/ml streptomycin (Gibco), at 37°C in a 5% CO2
humidified atmosphere. Human neuroblastoma SH-SY5Y cells obtained
from American Type Culture Collection (ATCC) were grown in a 1:1
mixture of minimum essential medium (MEM) (Gibco) and Ham’s F12
medium supplemented with 10% FBS, 2 mM L-glutamine, 100 U/ml
penicillin and 100 μg/ml streptomycin, and cultured in 5%
CO2 at 37°C humidified atmosphere.
MTT assay
Cell viability was measured by a quantitative
colorimetric assay (MTT)
(1-(4,5-Dimethylthiazol-2-yl)-3,5-diphenylformazan) (Sigma-Aldrich)
showing the mitochondrial activity of living cells. Briefly, human
CCA cells were plated in 96-well plates (1×10⁴
cells/well) and cultured overnight for attachment. The next day,
cell synchronization was performed by incubating in serum-free
medium for 24 h. The synchronized cells were treated with different
bile acids and their metabolites for 48 h in serum-free medium, in
order to reduce growth promoting effects of the growth factor and
steroid hormones present in the serum. Thereafter, the medium was
aspirated, and 100 μl of 500 μg/ml of MTT in serum-free medium was
added to each well. Cells were incubated with MTT for 4 h; next,
cells were lysed by dimethyl sulfoxide. When the formazan crystals
were completely dissolved, the optical density (OD) was measured at
570 nm and reference wavelength at 650 nm, using a SpectroMax M3
microplate reader (Molecular Devices, Sunnyvale, CA, USA).
PrestoBlue cell viability assay
PrestoBlue reagent is quickly reduced by
metabolically active cells, providing a quantitative measure of
viability and cytotoxicity. CCA cells were processed as in the
previous MTT assay. At the end of the respective incubation period
24–48 h, cell viability was determined by adding 10 μl of 10x
PrestoBlue Cell Viability reagent (Invitrogen, Carlsbad, CA, USA)
and incubating at 37°C for 30 min. The fluorescence was determined
at 560 nm excitation/590 nm emission using SpectroMax M3 microplate
reader, and expressed as the percentage of cell viability of the
control.
EdU incorporation assay
The cell proliferation was determined by the
incorporation of 5-ethynil-2-deoxyuridine (EdU) into newly
synthesized DNA stand, using a Click-iT EdU microplate assay kit
(Invitrogen) according to the manufacturer’s instructions. Briefly,
cells were processed as previously described in the cell viability
assay. After 24-h treatment with bile acid, 10 μl of 10x EdU
working solution was added to each well to make the final
concentration of 10 μM. The incorporation time was 4 h. Then the
incorporated EdU in DNA was coupled with Oregon Green-azide dye,
and subsequently incubated with horseradish peroxidase-labeled
anti-Oregon Green antibody and Amplex UltraRed. The fluorescence
was determined at 490 nm excitation/585 nm emission using
SpectroMax M3 microplate reader, and expressed as the percentage of
cell proliferation of the control.
Cell cycle analysis
CCA cells were plated into 6-well plates
(1×10⁶ cells/well) and cultured overnight. Cells were
processed as stated in the previous cell viability assay. After
24-h treatment, cells were trypsinized and washed with cold
phosphate buffer saline (PBS). Subsequently, cells were fixed by
using 70% ethanol at 4°C for 1 h and then washed with cold PBS.
Cells were stained by adding 1 ml of propidium iodide solution
containing 50 μg/ml propidium iodide (Sigma-Aldrich) and 0.5 ng/ml
RNAse (Sigma-Aldrich). Analysis was performed with a BD FACSCanto™
flow cytometer (BD Biosciences, San Diego, CA, USA) and cell cycle
distribution was analyzed by ModFit LT software (Verity House
Software, Topsham, ME, USA).
Western blotting
The cells were processed as in the above described
cell viability assay. At the end of the respective incubation
period, cells were lysed in lysis buffer containing 10 mM Tris (pH
7.4), 150 mM NaCl, 1% Triton X-100, 1 mM PMSF, 1 mM
Na3VO4, 20 mM NaF and 1X protease inhibitor
cocktail set I (Calbiochem). Cell lysates were sonicated and
incubated at 4°C for 30 min before being centrifuged at 16,000 × g
for 15 min at 4°C. The concentration of protein was determined by
using Bradford reagent (Bio-Rad, Hercules, CA, USA). The protein
(50 μg) was electrophoresed onto a 7.5% SDS-polyacrylamide gel, in
a Mini-Protean II system (Bio-Rad). The separated protein bands
were transferred onto a nitrocellulose membrane using a Bio-Rad
Mini Trans-Blot cell. The nitrocellulose membrane was incubated in
blocking buffer (5% non-fat dry milk in TBST buffer [10 mM Tris-HCl
pH 8.0, 150 mM NaCl, and 0.05% Tween-20)] for 1 h at room
temperature, followed by overnight incubation at 4°C with the
primary antibody. The antibodies against cyclin D1 (1:1,000),
phospho-ERK1/2 (1:2,000) and total ERK1/2 (1:2,000) were obtained
from Cell Signaling Technology and antibodies against phospho-EGFR
(1:1,000), EGFR (1:1,000), COX-2 (1:2,000), CHT (1:2,000), ChAT
(1:2,000), AChE (1:1,000), M3 mAChR (1:1,000) and α7 nAChR
(1:1,000) were purchased from Santa Cruz Biotechnology (Santa Cruz,
CA, USA). The membrane was washed three times for 10 min each with
TBST, and then incubated for 2 h at room temperature with
appropriate secondary antibody conjugated with horseradish
peroxidase. The protein bands stained with the antibodies were
visualized by using enhanced chemiluminescence (ECL) (GE
Healthcare, UK). The intensity of protein bands was quantified by
Image Quant TL software (GE Healthcare).
Statistical analysis
The experiments were performed in triplicate, and
the results are expressed as the means ± SEM. For individual
comparison, statistical analysis was performed using a two-tailed
Student’s t-test. Multiple comparisons were performed using one-way
analysis of variance (ANOVA) followed by the Student-Newman-Keuls
test. Data with statistical values of p<0.05 are considered as
statistically significant.
Results
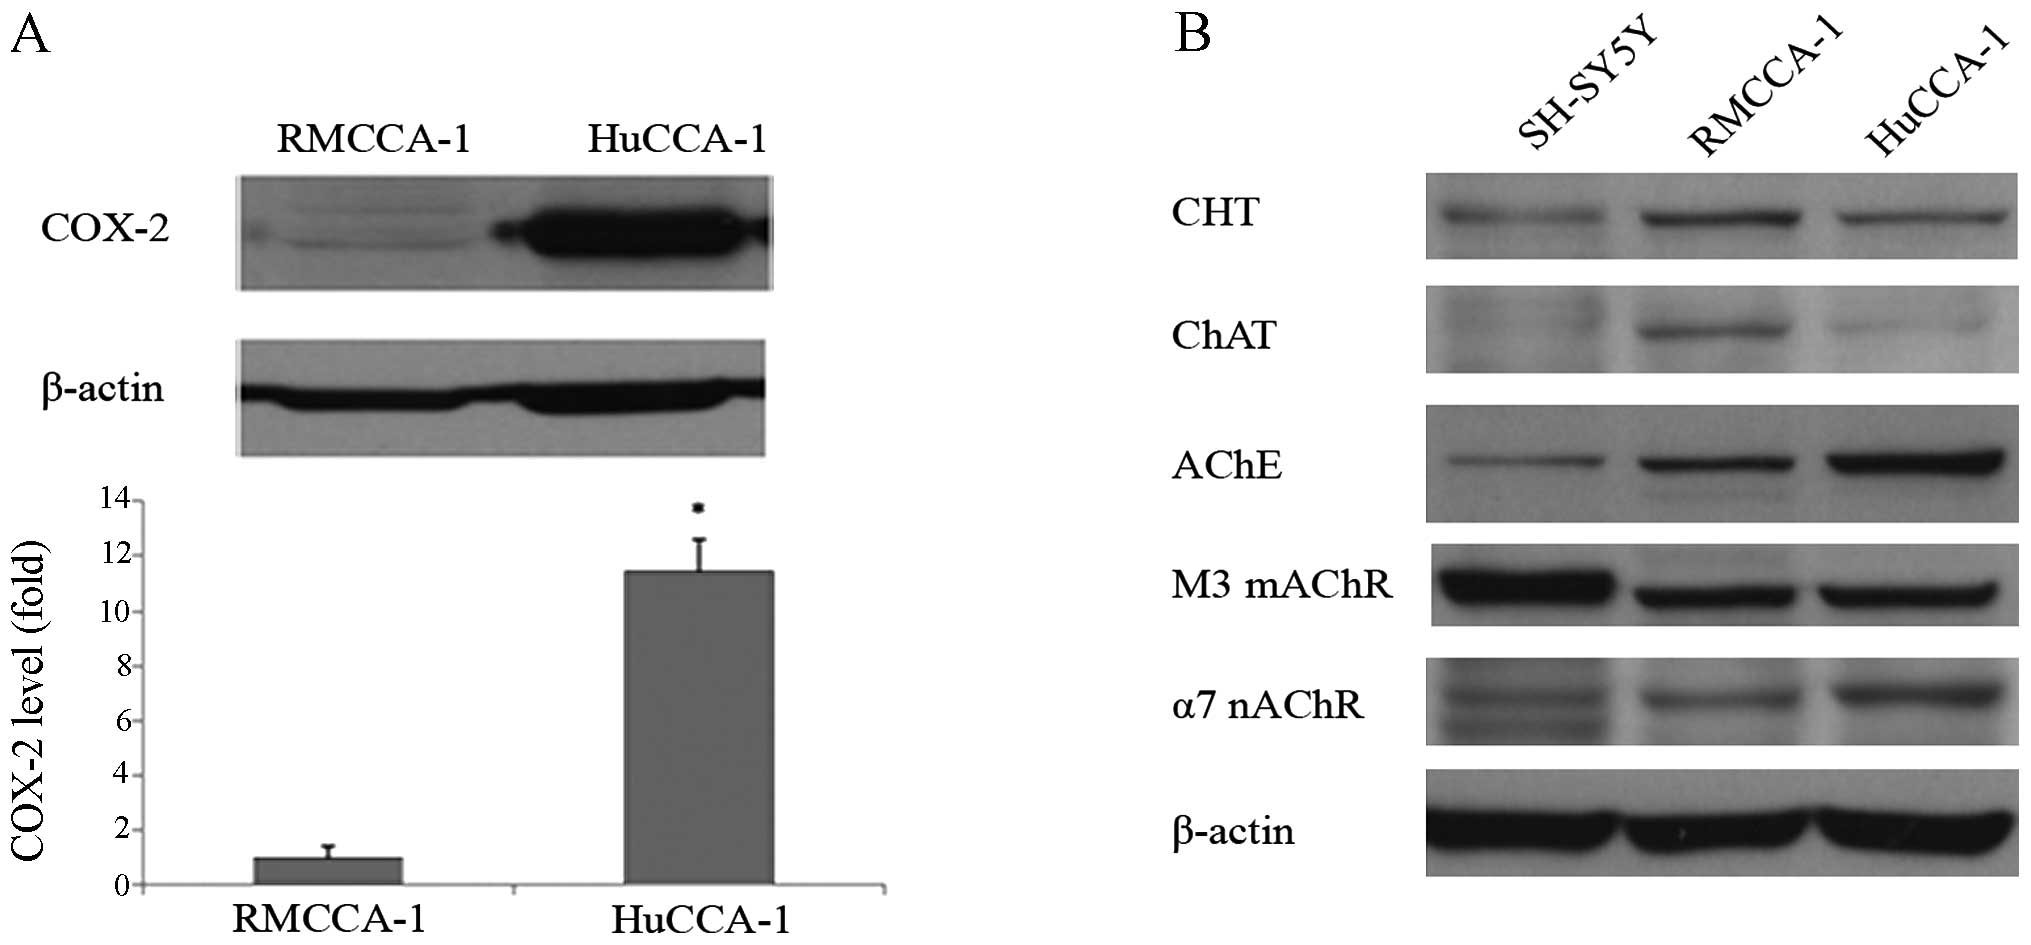
The existence of inflammation marker,
COX-2 and cholinergic components in HuCCA-1 and RMCCA-1 cells
The endogenous background levels of inflammation and
cholinergic components in CCA cells were determined. The results
showed that HuCCA-1 cells have higher expression level (11.5 times)
of COX-2, a key inflammatory marker protein than RMCCA-1 cells
(Fig. 1A). Furthermore, the
existence of cholinergic systems was also different among these two
CCA cell lines. All of the cholinergic components including choline
transporter (CHT), choline acetyltransferase (ChAT), acetylcholine
esterase (AChE), M3 muscarinic acetylcholine receptor (M3 mAChR)
and α7 nicotinic acetylcholine receptor (α7 nAChR) were detected in
both HuCCA-1 and RMCCA-1 cells (Fig.
1B). Note that, RMCCA-1 cells expressed higher levels of CHT
and ChAT than HuCCA-1 cells. Respectively, AChE and α7 nAChR
expression was lower in RMCCA-1 than HuCCA-1 cells. It is
interesting to note that both CCA cell lines expressed higher
levels of the cholinergic components than dopaminergic/cholinergic
neuroblastoma SH-SY5Y cells, except the M3 mAChR.
TLCA increases viability of RMCCA-1
cells
After treatment with bile acids and metabolites for
48 h, cell viability was determined by MTT assay. As shown in
Table I, most of primary bile
acids, secondary bile acids and their glycine-conjugated at the
highest-tested concentration (100 μM) significantly decreased the
viability of CCA cells, except CA and GCDCA in RMCCA-1 cells.
Tauroline-conjugated bile acids at the highest-tested concentration
did not significantly decrease the viability of CCA cells, except
TCGCA and TLCA in HuCCA-1, and TLCA in RMCCA-1 cells. Primary bile
acid CDCA showed higher cytotoxic effect to the CCA cells than
another primary bile acid CA. In addition, secondary bile acids,
including DCA and LCA, showed higher cytotoxic effects to the CCA
cells than their primary bile acids. It is interesting to find that
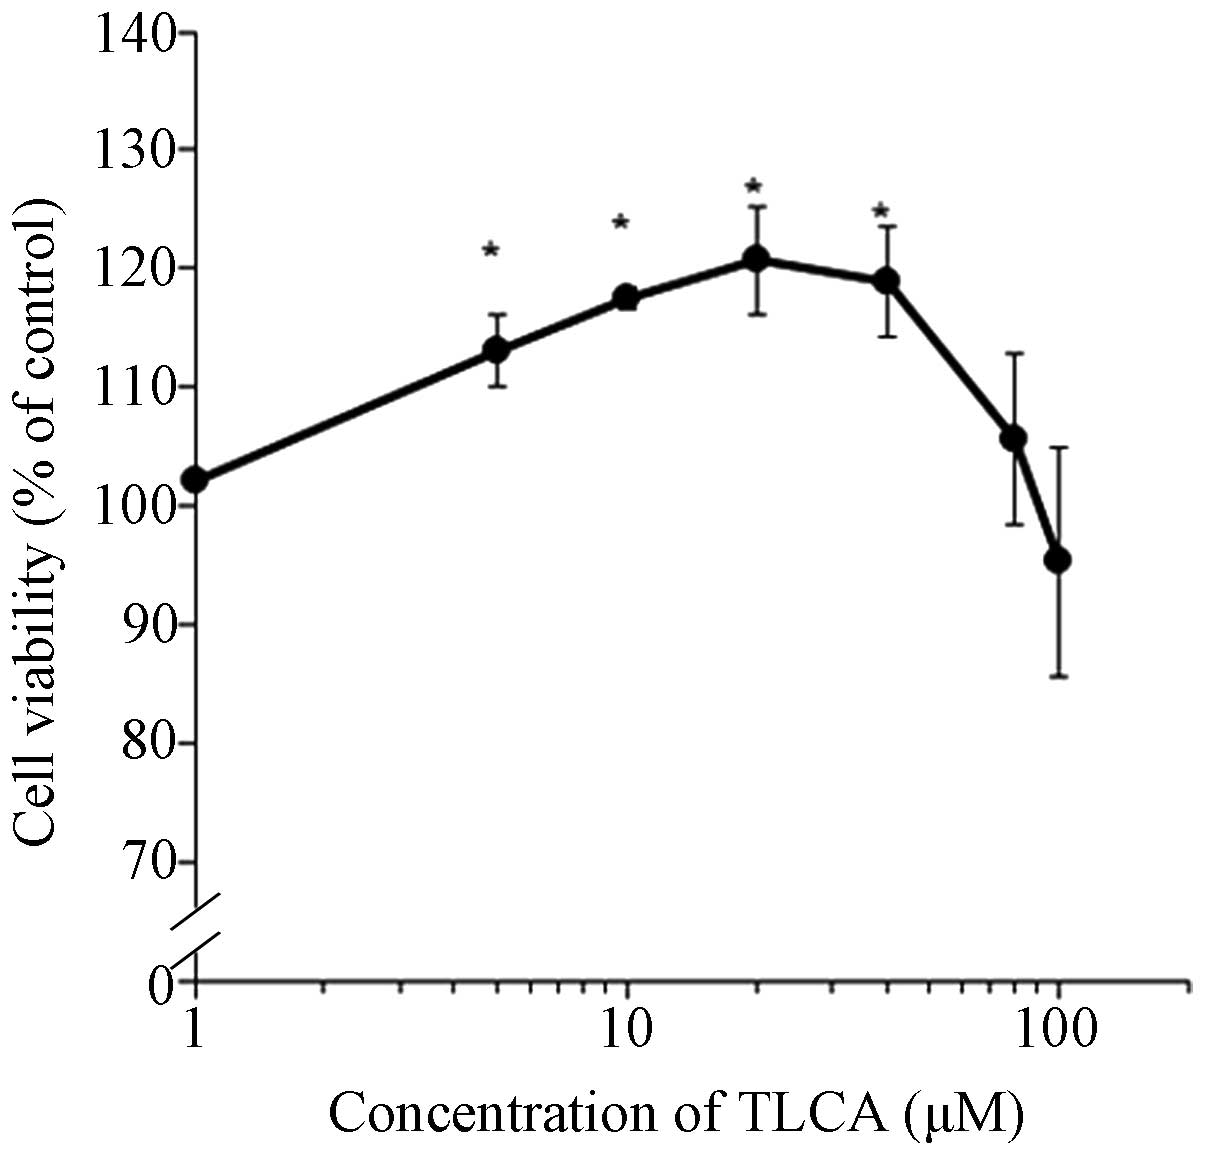
among the 11 forms of bile acid and their metabolites only low
tested concentration (0.1–10 μM) of TLCA increased the viability of
RMCCA-1 cells. However, at high concentration decreasing of cell
viability was observed. The effect of TLCA to increase cell
viability was confirmed by using the PrestoBlue cell viability
assay. The results obtained from PrestoBlue cell viability assay
showed a similar pattern of MTT assay with a higher sensitivity
(Fig. 2). TLCA significantly
increased the RMCCA-1 viable cells starting at 5 μM until 40 μM.
However, concentrations >40 μM of TLCA caused decreasing trends
of cell viability. Note that TLCA at the concentration of 10 μM was
selected for further study.
 | Table IThe effects of bile acids and
metabolites on cell viability. |
Table I
The effects of bile acids and
metabolites on cell viability.
| Cell viability (%
of control) |
|---|
|
|
|---|
| RMCCA-1
concentration (μM) | HuCCA-1
concentration (μM) |
|---|
|
|
|
|---|
| Bile acids and
metabolites | 0.1 | 1 | 10 | 100 | 0.1 | 1 | 10 | 100 |
|---|
| Cholic acid
(CA) | 104.2±4.2 | 105.0±3.8 | 104.7±2.6 | 100.5±2.2 | 103.0±2.5 | 100.6±2.6 | 100.6±1.4 | 88.4±3.6a |
| Chenodeoxycholic
acid (CDCA) | 104.6±0.7 | 100.4±1.1 | 96.8±2.8 | 51.8±3.8a | 103.1±2.4 | 104.8±1.9 | 100.2±3.2 | 49.9±2.8a |
| Deoxycholic acid
(DCA) | 106.8±1.6 | 107.3±1.1 | 102.3±8.5 | 48.4±2.1a | 93.5±6.6 | 95.0±0.7 | 86.2±6.1 | 27.4±1.0a |
| Lithocholic acid
(LCA) | 104.6±0.7 | 104.0±2.9 | 56.3±1.0a | 7.5±0.8a | 106.7±1.0 | 103.9±4.0 | 55.2±5.9a | 5.0±0.7a |
| Glycine conjugated
bile acids |
| Glycocholic acid
(GCA) | 94.6±2.7 | 93.9±0.7 | 93.1±1.7 | 85.3±2.9a | 106.1±2.1 | 94.7±1.1 | 93.3±0.2 | 82.0±3.6a |
|
Glycochenodeoxycholic acid (GCDCA) | 102.0±1.0 | 98.2±1.6 | 94.3±6.5 | 83.5±7.3 | 106.5±2.1 | 100.6±1.7 | 92.3±1.2a | 77.7±2.7a |
| Glycodeoxycholic
acid (GDCA) | 97.5±2.5 | 91.6±2.1 | 94.7±2.3 | 86.7±1.4a | 105.2±4.1 | 104.2±5.1 | 98.4±2.4 | 77.5±0.1a |
| Taurine conjugated
bile acids |
| Taurocholic acid
(TCA) | 100.4±3.2 | 98.4±3.7 | 99.7±5.6 | 95.5±5.4 | 108.1±3.2 | 106.9±2.9 | 107.3±4.0 | 94.4±3.2 |
|
Taurochonodeoxycholic acid (TCGCA) | 95.3±3.6 | 99.7±3.8 | 95.5±4.9 | 84.6±8.0 | 98.7±2.0 | 96.8±3.3 | 91.1±3.2 | 73.4±6.6a |
| Taurodeoxycholic
acid (TDCA) | 100.8±1.2 | 102.6±1.7 | 100.4±3.3 | 95.2±2.7 | 106.5±2.5 | 105.7±2.2 | 102.2±2.9 | 89.5±5.2 |
| Taurolithocholic
acid (TLCA) | 109.8±1.7 | 112.0±8.2 | 118.3±1.3a | 80.1±6.2a | 95.1±1.6 | 98.1±1.8 | 94.4±2.5 | 55.3±7.1a |
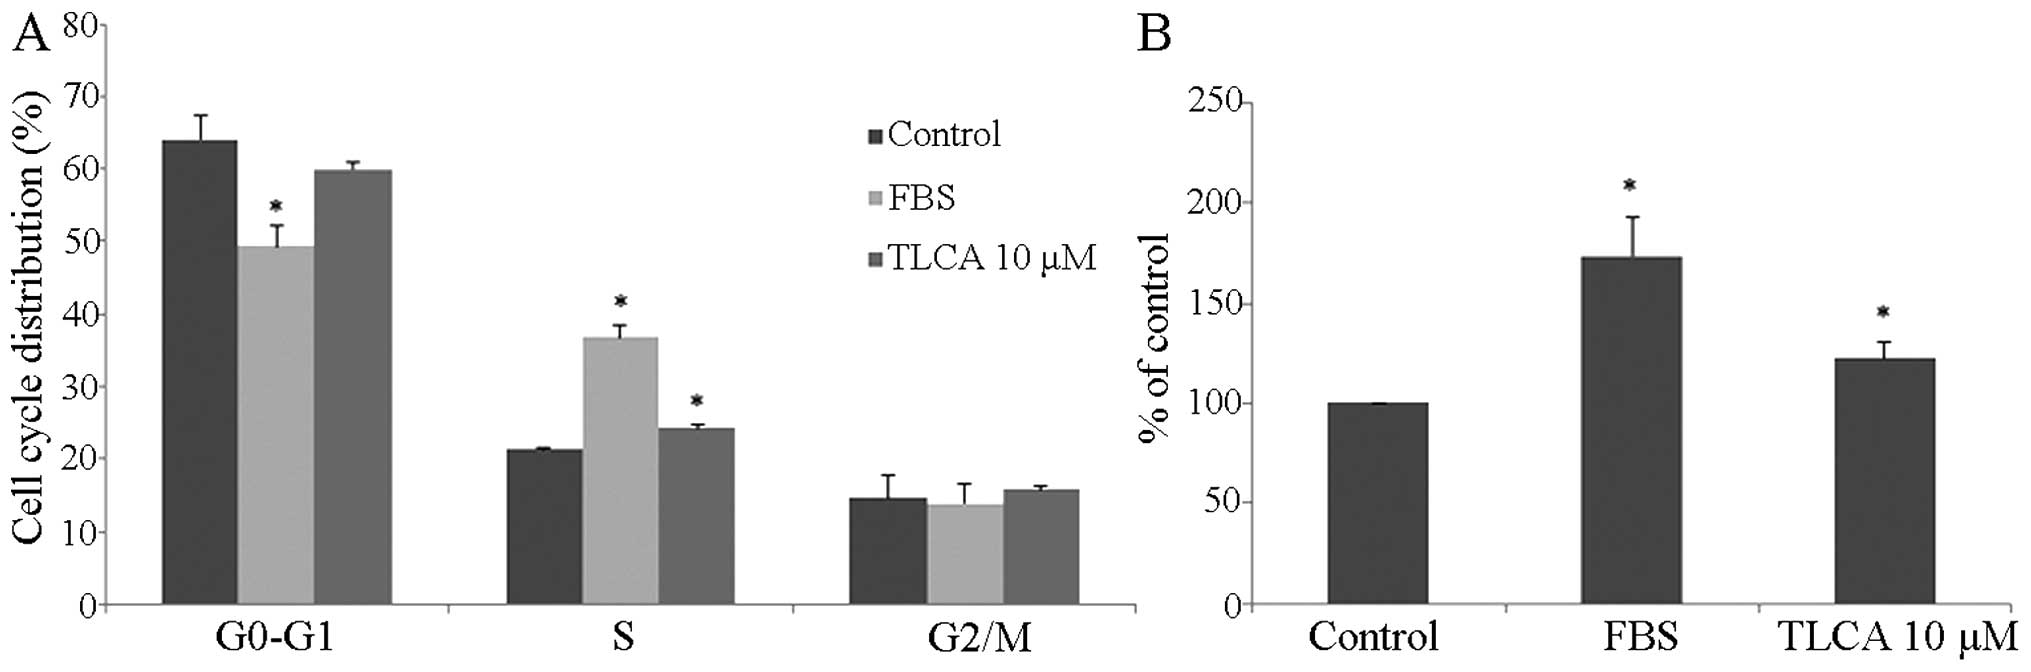
TLCA induces RMCCA-1 cell growth
Our results revealed that TLCA increased the RMCCA-1
cell viability in serum-free conditions, suggesting the growth
promoting effect of TLCA. Therefore, further study was conducted to
investigate the effect of TLCA on cell cycle and DNA synthesis of
RMCCA-1 cells. The results showed that 10 μM of TLCA and the
positive control (10% FBS) treatment for 24 h significantly
increased the percentage of S-phase cell subpopulation (Fig. 3A). Moreover, the effect of TLCA on
the proliferation of RMCCA-1 was detected by the EdU incorporation
assay. TLCA at the concentration of 10 μM and 10% of FBS treatment
significantly increased cell proliferation by 22.3 and 73.8%,
respectively, when compared with the control (Fig. 3B). These results indicate that the
rise in TLCA-treated cell viability was caused by cell
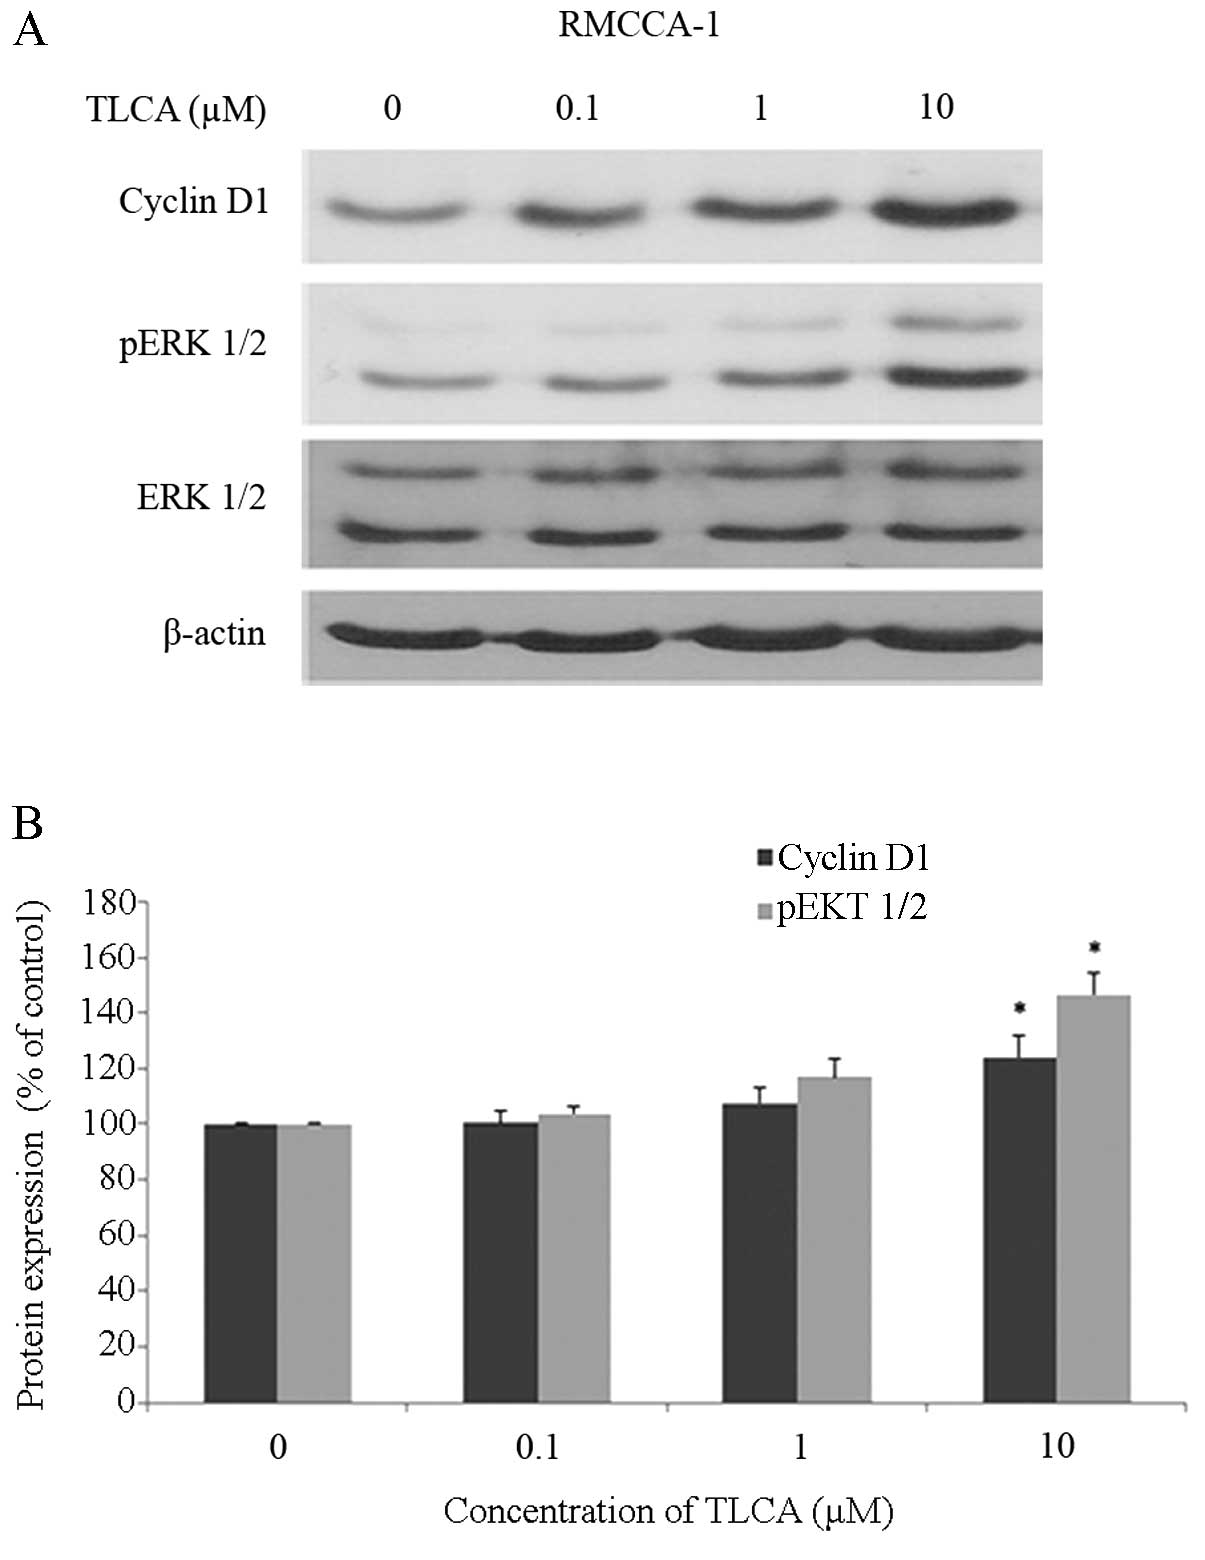
proliferation. Furthermore, cyclin D1 and phosphorylated-ERK 1/2 of
RMCCA-1 cells treated with TLCA were increased in a
concentration-dependent pattern, a statistically significant
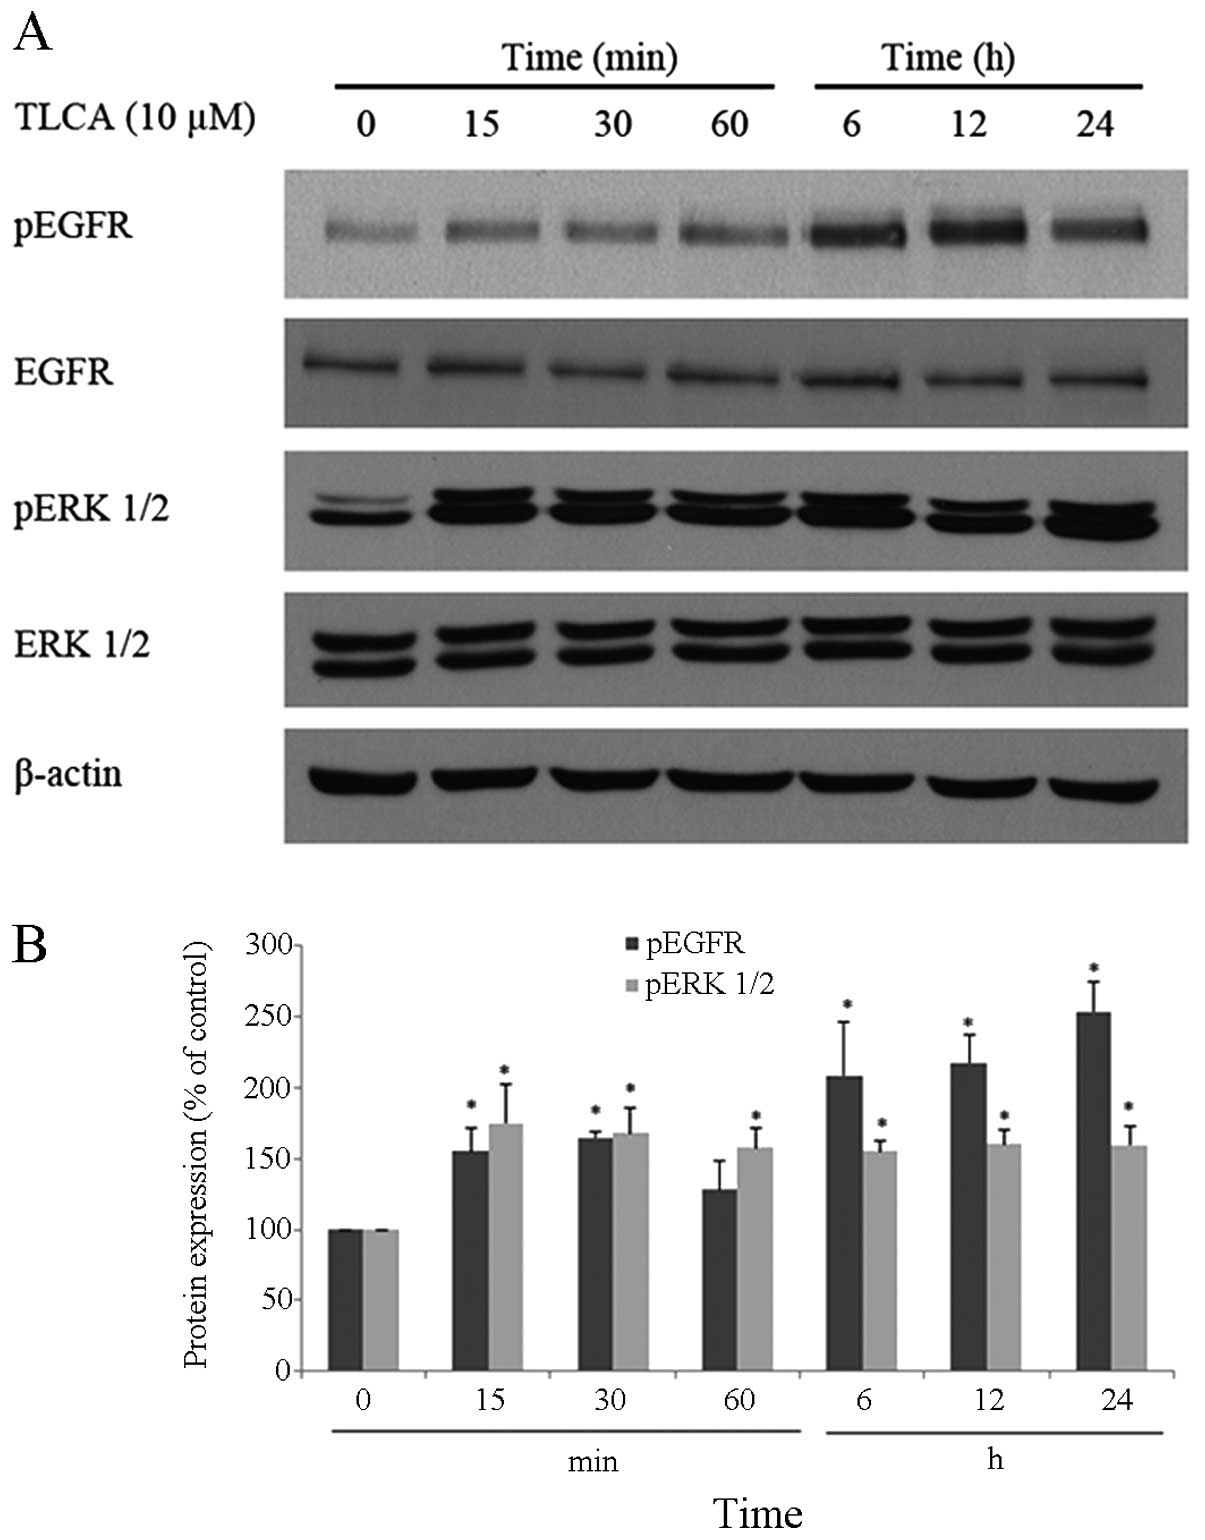
difference at the concentration of 10 μM (Fig. 4). Additionally, time course study
showed that 10 μM of TLCA continuously increases the
phosphorylation of ERK 1/2 and EGFR (Fig. 5), indicating the activation of
these proteins. The activation of ERK 1/2 was observed at 15 min
following the TLCA treatment, and this activation remained
consistent throughout the exposure time (24 h). The activation of
EGFR was also found at 15 min after treatment, and this activation
was time-dependent. Despite induction of their phosphorylated
forms, the levels of total forms of ERK 1/2 and EGFR were not
changed at any time on the TLCA treatment. These results indicate
that TLCA induces cell growth and activates the phosphorylation of
both EGFR and ERK 1/2 in RMCCA-1 cells.
Muscarinic acetylcholine receptors
involved in TLCA-activated RMCCA-1 cell growth
Cholinergic system plays an important role in
cholangiocyte biology including modulating growth, apoptosis, and
secretion of cholangiocytes (22).
Importantly, mAChR subtype M3 (M3 mAChR) plays a key role in the
proliferation and metastasis of CCA (18). To investigate the functional role
of cholinergic system in CCA cell growth, HuCCA-1 and RMCCA-1 cells
were treated with carbachol, which is a stable cholinergic receptor
agonist or oxotremorine-M (Oxo-M), a specific mAChR agonist, in a
serum-free condition; then cell viability was determined after 48 h
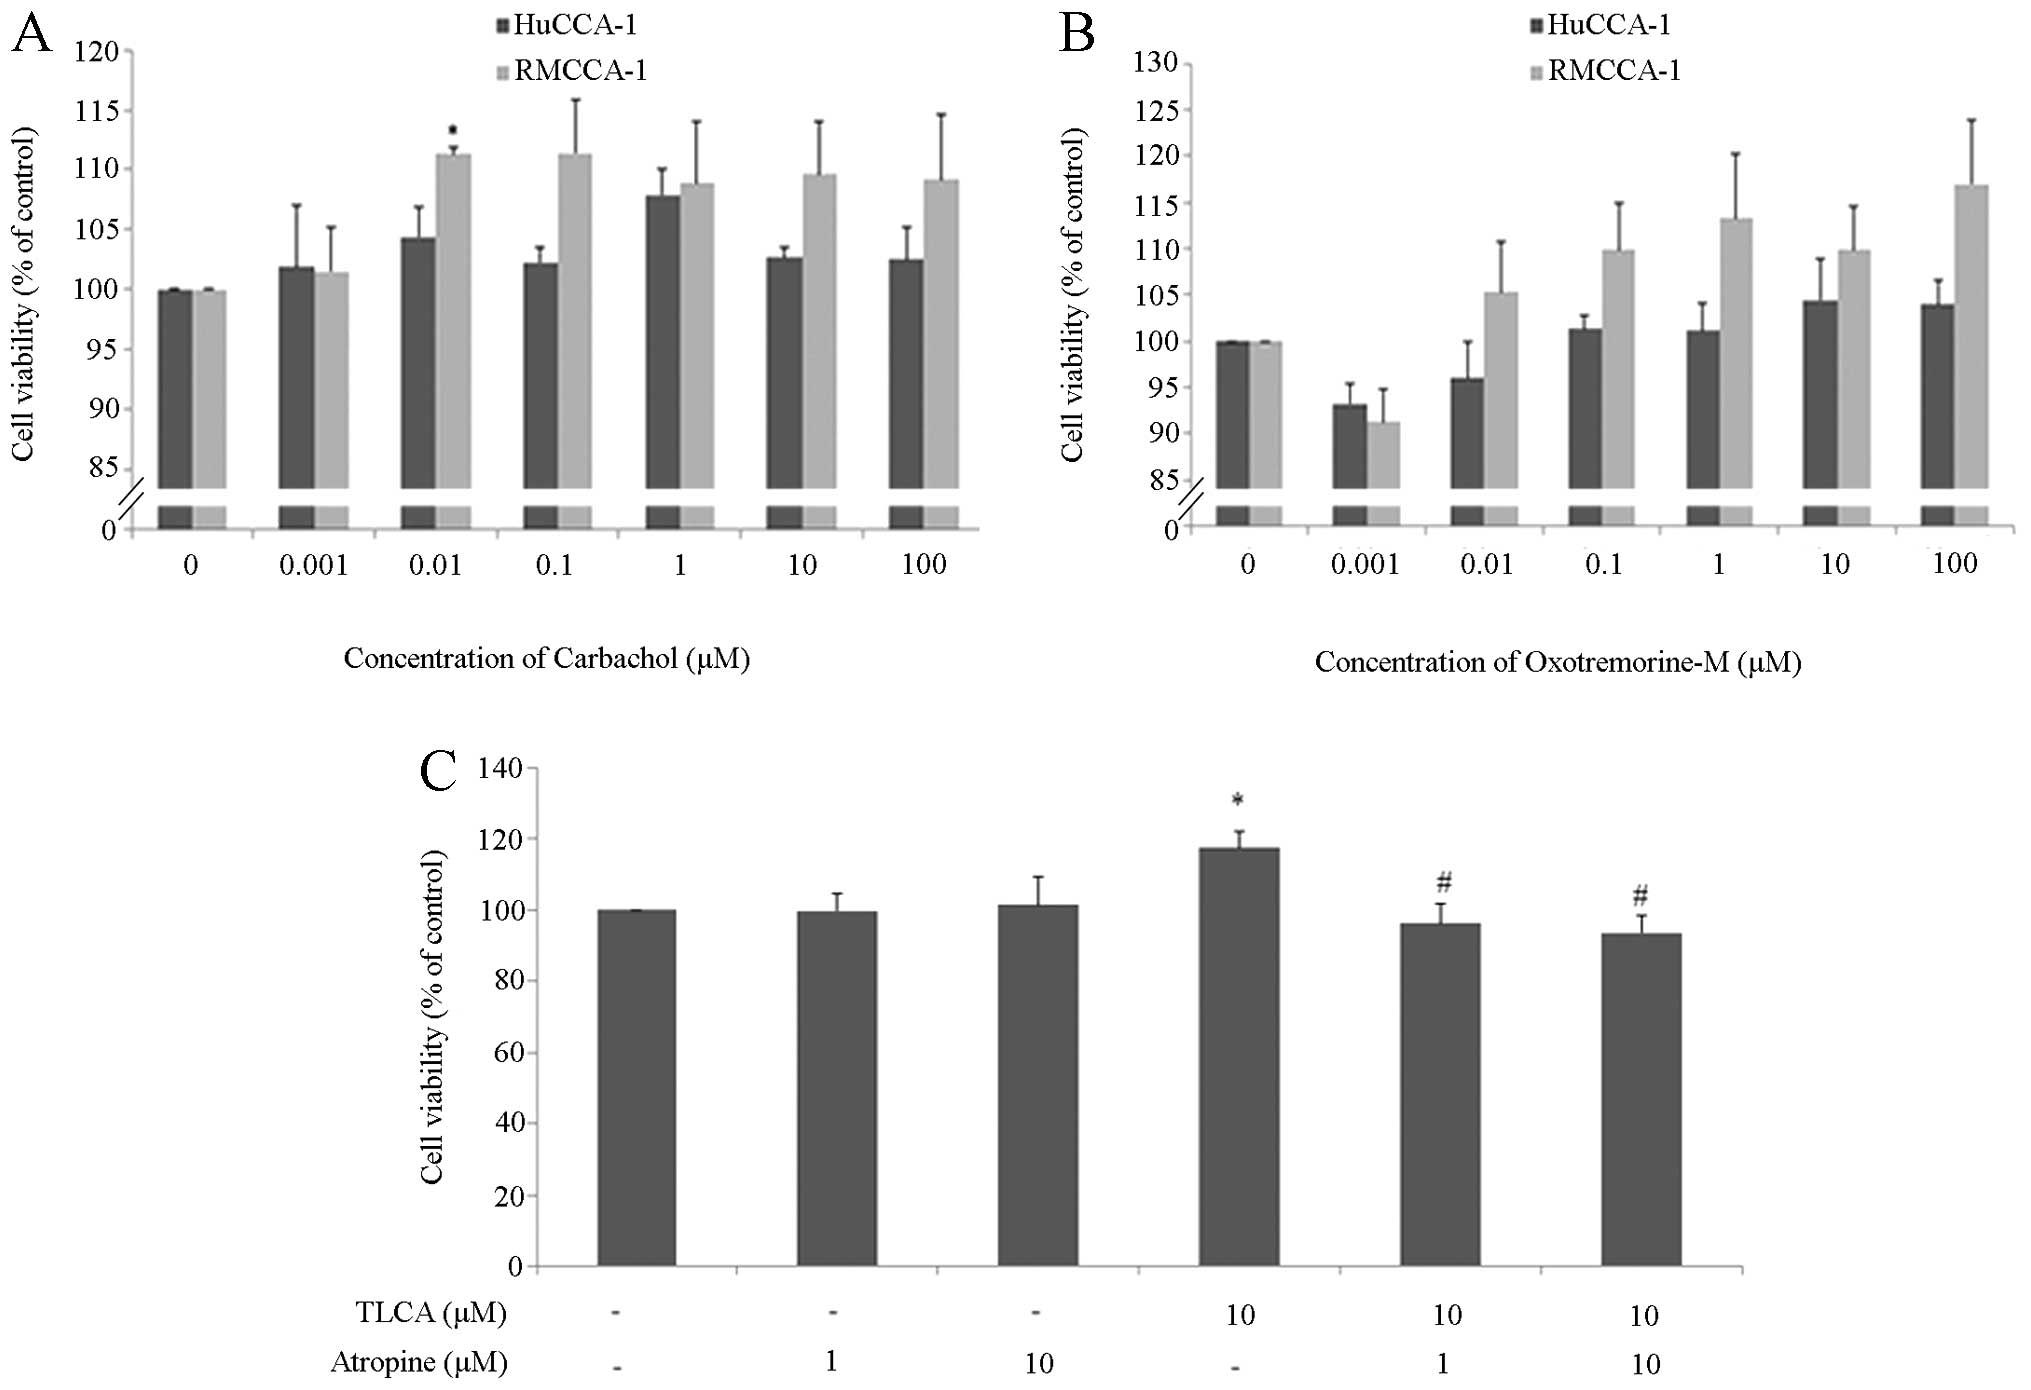
of exposure. The results showed that 0.01 μM of carbachol
significantly increased the growth of RMCCA-1 cells (Fig. 6A). Carbachol at the higher
concentration (0.1–100 μM) also increased the growth of RMCCA-1
cells, however significant difference to the control group was not
observed. Moreover, none of the tested concentration of carbachol
(0.001–100 μM) showed a growth promoting effect in HuCCA-1 cells.
Furthermore, Oxo-M (0.01–100 μM) also slightly increased the growth
of RMCCA-1 cells but this effect was not found in HuCCA-1 cells
(Fig. 6B). We observed that the
increase in cell viability induced by two cholinergic agonists,
HuCCA-1 was less responsive than RMCCA-1. The different results
observed in RMCCA-1 and HuCCA-1 cell lines may be due to the
difference in the basal cholinergic function of these two cell
lines. However, these results may suggest that cholinergic system
plays some role in RMCCA-1 cell growth.
To investigate the role of mAChR in TLCA-induced
RMCCA-1 cell growth, RMCCA-1 cells were treated with 10 μM of TLCA
and/or 1, 10 μM of atropine, which is a nonselective antagonist of
mAChR for 48 h. The results showed that atropine by itself did not
alter the growth of RMCCA-1 cells, whereas atropine completely
mitigated the growth promoting effect of TLCA (Fig. 6C). This result indicates that mAChR
is involved in TLCA-stimulated RMCCA-1 cell growth.
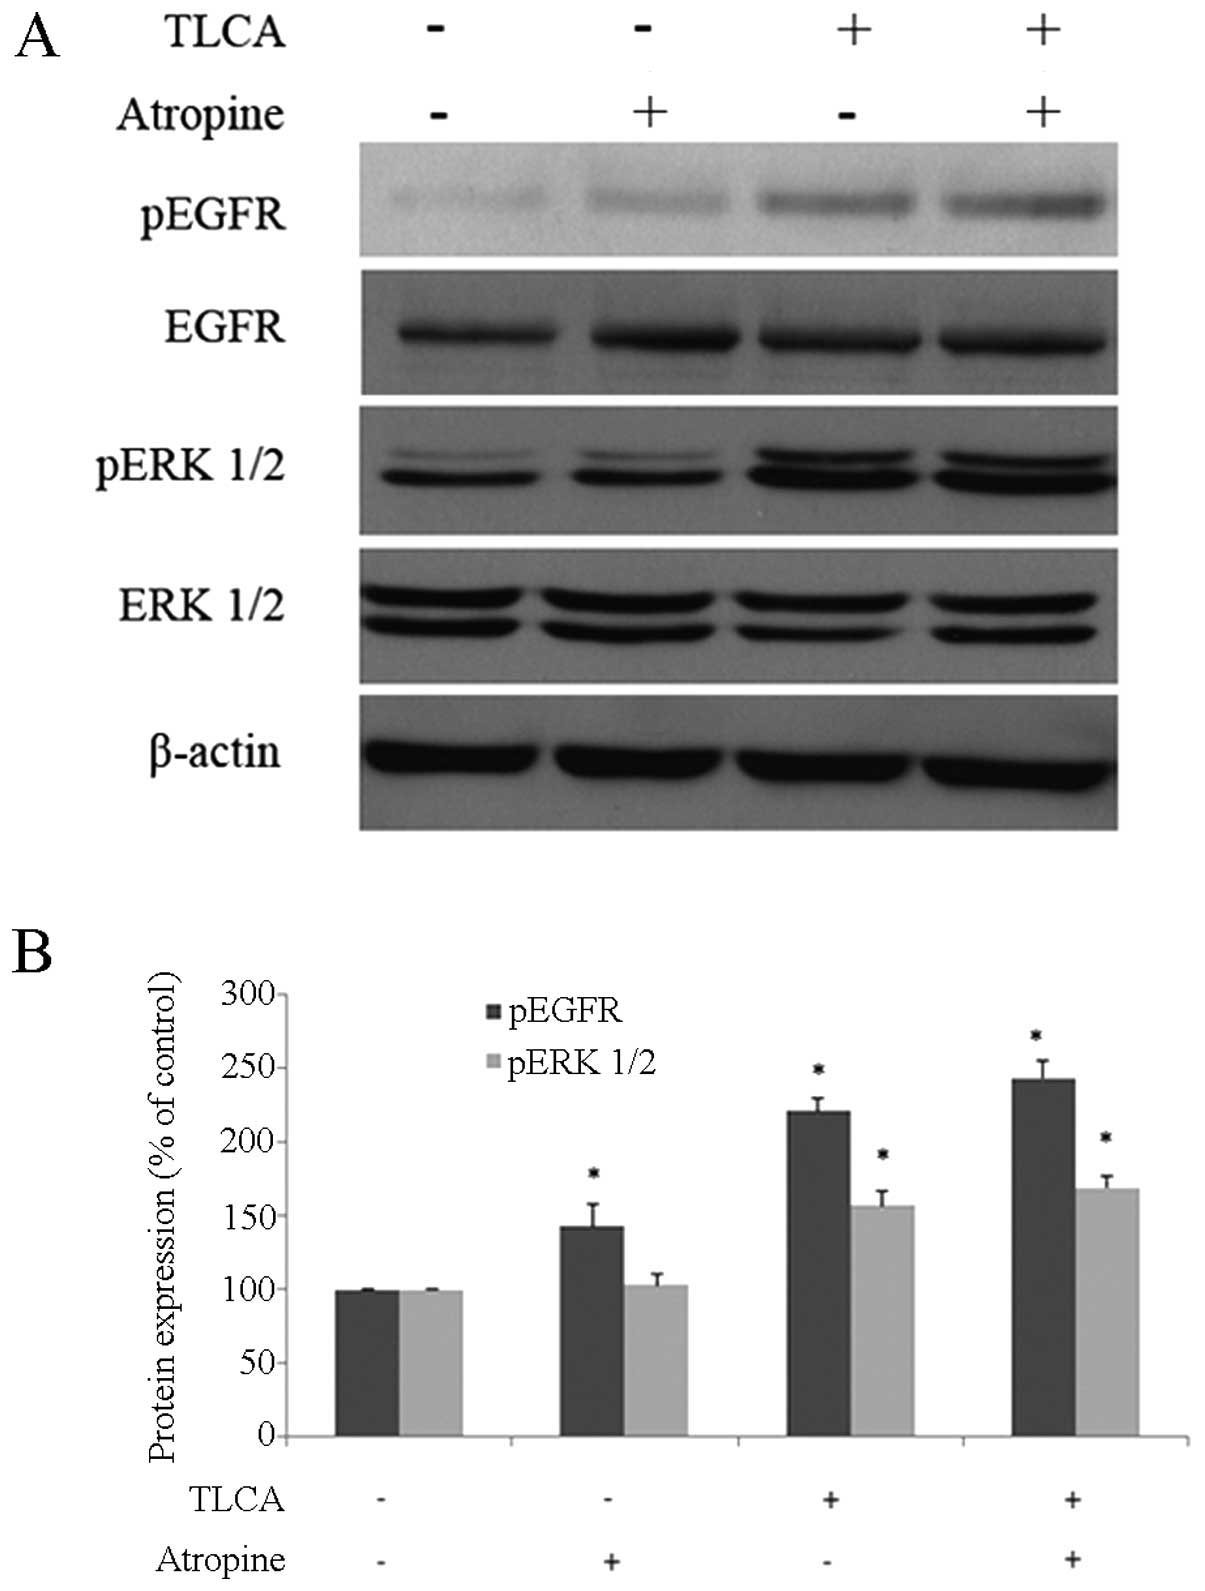
It has been reported that some forms of bile acids,
including DCA, LCA, GDCA, TDCA, GLCA and TLCA, induced growth of
colon cancer cells, through the M3 mAChR-transactived EGFR
signaling pathway (10). Next, we
investigated the role of M3 mAChR in TLCA-induced activation of
EGFR in RMCCA-1. The cells were treated with 10 μM of TLCA or 10 μM
of atropine for 1 h before western blotting. For
combined-treatment, RMCCA-1 cells were pre-treated with 10 μM of
atropine for 30 min before being co-exposed with 10 μM of TLCA. The
result showed that phosphorylated-EGFR significantly increased with
a single-treatment of atropine or TLCA while combined-treatment did
not reduce the activation of EGFR (Fig. 7). Furthermore, the increase of ERK
1/2-phosphorylated form by TLCA was not reduced in the
atropine/TLCA co-treatment group (Fig.
7).
TLCA induces RMCCA-1 cell growth through
activation of EGFR/ERK1/2 signaling pathway
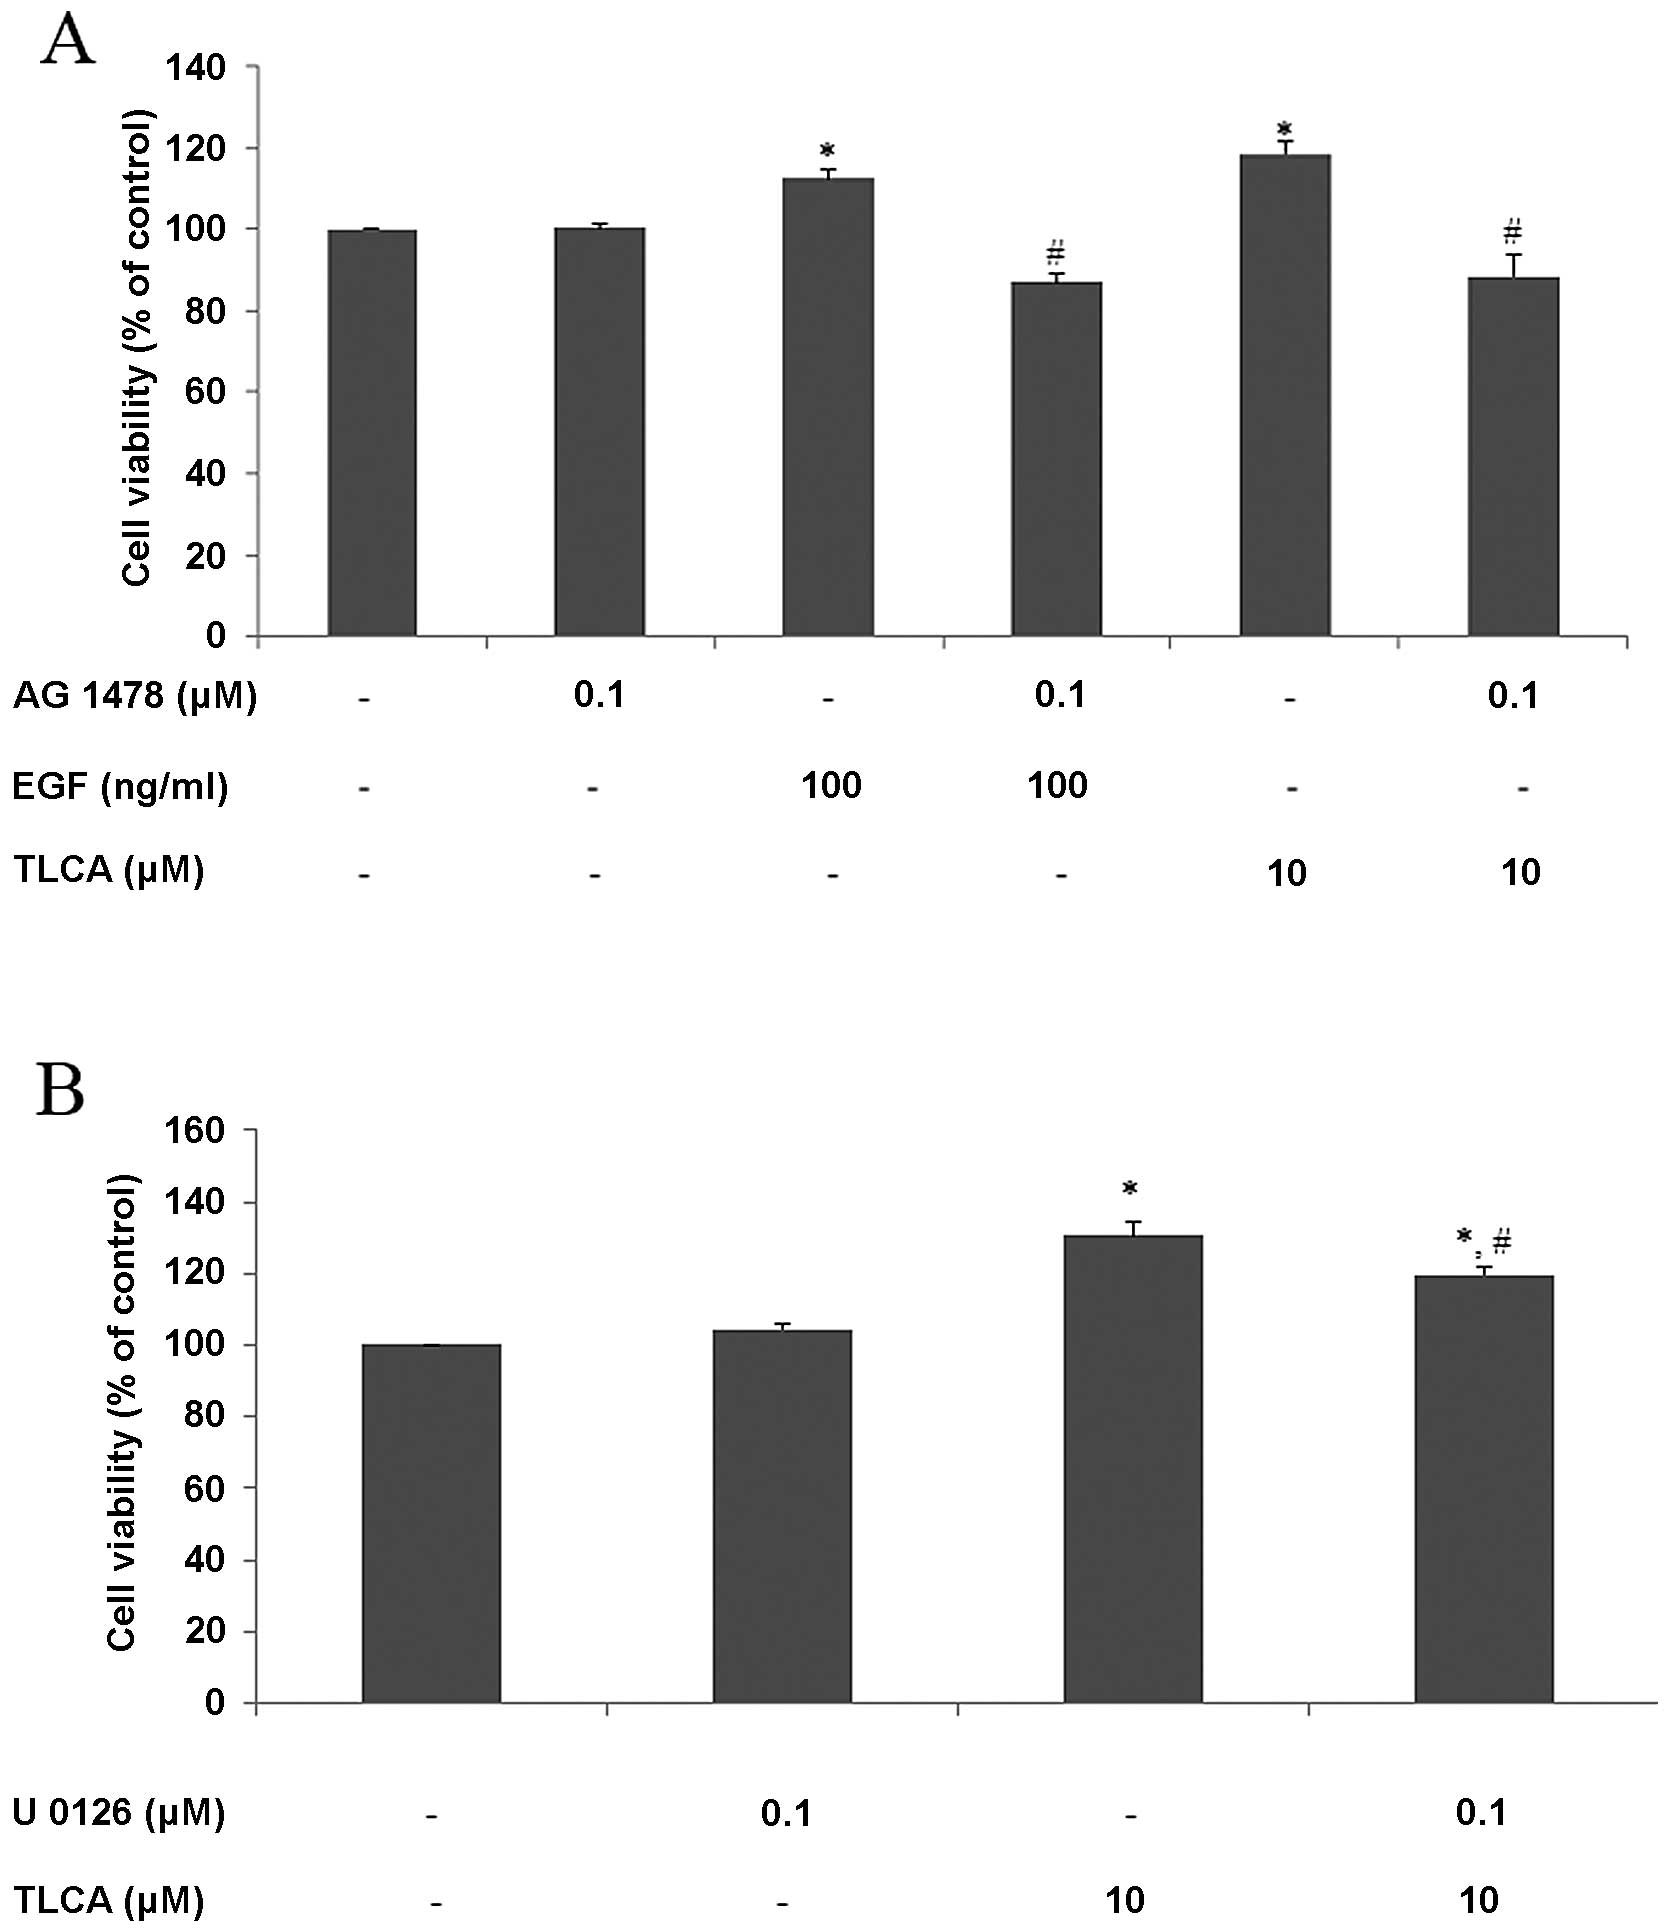
EGFR is a membrane receptor that plays an important
role in regulating cell proliferation and death. The hypothesis
that TLCA induces CCA cell growth through activation of EGFR was
tested using AG 1478, which is a specific inhibitor of EGFR.
RMCCA-1 cells were pretreated with AG 1478 for 30 min before being
treated with EGF or TLCA for 24 h, and cell viability was detected
by PrestoBlue reagent. The results showed that 100 ng/ml of EGF or
10 μM of TLCA increased cell viability to 113 and 118% of control,
respectively. Furthermore, pre- and co-treatment with AG 1478
mitigated growth promoting effects of both EGF and TLCA. Moreover,
AG 1478 by itself did not affect cell viability (Fig. 8A). These results demonstrate that
the activation of EGFR is involved in TLCA-induced RMCCA-1 cell
growth.
To investigate the involvement of MAP kinase pathway
in TLCA-induced CCA cell growth, RMCCA-1 cells were pretreated with
0.1 μM of U 0126, which is a MEK 1/2 inhibitor, for 30 min before
being treated with TLCA for 48 h. The results showed that 0.1 μM of
U 0126 did not affect RMCCA-1 cell viability, but at this
concentration, U 0126 significantly attenuated the effects of
TLCA-induced RMCCA-1 cell viability at TLCA 10 μM (Fig. 8B). These results suggested that MAP
kinase pathway is involved in TLCA-induced RMCCA-1 cell growth.
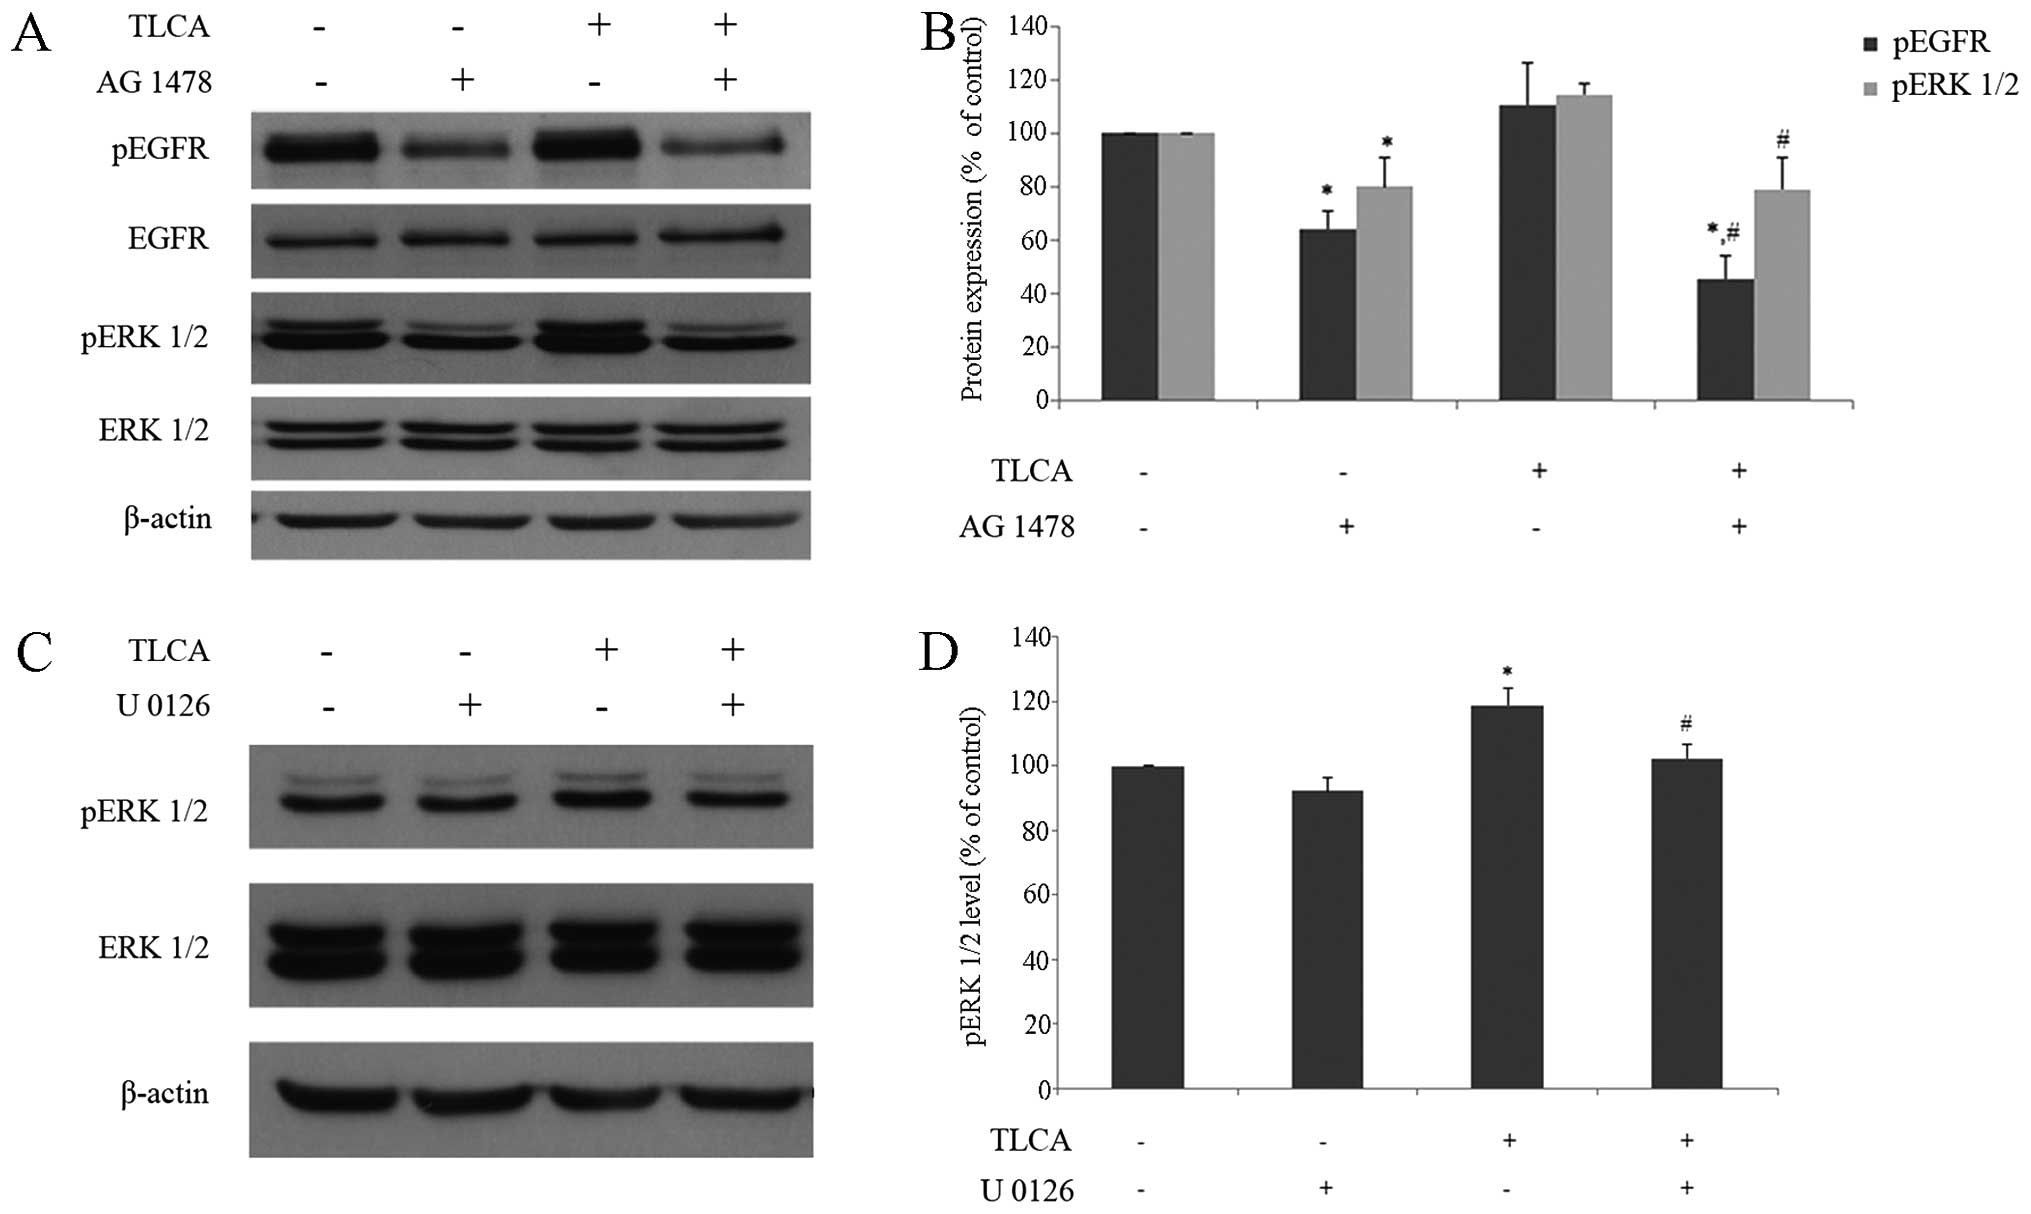
Western blotting of TLCA and/or AG 1478 treated
RMCCA-1 cells was performed in order to investigate the role of
EGFR signaling pathway on TLCA-induced ERK 1/2 activation. For a
single treatment, RMCCA-1 cells were treated with either 10 μM of
TLCA, or 0.1 μM of AG 1478 for 6 h. For combined-treatment, RMCCA-1
cells were pre-treated with 0.1 μM of AG 1478 for 30 min before
being co-exposed with 10 μM of TLCA. The result showed that
phosphorylated-EGFR was increased in TLCA single treatment, whereas
combined-treatment of TLCA with AG 1478 significantly reduced
TLCA-induced phosphorylation of EGFR (Fig. 9B). In addition, the increase of ERK
1/2-phosphorylated form by TLCA was also significantly reduced in
AG 1478/TLCA co-treatment group (Fig.
9B). It should be noted that AG 1478 treatment by itself
dramatically reduced activation of both EGFR and ERK1/2. These
results demonstrated that TLCA induces activation of ERK1/2
signaling pathway in part via EGFR. Furthermore, U 0126 was used to
support the signaling cascade via MAP kinase pathway. RMCCA-1 cells
were treated with TLCA 10 μM and/or U 0126 0.1 μM for 24 h. For
combined-treatment, RMCCA-1 cells were pre-treated with 0.1 μM of U
0126 for 30 min, before being co-exposed with 10 μM of TLCA. The
results show that TLCA significantly increased phosphorylated-ERK
1/2 protein, while combined-treatment of TLCA and U 0126
significantly reduced phosphorylated-ERK 1/2 protein, when compared
with TLCA alone (Fig. 9D). These
results suggested that TLCA induces RMCCA-1 cell growth through MAP
kinase signaling pathway. Collectively, the results imply that EGFR
activated MAP kinase signaling pathway may be involved in
TLCA-induced RMCCA-1 cell growth.
Discussion
The present study provides further understanding of
the potential molecular mechanism underlying the bile acid-induced
bile duct cancer development and progression. We showed that among
the various forms of bile acid, TLCA can induce growth of RMCCA-1
cells via EGFR/ERK1/2 signaling pathway. Importantly, the
functional presence of cholinergic system in CCA plays a certain
role on this growth promoting effect of TLCA.
We found that most primary bile acids, secondary
bile acids and glycine-conjugated bile acids at high concentration
(100 μM) significantly decreased the viability of CCA cells. This
observation is in line with a previous report showing that 100–200
μM of CA, DCA or CDCA inhibited growth of QBC939 cell, which is a
human CCA cell line, by promoting cell apoptosis (23). Dai and colleagues reported that
glycine-conjugated bile acids including GCA, GDCA, and GCDCA at
very high concentrations (400–800 μM) stimulated growth of QBC939
cells (23). In addition,
Werneburg and colleagues reported that 200 μM of DCA induced growth
of KMBC which is a human CCA cell line (24). However, we did not observe the
growth promoting effects of these bile acids in our tested CCA
cells; this may be due to the concentration range in our study
(0.1–100 μM) being far lower than the concentration range in the
above mentioned studies or may be due to the difference in CCA cell
lines used. Among eleven forms of bile acids, we only observed the
growth promoting effect in TLCA-treated RMCCA-1 cells (Table I). Futhermore, the increased number
of the S-phase cells which reflected active cell division together
with the increase in level of cyclin D1, which is a key protein
regulating G1/S transition in cell cycle confirmed the growth
promoting effect of TLCA.
Accumulation of bile acids triggers inflammation and
tumor progression (25, 26). In animal models, bile acid
concentrations were increased 27-fold in liver and 1,400-fold in
serum, after bile duct ligation and remained up to 14 days
(27). Bile acid levels are
altered in many diseases. For example, a pregnant patient who had
an intrahepatic cholestasis was found to have a predominant
increase in cholic acid conjugated with taurine and glycine
(28). Moreover, it has been
reported that the levels of glycine conjugated bile acids are
increased in CCA patients (29).
The exact concentration of TLCA in human liver has not been
reported, but the highest level of TLCA can be found in the
gallbladder and near the ampulla of Vater. Moreover, the
concentration of TLCA in the gallbladder is 0.4 mM, and most TLCA
is excreted in feces: a small amount of TLCA is absorbed back to
enterohepatic circulation (3).
There is a study that reported TLCA concentration of 2.07 pmol/mg
dry weight of rat liver tissue (30). In normal situations, the ratio of
glycine and taurine conjugates is at ~3:1, but in cholestasis
taurine conjugation is increased (2). Moreover, TLCA has been reported to
increase in the serum of cirrhotic patients (31). Therefore, it is possible that the
concentration range of TLCA used in this study may be found in CCA
patients.
It has been documented that M3 mAChR plays an
important role in the differentiation and metastasis of CCA
(18). By using a non-selective
mAChR antagonist, atropine, we found that the activation of mAChR
plays a crucial role in the growth promoting effect of TLCA in
RMCCA-1 cells. In line with a previous colon cancer H508 cell study
which overexpressed M3 mAChR, TLCA was found to interact with M3
mAChR, thereby causing an increase in inositol triphosphate 3
(IP3) and cell proliferation (8). Furthermore, it has been reported that
TLCA can bind with M3 AChR but cannot bind to other types of mAChR
in Chinese hamster ovary (CHO) cells (9). The differential sensitivity of the
CCA cell lines to TLCA-induced cell growth could be explained in
part due to the difference in molecular characteristics of the
different CCA cell lines. The growth promoting effect of TLCA was
not evidenced in HuCCA-1 cells. We found that the cholinergic
components, including CHT, ChAT, AChE, M3 mAChR and α7 nAChR, were
present in both HuCCA-1 and RMCCA-1 cells. The cholinergic
responses to mAChR agonists, including carbachol and Oxo-M were
only evidenced in RMCCA-1 cells. It is reasonable to postulate that
the presence of functional cholinergic system in CCA cells may
explain the different growth promoting response of TLCA. On the
other hand, a previous study in QBC939 cells showed that
pilocarpine, a non-selective mAChR agonist, inhibits cell
proliferation while atropine can reverse this inhibitory effect
(18). This opposite result may
depend on cell types, mutation patterns of mAChR, and experimental
design. It should be emphasized that signaling pathway involving
receptors are in a dynamic state. Therefore, time course of
exposure and the concentration used are important.
It is well documented that cholinergic system plays
an important role in inflammation; the blockage of mAChR produced
anti-inflammation properties in LPS-induced lung inflammation
(32). Furthermore, selective
mAChR antagonists have been used to treat many diseases such as
skin inflammatory disorders, asthma, intestinal inflammation and
systemic inflammation diseases (33). Moreover, our results showed that
COX-2, a key inflammatory marker protein, in these two cell lines
is different. RMCCA-1 showed a low level of COX-2 while HuCCA-1
showed a high level. Therefore, the inflammation background of CCA
may influence the functional cholinergic system which involves the
response of TLCA. However this hypothesis remains inconclusive and
needs to be further investigated.
There are studies indicating that bile acids
stimulate cell signaling and cell growth through the EGFR (4). It has been reported that DCA can
induce caudal homeobox gene 2 (CDX2) through activation of EGFR in
human mucosal epithelial SEG-1 cells (34). Moreover, there are reports of bile
acids, including DCA, CDCA and TCDCA, induced cell growth and EGFR
activation by the transforming growth factor-α (TGF-α),
ligand-dependent mechanism in human CCA KMBC and normal
cholangiocyte H69 cell lines (24). By using the specific EGFR inhibitor
AG1478, we made it clear that EGFR/ERK1/2 signaling pathway is
involved in the growth promoting effect of TLCA in RMCCA-1 cells.
This finding is related to a previous report by Cheng and Raufman
showing that conjugated secondary bile acids, including TLCA, TDCA
and GDCA stimulate colon cancer H508 cell proliferation by
activation of EGFR and post-EGFR/ERK1/2 signaling pathway (4).
It has been reported that TLCA induced growth of
colon cancer cells through the M3 mAChR-transactived EGFR signaling
pathway (10). Our study showed
that atropine could not prevent the phosphorylation of EGFR and
ERK1/2-induced by TLCA at 1 h of exposure (Fig. 7), suggesting that M3 mAChR may not
transactivate EGFR in RMCCA-1 cells. However, both atropine and
AG1478 completely inhibited the growth stimulating effect of TLCA
(Figs. 6 and 8). Therefore, the transactivation of EGFR
by mAChR cannot be ruled out. More selective M3 mAChR antagonist or
time course studies on the effect of atropine (a non-selective
mAChR antagonist) on the activation of EGFR and ERK1/2 are
required.
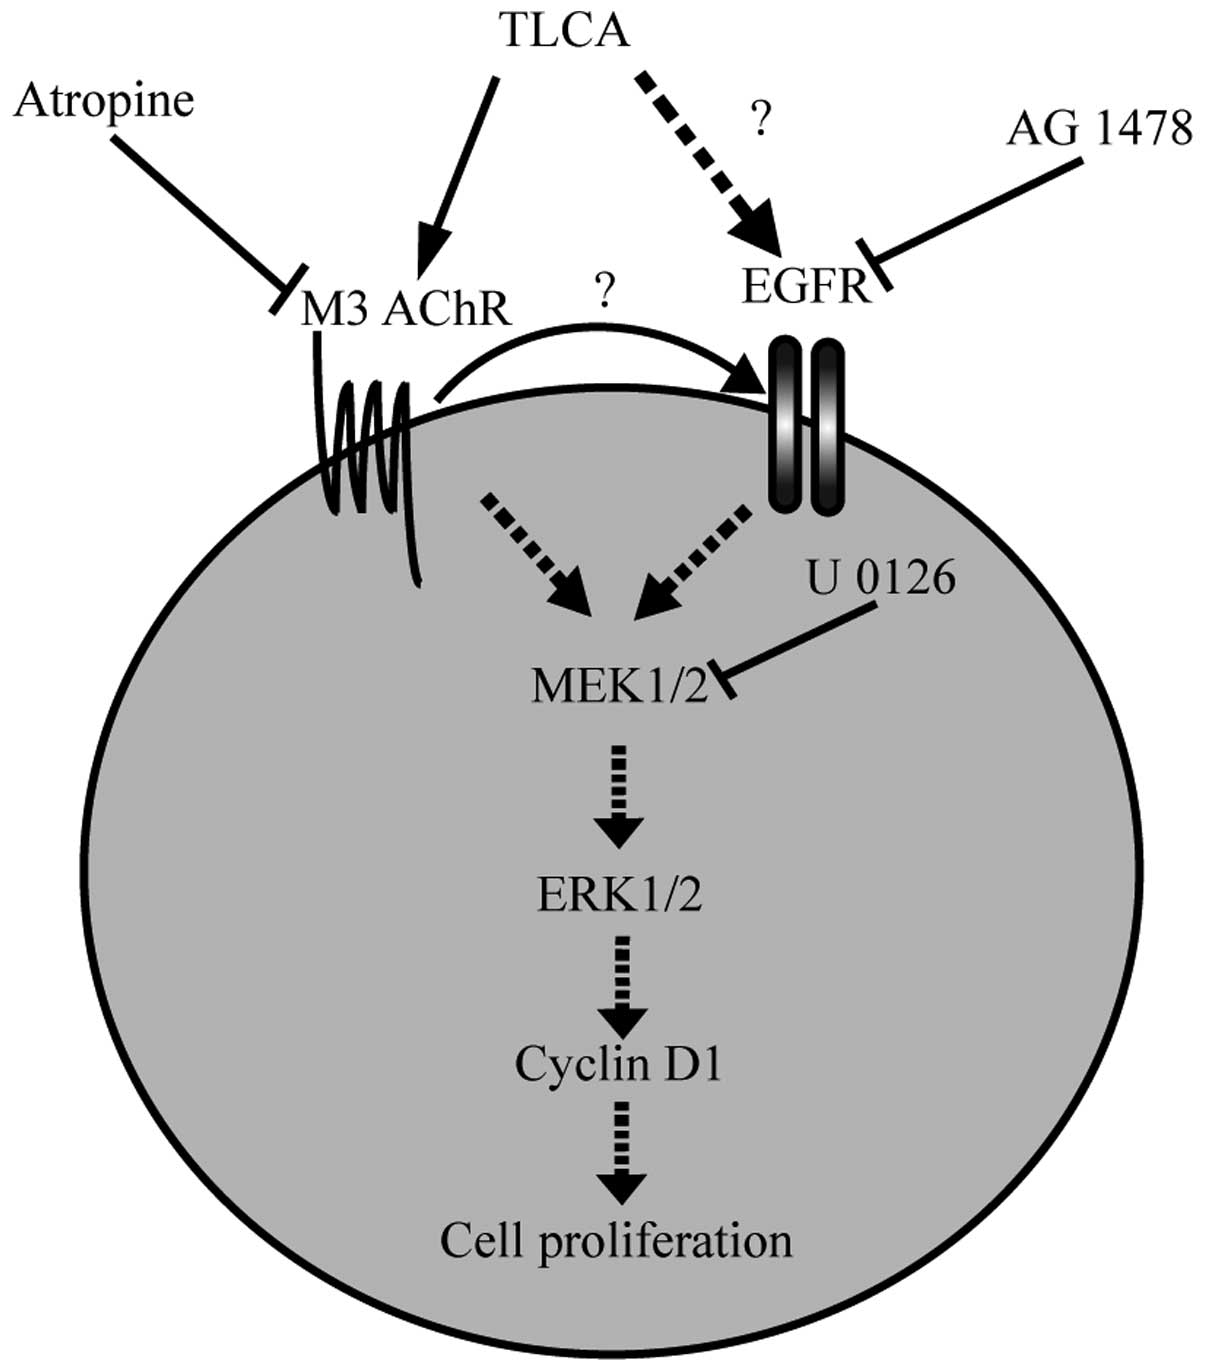
The present study provides evidence of the TLCA
mechanism that activates CCA cell proliferation and which may
provide a basis for therapeutic strategies to treat CCA patients.
The results of the study suggest that TLCA induces the
proliferation of CCA via mAChR and EGFR/ERK1/2 signaling pathway
(Fig. 10). Moreover, the presence
of functional cholinergic system and inflammation background of CCA
plays a crucial role in the growth promoting effect of TLCA.
Acknowledgements
This study was supported by the Center of Excellence
on Environmental Health and Toxicology, Chulabhorn Graduate
Institute and Chulabhorn Research Institute. We would like to
express our great appreciation to Ms. Kanjana Chaiyot for her
technical assistance on cell culture.
References
|
1
|
Patel T: Cholangiocarcinoma -
controversies and challenges. Nat Rev Gastroenterol Hepatol.
8:189–200. 2011. View Article : Google Scholar : PubMed/NCBI
|
|
2
|
Raufman JP, Cheng K and Zimniak P:
Activation of muscarinic receptor signaling by bile acids:
Physiological and medical implications. Dig Dis Sci. 48:1431–1444.
2003. View Article : Google Scholar : PubMed/NCBI
|
|
3
|
Bernstein H, Bernstein C, Payne CM,
Dvorakova K and Garewal H: Bile acids as carcinogens in human
gastrointestinal cancers. Mutat Res. 589:47–65. 2005. View Article : Google Scholar : PubMed/NCBI
|
|
4
|
Cheng K and Raufman JP: Bile acid-induced
proliferation of a human colon cancer cell line is mediated by
transactivation of epidermal growth factor receptors. Biochem
Pharmacol. 70:1035–1047. 2005. View Article : Google Scholar : PubMed/NCBI
|
|
5
|
Fujino T, Takeuchi A, Maruko-Ohtake A,
Ohtake Y, Satoh J, Kobayashi T, Tanaka T, Ito H, Sakamaki R,
Kashimura R, et al: Critical role of farnesoid X receptor for
hepatocellular carcinoma cell proliferation. J Biochem.
152:577–586. 2012. View Article : Google Scholar : PubMed/NCBI
|
|
6
|
Liu R, Zhao R, Zhou X, Liang X, Campbell
DJ, Zhang X, Zhang L, Shi R, Wang G, Pandak WM, et al: Conjugated
bile acids promote cholangiocarcinoma cell invasive growth via
activation of sphingosine 1-phosphate receptor 2. Hepatology.
60:908–918. 2014. View Article : Google Scholar : PubMed/NCBI
|
|
7
|
Casaburi I, Avena P, Lanzino M, Sisci D,
Giordano F, Maris P, Catalano S, Morelli C and Andò S:
Chenodeoxycholic acid through a TGR5-dependent CREB signaling
activation enhances cyclin D1 expression and promotes human
endometrial cancer cell proliferation. Cell Cycle. 11:2699–2710.
2012. View
Article : Google Scholar : PubMed/NCBI
|
|
8
|
Cheng K, Chen Y, Zimniak P, Raufman JP,
Xiao Y and Frucht H: Functional interaction of lithocholic acid
conjugates with M3 muscarinic receptors on a human colon cancer
cell line. Biochim Biophys Acta. 1588:48–55. 2002. View Article : Google Scholar : PubMed/NCBI
|
|
9
|
Raufman JP, Chen Y, Cheng K, Compadre C,
Compadre L and Zimniak P: Selective interaction of bile acids with
muscarinic receptors: A case of molecular mimicry. Eur J Pharmacol.
457:77–84. 2002. View Article : Google Scholar : PubMed/NCBI
|
|
10
|
Shah N, Khurana S, Cheng K and Raufman JP:
Muscarinic receptors and ligands in cancer. Am J Physiol Cell
Physiol. 296:C221–C232. 2009. View Article : Google Scholar :
|
|
11
|
Trombino S, Bisio A, Catassi A, Cesario A,
Falugi C and Russo P: Role of the non-neuronal human cholinergic
system in lung cancer and mesothelioma: Possibility of new
therapeutic strategies. Curr Med Chem Anticancer Agents. 4:535–542.
2004. View Article : Google Scholar : PubMed/NCBI
|
|
12
|
Español AJ, de la Torre E, Fiszman GL and
Sales ME: Role of non-neuronal cholinergic system in breast cancer
progression. Life Sci. 80:2281–2285. 2007. View Article : Google Scholar : PubMed/NCBI
|
|
13
|
Belo A, Cheng K, Chahdi A, Shant J, Xie G,
Khurana S and Raufman JP: Muscarinic receptor agonists stimulate
human colon cancer cell migration and invasion. Am J Physiol
Gastrointest Liver Physiol. 300:G749–G760. 2011. View Article : Google Scholar : PubMed/NCBI
|
|
14
|
Parnell EA, Calleja-Macias IE, Kalantari
M, Grando SA and Bernard HU: Muscarinic cholinergic signaling in
cervical cancer cells affects cell motility via ERK1/2 signaling.
Life Sci. 91:1093–1098. 2012. View Article : Google Scholar : PubMed/NCBI
|
|
15
|
Rayford W, Noble MJ, Austenfeld MA, Weigel
J, Mebust WK and Shah GV: Muscarinic cholinergic receptors promote
growth of human prostate cancer cells. Prostate. 30:160–166. 1997.
View Article : Google Scholar : PubMed/NCBI
|
|
16
|
Paleari L, Grozio A, Cesario A and Russo
P: The cholinergic system and cancer. Semin Cancer Biol.
18:211–217. 2008. View Article : Google Scholar : PubMed/NCBI
|
|
17
|
Schuller HM: Is cancer triggered by
altered signalling of nicotinic acetylcholine receptors? Nat Rev
Cancer. 9:195–205. 2009. View
Article : Google Scholar : PubMed/NCBI
|
|
18
|
Feng YJ, Zhang BY, Yao RY and Lu Y:
Muscarinic acetylcholine receptor M3 in proliferation and
perineural invasion of cholangiocarcinoma cells. Hepatobiliary
Pancreat Dis Int. 11:418–423. 2012. View Article : Google Scholar : PubMed/NCBI
|
|
19
|
Fava G, Marzioni M, Francis H, Glaser S,
Demorrrow S, Ueno Y, Benedetti A and Alpini G: Novel interaction of
bile acid and neural signaling in the regulation of cholangiocyte
function. Hepatol Res. 37(Suppl 3): S420–S429. 2007. View Article : Google Scholar : PubMed/NCBI
|
|
20
|
Sirisinha S, Tengchaisri T, Boonpucknavig
S, Prempracha N, Ratanarapee S and Pausawasdi A: Establishment and
characterization of a cholangiocarcinoma cell line from a Thai
patient with intrahepatic bile duct cancer. Asian Pac J Allergy
Immunol. 9:153–157. 1991.PubMed/NCBI
|
|
21
|
Rattanasinganchan P, Leelawat K,
Treepongkaruna SA, Tocharoentanaphol C, Subwongcharoen S,
Suthiphongchai T and Tohtong R: Establishment and characterization
of a cholangiocarcinoma cell line (RMCCA-1) from a Thai patient.
World J Gastroenterol. 12:6500–6506. 2006.PubMed/NCBI
|
|
22
|
LeSage G, Alvaro D, Benedetti A, Glaser S,
Marucci L, Baiocchi L, Eisel W, Caligiuri A, Phinizy JL, Rodgers R,
et al: Cholinergic system modulates growth, apoptosis, and
secretion of cholangiocytes from bile duct-ligated rats.
Gastroenterology. 117:191–199. 1999. View Article : Google Scholar : PubMed/NCBI
|
|
23
|
Dai J, Wang H, Dong Y, Zhang Y and Wang J:
Bile acids affect the growth of human cholangiocarcinoma via NF-κB
pathway. Cancer Invest. 31:111–120. 2013. View Article : Google Scholar : PubMed/NCBI
|
|
24
|
Werneburg NW, Yoon JH, Higuchi H and Gores
GJ: Bile acids activate EGF receptor via a TGF-alpha-dependent
mechanism in human cholangiocyte cell lines. Am J Physiol
Gastrointest Liver Physiol. 285:G31–G36. 2003. View Article : Google Scholar : PubMed/NCBI
|
|
25
|
Degirolamo C, Modica S, Palasciano G and
Moschetta A: Bile acids and colon cancer: Solving the puzzle with
nuclear receptors. Trends Mol Med. 17:564–572. 2011. View Article : Google Scholar : PubMed/NCBI
|
|
26
|
Renga B, Mencarelli A, Cipriani S, D’Amore
C, Carino A, Bruno A, Francisci D, Zampella A, Distrutti E and
Fiorucci S: The bile acid sensor FXR is required for
immune-regulatory activities of TLR-9 in intestinal inflammation.
PLoS One. 8:e544722013. View Article : Google Scholar : PubMed/NCBI
|
|
27
|
Zhang Y, Hong JY, Rockwell CE, Copple BL,
Jaeschke H and Klaassen CD: Effect of bile duct ligation on bile
acid composition in mouse serum and liver. Liver Int. 32:58–69.
2012. View Article : Google Scholar :
|
|
28
|
Tribe RM, Dann AT, Kenyon AP, Seed P,
Shennan AH and Mallet A: Longitudinal profiles of 15 serum bile
acids in patients with intrahepatic cholestasis of pregnancy. Am J
Gastroenterol. 105:585–595. 2010. View Article : Google Scholar
|
|
29
|
Sharif AW, Williams HR, Lampejo T, Khan
SA, Bansi DS, Westaby D, Thillainayagam AV, Thomas HC, Cox IJ and
Taylor-Robinson SD: Metabolic profiling of bile in
cholangiocarcinoma using in vitro magnetic resonance spectroscopy.
HPB (Oxford). 12:396–402. 2010. View Article : Google Scholar
|
|
30
|
Bobeldijk I, Hekman M, de Vries-van der
Weij J, Coulier L, Ramaker R, Kleemann R, Kooistra T, Rubingh C,
Freidig A and Verheij E: Quantitative profiling of bile acids in
biofluids and tissues based on accurate mass high resolution
LC-FT-MS: Compound class targeting in a metabolomics workflow. J
Chromatogr B Analyt Technol Biomed Life Sci. 871:306–313. 2008.
View Article : Google Scholar : PubMed/NCBI
|
|
31
|
Greco AV and Mingrone G: Serum bile acid
concentrations in mild liver cirrhosis. Clin Chim Acta.
221:183–189. 1993. View Article : Google Scholar : PubMed/NCBI
|
|
32
|
Xu ZP, Yang K, Xu GN, Zhu L, Hou LN, Zhang
WH, Chen HZ and Cui YY: Role of M3 mAChR in in vivo and in vitro
models of LPS-induced inflammatory response. Int Immunopharmacol.
14:320–327. 2012. View Article : Google Scholar : PubMed/NCBI
|
|
33
|
Sales ME: Muscarinic receptors as targets
for anti-inflammatory therapy. Curr Opin Investig Drugs.
11:1239–1245. 2010.PubMed/NCBI
|
|
34
|
Avissar NE, Toia L, Hu Y, Watson TJ, Jones
C, Raymond DP, Matousek A and Peters JH: Bile acid alone, or in
combination with acid, induces CDX2 expression through activation
of the epidermal growth factor receptor (EGFR). J Gastrointest
Surg. 13:212–222. 2009. View Article : Google Scholar
|