Introduction
Colorectal cancer (CRC) is one of the leading causes
of cancer-related mortality worldwide (1). According to the National Cancer
Institute (Surveillance, Epidemiology and End Results Program), the
Centers for Disease Control and Prevention (National Program of
Cancer Registries), the North American Association of Central
Cancer Registries and the National Center for Health Statistics,
~132,700 new cases of large bowel cancer are diagnosed annually in
the USA, of which 93,090 are colon and the remainder rectal
cancers. A total of ~49,700 Americans succumb to CRC annually,
accounting for ~8% of all cancer deaths (2). The mortality rates from CRC have
declined since the 1980s in the USA and in certain western
countries. However, the mortality rates continue to increase in
less developed countries with limited resources for healthcare,
particularly in Central and South America and Eastern Europe
(3–5).
Even with the current diagnostic tools and screening programs, due
to the high incidence rates of CRC, particularly in underdeveloped
countries, there remains the need to develop cost-effective and
convenient early diagnostic strategies, such as molecular
biomarkers, to reduce the mortality rates of this disease.
Paracellular tight junctions regulate paracellular
permeability and play a critical role in apical cell-to-cell
adhesion and epithelial cell polarity (6). Claudins (CLDNs) are important proteins
in this structure. There are currently ≥24 known members of the
CLDN family (7,8). CLDNs were first named by Japanese
researchers Tsukita and Furuse in 1998. The name ‘claudin’ is
derived from the Latin word claudere, which means ‘to
close’, suggesting the barrier role of these proteins (9).
As regards the molecular biology of cancer, it has
been demonstrated that CLDNs are abnormally regulated and,
therefore, are promising molecular targets for cancer diagnosis,
prognosis and therapy. CLDN1 and CLDN7 are major building blocks of
paracellular adhesion molecules. The significance of these tight
junction proteins for local invasion by neoplastic cells and
development of metastasis has been confirmed by numerous studies
over the last decade and their decreased expression in CRC appears
to significantly affect cell proliferation, motility, invasion and
antitumor immune response (10).
In this study, we aimed to investigate the
association between clinicopathological findings and the serum
levels of CLDN1 and CLDN7 in CRC. To the best of our knowledge,
this is the first study using ELISA, which is a more practical and
cost-effective technique compared with immunohistochemistry (IHC)
or polymerase chain reaction (PCR) analysis for measuring these
CLDNs in CRC.
Materials and methods
Study design and eligibility
criteria
Serum samples were obtained from 140 consecutive
patients with CRC who were referred to the Institute of Oncology of
the Istanbul University and the Istanbul Bakirköy Dr Sadi Konuk
Training and Research Hospital (Istanbul, Turkey) between 2011 and
2014. All the patients were staged using the seventh edition of the
American Joint Committee on Cancer tumor-node-metastasis system by
radiological and pathological criteria (11).
All the patients were treated using a
multidisciplinary approach. Patients with colon cancer who had
undergone surgery including segmental colon resection were treated
with adjuvant chemotherapy (CTx) according to their stage. Patients
with rectal cancer who received neoadjuvant radiochemotherapy
(RCTx) or radiotherapy (RT) had undergone low anterior resection or
abdominoperineal resection. Certain patients had undergone
palliative surgery and stage IV patients received palliative CTx,
with or without targeted therapy (bevacizumab or cetuximab). The
pretreatment evaluation included detailed clinical history and
physical examination with a series of biochemistry tests and
complete blood cell counts. Selection for treatment required an
Eastern Cooperative Oncology Group performance status (PS) score of
0–2, and adequate bone marrow (absolute neutrophil count
>1,500/µl and platelet count >100,000/µl), cardiac, renal and
hepatic functions. The patients were treated with various CTx
regimens, including single-agent or combination therapy. Regimens
of single-agent or combination CTx were selected according to the
PS of the patients and extent of the disease. The patients received
one of the following treatment regimens: Simplified LV5FU2
(leucovorin 400 mg/m2, followed by 5-fluorouracil as a
400 mg/m2 bolus and a 2,400 mg/m2 infusion
over 46 h every 2 weeks), capecitabine (1,000
mg/m2/b.i.d., p.o. for 14 days of each 21-day cycle),
modified FOLFOX regimen (simplified LV5FU2 regimen plus oxaliplatin
85 mg/m2 every 2 weeks), FOLFIRI (simplified LV5FU2
regimen plus irinotecan 180 mg/m2 every 2 weeks), XELOX
(capecitabine 1,000 mg/m2/b.i.d., p.o. for 14 days plus
oxaliplatin 130 mg/m2 every 3 weeks), and XELIRI
(capecitabine 1,000 mg/m2/b.i.d., p.o. for 14 days plus
irinotecan 240 mg/m2 every 3 weeks). Bevacizumab was
administered at a dose schedule of either 5 mg/kg every 2 weeks, or
7.5 mg/kg every 3 weeks. Cetuximab 500 mg/m2 was
administered intravenously every 2 weeks.
All the patients had undergone pretreatment imaging
of primary tumors with magnetic resonance imaging (MRI) or computed
tomography (CT). For patients with evaluable imaging studies prior
to and following treatment, radiological response was recorded
according to the Response Evaluation Criteria in Solid Tumors,
version 1.1, and classified as complete response (CR), partial
response (PR), stable disease (SD), or progressive disease (PD)
(12). The tumor response after 2
months of CTx was used for statistical analysis. Follow-up for
metastatic disease included clinical and laboratory tests, and CT
or MRI, depending on which imaging method was used at baseline, and
performed at 8-week intervals during CTx or every 12 weeks for
patients receiving no anticancer treatment. Patients with either CR
or PR were classified as responders, whereas patients with SD or PD
were considered as non-responders.
This study was approved by the Institutional Review
Board of the Institute of Oncology, Istanbul University. Baseline
demographic, clinical and laboratory data including age, gender,
PS, tumor marker levels, KRAS mutation status and treatment
details, were retrospectively collected for all patients using
uniform database templates to ensure consistent data collection.
The comorbidities of the patients mainly included cardiac and
metabolic diseases.
The control group consisted of 40 age- and
gender-matched healthy controls were age and gender matched to the
patients. with no previous history of malignancy or autoimmune
disorders. Blood samples were obtained from CRC patients at first
admission, 1 month after surgery and 2 weeks prior to adjuvant or
palliative CTx. Blood samples from healthy controls were collected
into dry tubes and serum was separated from cellular elements by
centrifugation (at 1,788 × g) within 30 min after the blood samples
were stored at −80°C until analysis. All the samples were collected
following approval by the Institutional Review Board and provision
of written informed consent by all the participants.
Measurement of serum CLDN1 and CLDN7
levels
A double-antibody sandwich ELISA was used to
determine the levels of CLDN1 and CLDN7 (cat. nos. YHB0737Hu and
YHB0720Hu, respectively; YH Biosearch Laboratory, Shanghai, China)
in the samples. in the samples. The undiluted serum samples and
standards were added to the wells, which were pre-coated with human
CLDN1 and CLDN7 monoclonal antibody against human CLDN1 and CLDN7.
Then, the anti-CLDN1 and anti-CLDN7 antibodies labeled with biotin
and the streptavidin-horseradish peroxidase conjugate were added to
the wells to form an immune complex. After incubation at 37°C for 1
h, the unbound material was washed away with the diluted washing
concentrate provided by the kit. Chromogen TMB (3,3′,
5,5;-tetramethylbenzidine) solution was added as the substrate for
HRP and incubated at 37°C for 10 min (protected from light) for the
conversion of the colorless solution to a blue solution, the
intensity of which was proportional to the amount of CLDN1 and
CLDN7 in the sample. Under the effect of the acidic stop solution,
the color turned to yellow and the colored reaction product was
measured using an automated ELISA microplate reader (ChroMate®
4300; Awareness Technology, Inc., Palm City, FL, USA) at 450 nm.
The results were expressed as ng/ml.
Statistical analysis
IBM SPSS software for Windows, version 21.0 (IBM
Corp., Armonk, NY, USA) was used for data analysis. Continuous
variables were categorized using median values as the cut-off
point. The Chi-square test or one-way analysis of variance were
used for group comparison of categorical variables, and the
Mann-Whitney U test or Kruskall-Wallis test were used for
comparison of continuous variables. The Spearman's rank order
correlation was used for correlation analysis. Overall survival
(OS) was calculated from the date of first admission to
disease-related death or date of last contact with the patient or
any family member. Progression-free survival (PFS) was calculated
from the date of admission to the date of first radiographic
evidence of disease progression, with/without elevated serum tumor
marker levels. The Kaplan-Meier method was used for the estimation
of survival distribution and differences in PFS and OS were
assessed by the log-rank statistics. All the statistical tests were
two-sided and P<0.05 was considered to indicate a statistically
significant difference.
Results
Patient characteristics
A total of 140 patients who were pathologically
diagnosed with CRC between May, 2011 and August, 2014, were
included in the present study. The baseline demographic and
histopathological/laboratory characteristics of the patients are
summarized in Table I. The median age
of the patients was 60 years (range, 24–84 years), with a male
predominance (n=96, 69%). A total of 43 patients had family history
of cancer, including 12 lung cancers and 14 CRCs. The tumor
localization was in the rectum in 59 (42%) and in the colon in 81
(58%) patients (right colon, n=17; hepatic flexure, n=5; transverse
colon, n=5; descending colon, n=13; splenic flexure, n=1; sigmoid
colon, n=37; multiple synchronous colon tumors, n=3; and
rectosigmoid junction tumors, n=6). The most frequent metastatic
sites were the liver (n=40, 67.8%) and the peritoneum (n=17,
28.8%). The rate of synchronous (n=34) and metachronous metastasis
(n=25) was 57.6 and 42.4%, respectively. Of the 37 patients with
rectal cancer who received neoadjuvant treatment, 28 received
fluoropyrimidine-based RCTx, whereas 9 received short-course RT. A
total of 71 patients who were treated with adjuvant CTx received
one of the following treatment regimens: Simplified
LV5FU2/capecitabine (n=14), mFOLFOX regimen (n=26), and XELOX
(n=31). Palliative CTx included oxaliplatin-based or
irinotecan-based combination CTx regimens and single-agent
fluoropyrimidine in 24, 22, and 9 patients, respectively.
Bevacizumab was administered to 36 patients, whereas 15 patients
received cetuximab as the targeted agent. Response to CTx was
observed in 31% of the 55 metastatic patients who received
palliative CTx.
 | Table I.Patient and disease
characteristics. |
Table I.
Patient and disease
characteristics.
| Variables | n |
|---|
| No. of patients | 140 |
| Age, years |
|
| Median
(range) | 60 (24–84) |
| Gender |
|
|
Male/female | 96/44 |
| Performance
statusa |
|
|
0/1/2/3 | 68/61/7/1 |
|
Smokinga |
|
|
Yes/no | 61/66 |
| Alcohol
intakea |
|
|
Yes/no | 26/99 |
|
Comorbiditya |
|
|
Yes/no | 56/79 |
| Obstruction |
|
|
Yes/no | 17/123 |
| Type of
surgery |
|
|
Colectomy | 56 |
| Low
anterior resection | 36 |
|
Abdominoperineal
resection | 13 |
|
Palliative | 11 |
| Pathological T
stageb |
|
|
0/1/2/3/4 | 9/2/12/45/10 |
| Pathological N
stageb |
|
|
0/1/2 | 42/18/14 |
| Pathological
stage |
|
|
2/3/4 | 17/64/59 |
| Tumor location |
|
|
Colon/rectum | 81/59 |
| Response to
CTxc |
|
|
CR/PR/SD/PD/unknown | 2/15/10/24/4 |
|
Metastasisd |
|
|
Yes/no | 59/81 |
| Histology |
|
|
Adenocarcinoma/mucinous
Ca | 129/11 |
| Grade of
differentiationb |
|
|
1/2/3 | 8/56/6 |
| Lymphatic
invasionb |
|
|
Yes/no | 30/18 |
| Vascular
invasionb |
|
|
Yes/no | 16/30 |
| Perineural
invasionb |
|
|
Yes/no | 18/28 |
| Regression
scoree |
|
|
1/2/3/4 | 1/12/4/8 |
| KRAS mutation
statusc |
|
|
Mutant/wild-type | 24/28 |
| Lactate
dehydrogenasea (cut-off,
450 IU/l) |
|
|
Normal/high | 97/16 |
|
Albumina
(cut-off, 4 gr/dl) |
|
|
Normal/low | 54/58 |
| Carcinoembryonic
antigena (cut-off, 5
ng/ml) |
|
|
Normal/high | 78/17 |
| Carbohydrate
antigen 19-9a (cut-off,
38 U/ml) |
|
|
Normal/high | 81/28 |
Comparison of CLDN1 and CLDN7 levels
between CRC patients and controls
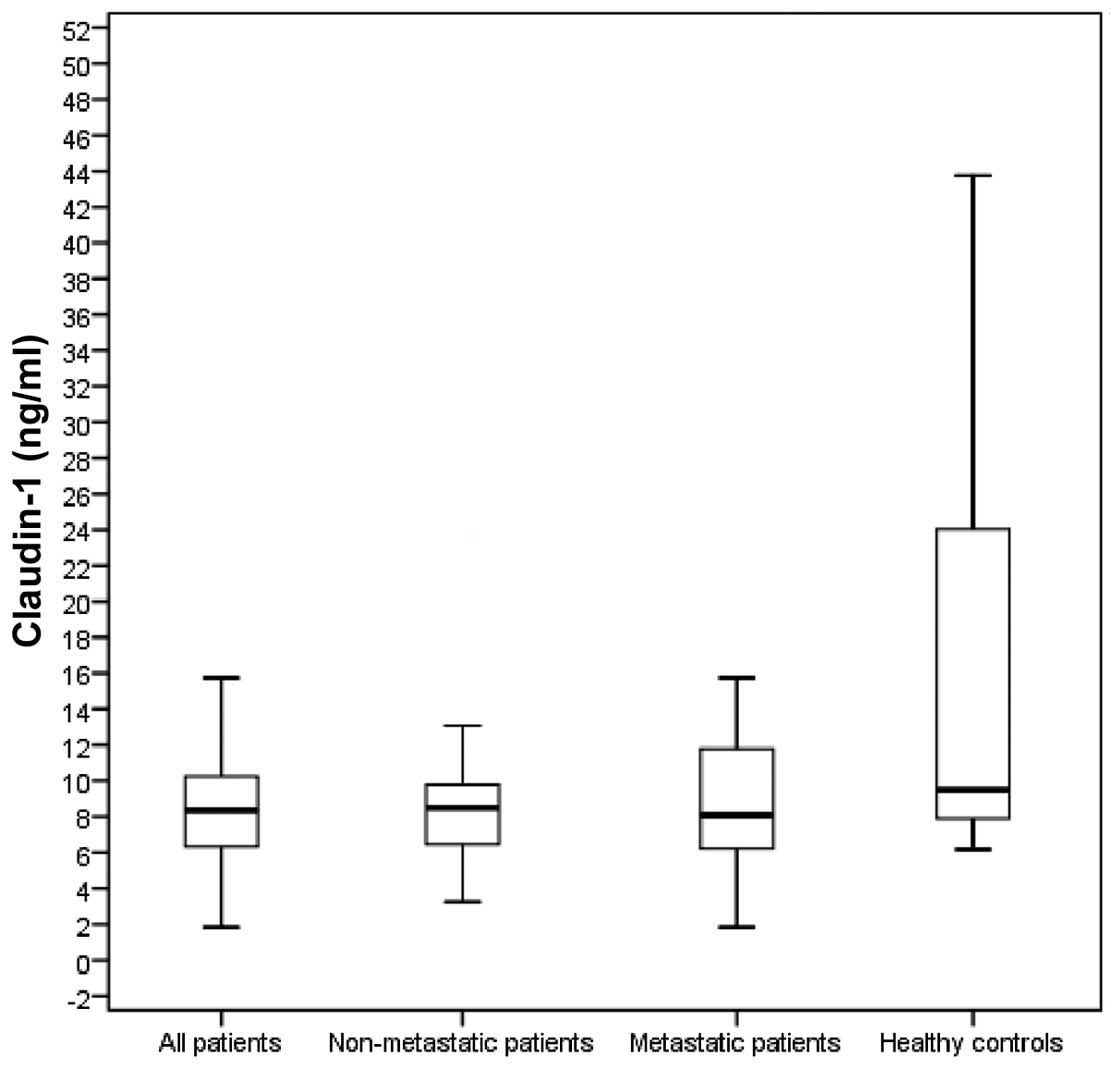
The levels of serum CLDN1 and CLDN7 of all CRC
patients and healthy controls are presented in Table II. The baseline serum CLDN1 levels
were significantly lower in all the patients compared with those in
the control group (8.4 vs. 9.5 ng/ml, respectively; P=0.005). The
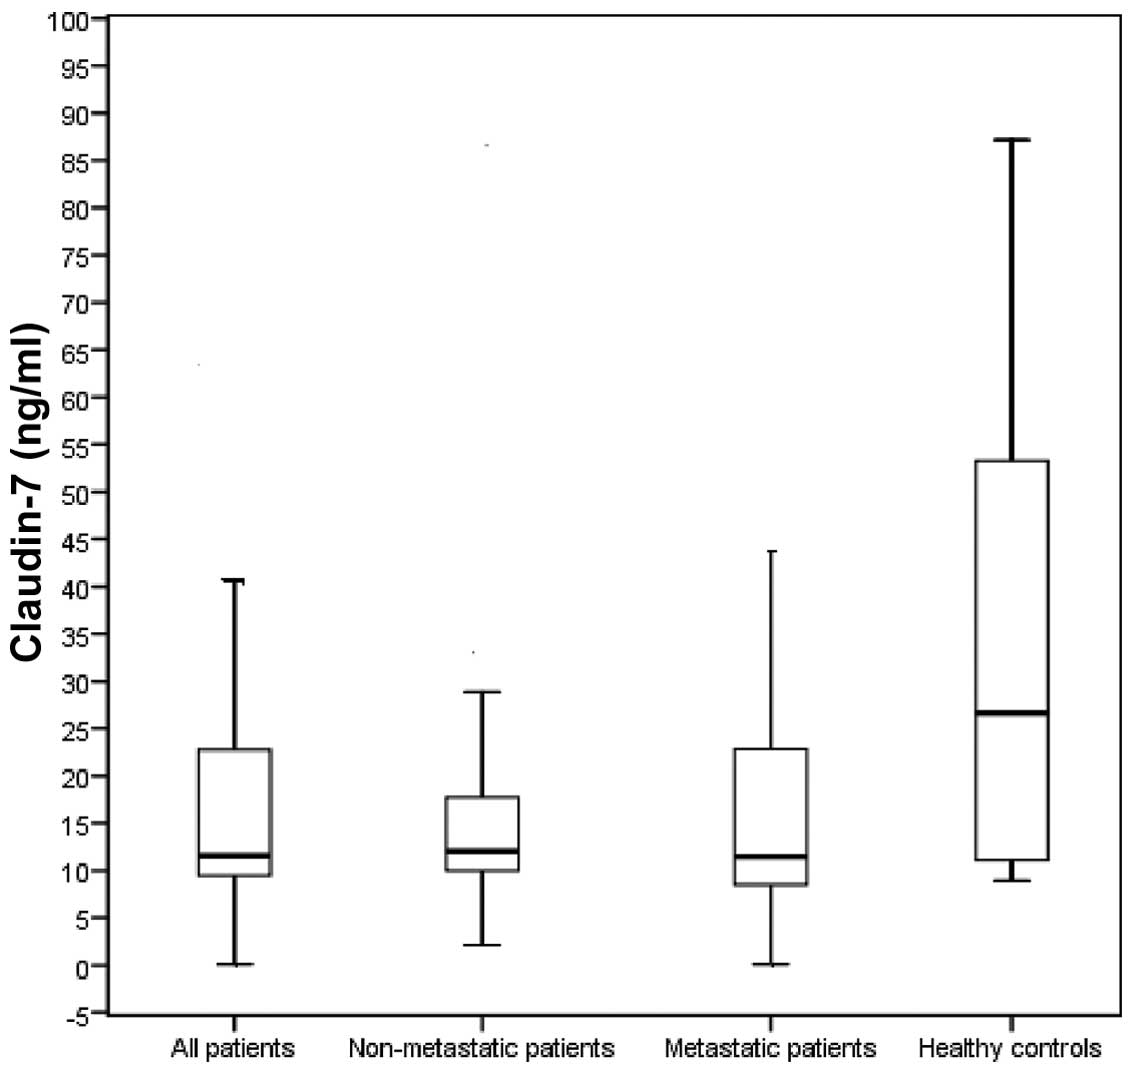
baseline serum CLDN7 levels of all the patients were also
significantly lower compared with those in the control group (11.57
vs. 26.64 ng/ml, respectively; P<0.001). The baseline serum
CLDN1 levels in non-metastatic (stage II/III; 8.5 ng/ml) and
metastatic patients (8.1 ng/ml) were significantly lower compared
with those in the control group (P=0.008 and 0.02, respectively;
Fig. 1). The baseline serum CLDN7
levels in non-metastatic (12.05 ng/ml) as well as those in
metastatic patients (11.45 ng/ml) were also significantly lower
compared with those in the control group (both P-values = 0.002;
Fig. 2).
| Table II.Comparison of serum marker levels in
CRC patients and healthy controls. |
Table II.
Comparison of serum marker levels in
CRC patients and healthy controls.
| Subjects | n | CLDN1 level
(ng/ml), median (range) | CLDN7 level
(ng/ml), median (range) |
|---|
| All patients | 140 | 8.4 (1.8–48.8) | 11.57
(0.13–87.35) |
| Controls | 40 | 9.5 (6.2–48.9) | 26.64
(8.92–87.17) |
| P-value |
| 0.005b |
<0.001b |
| Non-metastatic
patientsa | 81 | 8.5 (3.3–43.1) | 12.05
(2.14–87.35) |
| Controls | 40 | 9.5 (6.2–48.9) | 26.64
(8.92–87.17) |
| P-value |
| 0.008b | 0.002b |
| Metastatic
patients | 59 | 8.1 (1.8–48.8) | 11.45
(0.13–87.15) |
| Controls | 40 | 9.5 (6.2–48.9) | 26.64
(8.92–87.17) |
| P-value |
| 0.02b | 0.002b |
Correlation between serum levels of
CLDN1 and CLDN7 and clinicopathological factors
The correlation between the serum levels of CLDN1
and CLDN7 and clinicopathological factors is shown in Tables III and IV. Poor PS and high carcinoembryonic
antigen (CEA) levels were found to be associated with lower serum
CLDN1 concentrations for all patients (both P-values = 0.03). High
tumor stage and high CEA levels were found to be correlated with
lower serum CLDN7 concentrations for all patients (P=0.04 and 0.02,
respectively).
| Table III.Results of comparisons between the
serum assays and various demographic and disease
characteristics. |
Table III.
Results of comparisons between the
serum assays and various demographic and disease
characteristics.
| Variables | n | CLDN1 level
(ng/ml), median (range) | P-value | CLDN7 level
(ng/ml), median (range) | P-value |
|---|
| Age (years) |
|
| 0.75 |
| 0.85 |
|
<50 | 22 | 8.3 (4.5–42.2) |
| 11.02
(1.36–87.15) |
|
|
≥50 | 118 | 8.4 (1.8–48.8) |
| 11.67
(0.13–87.35) |
|
| Gender |
|
| 0.62 |
| 0.26 |
|
Male | 96 | 8.5 (1.8–48.8) |
| 11.99
(0.13–87.35) |
|
|
Female | 44 | 8.1 (4.7–43.1) |
| 10.99
(1.36–60.70) |
|
| PS |
|
| 0.03b |
| 0.57 |
| 0 | 68 | 8.9 (3.3–44.2) |
| 12.18
(1.92–55.07) |
|
|
1–3 | 69 | 7.8 (1.8–48.8) |
| 11.45
(0.13–87.35) |
|
| Smoking |
|
| 0.79 |
| 0.39 |
|
Yes | 61 | 8.4 (1.8–48.8) |
| 12.24
(0.13–87.35) |
|
| No | 66 | 8.6 (3.3–42.3) |
| 11.10
(1.39–55.25) |
|
| Alcohol intake |
|
| 0.63 |
| 0.49 |
|
Yes | 26 | 8.4 (3.3–37.0) |
| 11.44
(0.13–47.32) |
|
| No | 99 | 8.5 (1.8–48.8) |
| 11.81
(1.39–87.35) |
|
| Comorbidity |
|
| 0.56 |
| 0.62 |
|
Yes | 56 | 8.5 (4.6–48.8) |
| 11.39
(0.13–65.93) |
|
| No | 79 | 8.3 (1.8–42.3) |
| 11.81
(1.36–87.35) |
|
| Obstruction |
|
| 0.25 |
| 0.12 |
|
Yes | 17 | 6.9 (5.0–33.5) |
| 9.68
(2.49–87.35) |
|
| No | 123 | 8.4 (1.8–48.8) |
| 12.05
(0.13–87.15) |
|
| Surgery |
|
| 0.72 |
| 0.91 |
|
Yes | 116 | 8.4 (3.3–44.2) |
| 11.48
(1.36–87.35) |
|
| No | 24 | 8.2 (1.8–48.8) |
| 11.84
(0.13–65.93) |
|
| T stage |
|
| 0.59 |
| 0.04a |
|
0–2 | 23 | 8.6 (3.3–20.4) |
| 12.27
(2.14–87.35) |
|
|
3–4 | 55 | 8.5 (4.6–43.1) |
| 10.99
(2.80–28.27) |
|
| N stage |
|
| 0.32 |
| 0.55 |
| 0 | 42 | 8.4 (3.3–39.8) |
| 11.54
(2.80–55.69) |
|
|
1–2 | 32 | 8.8 (4.6–43.1) |
| 12.20
(2.14–87.35) |
|
| Metastasis |
|
| 0.84 |
| 0.44 |
|
Yes | 59 | 8.1 (1.8–48.8) |
| 11.45
(0.13–87.15) |
|
|
Noa | 81 | 8.5 (3.3–43.1) |
| 12.05
(2.14–87.35) |
|
| Response to
CTx |
|
| 0.88 |
| 0.72 |
| Yes (CR
+ PR) | 17 | 7.7 (1.8–42.3) |
| 9.68
(2.80–55.25) |
|
| No (SD
+ PD) | 34 | 8.3 (4.7–44.2) |
| 11.41
(0.13–60.70) |
|
| Tumor location |
|
| 0.32 |
| 0.33 |
|
Colon | 81 | 8.4 (3.3–48.8) |
| 12.05
(0.13–87.35) |
|
|
Rectum | 59 | 8.3 (1.8–39.8) |
| 11.48
(1.92–60.70) |
|
| Table IV.Results of comparisons between the
serum assays and various histopathological characteristics and
laboratory parameters. |
Table IV.
Results of comparisons between the
serum assays and various histopathological characteristics and
laboratory parameters.
| Variables | n | CLDN1 level
(ng/ml), median (range) | P-value | CLDN7 level
(ng/ml), median (range) | P-value |
|---|
| Histology |
|
| 0.12 |
| 0.70 |
|
Adenocarcinoma | 129 | 8.3 (1.8–48.8) |
| 11.62
(0.13–87.35) |
|
|
Mucinous carcinoma | 11 | 9.2 (5.6–42.2) |
| 11.48
(8.95–52.80) |
|
| Grade of
differentiation |
|
| 0.27 |
| 0.51 |
|
High |
8 | 8.9 (8.3–19.7) |
| 12.15
(9.06–28.83) |
|
|
Intermediate | 56 | 8.1 (1.8–43.1) |
| 11.09
(1.36–87.35) |
|
|
Poor |
6 | 9.2 (5.7–17.7) |
| 14.38
(9.90–25.56) |
|
| Lymphatic
invasion |
|
| 0.54 |
| 0.82 |
|
Yes | 30 | 8.1 (4.6–43.1) |
| 12.20
(6.62–87.35) |
|
| No | 18 | 8.8 (3.3–41.6) |
| 12.18
(6.72–55.69) |
|
| Vascular
invasion |
|
| 0.71 |
| 0.85 |
|
Yes | 16 | 8.2 (4.7–23.7 |
| 12.58
(6.62–87.35) |
|
| No | 30 | 8.8 (3.3–43.1) |
| 12.26
(6.72–59.48) |
|
| Perineural
invasion |
|
| 0.64 |
| 0.85 |
|
Yes | 18 | 8.7 (4.6–43.1) |
| 13.86
(6.62–59.48) |
|
| No | 28 | 8.4 (3.3–41.6) |
| 12.12
(6.72–87.35) |
|
| Regression
score |
|
| 0.27 |
| 0.35 |
|
1–2 | 13 | 8.9 (5.5–39.8) |
| 11.34
(2.14–53.31) |
|
|
3–4 | 12 | 8.6 (4.7–12.2) |
| 10.65
(2.80–18.01) |
|
| KRAS mutation
status |
|
| 0.99 |
| 0.70 |
|
Mutant | 24 | 8.3 (5.1–44.2) |
| 11.18
(0.13–59.48) |
|
|
Wild-type | 28 | 8.3 (1.8–48.8) |
| 11.84
(1.36–65.93) |
|
| LDH level |
|
| 0.11 |
| 0.40 |
|
Normal | 97 | 8.6 (1.8–44.2) |
| 11.72
(0.13–87.35) |
|
|
High | 16 | 9.3 (6.7–48.8) |
| 16.26
(2.49–65.93) |
|
| Albumin level |
|
| 0.54 |
| 0.83 |
|
Normal | 54 | 8.4 (1.8–44.2) |
| 11.39
(2.80–60.70) |
|
|
Low | 58 | 8.9 (3.3–48.8) |
| 12.12
(0.13–87.35) |
|
| CEA level |
|
| 0.03a |
| 0.02a |
|
Normal | 78 | 8.7 (3.3–43.1) |
| 12.11
(1.36–87.35) |
|
|
High | 17 | 6.8 (1.8–44.2) |
| 10.36
(1.39–51.03) |
|
| CA 19-9 level |
|
| 0.52 |
| 0.21 |
|
Normal | 81 | 8.5 (1.8–42.2) |
| 11.48
(1.36–87.35) |
|
|
High | 28 | 7.9 (5.0–44.2) |
| 11.24
(0.13–60.70) |
|
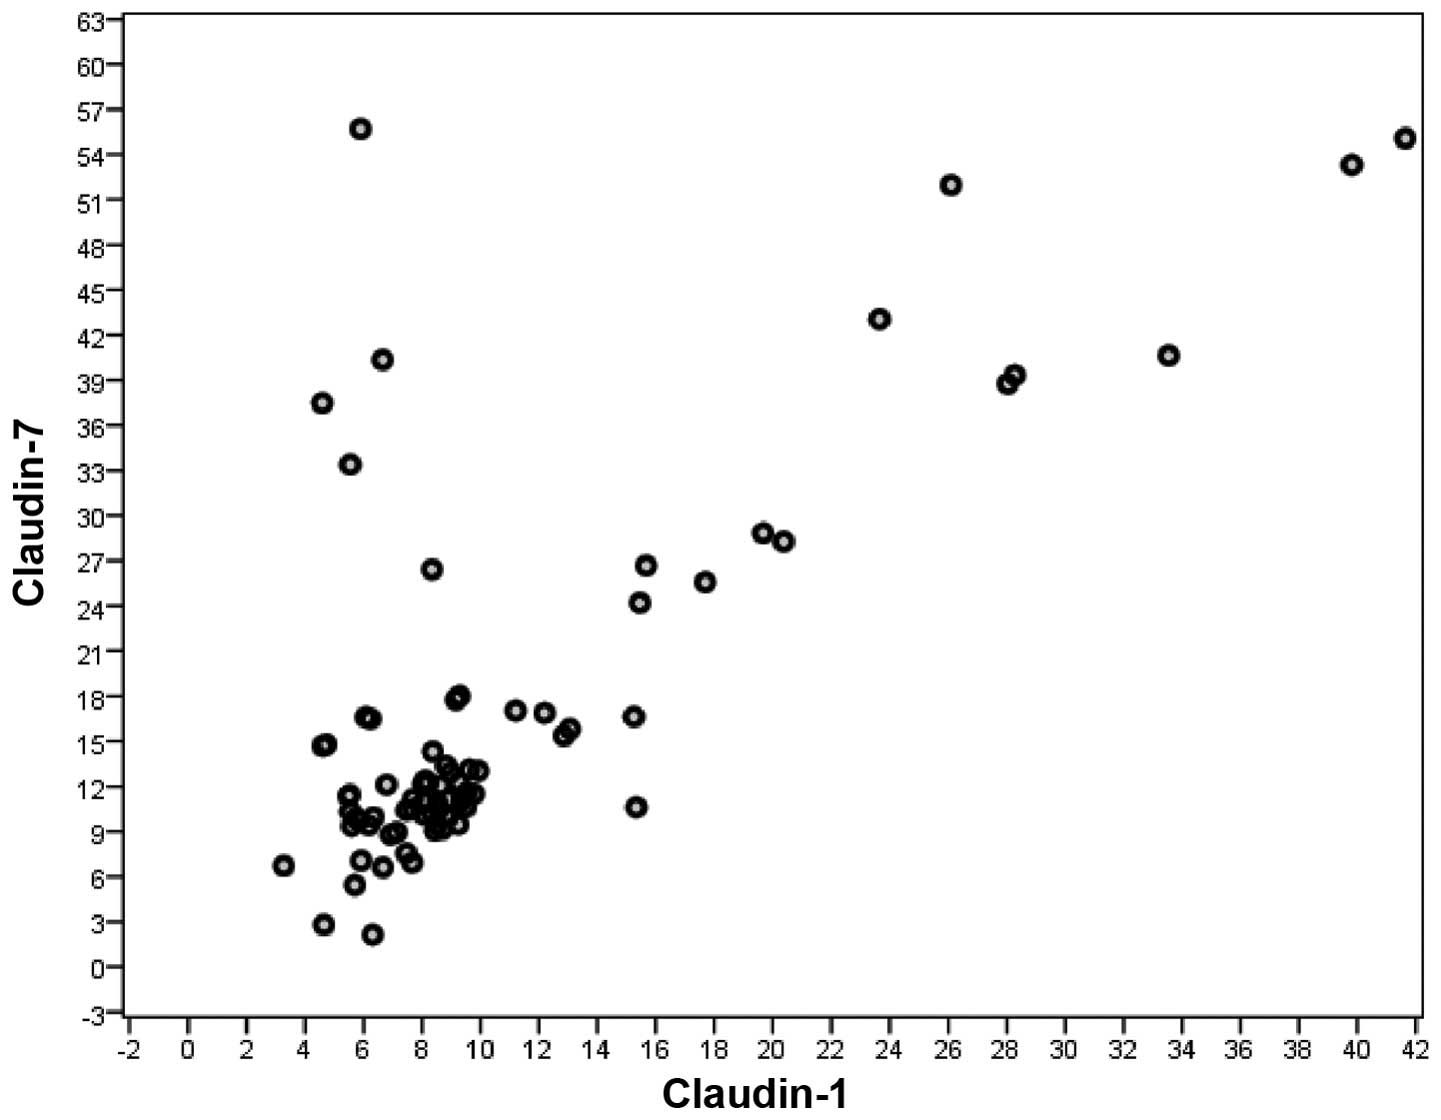
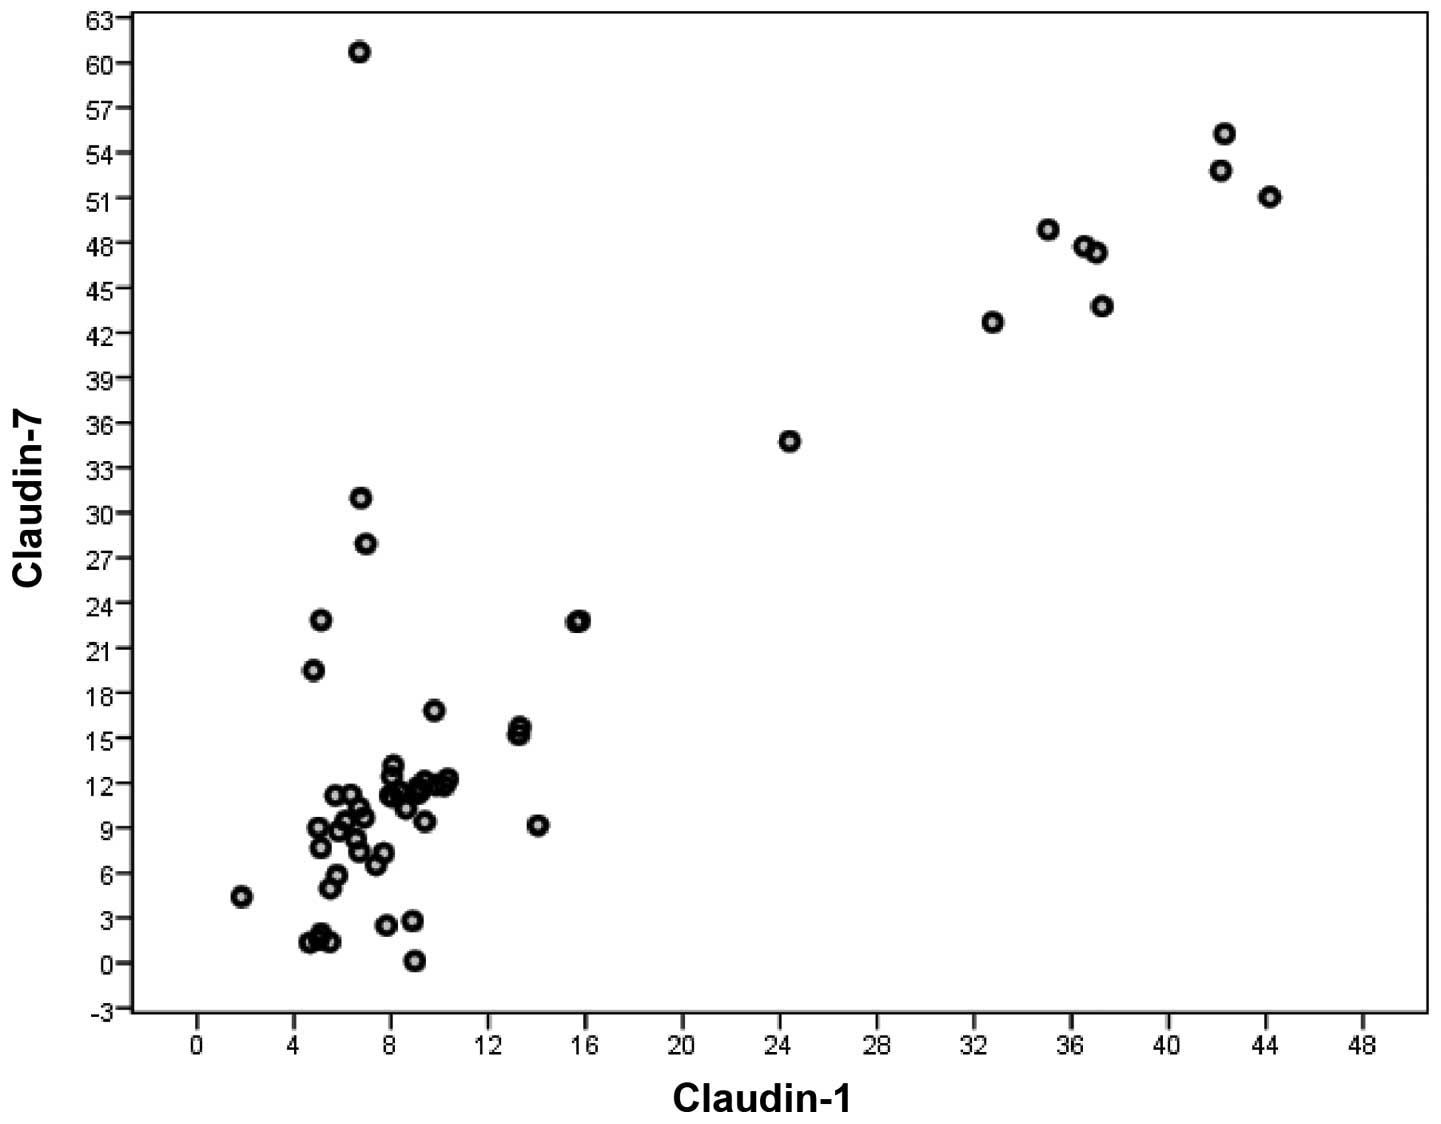
A significant correlation was observed between serum
CLDN1 and CLDN7 levels in all CRC patients (rs=0.672, n=140,
P<0.001). Such a correlation was not observed between serum
CLDN1 and CLDN7 levels in non-metastatic CRC patients (rs=0.632,
n=81, P<0.001), but it was observed between serum CLDN1 and
CLDN7 levels in metastatic CRC patients (rs=0.706, n=59,
P<0.001) (Spearman's correlation) (Figs. 3 and 4).
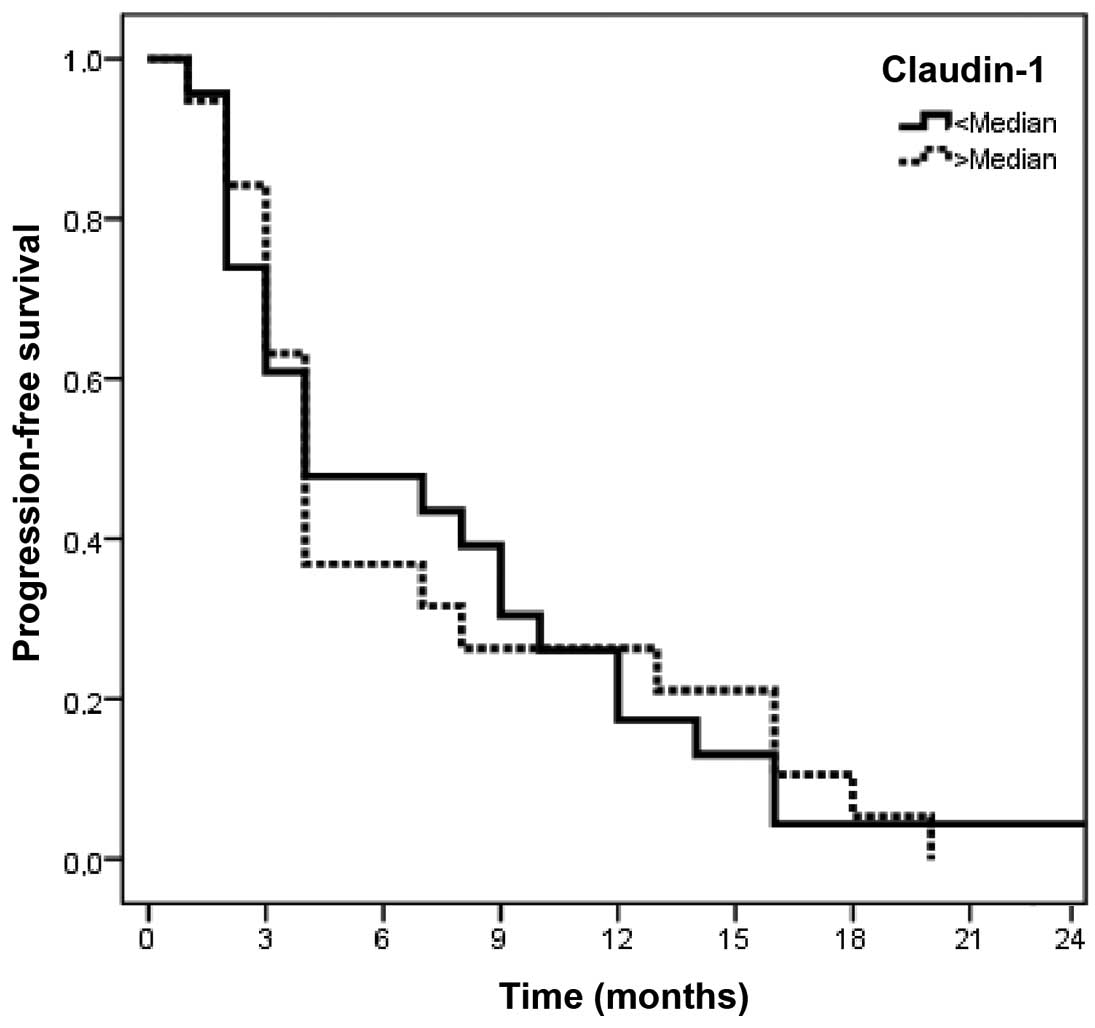
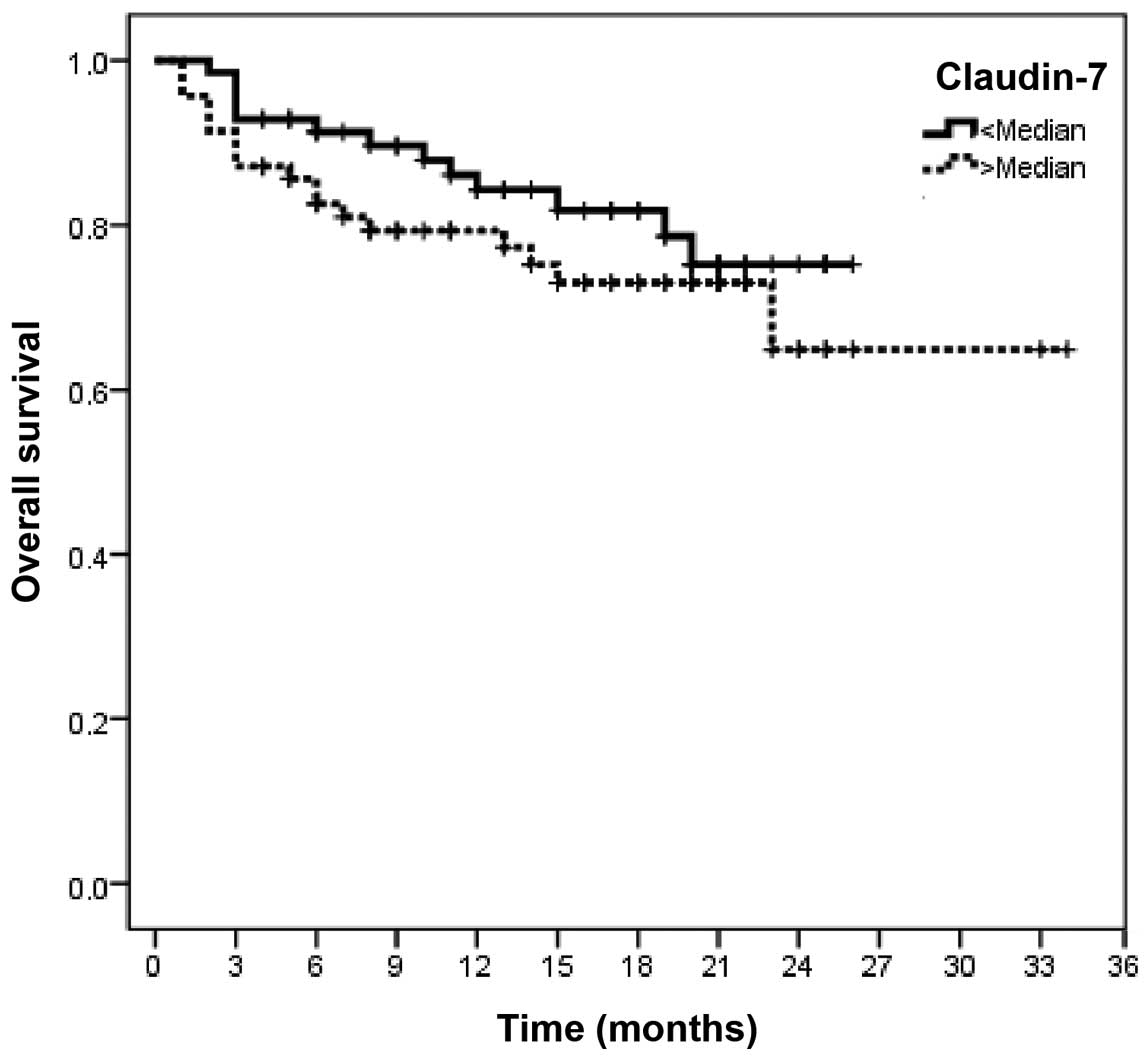
Folllow-up
The median follow-up time was 14 months (range, 1–34
months). A total of 43 patients (31%) experienced disease
progression, whereas 31 of the remaining patients (22%) succumbed
to the disease. The median PFS and OS of the entire group were
7.3±1.0 months (95% CI: 5–9 months) and 26.9±1.1 months (95% CI:
25–29 months), respectively. The 1-year PFS rate was 26.2% (95% CI:
12.9–39.5) and the 1- and 2-year OS rates were 82.7% (95% CI:
76.2–89.2) and 70.1% (95% CI: 58.8–81.2), respectively. There was a
significant association between certain clinicopathological
variables, including presence of metastasis (P=0.05), no surgical
resection (P=0.01), CTx-unresponsiveness (P=0.001), high serum CEA
(P=0.04) and carbohydrate antigen (CA) 19-9 levels (P=0.03) and
poorer PFS (Tables V and VI). Among the clinicopathological variables
evaluated, rectal localization (P=0.03), presence of metastasis
(P<0.001), vascular invasion (P=0.02), perineural invasion
(P=0.03), poor differentiation (P=0.02), low PS (P=0.02), no
surgical resection (P<0.001), CTx-unresponsiveness (P=0.002),
high serum levels of lactate dehydrogenase (LDH) (P=0.02), CEA
(P<0.001) and CA 19-9 (P<0.001), and low serum levels of
albumin (P=0.02), were found to be correlated with poorer OS
(Tables VII and VIII). However, serum CLDN1 and CLDN7
levels exerted no significantly adverse effect on PFS or OS (CLDN1,
P=0.93 and 0.48, respectively; and CLND7, P=0.43 and 0.18,
respectively) (Tables VI and
VIII and Figs. 5–8).
Moreover, the serum CLDN1 or CLDN7 levels of metastatic and
non-metastatic patients exerted no significant adverse effect on
PFS or OS (CLND1: P=0.75 and 0.09, and P=0.77 and 0.07,
respectively; and CLND7: P=0.56 and 0.08, and P=0.07 and 0.82,
respectively) (Tables VI and
VIII).
| Table V.Univariate analyses of
progression-free survival according to patient and disease
characteristics. |
Table V.
Univariate analyses of
progression-free survival according to patient and disease
characteristics.
| Variables | No. of events/total
no. | Median survival,
months (± SE) | 1-year survival
rate,% (± SE) | P-value |
|---|
| All patients | 43/140 | 7.3 (1.0) | 26.2 (6.8) |
|
| Age, years |
|
|
| 0.45 |
|
<50 | 6/22 | 8.3 (2.2) | NR |
|
|
≥50 | 37/118 | 7.2 (1.1) | 25.0 (7.2) |
|
| Gender |
|
|
| 0.46 |
|
Male | 29/96 | 7.5 (1.1) | 28.6 (8.5) |
|
|
Female | 14/44 | 7.1 (2.1) | NR |
|
| PS |
|
|
| 0.30 |
| 0 | 11/68 | 8.7 (2.1) | NR |
|
|
1–3 | 32/69 | 6.9 (1.2) | 24.1 (7.9) |
|
| Obstruction |
|
|
| 0.43 |
|
Yes | 6/17 | 6.3 (1.9) | NR |
|
| No | 33/123 | 7.4 (1.1) | 24.2 (7.5) |
|
| Surgery |
|
|
| 0.01b |
|
Yes | 32/116 | 8.3 (1.2) | 31.3 (8.2) |
|
| No | 11/24 | 4.2 (1.3) | NR |
|
| T stage |
|
|
| 0.85 |
|
0–2 | 2/23 | 11.0 (3.2) | NR |
|
|
3–4 | 8/55 | 10.0 (6.0) | NR |
|
| N stage |
|
|
| 0.20 |
| 0 | 4/42 | 6.5 (3.2) | NR |
|
|
1–2 | 6/32 | 13.7 (3.7) | NR |
|
| Metastasis |
|
|
| 0.05b |
|
Yes | 33/59 | 6.3 (0.9) | 21.9 (7.3) |
|
|
Noa | 10/81 | 10.8 (2.7) | NR |
|
| Response to
CTx |
|
|
| 0.001b |
| Yes (CR
+ PR) | 4/17 | 14.8 (2.3) | NR |
|
| No (SD
+ PD) | 27/34 | 4.1 (0.6) | NR |
|
| Tumor location |
|
|
| 0.18 |
|
Colon | 19/81 | 8.3 (1.4) | 33.3 (11.1) |
|
|
Rectum | 24/59 | 6.6 (1.3) | 20.8 (8.3) |
|
| Histology |
|
|
| 0.79 |
|
Adenocarcinoma | 37/129 | 8.2 (2.6) | 24.3 (7.1) |
|
|
Mucinous carcinoma | 5/11 | 7.2 (1.1) | NR |
|
| Grade of
differentiation |
|
|
| 0.79 |
|
High | 1/8 | NR | 9.0 (0.0) |
|
|
Intermediate | 13/56 | NR | 7.5 (2.2) |
|
|
Poor | 2/6 | NR | 5.5 (2.5) |
|
| Regression
score |
|
|
| 0.90 |
|
1–2 | 2/12 | 9.5 (6.5) | NR |
|
|
3–4 | 0/13 | 4.0 (0.0) | NR |
|
| KRAS mutation
status |
|
|
| 0.14 |
|
Mutant | 14/24 | 4.9 (1.2) | NR |
|
|
Wild-type | 14/28 | 7.6 (1.7) | NR |
|
| Table VI.Univariate analyses of
progression-free survival according to laboratory parameters. |
Table VI.
Univariate analyses of
progression-free survival according to laboratory parameters.
| Variables | No. of events/total
no. | Median survival,
months (± SE) | 1-year survival
rate, % (± SE) | P-value |
|---|
| LDH level |
|
|
| 0.14 |
|
Normal | 27/97 | 7.1
(1.1) | 25.9
(8.4) |
|
|
High | 5/16 | 12.6 (5.0) | NR |
|
| Albumin level |
|
|
| 0.57 |
|
Normal | 12/54 | 7.6
(1.6) | 26.3
(10.7) |
|
|
Low | 19/58 | 8.9
(2.1) | 41.7
(14.2) |
|
| CEA level |
|
|
| 0.04b |
|
Normal | 16/78 | 8.9
(1.5) | 43.8
(12.4) |
|
|
High | 9/17 | 5.2
(2.1) | NR |
|
| CA 19-9 level |
|
|
| 0.03b |
|
Normal | 18/81 | 9.1
(1.3) | 38.9
(11.5) |
|
|
High | 19/28 | 6.5
(1.7) | 21.1 (9.4) |
|
| CLDN1 of all
patients |
|
|
| 0.93 |
|
<median | 23/43 | 7.5
(1.4) | 26.1 (9.2) |
|
|
>median | 20/43 | 7.1
(1.4) | 26.3
(10.1) |
|
| CLDN1 of
non-metastatic patientsa |
|
|
| 0.77 |
|
<median | 5/41 | 11.8 (4.8) | NR |
|
|
>median | 5/40 | 9.8
(3.1) | NR |
|
| CLDN1 of metastatic
patients |
|
|
| 0.75 |
|
<median | 16/30 | 6.3
(1.2) | 25.0
(10.8) |
|
|
>median | 17/29 | 6.2
(1.4) | 18.8 (9.8) |
|
| CLDN7 of all
patients |
|
|
| 0.43 |
|
<median | 22/43 | 6.6
(1.2) | 22.7 (8.9) |
|
|
>median | 21/43 | 8.2
(1.6) | 30.0
(10.2) |
|
| CLDN7 of
non-metastatic patientsa |
|
|
| 0.07 |
|
<median | 4/40 | 14.0 (3.5) | NR |
|
|
>median | 6/41 | 6.0
(3.3) | NR |
|
| CLDN7 of metastatic
patients |
|
|
| 0.56 |
|
<median | 16/30 | 5.5
(1.2) | NR |
|
|
>median | 17/29 | 6.9
(1.4) | NR |
|
| Table VII.Univariate analyses of overall
survival according to patient and disease characteristics. |
Table VII.
Univariate analyses of overall
survival according to patient and disease characteristics.
| Variables | No. of events/total
no. | Median survival,
months (± SE) | 1-year survival
rate, % (± SE) | P-value |
|---|
| All patients | 31/140 | 26.9 (1.1) | 82.7 (3.3) |
|
| Age, years |
|
|
| 0.30 |
|
<50 | 4/22 | 22.1 (1.4) | 90.9 (6.1) |
|
|
≥50 | 27/118 | 26.8 (1.2) | 81.1 (3.8) |
|
| Gender |
|
|
| 0.76 |
|
Male | 20/96 | 26.3 (1.3) | 83.3 (4.0) |
|
|
Female | 11/44 | 26.7 (1.9) | 81.5 (5.9) |
|
| PS |
|
|
| 0.02b |
| 0 | 9/68 | 25.4 (1.7) | 87.5 (4.2) |
|
|
1–3 | 22/69 | 23.1 (0.9) | 77.3 (5.2) |
|
| Obstruction |
|
|
| 0.50 |
|
Yes | 5/17 | 20.7 (2.0) | 81.1 (9.9) |
|
| No | 23/123 | 27.5 (1.3) | 83.1 (3.6) |
|
| Surgery |
|
|
|
<0.001b |
|
Yes | 20/116 | 28.6 (1.1) | 88.0 (3.1) |
|
| No | 11/24 | 13.3 (2.0) | 56.9
(10.4) |
|
| T stage |
|
|
| 0.28 |
|
0–2 | 0/23 | NR | 100.0 (0.0) |
|
|
3–4 | 3/55 | NR | 98.2
(1.8) |
|
| N stage |
|
|
| 0.43 |
| 0 | 1/42 | 32.3 (0.7) | 97.6
(2.4) |
|
|
1–2 | 2/32 | 32.3 (1.2) | 100.0 (0.0) |
|
| Metastasis |
|
|
|
<0.001b |
|
Yes | 27/59 | 15.9 (1.4) | 61.1
(6.8) |
|
|
Noa | 4/81 | 32.5 (0.7) | 97.5
(1.7) |
|
| Response to
CTx |
|
|
| 0.002b |
| Yes
(CR+PR) | 2/17 | 23.6 (1.6) | 93.3
(6.4) |
|
| No
(SD+PD) | 19/34 | 11.9 (1.4) | 47.6
(9.4) |
|
| Tumor location |
|
|
| 0.03b |
|
Colon | 8/81 | 29.2 (1.2) | 91.0
(3.8) |
|
|
Rectum | 23/59 | 24.7 (1.6) | 76.6
(4.9) |
|
| Histology |
|
|
| 0.48 |
|
Adenocarcinoma | 28/129 | 27.7 (1.1) | 84.4
(3.3) |
|
|
Mucinous carcinoma | 3/11 | 18.5 (2.7) |
70.7 (14.3) |
|
| Grade of
differentiation |
|
|
| 0.02b |
|
High | 0/8 | NR | 100.0 (0.0) |
|
|
Intermediate | 6/56 | NR | 90.7
(4.0) |
|
|
Poor | 3/6 | NR |
66.7 (19.2) |
|
| Lymphatic
invasion |
|
|
| 0.25 |
|
Yes | 3/30 | NR | 96.6
(3.4) |
|
| No | 0/18 | NR | 100.0 (0.0) |
|
| Vascular
invasion |
|
|
| 0.02b |
|
Yes | 3/16 | NR | 93.3
(6.4) |
|
| No | 0/30 | NR | 100.0 (0.0) |
|
| Perineural
invasion |
|
|
| 0.03b |
|
Yes | 3/18 | NR | 94.1
(5.7) |
|
| No | 0/28 | NR | 100.0 (0.0) |
|
| Regression
score |
|
|
| 0.30 |
|
1–2 | 1/12 | NR | 91.7
(8.0) |
|
|
3–4 | 0/13 | NR | 100.0 (0.0) |
|
| KRAS mutation
status |
|
|
| 0.25 |
|
Mutant | 13/24 | 15.1 (2.0) |
52.6 (10.3) |
|
|
Wild-type | 8/28 | 18.2 (2.1) | 75.8
(9.7) |
|
| Table VIII.Univariate analyses of overall
survival according to laboratory parameters. |
Table VIII.
Univariate analyses of overall
survival according to laboratory parameters.
| Variables | No. of events/total
no. | Median survival,
months (± SE) | 1-year survival
rate, % (± SE) | P-value |
|---|
| LDH level |
|
|
| 0.02b |
|
Normal | 21/97 | 21.5 (0.9) | 84.6
(3.8) |
|
|
High | 7/16 | 20.5 (3.8) |
62.5 (12.1) |
|
| Albumin level |
|
|
| 0.02b |
|
Normal | 7/54 | 23.2 (1.0) | 89.8
(4.3) |
|
|
Low | 20/58 | 23.4 (1.9) | 73.7
(5.8) |
|
| CEA level |
|
|
|
<0.001b |
|
Normal | 7/78 | 24.4 (0.6) | 95.7
(2.5) |
|
|
High | 6/17 | 17.9 (2.6) |
68.0 (12.2) |
|
| CA 19-9 level |
|
|
|
<0.001b |
|
Normal | 10/81 | 23.8 (0.7) | 93.4
(2.9) |
|
|
High | 13/28 | 20.0 (2.8) | 61.5
(9.7) |
|
| CLDN1 of all
patients |
|
|
| 0.48 |
|
<median | 15/71 | 27.3 (1.5) | 85.1
(4.4) |
|
|
>median | 16/69 | 20.9 (1.1) | 80.2
(5.0) |
|
| CLDN1 of
non-metastatic patientsa |
|
|
| 0.07 |
|
<median | 0/40 | NR | 100.0 (0.0) |
|
|
>median | 4/41 | NR | 95.1
(3.4) |
|
| CLDN1 of metastatic
patients |
|
|
| 0.09 |
|
<median | 11/30 | 17.6 (1.7) | 70.3
(9.0) |
|
|
>median | 16/29 | 13.8 (2.0) | 51.7
(9.9) |
|
| CLDN7 of all
patients |
|
|
| 0.18 |
|
<median | 13/70 | 22.2 (1.0) | 86.1
(4.3) |
|
|
>median | 18/70 | 25.6 (1.7) | 79.3
(4.9) |
|
| CLDN7 of
non-metastatic patientsa |
|
|
| 0.82 |
|
<median | 2/40 | 24.2 (0.6) | 97.6
(2.4) |
|
|
>median | 2/41 | 32.5 (1.1) | 97.5
(2.5) |
|
| CLDN7 of metastatic
patients |
|
|
| 0.08 |
|
<median | 11/30 | 12.4 (1.8) | 73.7
(8.7) |
|
|
>median | 16/29 | 16.8 (1.4) | 69.4
(9.6) |
|
Discussion
It is commonly accepted that the risk of developing
CRC is affected by environmental as well as genetic factors
(13). Although certain risk factors
and etiological agents have been indicated in different studies
over several years (14–16), there is a need to fully elucidate the
molecular background of CRC, in order to develop effective
biomolecular tools to decrease the mortality rate of this disease
through early diagnosis. Thus far, different molecular substances
and detection techniques have been investigated for this purpose,
such as tight juction proteins.
Tight junction proteins regulate cellular
permeability and play a crucial role in cell-to-cell adhesion and
epithelial polarity. CLDNs are major integral membrane proteins of
tight junctions. CLDN loss of expression or overexpression varies
in different cancer types. In hepatocellular carcinoma and renal
cell carcinoma, the expression of CLDN4 and CLDN5 is lost, whereas
CLDN3 and CLDN4 overexpression has been detected in pancreatic
ductal adenocarcinoma and cancers of the prostate, uterus, ovary
and breast. Particularly CLDN1, CLDN4 and CLDN7, which are referred
to as the ‘impermeability CLDNs’ are important building blocks of
paracellular adhesion molecules; it was demonstrated that their
decreased expression in CRC appears to exert major effects on cell
proliferation, motility, invasion and antitumor immune response
(17–19).
Previous studies have investigated the role of CLDNs
on different cancer types using IHC or PCR (20,21). To
the best of our knowledge, this is the first study to compare CLDN1
and CLDN7 serum levels between healthy individuals and CRC patients
using ELISA.
It was previously suggested that loss of CLDN
expression plays a role in carcinogenesis through repression of
tight junctions and cell proliferation, motility and invasion
(22). Resnick et al(23) demonstrated that weak CLDN1 expression
was associated with high grade and poor survival, and it was an
independent predictor of recurrence. Ersoz et al(24) reported that CLDN1 expression was
significantly decreased in lymph node-positive cases.
For different types of cancer, a number of studies
have compared CLDN7 expression between malignant and normal
tissues. It was previously reported that CLDN7 expression is lower
in squamous cell carcinoma of the oesophagus (25), head and neck (26), breast (27,28) and
nasopharyngeal cancer (29); however,
it appears to be upregulated in ovarian (30) and gastric cancer (31). Nakayama et al (32) also reported lower expression of CLDN7
in ~80% of invasive CRCs compared with non-neoplastic tissues.
Süren et al(17) recently demonstrated a significant
association between loss of CLDN1 and CLDN7 expression, as
determined by IHC, and invasion depth, lymph node status, disease
stage, grade, perineural invasion and lymphovascular invasion in 70
CRC patients; they observed mild loss (score 1) of CLDN1 expression
in 43 (61.4%) and moderate-to-marked loss (score 2 and 3) in 27
patients (38.6%). For CLDN7, there was no loss of expression (score
0) in 16 (22.9%), mild loss (score 1) in 30 (42.9%) and
moderate-to-marked loss (score 3) in 24 patients (34.2%) of the
same group. Similarly, in the present study, we observed a negative
correlation between CRC and the serum levels of CLDN1 and CLDN7 as
determined by ELISA. The baseline serum CLDN1 levels were
significantly lower in all CRC patients compared with those in the
control group. Similar to CLDN1, the baseline serum CLDN7 levels of
all patients were significantly lower compared with those in the
control group. Our results also suggest that the decrease in the
levels of CLDN1 and CLDN7 reflect the stage of the disease. The
baseline serum CLDN1 levels of non-metastatic (stage II/III) and
metastatic patients were significantly lower compared with those in
the control group. The baseline serum CLDN7 levels of
non-metastatic and metastatic patients were also significantly
lower compared with those in the control group.
In another study using IHC, Nakagawa et al
(33) demonstrated that, among 119
CRC patients, the postoperative OS rate was significantly higher in
patients exhibiting high expression of CLDN1 compared with the
low-expression group for a median follow-up of 3.9 years. The
disease-free survival rate following curative surgery was also
higher in the high-expression compared with that in the
low-expression group. Their univariate analysis revealed that grade
of differentiation, morphological type, tumor size, tumor invasion,
lymph node metastasis, lymphatic invasion, venous invasion,
metastasis and CLDN1 expression were significantly correlated with
OS. In addition, the multivariate regression analysis indicated
that high expression of CLDN1 and metastasis were independent
predictors of OS. They also observed that CRC patients with high
expression of CLDN1 had a better prognosis in terms of disease-free
survival compared with the low-expression group, which is
consistent with our findings. In our analysis, we investigated the
correlation between the serum levels of CLDN1 and CLDN7 and
clinicopathological factors. Poor PS and high CEA levels were found
to be associated with lower serum CLDN1 concentrations for all
patients. High T stage and high CEA levels were also found to be
correlated with lower serum CLDN7 concentrations for all patients.
Such a correlation was not observed between serum CLDN1 and CLDN7
levels in non-metastatic CRC patients, but it was observed between
serum CLDN1 and CLDN7 levels in metastatic CRC patients. Our median
follow-up time was 14 months (range, 1–34 months). The median PFS
and OS of the entire group were 7.3 and 26.9 months, respectively.
We observed a significant association between other
clinicopathological variables, including presence of metastasis, no
surgical resection, CTx-unresponsiveness, and high serum levels of
CEA and CA19-9, and poorer PFS. Among the clinicopathological
variables evaluated, localization in the rectum, presence of
metastasis, vascular invasion, perineural invasion, poor
differentiation, low PS, no surgical resection and
CTx-unresponsiveness were found to be correlated with poorer OS, as
expected. However, the serum CLDN1 and CLDN7 levels exerted no
significantly adverse effect on PFS or OS over this limited
follow-up time.
In conclusion, CLDN1 and CLDN7 are important barrier
proteins of the human cell structure and their decreased expression
in CRC appears to play a central role in tumor cell motility and
invasion. Therefore, reduced serum levels of CLDN1 and CLND7, as
determined by ELISA, may be a useful tool in the differential
diagnosis of CRC.
References
|
1
|
Siegel R, Naishadham D and Jemal A: Cancer
statistics. 2013 CA Cancer J Clin. 63:11–30. 2013. View Article : Google Scholar : PubMed/NCBI
|
|
2
|
Siegel RL, Miller KD and Jemal A: Cancer
statistics. 2015 CA Cancer J Clin. 65:5–29. 2015. View Article : Google Scholar : PubMed/NCBI
|
|
3
|
Center MM, Jemal A, Smith RA and Ward E:
Worldwide variations in colorectal cancer. CA Cancer J Clin.
59:366–378. 2009. View Article : Google Scholar : PubMed/NCBI
|
|
4
|
Jemal A, Simard EP, Dorell C, Noone AM,
Markowitz LE, Kohler B, Eheman C, Saraiya M, Bandi P, Saslow D, et
al: Annual Report to the Nation on the Status of Cancer 1975–2009,
featuring the burden and trends in human papillomavirus
(HPV)-associated cancers and HPV vaccination coverage levels. J
Natl Cancer Inst. 105:175–201. 2013. View Article : Google Scholar : PubMed/NCBI
|
|
5
|
Kohler BA, Ward E, McCarthy BJ, Schymura
MJ, Ries LA, Eheman C, Jemal A, Anderson RN, Ajani UA and Edwards
BK: Annual Report to the Nation on the Status of Cancer, 1975–2007,
featuring tumors of the brain and other nervous system. J Natl
Cancer Inst. 103:714–736. 2011.PubMed/NCBI
|
|
6
|
Singh AB, Sharma A and Dhawan P: Claudin
family of proteins and cancer: An overview. J Oncol.
2010:5419572010. View Article : Google Scholar : PubMed/NCBI
|
|
7
|
Furuse M, Fujita K, Hiiragi T, Fujimoto K
and Tsukita S: Claudin-1 and −2: Novel integral membrane proteins
localizing at tight junctions with no sequence similarity to
occludin. J Cell Biol. 141:1539–1550. 1998. View Article : Google Scholar : PubMed/NCBI
|
|
8
|
Rahner C, Mitic LL and Anderson JM:
Heterogeneity in expression and subcellular localization of
claudins 2, 3, 4, and 5 in the rat liver, pancreas, and gut.
Gastroenterology. 120:411–422. 2001. View Article : Google Scholar : PubMed/NCBI
|
|
9
|
Tsukita S, Furuse M and Itoh M:
Multifunctional strands in tight junctions. Nat Rev Mol Cell Biol.
2:285–293. 2001. View
Article : Google Scholar : PubMed/NCBI
|
|
10
|
Kyuno D, Yamaguchi H, Ito T, Kono T,
Kimura Y, Imamura M, Konno T, Hirata K, Sawada N and Kojima T:
Targeting tight junctions during epithelial to mesenchymal
transition in human pancreatic cancer. World J Gastroenterol.
20:10813–10824. 2014. View Article : Google Scholar : PubMed/NCBI
|
|
11
|
Edge SB and Compton CC: The American Joint
Committee on Cancer: the 7th edition of the AJCC cancer staging
manual and the future of TNM. Ann Surg Oncol. 17:1471–1474. 2010.
View Article : Google Scholar : PubMed/NCBI
|
|
12
|
Eisenhauer EA, Therasse P, Bogaerts J, et
al: New response evaluation criteria in solid tumours: revised
RECIST guideline (version 1.1). Eur J Cancer. 45:228–247. 2009.
View Article : Google Scholar : PubMed/NCBI
|
|
13
|
Chan AT and Giovannucci EL: Primary
prevention of colorectal cancer. Gastroenterology.
138:2029–2043.e10. 2010. View Article : Google Scholar : PubMed/NCBI
|
|
14
|
Moon BS, Jeong WJ, Park J, Kim TI, Min S
and Choi KY: Role of oncogenic K-Ras in cancer stem cell activation
by aberrant Wnt/β-catenin signaling. J Natl Cancer Inst.
106:djt3732014. View Article : Google Scholar : PubMed/NCBI
|
|
15
|
Wei EK, Giovannucci E, Wu K, Rosner B,
Fuchs CS, Willett WC and Colditz GA: Comparison of risk factors for
colon and rectal cancer. Int J Cancer. 108:433–442. 2004.
View Article : Google Scholar : PubMed/NCBI
|
|
16
|
Fearon ER and Vogelstein B: A genetic
model for colorectal tumorigenesis. Cell. 61:759–767. 1990.
View Article : Google Scholar : PubMed/NCBI
|
|
17
|
Süren D, Yıldırım M, Kaya V, Alikanoğlu
AS, Bülbüller N, Yıldız M and Sezer C: Loss of tight junction
proteins (claudin 1, 4 and 7) correlates with aggressive behavior
in colorectal carcinoma. Med Sci Monit. 20:1255–1262. 2014.
View Article : Google Scholar : PubMed/NCBI
|
|
18
|
Michl P, Barth C, Buchholz M, Lerch MM,
Rolke M, Holzmann KH, Menke A, Fensterer H, Giehl K, Löhr M, et al:
Claudin-4 expression decreases invasiveness and metastatic
potential of pancreatic cancer. Cancer Res. 63:6265–6271.
2003.PubMed/NCBI
|
|
19
|
Rangel LB, Agarwal R, D'Souza T, Pizer ES,
Alò PL, Lancaster WD, Gregoire L, Schwartz DR, Cho KR and Morin PJ:
Tight junction proteins claudin-3 and claudin-4 are frequently
overexpressed in ovarian cancer but not in ovarian cystadenomas.
Clin Cancer Res. 9:2567–2575. 2003.PubMed/NCBI
|
|
20
|
Jun KH, Kim JH, Jung JH, Choi HJ and Chin
HM: Expression of claudin-7 and loss of claudin-18 correlate with
poor prognosis in gastric cancer. Int J Surg. 12:156–162. 2014.
View Article : Google Scholar : PubMed/NCBI
|
|
21
|
Brokalaki EI, Weber F, Sotiropoulos GC,
Daoudaki M, Cicinnati VR and Beckebaum S: Claudin-7 expression in
hepatocellular carcinoma. Transplant Proc. 44:2737–2740. 2012.
View Article : Google Scholar : PubMed/NCBI
|
|
22
|
Singh AB, Sharma A and Dhawan P: Claudin
family of proteins and cancer: An overview. J Oncol.
2010:5419572010. View Article : Google Scholar : PubMed/NCBI
|
|
23
|
Resnick MB, Konkin T, Routhier J, Sabo E
and Pricolo VE: Claudin-1 is a strong prognostic indicator in stage
II colonic cancer: A tissue microarray study. Mod Pathol.
18:511–518. 2005. View Article : Google Scholar : PubMed/NCBI
|
|
24
|
Ersoz S, Mungan S, Cobanoglu U, Turgutalp
H and Ozoran Y: Prognostic importance of claudin-1 and claudin-4
expression in colon carcinomas. Pathol Res Pract. 207:285–289.
2011. View Article : Google Scholar : PubMed/NCBI
|
|
25
|
Usami Y, Chiba H, Nakayama F, Ueda J,
Matsuda Y, Sawada N, Komori T, Ito A and Yokozaki H: Reduced
expression of claudin-7 correlates with invasion and metastasis in
squamous cell carcinoma of the esophagus. Hum Pathol. 37:569–577.
2006. View Article : Google Scholar : PubMed/NCBI
|
|
26
|
Al Moustafa AE, Alaoui-Jamali MA, Batist
G, Hernandez-Perez M, Serruya C, Alpert L, Black MJ, Sladek R and
Foulkes WD: Identification of genes associated with head and neck
carcinogenesis by cDNA microarray comparison between matched
primary normal epithelial and squamous carcinoma cells. Oncogene.
21:2634–2640. 2002. View Article : Google Scholar : PubMed/NCBI
|
|
27
|
Kominsky SL, Argani P, Korz D, Evron E,
Raman V, Garrett E, Rein A, Sauter G, Kallioniemi OP and Sukumar S:
Loss of the tight junction protein claudin-7 correlates with
histological grade in both ductal carcinoma in situ and invasive
ductal carcinoma of the breast. Oncogene. 22:2021–2033. 2003.
View Article : Google Scholar : PubMed/NCBI
|
|
28
|
Tokés AM, Kulka J, Paku S, Máthé M, Páska
C, Lódi C, Kiss A and Schaff Z: The expression of five different
claudins in invasive breast carcinomas: Comparison of pT1pN1 and
pT1pN0 tumors. Pathol Res Pract. 201:537–544. 2005. View Article : Google Scholar : PubMed/NCBI
|
|
29
|
Hsueh C, Chang YS, Tseng NM, Liao CT,
Hsueh S, Chang JH, Wu IC and Chang KP: Expression pattern and
prognostic significance of claudins 1, 4 and 7 in nasopharyngeal
carcinoma. Hum Pathol. 41:944–950. 2010. View Article : Google Scholar : PubMed/NCBI
|
|
30
|
Tassi RA, Bignotti E, Falchetti M,
Ravanini M, Calza S, Ravaggi A, Bandiera E, Facchetti F, Pecorelli
S and Santin AD: Claudin-7 expression in human epithelial ovarian
cancer. Int J Gynecol Cancer. 18:1262–1271. 2008. View Article : Google Scholar : PubMed/NCBI
|
|
31
|
Rendón-Huerta E, Teresa F, Teresa GM,
Xochitl GS, Georgina AF, Veronica ZZ and Montaño LF: Distribution
and expression pattern of claudins 6, 7 and 9 in diffuse- and
intestinal-type gastric adenocarcinomas. J Gastrointest Cancer.
41:52–59. 2010. View Article : Google Scholar : PubMed/NCBI
|
|
32
|
Nakayama F, Semba S, Usami Y, Chiba H,
Sawada N and Yokozaki H: Hypermethylation-modulated downregulation
of claudin-7 expression promotes the progression of colorectal
carcinoma. Pathobiology. 75:177–185. 2008. View Article : Google Scholar : PubMed/NCBI
|
|
33
|
Nakagawa S, Miyoshi N, Ishii H, Mimori K,
Tanaka F, Sekimoto M, Doki Y and Mori M: Expression of CLDN1 in
colorectal cancer: A novel marker for prognosis. Int J Oncol.
39:791–796. 2011.PubMed/NCBI
|