Introduction
Gastric cancer, the second most common cancer in the
world, is responsible for 12% of all cancer-related mortality each
year. Therefore, improved treatments based on a deeper
understanding of the molecular mechanisms underlying the
progression of this disease are required (1). The pathogenesis and mechanisms behind
gastric cancer development remain unknown. microRNAs (miRNAs) are
small non-coding RNAs that regulate the expression of approximately
30% of all human genes by inhibiting target mRNA translation and
inducing mRNA degradation (2,3).
miRNAs are capable of regulating a wide range of physiological and
developmental processes, including cancer initiation and
progression (4,5). Genome-wide studies have demonstrated
that miRNA genes are frequently located at cancer-associated
genomic regions or fragile sites, in minimal regions of loss of
heterozygosity, regions of amplification and in common breakpoint
regions, indicating their potential roles in tumorigenesis
(6). Aberrant miRNA expression has
also been frequently reported in various tumors such as B cell
chronic lymphocytic leukemia, lung, breast and colon cancer,
hepatoma and glioblastoma (7–10),
indicating a close correlation between miRNA and cancer (11,12).
Taken together, these previous studies indicate that miRNAs are
rich in information with respect to cancer and that a large amount
of diagnostic information will be available once the relative
concentrations of the involved miRNAs become known. The miRNA
expression signatures are associated with well-defined
clinicopathological features in human cancers.
Microarray experiments may reveal both increases and
decreases in the production of various miRNAs. The expression
pattern appears to be tissue-specific; different types of tumor
have distinctive patterns of miRNA expression (13). Determination of the miRNA
expression profile in cancer may lead to a better understanding of
the genetic pathways involved in tumor development.
Materials and methods
Cell lines
Gastric cancer cell lines NCI-N87 (ATCC: CRL-5822),
SNU-1 (ATCC: CRL-5971), SNU-16 (ATCC: CRL-5974), AGS (ATCC:
CRL-1739) and KATOIII (ATCC: HTB-103) were obtained from the
American Type Culture Collection (Manassas, VA, USA). Another 4
gastric cancer cell lines, MKN45, MKN28, BGC-823 and SGC-7901, were
preserved at our institute. All cell lines were maintained in
RPMI-1640 supplemented with 10% fetal bovine serum (FBS).
Tissue samples
A total of 40 pairs of primary gastric cancer and
matched adjacent non-tumorous tissues were obtained from surgically
treated gastric cancer patients diagnosed at the Department of
Surgery, Ruijin Hospital, Shanghai Jiao Tong University School of
Medicine from 2006 to 2008. All gastric cancer cases were
clinically and pathologically proven. Each specimen was given a
diagnosis and scored for tumor size, location, differentiation and
pTNM stage. Other clinical characteristics were obtained from
clinical records with patient permission. Table II shows detailed information on
the patients and the clinicopathological parameters of the tumors.
A total of 6 normal gastric epithelium biopsy tissues were
collected from subjects who were referred for gastroscopy. The
study was approved by the Ruijin Hospital Ethics Committee and
patients provided informed consent.
 | Table IIClinicopathological associations of
the expression of 15 miRNAs using quantitative real-time PCR in
gastric cancer. |
Table II
Clinicopathological associations of
the expression of 15 miRNAs using quantitative real-time PCR in
gastric cancer.
| Age | Gender | Differentiation | Borrmann type | Infitration
degree | TNM stage |
|---|
|
|
|
|
|
|
|
|---|
| <60 years | ≥60 years | Male | Female | Poor | Moderate/well | I | II | III | Serosal | Subserosal | I/II | III/IV |
|---|
| miR-196a |
| Mean | 21.45 | 72.53 | 94.12 | 16.26 | 60.68 | 24.54 | 70.88 | 21.73 | 18.75 | 19.81 | 63.06 | 15.45 | 69.41 |
| P-value | 0.211 | - | 0.037 | - | 0.385 | - | 0.390 | - | - | 0.346 | - | 0.193 | - |
| miR-196b |
| Mean | 12.77 | 46.24 | 57.98 | 11.66 | 23.01 | 85.48 | 44.61 | 12.35 | 15.92 | 73.42 | 24.11 | 9.56 | 43.92 |
| P-value | 0.093 | - | 0.014 | - | 0 | - | 0.188 | - | - | 0.001 | - | 0.099 | - |
|
miR-18a* |
| Mean | 1.01 | 1.73 | 1.76 | 1.20 | 1.51 | 1.32 | 1.69 | 0.94 | 1.28 | 1.19 | 1.55 | 1.10 | 1.62 |
| P-value | 0.038 | - | 0.108 | - | 0.777 | - | 0.150 | - | - | 0.717 | - | 0.539 | - |
| miR-183 |
| Mean | 3.35 | 3.04 | 4.73 | 1.65 | 2.62 | 5.59 | 3.67 | 2.50 | 1.21 | 4.81 | 2.72 | 2.22 | 3.51 |
| P-value | 0.499 | - | 0.012 | - | 0.083 | - | 0.385 | - | - | 0.120 | - | 0.370 | - |
| miR-18a |
| Mean | 1.86 | 4.58 | 4.01 | 3.21 | 2.61 | 8.15 | 3.52 | 4.14 | 2.94 | 6.62 | 2.82 | 3.60 | 3.60 |
| P-value | 0.026 | - | 0.198 | - | 0 | - | 0.639 | - | - | 0 | - | 0.831 | - |
| miR-106a |
| Mean | 1.02 | 2.80 | 2.81 | 1.54 | 1.65 | 4.48 | 2.53 | 1.34 | 1.57 | 3.82 | 1.73 | 1.66 | 2.36 |
| P-value | 0.033 | - | 0.035 | - | 0.001 | - | 0.334 | - | - | 0.003 | - | 0.501 | - |
| miR-18b |
| Mean | 1.44 | 2.98 | 2.81 | 2.06 | 2.03 | 4.22 | 2.46 | 2.55 | 1.95 | 3.49 | 2.15 | 2.23 | 2.50 |
| P-value | 0.036 | - | 0.064 | - | 0.009 | - | 0.740 | - | - | 0.013 | - | 0.902 | - |
| miR-93 |
| Mean | 1.04 | 1.99 | 2.02 | 1.29 | 1.38 | 2.85 | 1.75 | 1.41 | 1.47 | 2.21 | 1.50 | 0.91 | 1.93 |
| P-value | 0.189 | - | 0.162 | - | 0.001 | - | 0.516 | - | - | 0.001 | - | 0.339 | - |
| miR-451 |
| Mean | 0.72 | 0.75 | 0.50 | 0.97 | 0.67 | 1.08 | 0.68 | 0.78 | 1.04 | 0.64 | 0.77 | 0.59 | 0.80 |
| P-value | 0.651 | - | 0 | - | 0.321 | - | 0.152 | - | - | 0.504 | - | 0.332 | - |
| miR-495 |
| Mean | 0.75 | 0.83 | 0.87 | 0.74 | 0.85 | 0.57 | 0.73 | 1.10 | 0.61 | 0.81 | 0.80 | 0.62 | 0.87 |
| P-value | 0.034 | - | 0.801 | - | 0.210 | - | 0.574 | - | - | 0.879 | - | 0.374 | - |
| miR-409-3p |
| Mean | 0.56 | 0.87 | 0.79 | 0.74 | 0.73 | 0.90 | 0.77 | 0.87 | 0.45 | 0.56 | 0.82 | 0.93 | 0.70 |
| P-value | 0.052 | - | 0.859 | - | 0.433 | - | 0.021 | - | - | 0.093 | - | 0.191 | - |
| miR-497 |
| Mean | 0.86 | 0.64 | 0.73 | 0.71 | 0.78 | 0.44 | 0.71 | 0.72 | 0.81 | 0.31 | 0.83 | 0.43 | 0.83 |
| P-value | 0.705 | - | 0.260 | - | 0.188 | - | 0.421 | - | - | 0.002 | - | 0.024 | - |
| miR-133b |
| Mean | 0.53 | 0.69 | 0.66 | 0.60 | 0.61 | 0.71 | 0.63 | 0.50 | 0.89 | 0.20 | 0.74 | 0.61 | 0.64 |
| P-value | 0.321 | - | 0.667 | - | 0.654 | - | 0.850 | - | - | 0.002 | - | 0.993 | - |
| miR-136 |
| Mean | 0.83 | 0.77 | 0.66 | 0.91 | 0.76 | 0.95 | 0.82 | 0.83 | 0.49 | 0.69 | 0.82 | 0.77 | 0.80 |
| P-value | 0.894 | - | 0.950 | - | 0.551 | - | 0.103 | - | - | 0.961 | - | 0.611 | - |
| miR-29c |
| Mean | 0.74 | 0.79 | 0.79 | 0.76 | 0.80 | 0.64 | 0.67 | 0.74 | 1.52 | 0.50 | 0.85 | 0.59 | 0.85 |
| P-value | 0.673 | - | 0.117 | - | 0.295 | - | 0.323 | - | - | 0.327 | - | 0.315 | - |
RNA preparation and microRNA
microarray
RNA extraction of cells and tissue samples were
performed with the mirVana miRNA Isolation kit (Ambion, Austin, TX,
USA) according the manufacturer's instructions. Small RNA molecules
(smaller than 200 nt) were separated and purified from long RNA
molecules (longer than 200 nt) using this procedure. RNA molecules
of 100 ng underwent microRNA expression profiling following the
microRNA microarray protocol (Agilent Technologies, Santa Clara,
USA). For dephosphorylation and ligation, 17 units of calf
intestine alkaline phosphatase (GE Healthcare, Amersham, UK) and 20
units of T4 RNA ligase (Ambion) were used. Each sample was
hybridized on Human microRNA Microarray v.2 (Agilent Technologies)
containing probes for 723 human microRNAs. Slides were scanned
using an Agilent G2565BA scanner and images were processed using
Feature Extraction software v.9.5.3.1 (Agilent Technologies).
Quantitative real-time PCR (Q-PCR)
analysis of mature miRNAs
Total RNA, including miRNA, was extracted from cells
and tissues using an miRNeasy kit (Qiagen, Germany). The miRNAs and
other noncoding RNAs were polyadenylated by poly(A) polymerase and
subsequently converted into cDNA by reverse transcriptase with
oligo-dT priming (Qiagen). The cDNA was then used for real-time PCR
quantification of any miRNA, noncoding RNA or mRNA. The cDNA served
as the template for real-time PCR. Analysis was performed on an ABI
Prism 7000 (Applied Biosystems, Foster City, CA, USA) using the
miScript Primer Assay in combination with the miScript SYBR-Green
PCR kit (Qiagen). miRNAs were amplified using the miScript
Universal Primer, which primes from the universal tag sequence,
with the miRNA-specific primer (Qiagen). Data were analyzed using
the comparative Ct method. The specificity of the resulting PCR
products was confirmed by melting curves.
Statistical and bioinformatics
analysis
Data were analyzed by subtracting the background and
normalizing the signals using a locally-weighted regression
(LOWESS) filter. They were then log2-transformed and normalized for
between-array comparison using quantile normalization. microRNAs
with p-values <0.05 were selected for further analysis. We used
ANOVA and class prediction statistical tools to identify
significantly different levels of miRNA expression in gastric
cancer cell lines and normal gastric mucosa. Microarray data were
hierarchically clustered using the GeneCluster program, and
dendrograms and expression maps were generated using Java Treeview
version 1.0 (Department of Genetics, Stanford University School of
Medicine, Stanford, CA, USA) (14).
To perform survival analysis and generate
Kaplan-Meier survival curves, miRNA levels measured on Q-PCR were
converted into discrete variables by splitting the samples into two
classes (high and low expression) using the respective mean level
of miRNA expression as the threshold. Survival curves were compared
by log-rank analysis. A 95% confidence interval used in tests for
significance.
Results
miRNA expression signature of gastric
cancer cell lines relative to normal gastric mucosa
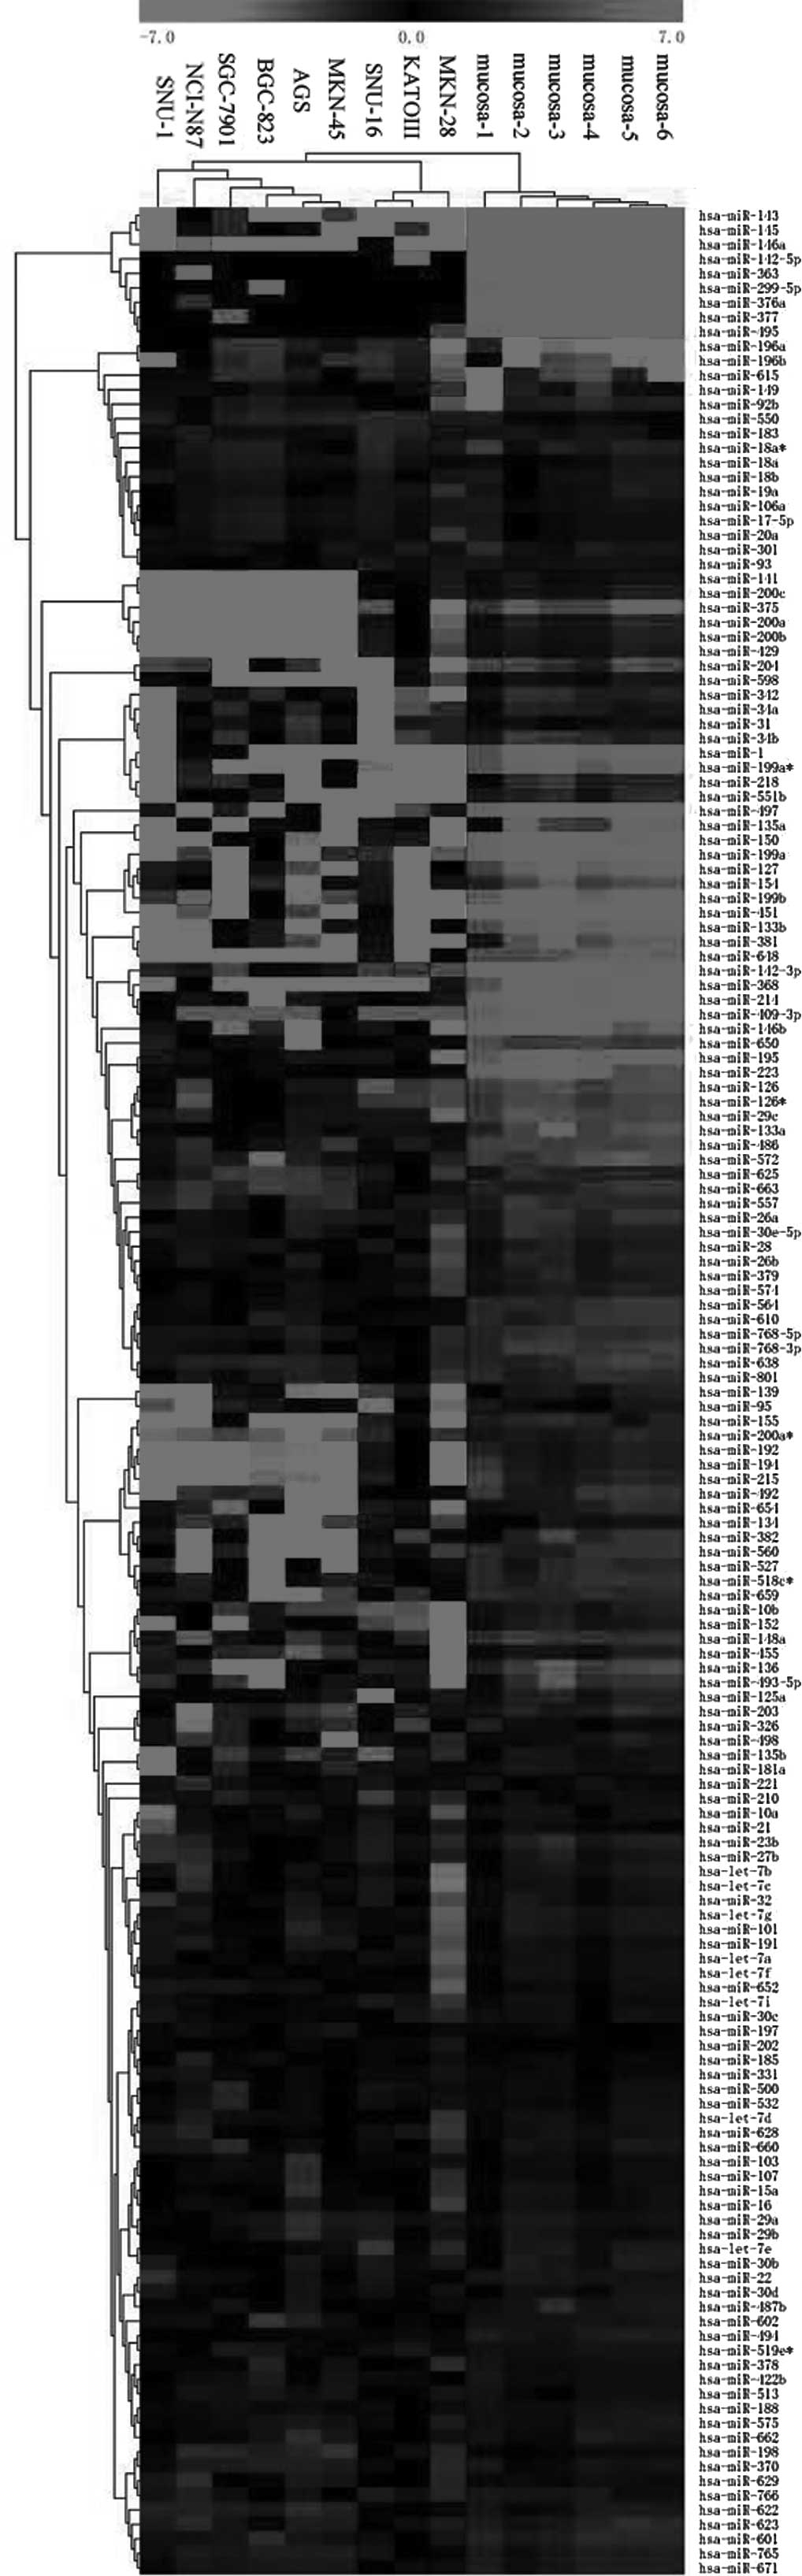
We performed an miRNA microarray to evaluate the
miRNA expression profiles of gastric cancer cell lines and normal
gastric mucosa. The miRNA expression pattern was found to be
significantly different. The miRNA microarray identified 17 miRNAs
that were upregulated in gastric cancer cell lines and 146 that
were downregulated relative to normal gastric mucosa. Table I lists all 17 upregulated miRNAs
and 29 log ratio <−5.0 downregulated miRNAs.
| Table IRelative expression of 46 miRNAs in
gastric cancer cell lines and normal gastric mucosa. |
Table I
Relative expression of 46 miRNAs in
gastric cancer cell lines and normal gastric mucosa.
| Upregulated
miRNAs | Downregulated
miRNAs |
|---|
|
|
|
|---|
| No. | miRNA | Log ratio | miRNA | Log ratio |
|---|
| 1 | hsa-miR-196a | 5.69 | hsa-miR-376a | −12.52 |
| 2 | hsa-miR-615 | 4.24 | hsa-miR-145 | −12.49 |
| 3 | hsa-miR-196b | 4.20 | hsa-miR-143 | −12.44 |
| 4 |
hsa-miR-18a* | 2.84 | hsa-miR-451 | −10.38 |
| 5 | hsa-miR-92b | 2.59 | hsa-miR-142-5p | −9.62 |
| 6 | hsa-miR-149 | 2.38 | hsa-miR-1 | −8.94 |
| 7 | hsa-miR-550 | 2.37 | hsa-miR-377 | −8.85 |
| 8 | hsa-miR-183 | 1.95 | hsa-miR-495 | −8.79 |
| 9 | hsa-miR-301 | 1.88 | hsa-miR-409-3p | −8.71 |
| 10 | hsa-miR-18a | 1.81 | hsa-miR-368 | −8.54 |
| 11 | hsa-miR-106a | 1.68 | hsa-miR-142-3p | −8.05 |
| 12 | hsa-miR-17-5p | 1.58 | hsa-miR-150 | −8.01 |
| 13 | hsa-miR-18b | 1.53 | hsa-miR-497 | −8.00 |
| 14 | hsa-miR-19a | 1.45 | hsa-miR-214 | −7.66 |
| 15 | hsa-miR-221 | 1.34 | hsa-miR-199a | −7.43 |
| 16 | hsa-miR-93 | 1.30 | hsa-miR-146b | −7.30 |
| 17 | hsa-miR-20a | 1.26 | hsa-miR-133b | −7.06 |
| 18 | - | - | hsa-miR-127 | −6.99 |
| 19 | - | - |
hsa-miR-199a* | −6.59 |
| 20 | - | - | hsa-miR-381 | −6.56 |
| 21 | - | - | hsa-miR-195 | −6.54 |
| 22 | - | - | hsa-miR-648 | −6.46 |
| 23 | - | - | hsa-miR-223 | −6.41 |
| 24 | - | - | hsa-miR-135a | −5.99 |
| 25 | - | - | hsa-miR-146a | −5.98 |
| 26 | - | - | hsa-miR-136 | −5.21 |
| 27 | - | - | hsa-miR-126 | −5.11 |
| 28 | - | - | hsa-miR-29c | −5.04 |
| 29 | - | - | hsa-miR-572 | −5.03 |
Cluster analysis based on miRNAs differentially
expressed between gastric cancer cell lines and normal gastric
mucosa demonstrated a general difference between the 2 groups
(Fig. 1). The expression patterns
appeared to be consistent within the 9 gastric cancer cell lines
and within the 6 normal gastric mucosa lines, and there was a more
clear distinction between the 2 groups.
Expression of candidate miRNAs in gastric
cancer cell lines and tissues
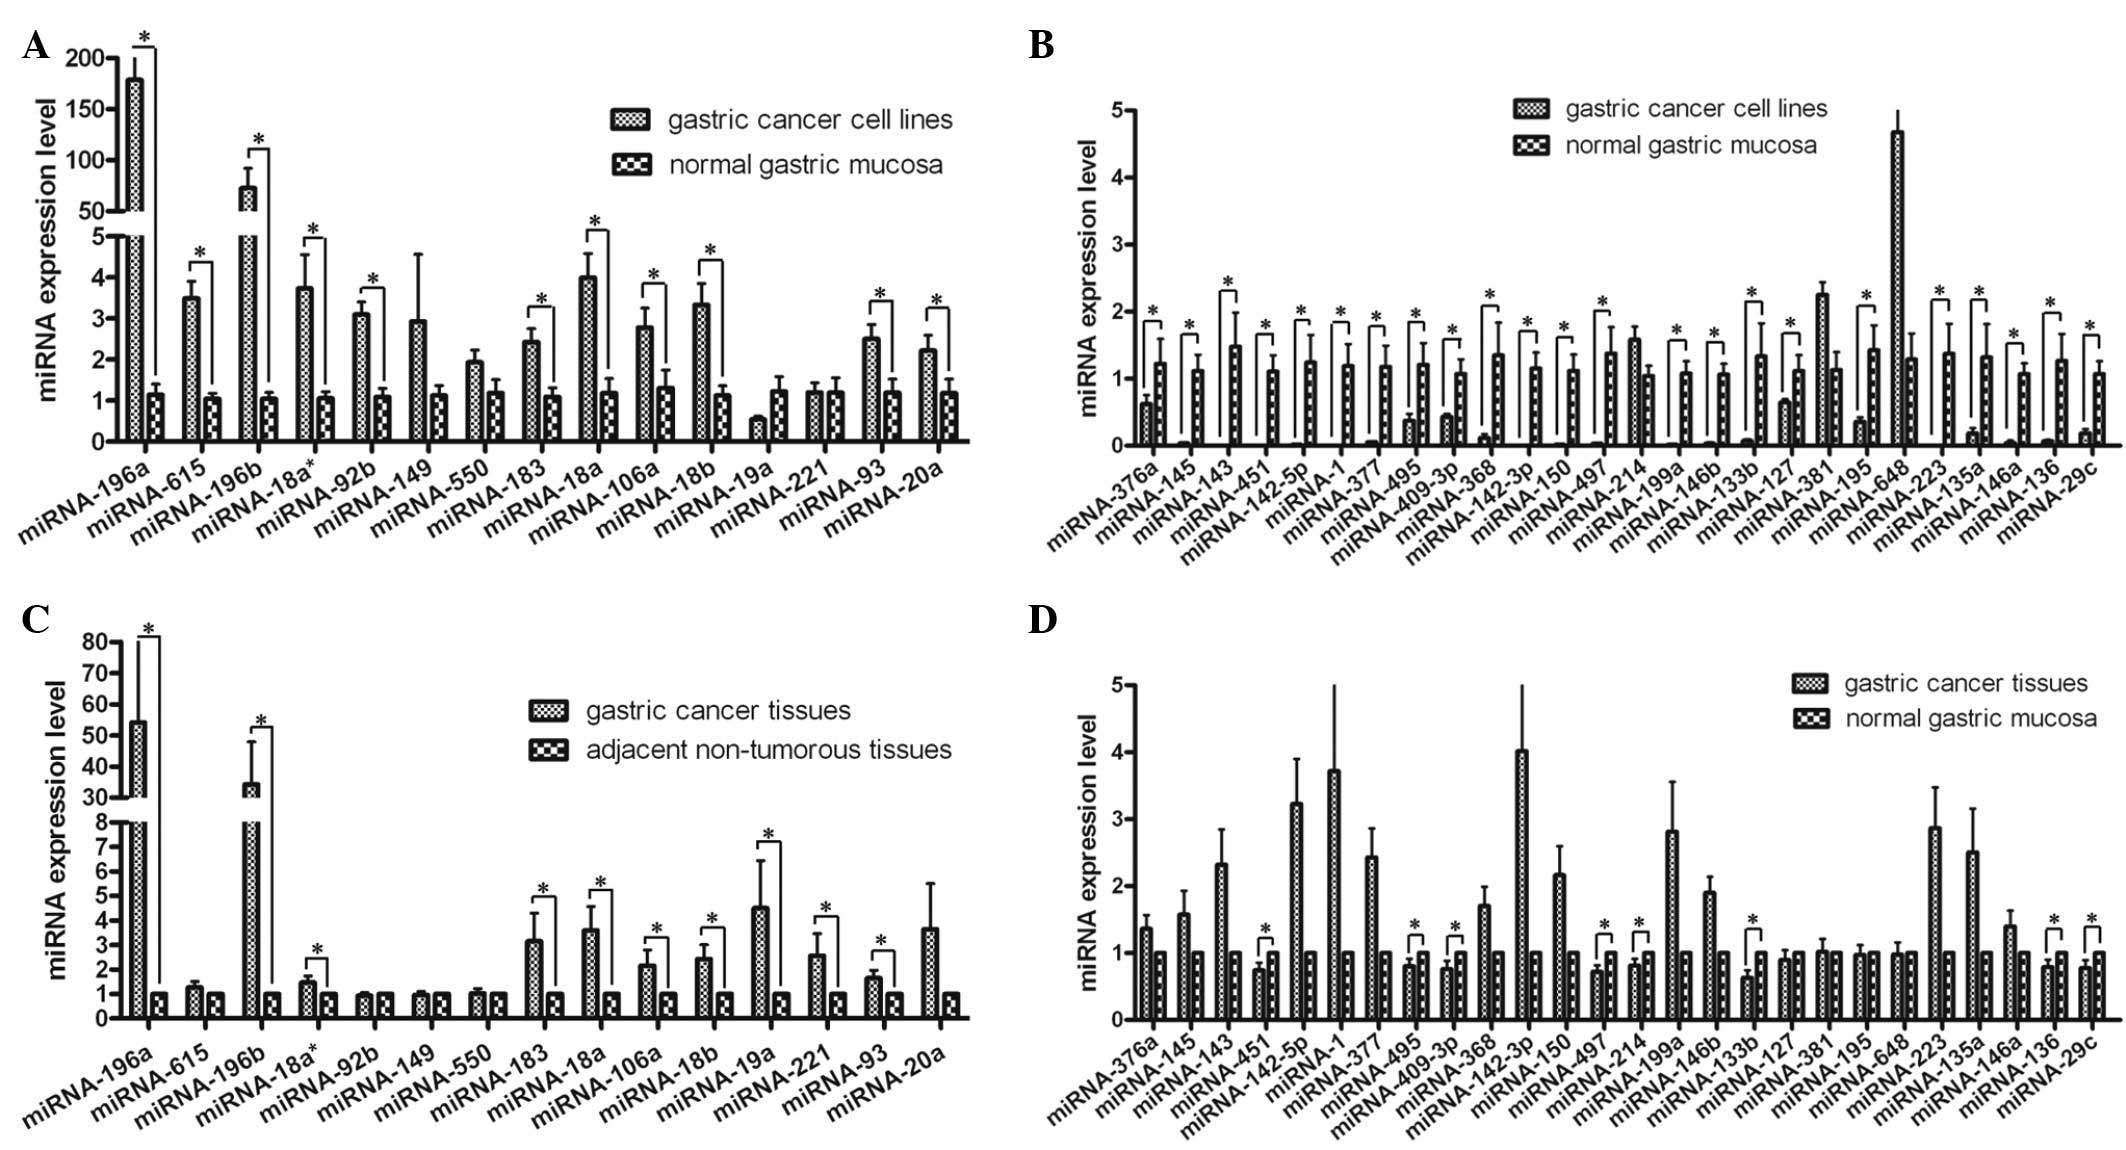
To validate the microarray findings, Q-PCR was
undertaken for the 9 gastric cancer cell lines, 6 normal gastric
mucosa, and a further 40 gastric cancer tissues and matched
adjacent non-tumorous tissues for 41 candidate miRNAs. Four miRNAs
had no commercial miRNA-specific primer: hsa-miR-17-5p,
hsa-miR-301, hsa-miR-199a* and hsa-miR-572. hsa-miR-126
is being studied by another research team at our facility.
Q-PCR-measured expression of the majority of selected miRNAs in
gastric cancer cell lines and normal gastric mucosa was consistent
with microarray results. The incidence of upregulated miRNAs and
downregulated miRNAs across the cancerous and normal samples was
73.33% (11/15) and 88.46% (23/26), respectively (Fig. 2A and B). Moreover, as expected,
certain discrepancies were detected when miRNA microarray data were
validated with Q-PCR-measured expression levels. Nevertheless, the
expression level of 41 miRNAs using Q-PCR showed a great deal of
diversity when compared to microarray data. The incidence of
upregulated miRNAs was 66.67% (10/15) and the incidence of
downregulated miRNAs was 30.77% (8/26) (Fig. 2C and D). This was likely to be due
to the high heterogeneity of cancer tissues relative to cancer cell
lines. According to the results of miRNA microarray and Q-PCR, 8
upregulated miRNAs (hsa-miR-196a, hsa-miR-196b,
hsa-miR-18a*, hsa-miR-183, hsa-miR-18a, hsa-miR-106a,
hsa-miR-18b and hsa-miR-93) and 7 downregulated miRNAs
(hsa-miR-451, hsa-miR-495, hsa-miR-409-3p, hsa-miR-497,
hsa-miR-133b, hsa-miR-136 and hsa-miR-29c) were identified.
Clinicopathological association of
expression levels of 15 miRNAs in gastric cancer
The expression levels of 15 miRNAs were assessed by
Q-PCR in 40 primary gastric cancer samples and their matched
adjacent non-tumorous counterparts. The mean miRNA expression level
and the correlation between miRNA expression and
clinicopathological features is shown in Table II. Among the upregulated miRNAs,
miR-196a and miR-183 were expressed more highly in male than in
female patients (p<0.05). miR-196b expression was correlated
with gender, differentiation and degree of infiltration (p=0.014,
p<0.001 and p=0.001, respectively). miR-18a* was more
highly expressed in older patients (≥60 years old) and miR-93 was
correlated with differentiation and degree of infiltration
(p<0.05). miR-18a and miR-18b were associated with age,
differentiation and degree of infiltration (p<0.05). miR-106a
had an association with age, gender, differentiation and degree of
infiltration (p<0.05). Among the downregulated miRNAs, miR-451
was correlated with gender (p<0.001) and miR-495 was correlated
with age (p=0.034). The miR-409-3p was associated with Borrmann
type and miR-497 with the degree of infiltration and TNM stage
(p<0.05). The miR-133b was expressed less in serosal-invaded
samples than in subserosal samples (p=0.002).
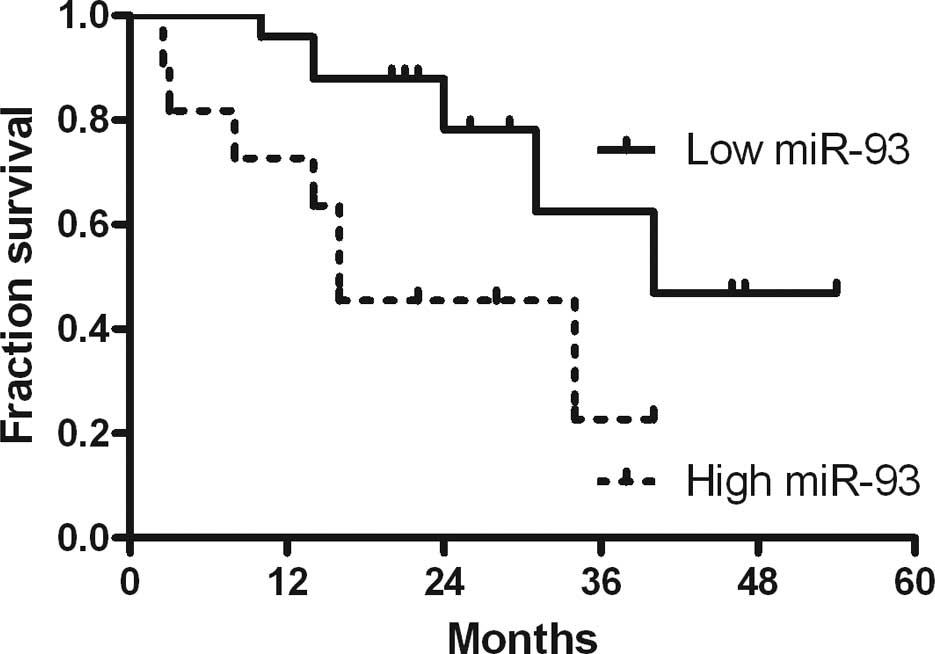
Survival curve of selected miRNAs
To determine the impact of these 15 miRNAs on
survival, Kaplan-Meier survival curves were created and analyzed.
The curves were compared using log-rank analysis and the binomial
variable of high or low expression relative to the mean expression
of each miRNA based on the results of Q-PCR. Survival information
was available for 36 out of 40 patients. One miRNA of interest was
identified: hsa-miR-93 (Fig. 3).
High expression of hsa-miR-93, which was observed in 70% (25/36) of
the gastric cancer patients, was correlated with 16 months median
survival time compared with 40 months for the low expression group.
The median survival time for all patients was 22.96 months.
Discussion
The role of miRNAs in various cancers has received
extensive study in recent years. miRNAs play an important role in
various physiological and developmental processes, such as cellular
differentiation and organism development. They are capable of
acting as either potent oncogenes or tumor suppressor genes
(15–17). Guo et al reported that the
mir-17–92 cluster, miR-20b, miR-106a, miR-21, miR-106b, miR-18b,
miR-421, miR-340* and miR-658 were highly expressed in
gastric cancer tissues (18).
miR-106b, miR-93 and miR-25 overexpression caused gastric cancer
cells to be less sensitive to TGFβ-dependent cell-cycle arrest and
apoptosis (19).
To understand the role of miRNAs in gastric cancer,
a signature miRNA expression profile of gastric cancer cell lines
was created and compared to the miRNA expression profile of normal
gastric mucosa. Our team found that certain miRNAs were closely
related to the development of gastric cancer. These results
contribute greatly to understanding the molecular basis of human
gastric cancer and suggest that aberrant expression of miRNA may be
important in the pathogenesis of gastric cancer. Moreover,
hsa-miR-93 was found to be significantly associated with duration
of survival. This was determined from a quantitative examination of
long- and short-term survivors.
Since one miRNA is capable of modulating the
activity of multiple genes, miRNA profiling may provide new and
complementary insights into the genetic pathways involved in cancer
development (20). Aberrant miRNA
expression patterns have been described in a variety of
hematological and solid-organ malignancies. The present study
contributes to the growing understanding of the role of miRNAs in
oncogenesis and describes the global expression patterns of miRNAs
in gastric cancer. More importantly, data such as ours may help
guide clinicians when determining who should or should not receive
aggressive therapy.
Acknowledgements
This study was supported by the National Natural
Scientific Foundation of China (no. 30872476), the National High
Technology Research and Development Program of China (863 Program;
no. 2006AA02A301 and no. 2007AA02Z179), the Science and Technology
Commission of Shanghai Municipality (no. 09DZ1950100, no.
09DZ2260200 and no. 10JC1411100) and the Shanghai Key Discipline
(S30204) and Key Projects in the National Science and Technology
Pillar Program (no. 2008BA152B03).
References
|
1
|
Tan YK and Fielding JW: Early diagnosis of
early gastric cancer. Eur J Gastroenterol Hepatol. 18:821–829.
2006. View Article : Google Scholar : PubMed/NCBI
|
|
2
|
Pillai RS: MicroRNA function: multiple
mechanisms for a tiny RNA? RNA. 11:1753–1761. 2005. View Article : Google Scholar : PubMed/NCBI
|
|
3
|
Filipowicz W, Bhattacharyya SN and
Sonenberg N: Mechanisms of post-transcriptional regulation by
microRNAs: are the answers in sight? Nat Rev Genet. 9:102–114.
2008. View
Article : Google Scholar : PubMed/NCBI
|
|
4
|
Wijnhoven BP, Michael MZ and Watson DI:
MicroRNAs and cancer. Br J Surg. 94:23–30. 2007. View Article : Google Scholar
|
|
5
|
Bushati N and Cohen SM: microRNA
functions. Annu Rev Cell Dev Biol. 23:175–205. 2007. View Article : Google Scholar
|
|
6
|
Calin GA, Sevignani C, Dumitru CD, et al:
Human microRNA genes are frequently located at fragile sites and
genomic regions involved in cancers. Proc Natl Acad Sci USA.
101:2999–3004. 2004. View Article : Google Scholar : PubMed/NCBI
|
|
7
|
Calin GA, Liu CG, Sevignani C, et al:
MicroRNA profiling reveals distinct signatures in B cell chronic
lymphocytic leukemias. Proc Natl Acad Sci USA. 101:11755–11760.
2004. View Article : Google Scholar : PubMed/NCBI
|
|
8
|
Yanaihara N, Caplen N, Bowman E, et al:
Unique microRNA molecular profiles in lung cancer diagnosis and
prognosis. Cancer Cell. 9:189–198. 2006. View Article : Google Scholar : PubMed/NCBI
|
|
9
|
Fassan M, Baffa R, Palazzo JP, Lloyd J,
Crosariol M, Liu CG, Volinia S, Alder H, Rugge M, Croce CM and
Rosenberg A: MicroRNA expression profiling of male breast cancer.
Breast Cancer Res. 11:R582009. View
Article : Google Scholar : PubMed/NCBI
|
|
10
|
Michael MZ, O'Connor SM, van Holst
Pellekaan NG, Young GP and James RJ: Reduced accumulation of
specific microRNA in colorectal neoplasia. Mol Cancer Res.
1:882–891. 2003.PubMed/NCBI
|
|
11
|
Zamore PD and Haley B: Ribo-genome: the
big world of small RNAs. Science. 309:1519–1524. 2005. View Article : Google Scholar : PubMed/NCBI
|
|
12
|
Siomi H and Siomi MC: Posttranscriptional
regulation of microRNA biogenesis in animals. Mol Cell. 38:323–332.
2010. View Article : Google Scholar : PubMed/NCBI
|
|
13
|
Lu J, Getz G, Miska EA, et al: MicroRNA
expression profiles classify human cancers. Nature. 435:834–838.
2005. View Article : Google Scholar : PubMed/NCBI
|
|
14
|
Eisen MB, Spellman PT, Brown PO and
Botstein D: Cluster analysis and display of genome-wide expression
patterns. Proc Natl Acad Sci USA. 95:14863–14868. 1998. View Article : Google Scholar : PubMed/NCBI
|
|
15
|
Kloosterman WP and Plasterk RH: The
diverse functions of microRNAs in animal development and disease.
Dev Cell. 11:441–450. 2006. View Article : Google Scholar : PubMed/NCBI
|
|
16
|
Volinia S, Calin GA, Liu CG, et al: A
microRNA expression signature of human solid tumors defines cancer
gene targets. Proc Natl Acad Sci USA. 103:2257–2261. 2006.
View Article : Google Scholar : PubMed/NCBI
|
|
17
|
Esquela-Kerscher A and Slack FJ: Oncomirs
- microRNAs with a role in cancer. Nat Rev Cancer. 6:259–269. 2006.
View Article : Google Scholar
|
|
18
|
Guo J, Miao Y, Xiao B, Huan R, Jiang Z,
Meng D and Wang Y: Differential expression of microRNA species in
human gastric cancer versus non-tumorous tissues. J Gastroenterol
Hepatol. 24:652–657. 2009. View Article : Google Scholar : PubMed/NCBI
|
|
19
|
Petrocca F, Visone R, Onelli MR, et al:
E2F1-regulated microRNAs impair TGFβ-dependent cell-cycle arrest
and apoptosis in gastric cancer. Cancer Cell. 13:272–286. 2008.
|
|
20
|
Michlewski G, Guil S, Semple CA and
Cáceres JF: Posttranscriptional regulation of miRNAs harboring
conserved terminal loops. Mol Cell. 32:383–393. 2008. View Article : Google Scholar : PubMed/NCBI
|