Introduction
Spinal cord injury (SCI) refers to any injury to the
spinal cord, and the symptoms may vary widely, from pain to
paralysis to incontinence. The more serious and profound
consequences of SCI are microscopic events following initial tissue
injury, including inflammation, necrosis, apoptosis and glial scar
formation (1). Microarrays have
been used to unveil the short-and long-term responses to SCI at the
molecular level, which identified rapid expression of immediate
early genes after SCI, followed by genes associated with
inflammation, oxidative stress, DNA damage and cell cycle (2-6).
Transcription factors, particularly those involved in cell damage
and death, including nuclear factor kappa B, c-JUN and suppressor
of cytokine signaling 3 were also observed to be upregulated
(7). Several of the above findings
have been proven by using experimental methods (8-10);
thus, data from DNA microarray analysis can be reliable and useful
for discovering novel targets for neuro-protective or restorative
therapeutic approaches.
In addition, microRNAs (miRNAs) that can
post-tran-scriptionally regulate the entire set of genes exhibited
altered expression following traumatic SCI (11). Previous studies have suggested that
miRNAs may act as mediators of neural plasticity (12) and possibly be involvement in
neurodegeneration (13).
In the present study, microarray data (GSE45006)
were used to screen differentially expressed genes (DEGs). Based on
the screened DEGs, protein-protein interaction (PPI) network was
then constructed and the roles of transcription factors and miRNAs
in the regulation of DEGs were further investigated with the
objective to expand the current knowlege on the molecular
mechanisms of SCI.
Materials and methods
Microarray data
The raw microarray data (GSE45006) were downloaded
from the Gene Expression Omnibus database (GEO; http://www.ncbi.nlm.nih.gov/geo/). The platform
was GPL1355 [Rat230_2] Affymetrix Rat Genome 230 2.0 Array. Data
from a total of 24 tissue samples from the epicenter area of normal
(n=4) and injured (n=20) rat thoracic spinal cords (T7) were used,
and the latter contained four samples from rats with spinal cord
injury after one day, three days as well as 1, 2 and 8 weeks,
respectively.
Microarray data pre-processing and
screening of DEGs
First, the extracted expression microarray data were
standardized using the Robust Multiarray Averaging (RMA) method
(14). Using the Bayesian
model-based method provided by the Linear Models for Microarray
(LIMMA) data package of R/Bioconductor (15), gene expression values in the
experimental groups at the five time-points after spinal cord
injury were compared with those in the normal samples. Genes with
|log2 fold change|>1 and P<0.05 were regarded as DEGs.
Subsequently, with reference to Zhang et al (16), DEGs that were significantly
differentially expressed by at least two-fold were selected as the
spinal cord injury tag genes (referred to as up-regulated genes and
down-regulated genes below). The screened DEGs were submitted to
the Database for Annotation, Visualization and Integrated Discovery
(DAVID) for Kyoto Encyclopedia of Genes and Genomes (KEGG) pathway
enrichment analysis using the module functional chart (P<0.05)
(17).
Screening of SCI-induced time-associated
genes and functional annotation
Changes in gene expression levels reflected by the
microarray may be caused by either biological factors or the
background noise (4). To exclude
the influence of background as far as possible, the standard
deviation of the expression value of each gene was calculated.
Assuming that a larger standard deviation cannot be solely caused
by abiotic factors such as background noise, genes were screened
according to the value of standard deviation by retaining those
with top 30% standard deviations. Through comparing several times,
screening the top 10, 15, 20 and 30% DEGs, it was confirmed that
this threshold was able to sufficiently balance the specificity and
sensitivity.
The Pearson correlation coefficient between the
expression levels of screened gense and the time after spinal cord
injury was calculated using R/Bioconductor software, with P=0.01
defined as the significant correlation level. As the sample size
was 24 in the present study, the correlation coefficient was
approximated to be >0.5 or <−0.5 at this significance level.
Positively and negatively DEGs meeting this criterion were
submitted to DAVID to analyze the enriched gene ontology (GO)
biological processes.
Construction of a protein-protein
interaction (PPI) network
To elucidate the interaction of the DEGs, the Search
Tool for the Retrieval of Interacting Genes/Proteins (STRING)
database was utilized to build an interaction network of encoding
products of DEGs (18). A STRING
score of 0.4 was set as the reliability threshold. The obtained
results were drawn into a network by Cytoscape software, version
2.8 (Institute of Systems Biology, Seattle, WA, USA). The degree of
interaction of each gene in the network was calculated.
Prediction of regulatory factors of
DEGs
The DEGs were submitted to GeneCodis (19) to evaluate which transcription
factors have binding sites to DEGs (data source, Transfac) at the
significance level using the Fisher’s exact test, in order to
predict whether the corresponding transcription factor is in an
activated or suppressed state, taking the value of 0.05 divided by
the number of tested transcription factors as the significance
threshold. Similarly, Fisher’s exact test was used to evaluate
which miRNAs enrich down-regulated DEGs to speculate which function
they have in SCI, taking the value of 0.05 divided by the number of
tested miRNAs as the significance threshold.
Results
Screening and biological pathway
enrichment analysis of DEGs
In total, 806 upregulated DEGs and 549 downregulated
DEGs were screened. According to the KEGG biological pathway
enrichment analysis, it was found that the upregulated DEGs were
significantly enriched in 13 pathways (P<0.05), including
lysosome, complement and coagulation cascades and extracellular
matrix-receptor interaction (Table
I). However, none of the downregulated DEGs were enriched in
any pathways.
 | Table IEnriched pathways of upregulated
differentially expressed genes. |
Table I
Enriched pathways of upregulated
differentially expressed genes.
| Pathway | P-value | Genes | Benjamini |
|---|
| rno04142:
Lysosome |
1.31×10⁻⁸ | ARSB, GM2A, LGMN,
HEXA, HEXB, ACP5, CTSA, CTSL1, CD68, LAPTM5, SCARB2, MAN2B1,
TCIRG1, CTSZ, LIPA, PLA2G15, GUSB, CD63, MANBA, CTSK, IGF2R, CTSD,
CTSC, CTSB, CLN5 |
1.93×10⁻⁶ |
| rno04610:
Complement and coagulation cascades |
1.40×10⁻⁷ | C3AR1, C5AR1,
F13A1, C1R, SERPING1, C1S, C1QC, PLAUR, C1QA, C1QB, THBD, SERPINE1,
CFH, C2, CFD, PROS1, PLAU, CR1L |
1.04×10⁻⁵ |
| rno04512:
ECM-receptor interaction |
1.31×10⁻⁶ | COL4A1, COL3A1,
ITGB1, COL5A2, COL5A1, CD47, SDC1, CD36, CD44, COL6A3, COL6A2,
COL6A1, COL1A1, LAMC1, THBS2, SPP1, THBS4, FN1 |
6.48×10⁻⁵ |
| rno04062: Chemokine
signaling pathway |
1.78×10⁻⁵ | CXCL1, ADCY4, CCL3,
CCL2, FGR, CCL9, NFKBIA, PF4, CXCL12, CCL7, PXN, CXCL10, RAC2,
CXCR4, RHOC, SHC1, LYN, HCK, STAT1, VAV1, PRKCD, GNGT2, CXCL14,
CXCL16, CX3CR1 |
6.58×10⁻⁴ |
| rno04510: Focal
adhesion |
2.01×10⁻⁵ | COL3A1, ITGB1, PXN,
RAC2, COL6A3, COL6A2, COL6A1, RHOC, SHC1, ZYX, THBS2, SPP1, FN1,
THBS4, COL4A1, IGF1, ACTN1, BIRC2, COL5A2, VAV1, VASP, COL5A1,
FLNA, CCND1, JUN, COL1A1, LAMC1 |
5.93×10⁻⁴ |
| rno03030: DNA
replication |
8.23×10⁻⁵ | RPA2, RFC3, MCM7,
RFC4, PCNA, MCM2, MCM3, MCM4, RPA3, MCM6 |
2.03×10⁻³ |
| rno04650: Natural
killer cell mediated cytotoxicity |
3.31×10⁻⁴ | ICAM1, PTPN6,
ITGB2, VAV1, HCST, CD48, CASP3, RAC2, FCGR2B, FCER1G, SHC1, FCGR3A,
IFNGR2, IFNGR1, TYROBP, LCP2 |
6.97×10⁻³ |
| rno04670: Leukocyte
transendothelial migration |
5.04×10⁻⁴ | ICAM1, NCF4, ACTN1,
ITGB2, MMP2, ITGB1, VAV1, CXCL12, VASP, PXN, CYBA, CYBB, EZR, RAC2,
CXCR4, RHOC, MSN |
9.29×10⁻³ |
| rno04666: Fc gamma
R-mediated phagocytosis |
9.50×10⁻⁴ | PTPRC, LYN, HCK,
ARF6, ARPC5, VAV1, PRKCD, VASP, ARPC1B, RAC2, FCGR2B, ARPC3,
FCGR1A, INPP5D |
1.55×10⁻² |
| rno04060:
Cytokine-cytokine receptor interaction |
1.11×10⁻³ | CCL3, CCL2, LTBR,
TNFRSF12A, IL18, TGFBR2, PF4, TNFSF13, TNFSF12, CXCL12, IL17RA,
CXCL10, TNFRSF1A, CXCL14, CXCR4, IL10RB, LOC688637, CXCL16, CX3CR1,
IFNGR2, CSF2RA, IFNGR1, CSF1R |
1.63×10⁻² |
| rno04623: Cytosolic
DNA-sensing pathway |
3.22×10⁻³ | DDX58, IRF7, IL18,
RIPK3, PYCARD, NFKBIA, IL33, CASP1, CXCL10 |
4.25×10⁻² |
| rno05322: Systemic
lupus erythematosus |
3.59×10⁻³ | ACTN1, C1R, C1S,
C1QC, RT1-DA, RT1-BB, C1QA, C1QB, FCGR2B, FCGR1A, SNRPB, C2,
FCGR3A |
4.33×10⁻² |
| rno04110: Cell
cycle |
3.66×10⁻³ | TGFB3, MCM2, MCM3,
CDK4, MCM4, TGFB1, MCM6, CCNB1, CCND1, MCM7, GADD45G, PCNA, MAD2L2,
MGC112830, MYC, GADD45A |
4.09×10⁻² |
Gene expression over time after SCI
Correlation analysis revealed that the levels of 314
DEGs were enhanced with increasing time after SCI (correlation
coefficient >0.5), while the expression levels of 253 DEGs were
decreased over time (correlation coefficient <−0.5).
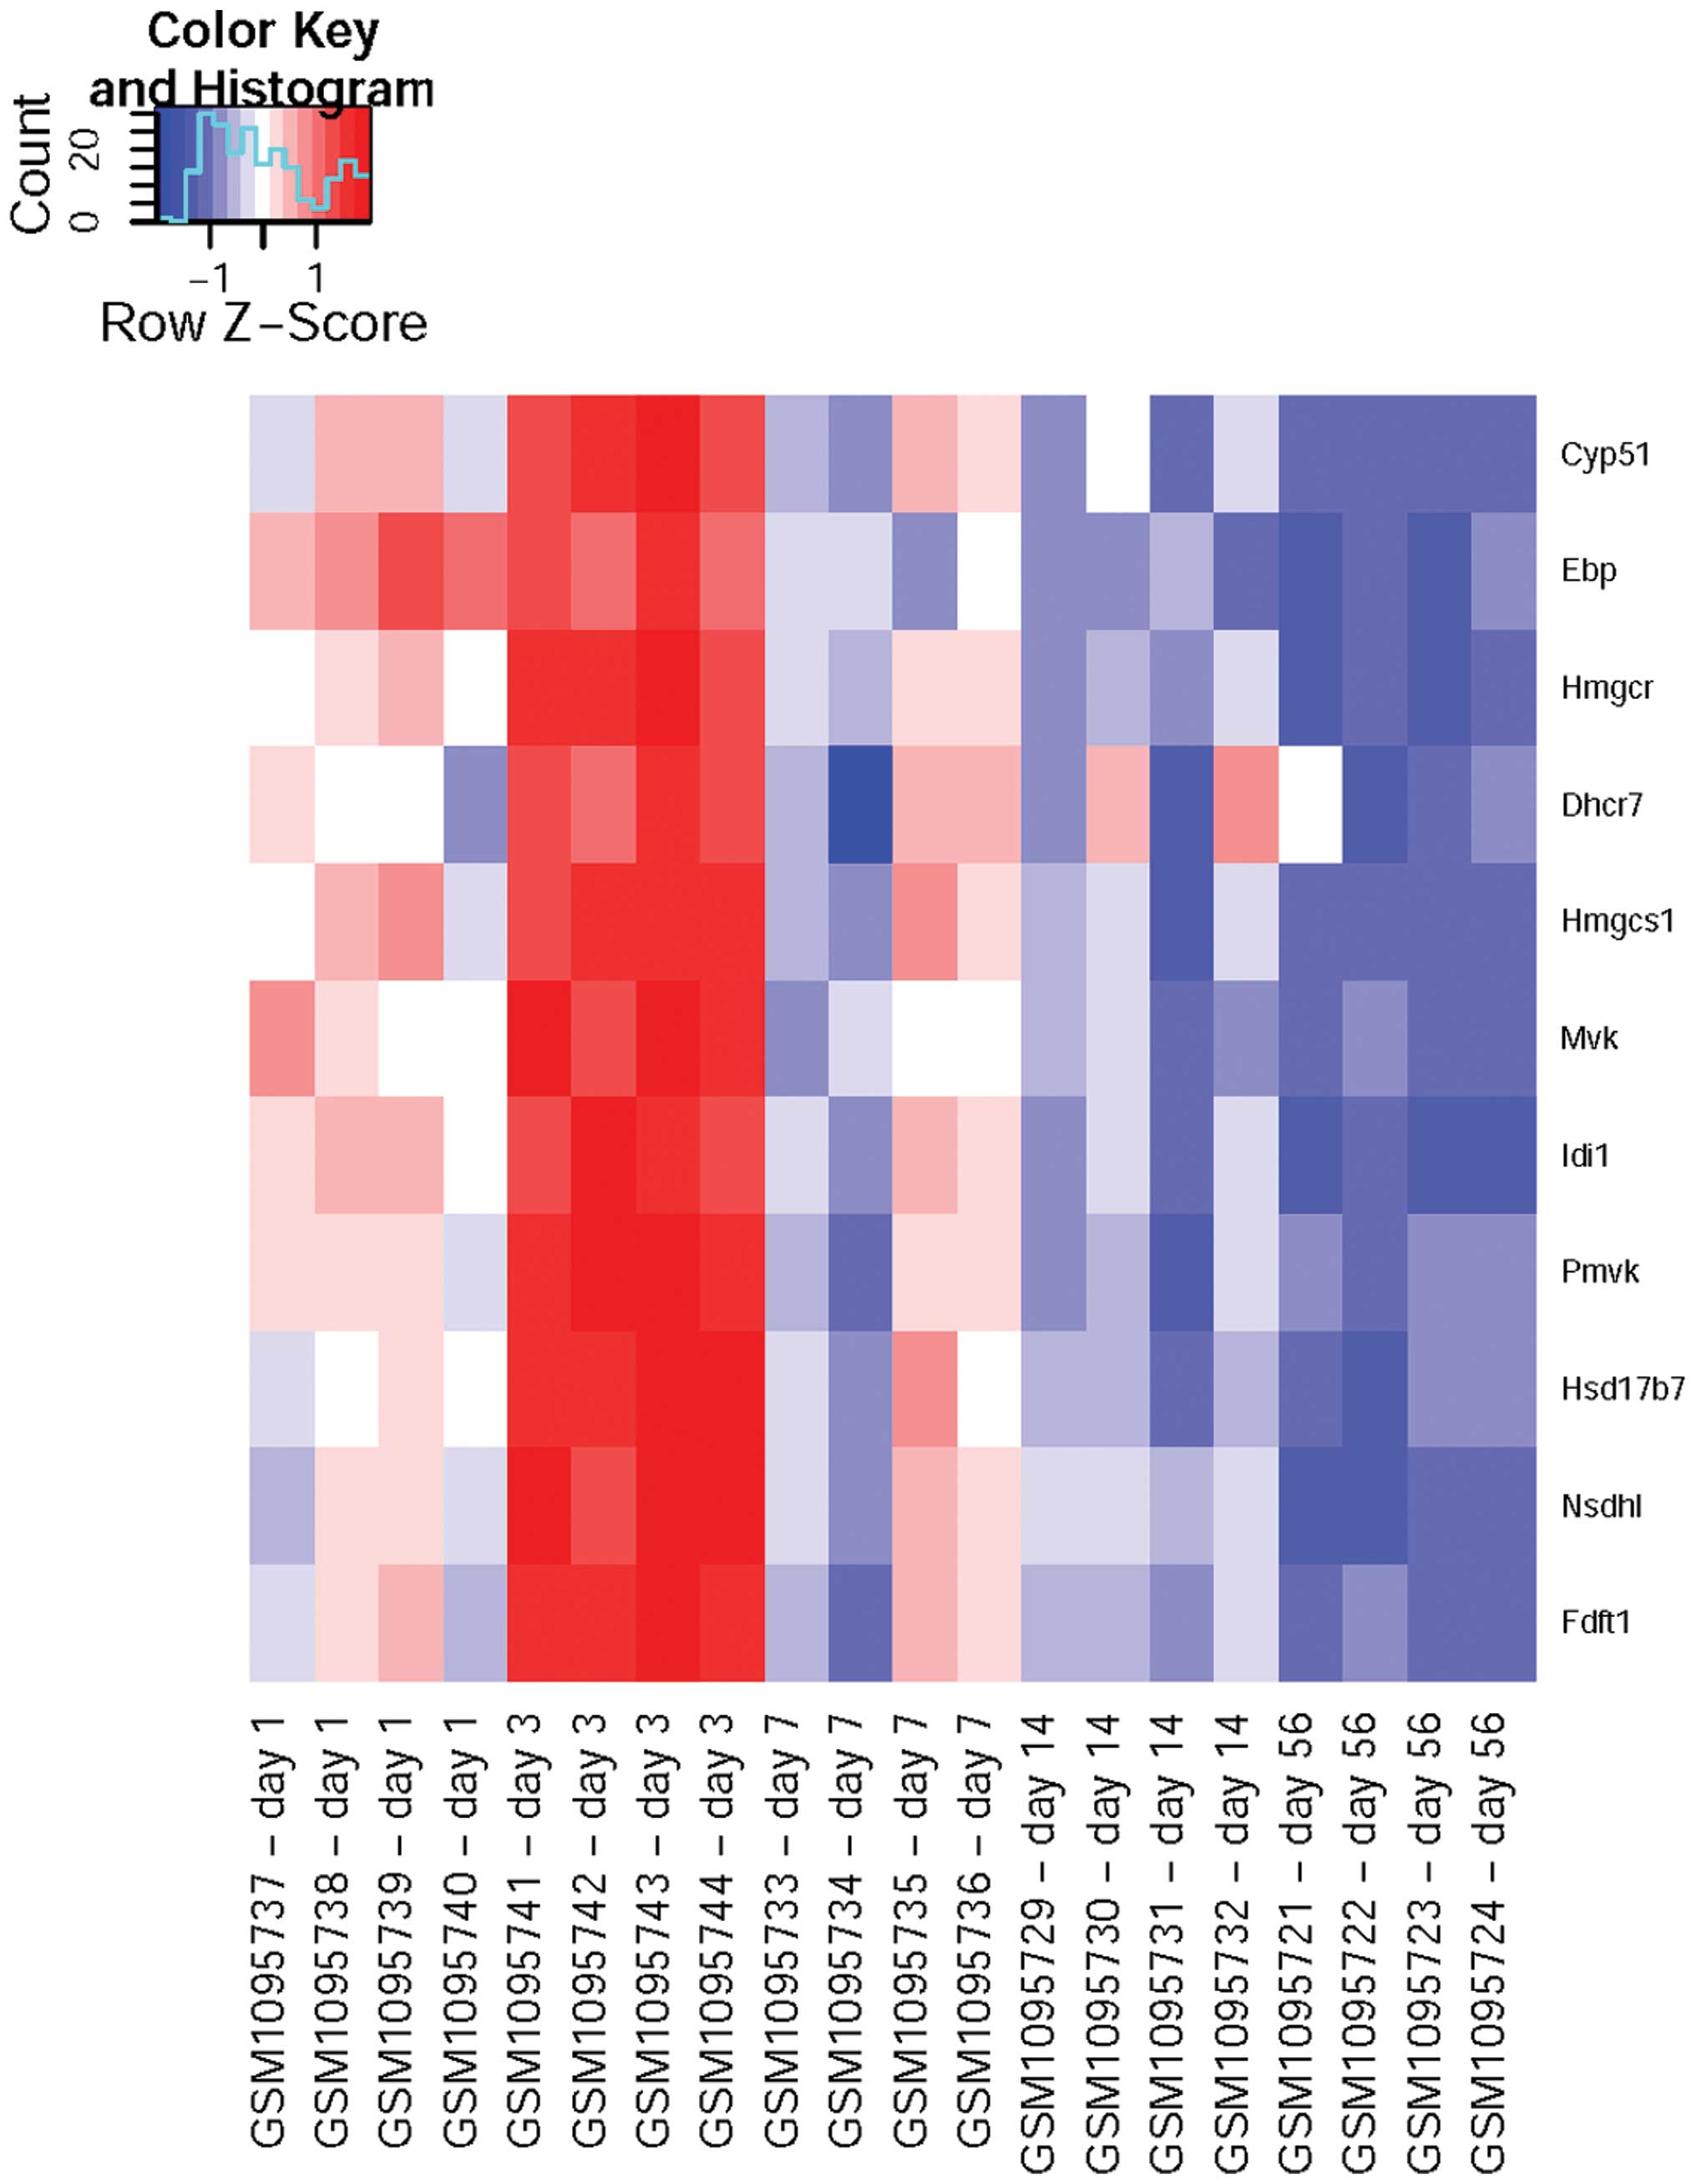
Through GO annotation, it was found that DEGs with
expression levels negatively correlated with time after SCI were
mainly cholesterol metabolism-associated genes (Table IIA), including CYP51,
EBP, HMGCR, DHCR7, HMGCS1, MVK,
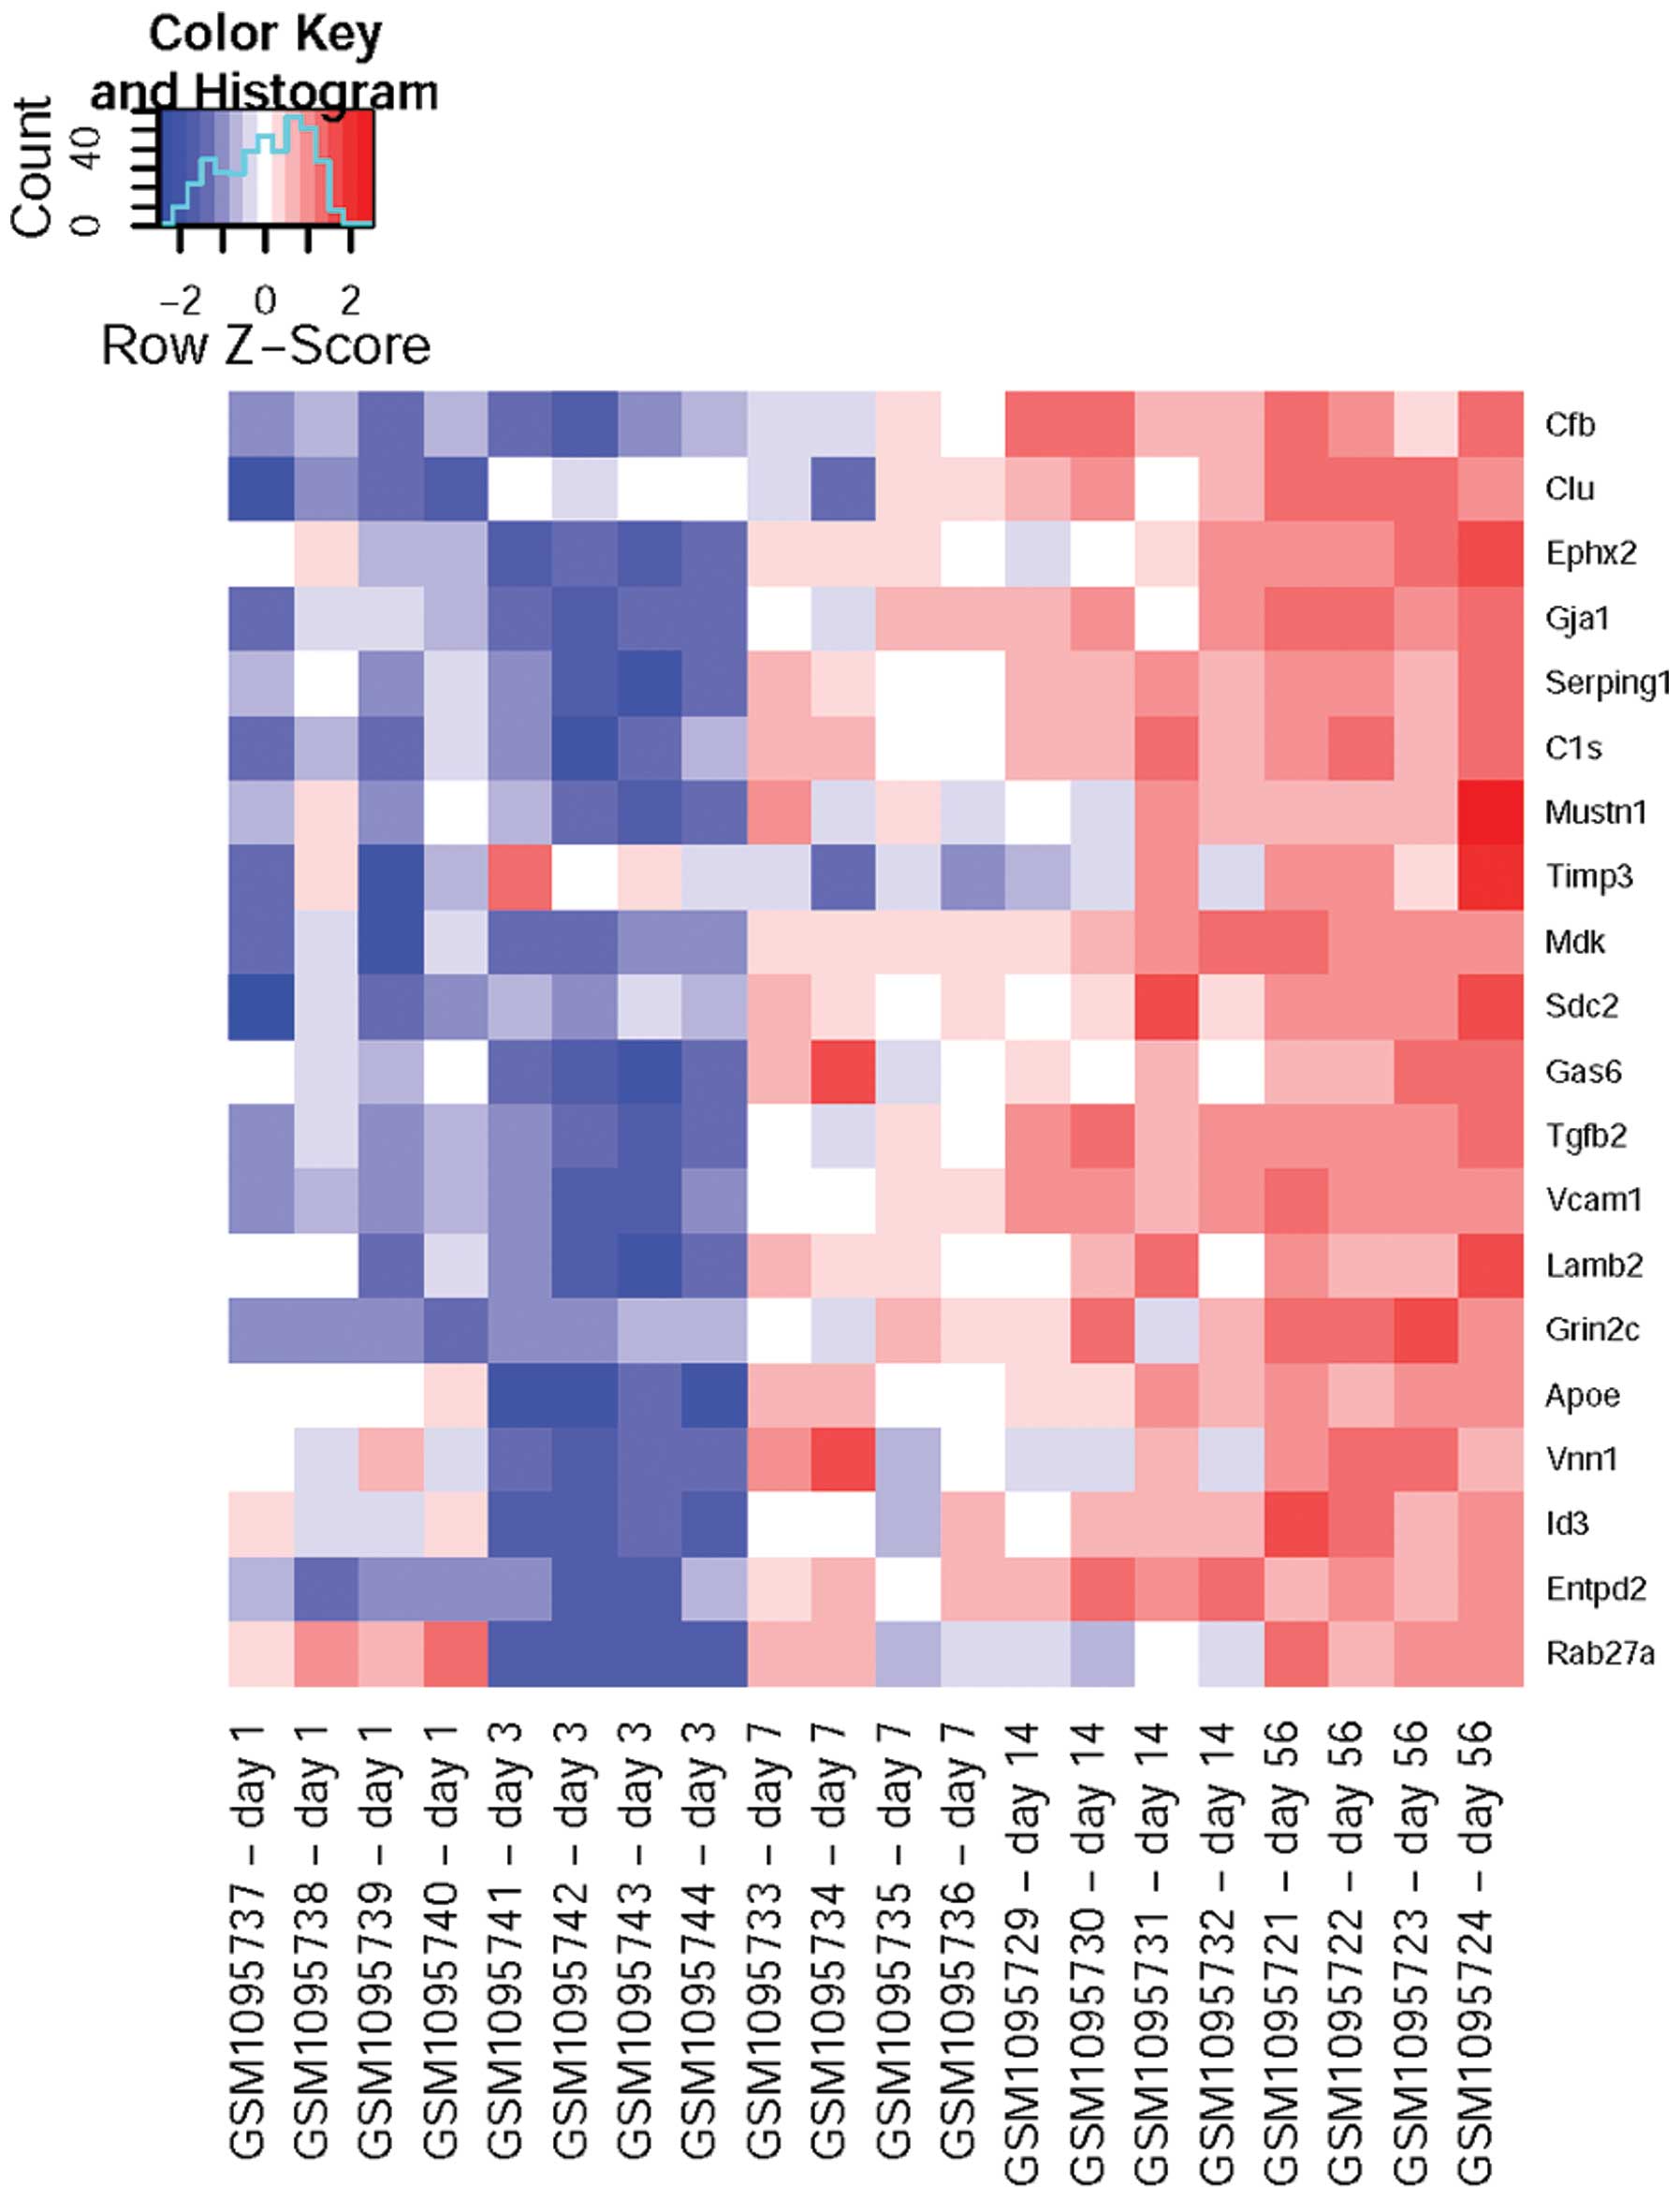
IDI1 and FDFT1, whereas those with expression levels
positively correlating with time were mainly involved in injury
response (Table IIB), including
SERPING1, C1S, ENTPD2 and RAB27A.
According to the heatmap (Fig. 1),
it was found that the expression levels of cholesterol
metabolism-associated DEGs peaked on day three after injury and
then dropped constantly, while the injury response-associated DEGs
were gradually upregulated after injury and peaked at the 8th week
(Fig. 2).
| Table IIEnriched GO biological processed of
DEGs. |
Table II
Enriched GO biological processed of
DEGs.
A, Enriched GO
biological processes of downregulated DEGs
|
|---|
| GO term and
function | P-value | DEGs | Benjamini |
|---|
| 0006695:
Cholesterol biosynthetic process |
2.48×10⁻¹³ | CYP51, EBP, HMGCR,
DHCR7, HMGCS1, MVK, IDI1, PMVK, HSD17B7, NSDHL, FDFT1 |
3.33×10⁻¹⁰ |
| 0016126: Sterol
biosynthetic process |
2.16×10⁻¹² | CYP51, EBP, HMGCR,
DHCR7, HMGCS1, MVK, IDI1, PMVK, HSD17B7, NSDHL, FDFT1 |
1.45×10⁻⁹ |
| 0008203:
Cholesterol metabolic process |
5.61×10⁻¹² | CYP51, EBP, HMGCR,
HMGCS1, PMVK, FDFT1, SREBF2, SQLE, DHCR7, MVK, IDI1, HSD17B7,
NSDHL, VLDLR |
2.52×10⁻⁹ |
| 0016125: Sterol
metabolic process |
1.63×10⁻¹¹ | CYP51, EBP, HMGCR,
HMGCS1, PMVK, FDFT1, SREBF2, SQLE, DHCR7, MVK, IDI1, HSD17B7,
NSDHL, VLDLR |
5.50×10⁻⁹ |
| 0008610: Lipid
biosynthetic process |
6.70×10⁻¹¹ | SCD1, CYP51, EBP,
HMGCR, FA2H, NDUFAB1, HMGCS1, ACLY, ACSS2, PMVK, FDFT1, SREBF2,
FAR1, AGPS, DHCR7, RGD1560015, MVK, PCYT2, AGPAT4, IDI1, HSD17B7,
NSDHL |
1.80×10⁻⁸ |
| 0006694: Steroid
biosynthetic process |
2.24×10⁻⁹ | CYP51, EBP, HMGCR,
RGD1560015, DHCR7, HMGCS1, MVK, IDI1, PMVK, HSD17B7, NSDHL,
FDFT1 |
5.03×10⁻⁷ |
| 0008202: Steroid
metabolic process |
3.08×10⁻⁸
5.91×10⁻⁶ | CYP51, EBP, HMGCR,
HMGCS1, PMVK, FDFT1, SREBF2, SQLE, DHCR7, RGD1560015, MVK, IDI1,
HSD17B7, NSDHL, VLDLR | |
B, Enriched GO
biological processes of upregulated DEGs
|
|---|
| GO term and
function | P-value | DEGs | Benjamini |
|---|
| 0010033: Response
to organic substance |
1.24×10⁻⁷ | RT1-M3-1, GJA1,
CDH1, C1S, TIMP2, MDK, CXCL12, TIMP3, SDC2, TGFB2, B2M, GSTM2,
SORBS1, APOE, SULT1A1, LCAT, GPX3, CD4, BOC, NR1H3, SREBF1, TXNIP,
PLAT, CFB, SLC22A8, IGF2, NR4A3, STAT1, PRKCD, CYP7B1, CDKN1B, ID2,
PTGDS, BTG1, ALDH2, NFE2L2, ID3, IGFBP2, MGST1 |
2.38×10⁻⁴ |
| 0042493: Response
to drug |
2.84×10⁻⁵ | TXNIP, SREBF1,
ATP1A1, CDH1, IGF2, TIMP2, STAT1, MDK, PRKCD, MMP12, TGFB2, B2M,
CYP7B1, CDKN1B, GPX3, SLC22A5, IGFBP2, MGST1 |
2.68×10⁻² |
| 0009611: Response
to wounding |
7.28×10⁻⁵ | CFB, CLU, EPHX2,
GJA1, SERPING1, C1S, MUSTN1, TIMP3, MDK, SDC2, GAS6, TGFB2, VCAM1,
LAMB2, GRIN2C, APOE, VNN1, ID3, ENTPD2, RAB27A |
4.54×10⁻² |
| 0042127: Regulation
of cell proliferation |
9.35×10⁻⁵ | IFITM3, CLU, PAX6,
GJA1, SOX4, PRRX2, IL34, TIMP2, DDR2, CXCL12, TGFB2, VCAM1, EDNRB,
APOE, HEY2, TXNIP, CRIP2, STAT1, MMP12, CYP7B1, CDKN1B, ID2, DBP,
BTG1, ID3, PMP22 |
4.38×10⁻² |
| 0009725: Response
to hormone stimulus |
1.01×10⁻⁴ | PLAT, TXNIP,
SREBF1, GJA1, IGF2, NR4A3, STAT1, PRKCD, MDK, TIMP3, CXCL12, TGFB2,
CDKN1B, PTGDS, SORBS1, BTG1, SULT1A1, LCAT, GPX3, ALDH2, IGFBP2,
NR1H3 |
3.79×10⁻² |
| 0009719: Response
to endogenous stimulus |
1.88×10⁻⁴ | PLAT, SREBF1,
TXNIP, GJA1, IGF2, NR4A3, STAT1, PRKCD, MDK, TIMP3, CXCL12, TGFB2,
CDKN1B, PTGDS, SORBS1, BTG1, SULT1A1, LCAT, GPX3, ALDH2, IGFBP2,
MGST1, NR1H3 |
5.82×10⁻² |
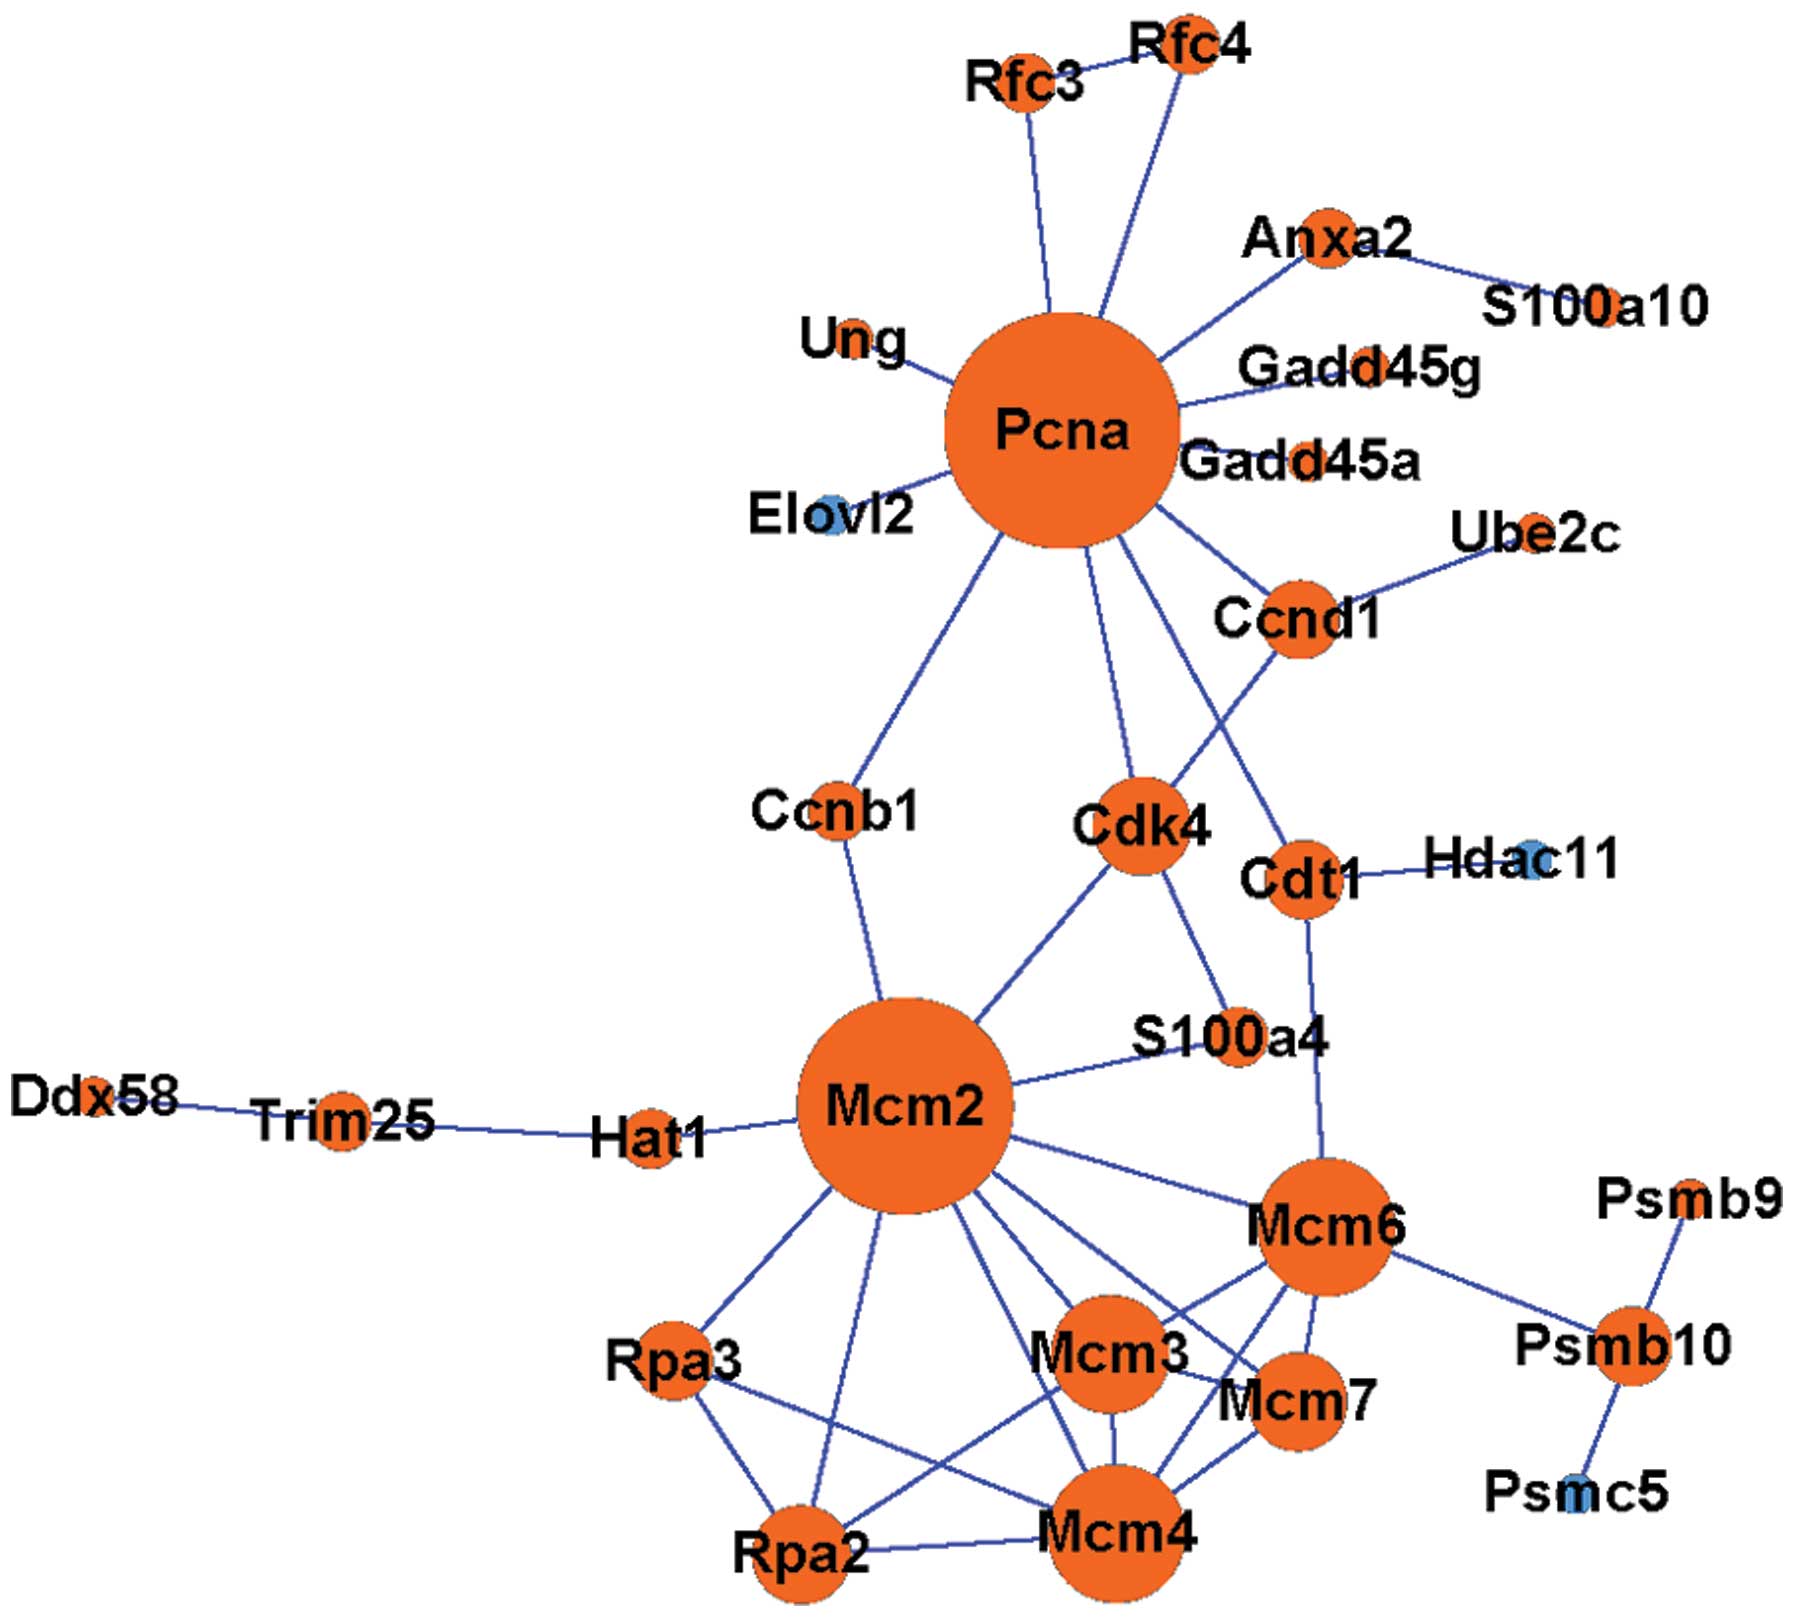
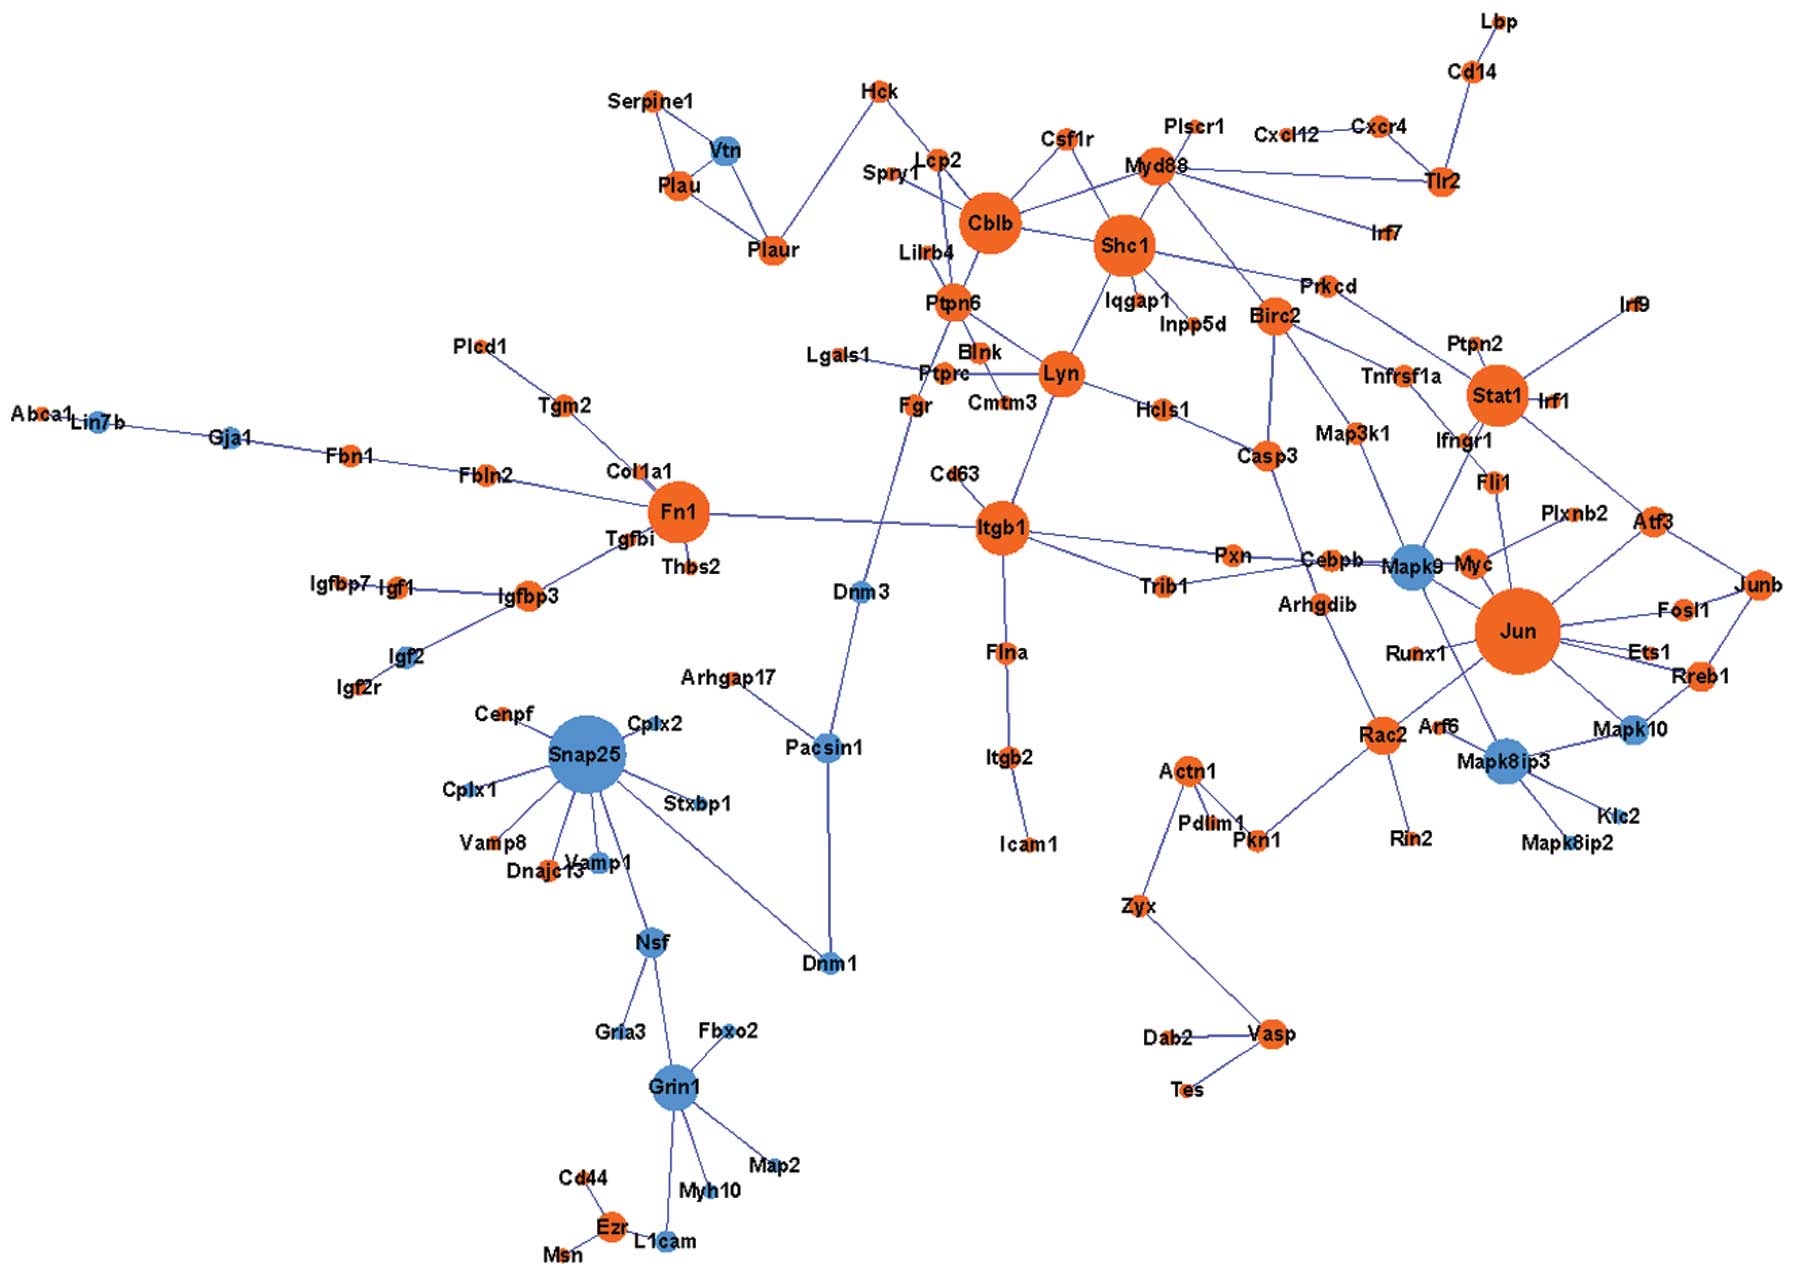
Construction of a PPI network
According to the constructed PPI network, there were
at least two sub-networks, and most proteins in the two
sub-networks were upregulated. JUN and SNAP25 as well
as PCNA and MCM2 were the hubs of the two
sub-networks, respectively (Figs.
3 and 4). Among them,
SNAP25 was downregulated, while JUN, PCNA and
MCM were upregulated.
Regulation of DEGs screened in rats with
SCI
Transcription factors were observed to participate
in the up- and downregulation of DEGs. A total of 185 and 1,215
transcription factors were screened for the up- and downregulated
DEGs, respectively. Among them, the top three transcription factors
with affinity for binding sites in the upregulated DEGs were SP1
(102 target DEGs, P=5.22477×10⁻¹⁵), MAZ (87 target DEGs,
P=1.36×10−141) and LEF1 (81 target DEGs,
P=5.58×10−97), respectively. The top three transcription
factors with affinity for binding sites in the downregulated DEGs
were LEF1 (87 target DEGs, P=6.05×10⁻²²), E12 (85 target
DEGs, P=1.14×10⁻²³), and MAZ (79 target DEGs,
P=2.89×10⁻²¹), respectively. LEF1 and SP1 were observed
to have target DEGs that were involved in cholesterol-associated
metabolism (e.g. FDFT1 and HMGCS1) and in injury
responses (e.g. C1S and RAB27A). Further
transcription factors, NFAT, AP4, SREBP1 and STAT5B, were also
observed to target upregulated DEGs that were involved in injury
responses, and NFY, TATA and MEIS1 were observed to target
downregulated DEGs that were involved in cholesterol
metabolism.
In addition, 151 miRNAs were predicted for the
down-regulated DEGs. miR-429 was indicated to regulate 26
downregulated DEGs (P=1.52×10⁻¹⁰), and miR-200a and
miR-141 regulated 23 downregulated DEGs each, with P-values of
8.7×10⁻⁸ and 1.4×10⁻⁸, respectively. In
addition, a number of miRNAs, including miR-16, miR-210, miR-15b,
miR300-3p, miR-540, miR-325-5p and miR-487b, were observed to have
target DEGs involved in cholesterol-associated metabolism, e.g.
IDI1 and FDFT1.
Discussion
In the present study, JUN, SNAP25,
PCNA and MCM2 were the hub nodes in the constructed
PPI network. The JUN family protein members c-JUN, JUNB and JUND
are necessary for the assembly of the AP-1 (20) transcription factor complex. The
major component, c-JUN, is highly induced in response to neuronal
injury, which is mediated by C-JUN N-terminal kinase 1 (JNK) via
phosphorylation (21,22). This explains for the upregulation
of JUN observed in the present study, confirming the neuronal
injury after SCI. SNAP25 is a component of the trans-SNARE
complex, relating to membrane fusion (23), which has been reported to
ameliorate the sensory deficit in rats with SCI (24). The downregulation of SNAP25
expression in the present study may therefore be associated with
the sensory deficit after SCI.
PCNA is a DNA clamp that acts as a
processivity factor for DNA polymerase delta with the help of
RFC in eukaryotic cells; thus, it is essential for DNA
replication and repair (25-27).
PCNA was observed to be upregulated in the present study,
which is consistent with the results of previous studies by Ding
et al (28) and Di Giovanni
et al (6) who have reported
an upregulation in PCNA expression after SCI by using
western-blot and RT-qPCR analyses. Mini-chromosome maintenance
protein 2 (MCM2) protein is one of the highly conserved MCMs, which
form the hexameric protein complex that is involved in the
initiation and the elongation of eukaryotic genome replication,
particularly the formation and elongation of the replication fork
(29,30). The upregulation of PCNA and
MCM2, two DNA replication-associated factors, indicates the
effort of cells to repair DNA and regenerate themselves, further
demonstrating neuronal damage and death after SCI. Di Giovanni
et al (6) have proven that
PCNA, together with other cell cycle-associated genes, is
involved in the neuronal damage and subsequent cell death after
SCI.
Several studies have reported the disturbed
cholesterol metabolism in spinal cord-injured patients (31,32).
In the present study, the downregulation of cholesterol
metabolism-associated genes over time was observed following SCI.
Previous studies have reported the regulatory role of miRNAs in
lipid and cholesterol metabolism, particularly miR-33 (33,34).
According to the present study, several miRNAs were observed to
target cholesterol metabolism-associated DEGs, including miR210,
miR300-3p, miR-325-5p, miR-487b and miR-16. A common target DEG of
the former four was IDI1, and that of the latter was
FDFT1, which are cholesterol biosynthetic enzyme genes that
have also been reported to be expressed at reduced levels in the
stroke-prone hypertensive rat (SHRSP) with lower total cholesterol
levels in the serum. Therefore, these miRNAs are also indicated to
have important roles in the regulation of cholesterol and sterol
biosynthesis after SCI, which requires further experimental
verification. miR-429, miR-141 and miR-200a belong to the same
miR-200 family. Benoit et al (35) have reported the upregulation of
rno-miR-200a in rats on a high-fat diet. Thus, it is presumed that
there may be a certain correlation between rno-miR-200a and the
downregulation of cholesterol metabolism-associated genes over
time. However, no targets of miR-200a, miR-429 and miR-141 were
observed in the cholesterol metabolism-associated DEGs observed in
the present study, which may be attributed to the small sample size
of the microarray used. Hence, whether this miRNA family may have a
regulatory role in lipid metabolism, particularly in the
cholesterol/sterol metabolism, requires further investigation.
The transcription factors LEF1 and SP1 were observed
to be associated with the regulation of the DEGs that were involved
in cholesterol-associated metabolism and in injury responses; thus,
it may be presumed that these two transcription factors have
critical regulatory roles in gene expression after SCI. SP1 is a
ubiquitous transcription factor. It has been reported to activate
the LCAT promoter, which modulates the transportation rate of
cholesteryl ester to the liver (36). Furthermore, it was observed that
one of the target DEGs of SP1 was RAB27A, which is involved
in the injury response, suggesting its role in the regulation of
injury-associated DEGs after SCI. This agrees with the finding that
SP1 or SP1-associated proteins are involved in regulating the
expression of peripherin intermediate filament gene, which is
activated after nerve injury via binding to the intron 1 site
(37). Thus, whether SP1 functions
in the same way in regulating injury-associated genes after SCI
should be further validated. LEF1 is a member of the LEF-1/TCF
family of transcription factors, which functions by interacting
with cytosolic β-catenin to form a transcription complex that
activates the Wnt signaling pathway (38). Functional TCF/LEF1 signaling has
been reported to regulate lipid metabolism (39). In the present study, LEF1 was
observed to downregulate DGEs that were involved in
cholesterol-associated metabolism; thus, it is consistent with the
previous finding that the Wnt signaling pathway is attenuated after
SCI (40). In addition, LEF1,
which participates in the Wnt signaling pathway, is highly
expressed in the oligodendrocyte precursor cells (OPCs) after
neonatal brain injury (41). In
the present study, one of the target DEGs of LEF1, C1S,
which is involved in complement systems, was observed to be
upregulated, confirming its role in injury responses after SCI.
In conclusion, the present study revealed that
expression of cholesterol metabolism-associated DEGs was
downregulated over time, while injury-associated DEGs were
upregulated over time after SCI. Furthermore, the hub genes
PCNA, MCM2, JUN and SNAP25 presumably
have critical roles in rats with SCI, and the transcription factors
LEF1 and SP1 may be important for the regulation of cholesterol
metabolism and injury responses after SCI.
References
|
1
|
Taoka Y and Okajima K: Spinal cord injury
in the rat. Prog Neurobiol. 56:341–358. 1998. View Article : Google Scholar : PubMed/NCBI
|
|
2
|
Liu CL, Jin AM and Tong BH: Detection of
gene expression pattern in the early stage after spinal cord injury
by gene chip. Chin J Traumatol. 6:18–22. 2003.PubMed/NCBI
|
|
3
|
Song G, Cechvala C, Resnick DK, Dempsey RJ
and Rao VL: GeneChip analysis after acute spinal cord injury in
rat. J Neurochem. 79:804–815. 2001. View Article : Google Scholar : PubMed/NCBI
|
|
4
|
Bareyre FM, Haudenschild B and Schwab ME:
Long-lasting sprouting and gene expression changes induced by the
monoclonal antibody IN-1 in the adult spinal cord. J Neurosci.
22:7097–7110. 2002.PubMed/NCBI
|
|
5
|
Hayashi M, Ueyama T, Nemoto K, Tamaki T
and Senba E: Sequential mRNA expression for immediate early genes,
cytokines and neurotrophins in spinal cord injury. J Neurotrauma.
17:203–218. 2000. View Article : Google Scholar : PubMed/NCBI
|
|
6
|
Di Giovanni S, Knoblach SM, Brandoli C,
Aden SA, Hoffman EP and Faden AI: Gene profiling in spinal cord
injury shows role of cell cycle in neuronal death. Ann Neurol.
53:454–468. 2003. View Article : Google Scholar : PubMed/NCBI
|
|
7
|
Carmel JB, Galante A, Soteropoulos P, et
al: Gene expression profiling of acute spinal cord injury reveals
spreading inflammatory signals and neuron loss. Physiol Genomics.
7:201–213. 2001. View Article : Google Scholar
|
|
8
|
Pan JZ, Ni L, Sodhi A, Aguanno A, Young W
and Hart RP: Cytokine activity contributes to induction of
inflammatory cytokine mRNAs in spinal cord following contusion. J
Neurosci Res. 68:315–322. 2002. View Article : Google Scholar : PubMed/NCBI
|
|
9
|
Hayashi M, Ueyama T, Nemoto K, Tamaki T
and Senba E: Sequential mRNA expression for immediate early genes,
cytokines and neurotrophins in spinal cord injury. J Neurotrauma.
17:203–218. 2000. View Article : Google Scholar : PubMed/NCBI
|
|
10
|
Yakovlev AG and Faden Al: Sequential
expression of c-fos protooncogene, TNF-alpha and dynorphin genes in
spinal cord following experimental traumatic injury. Mol Chem
Neuropathol. 23:179–190. 1994. View Article : Google Scholar : PubMed/NCBI
|
|
11
|
Liu NK, Wang XF, Lu QB and Xu XM: Altered
microRNA expression following traumatic spinal cord injury. Exp
Neurol. 219:424–429. 2009. View Article : Google Scholar : PubMed/NCBI
|
|
12
|
Kosik KS: The neuronal microRNA system.
Nat Rev Neurosci. 7:911–920. 2006. View
Article : Google Scholar : PubMed/NCBI
|
|
13
|
Schaefer A, O’Carroll D, Tan CL, et al:
Cerebellar neurodegeneration in the absence of microRNAs. J Exp
Med. 204:1553–1558. 2007. View Article : Google Scholar : PubMed/NCBI
|
|
14
|
Gautier L, Cope L, Bolstad BM and Irizarry
RA: affy–analysis of Affymetrix GeneChip data at the probe level.
Bioinformatics. 20:307–315. 2004. View Article : Google Scholar : PubMed/NCBI
|
|
15
|
Smyth GK: Limma: Linear Models for
Microarray Data. Bioinformatics and Computational Biology Solutions
Using R and Bioconductor Springer. pp. 397–420. 2005
|
|
16
|
Zhang X, Li J, Liu A, et al: Expression
profile in rice panicle: insights into heat response mechanism at
reproductive stage. PLoS One. 7:e496522012. View Article : Google Scholar : PubMed/NCBI
|
|
17
|
Huang da W, Sherman BT and Lempicki RA:
Systematic and integrative analysis of large gene lists using DAVID
bioinformatics resources. Nat Protoc. 4:44–57. 2009. View Article : Google Scholar : PubMed/NCBI
|
|
18
|
Franceschini A, Szklarczyk D, Frankild S,
et al: STRING v9. 1: protein-protein interaction networks, with
increased coverage and integration. Nucleic Acids Res. 41(Database
Issue): D808–D815. 2013. View Article : Google Scholar :
|
|
19
|
Tabas-Madrid D, Nogales-Cadenas R and
Pascual-Montano A: GeneCodis3: a non-redundant and modular
enrichment analysis tool for functional genomics. Nucleic Acids
Res. 40(Web Server Issue): W478–W483. 2012. View Article : Google Scholar : PubMed/NCBI
|
|
20
|
Jochum W, Passegué E and Wagner EF: AP-1
in mouse development and tumorigenesis. Oncogene. 20:2401–2412.
2001. View Article : Google Scholar : PubMed/NCBI
|
|
21
|
Raivich G, Bohatschek M, Da Costa C, et
al: The AP-1 transcription factor c-Jun is required for efficient
axonal regeneration. Neuron. 43:57–67. 2004. View Article : Google Scholar : PubMed/NCBI
|
|
22
|
Herdegen T and Leah JD: Inducible and
constitutive transcription factors in the mammalian nervous system:
control of gene expression by Jun, Fos and Krox and CREB/ATF
proteins. Brain Res Brain Res Rev. 28:370–490. 1998. View Article : Google Scholar : PubMed/NCBI
|
|
23
|
Rizo J and Südhof TC: Snares and Munc18 in
synaptic vesicle fusion. Nat Rev Neurosci. 3:641–653. 2002.
View Article : Google Scholar : PubMed/NCBI
|
|
24
|
Wang W, Wang F, Liu J, et al: Snap25
ameliorates sensory deficit in rats with spinal cord transection.
Mol Neurobiol. 50:290–304. 2014. View Article : Google Scholar : PubMed/NCBI
|
|
25
|
Bowman GD, O’Donnell M and Kuriyan J:
Structural analysis of a eukaryotic sliding DNA clamp-clamp loader
complex. Nature. 429:724–730. 2004. View Article : Google Scholar : PubMed/NCBI
|
|
26
|
Leonardi E, Girlando S, Serio G, et al:
PCNA and Ki67 expression in breast carcinoma: correlations with
clinical and biological variables. J Clin Pathol. 45:416–419. 1992.
View Article : Google Scholar : PubMed/NCBI
|
|
27
|
Zhang G, Gibbs E, Kelman Z, O’Donnell M
and Hurwitz J: Studies on the interactions between human
replication factor C and human proliferating cell nuclear antigen.
Proc Natl Acad Sci USA. 96:1869–1874. 1999. View Article : Google Scholar : PubMed/NCBI
|
|
28
|
Ding T, Wen H, Wei H, et al: Increased
expression of TBP/TFIID after spinal cord injury in adult rats.
Cell Mol Neurobiol. 34:669–677. 2014. View Article : Google Scholar : PubMed/NCBI
|
|
29
|
Eide T, Taskén KA, Carlson C, et al:
Protein kinase A-anchoring protein AKAP95 interacts with MCM2, a
regulator of DNA replication. J Biol Chem. 278:26750–26756. 2003.
View Article : Google Scholar : PubMed/NCBI
|
|
30
|
Carpentieri F, De Felice M, De Falco M,
Rossi M and Pisani FM: Physical and functional interaction between
the mini-chromosome maintenance-like DNA helicase and the
single-stranded DNA binding protein from the crenarchaeon
Sulfolobus solfataricus. J Biol Chem. 277:12118–12127. 2002.
View Article : Google Scholar : PubMed/NCBI
|
|
31
|
Bauman WA, Spungen AM, Zhong YG, Rothstein
JL, Petry C and Gordon SK: Depressed serum high density lipoprotein
cholesterol levels in veterans with spinal cord injury. Paraplegia.
30:697–703. 1992. View Article : Google Scholar : PubMed/NCBI
|
|
32
|
Myers J, Lee M and Kiratli J:
Cardiovascular disease in spinal cord injury: an overview of
prevalence, risk, evaluation and management. Am J Phys Med Rehabil.
86:142–152. 2007. View Article : Google Scholar : PubMed/NCBI
|
|
33
|
Fernández-Hernando C, Suárez Y, Rayner KJ
and Moore KJ: MicroRNAs in lipid metabolism. Curr Opin Lipidol.
22:86–92. 2011. View Article : Google Scholar :
|
|
34
|
Rotllan N and Fernández-Hernando C:
MicroRNA regulation of cholesterol metabolism. Cholesterol.
2012:82012. View Article : Google Scholar
|
|
35
|
Benoit C, Ould-Hamouda H, Crepin D,
Gertler A, Amar L and Taouis M: Early leptin blockade predisposes
fat-fed rats to overweight and modifies hypothalamic microRNAs. J
Endocrinol. 218:35–47. 2013. View Article : Google Scholar : PubMed/NCBI
|
|
36
|
Hoppe KL and Francone OL: Binding and
functional effects of transcription factors Sp1 and Sp3 on the
proximal human lecithin: cholesterol acyltransferase promoter. J
Lipid Res. 39:969–977. 1998.PubMed/NCBI
|
|
37
|
Uveges TE, Shan Y, Kramer BE, Wight DC and
Parysek LM: Intron 1 is required for cell type-specific, but not
injury-responsive, peripherin gene expression. J Neurosci.
22:7959–7967. 2002.PubMed/NCBI
|
|
38
|
Tetsu O and McCormick F: β-catenin
regulates expression of cyclin D1 in colon carcinoma cells. Nature.
398:422–426. 1999. View
Article : Google Scholar : PubMed/NCBI
|
|
39
|
Fehrenschild D, Galli U, Breiden B, et al:
TCF/Lef1-mediated control of lipid metabolism regulates skin
barrier function. J Invest Dermatol. 132:337–345. 2012. View Article : Google Scholar
|
|
40
|
Xu D, Zhao W, Pan G, et al: Expression of
Nemo-like kinase after spinal cord injury in rats. J Mol Neurosci.
52:410–418. 2014. View Article : Google Scholar : PubMed/NCBI
|
|
41
|
Fancy SP, Harrington EP, Baranzini SE, et
al: Parallel states of pathological Wnt signaling in neonatal brain
injury and colon cancer. Nat Neurosci. 17:506–512. 2014. View Article : Google Scholar : PubMed/NCBI
|