Introduction
Intervertebral disc degeneration (IDD) is
characterized by pathological changes in the intervertebral disc,
and is associated with the development of lower back pain and acute
lumbar radiculopathy (1). It is
widely accepted that a number of factors, such as genetic
predisposition, abnormal biomechanical loading, ageing and
decreased nutrient transport could result in the development of IDD
(2,3). However, the underlying mechanism
associated with IDD remains largely unknown.
MicroRNAs (miRNAs) are small (19–24 nt),
non-protein-coding nucleic acids that regulate specific target gene
products via binding to the 3′ untranslated regions (UTRs) of mRNA
transcripts, contributing to mRNA degradation or translational
blockade (4). To date, >1,000
human miRNAs have been experimentally identified, and it is
estimated that they regulate more than one-third of cellular mRNA
and are involved in a number of diseases processes (5). Emerging evidence has strongly
suggested that abnormal miRNA expression is a common and important
feature in IDD. For example, a study by Zhao et al (6) identified 25 upregulated miRNAs and 26
downregulated miRNAs in the IDD via microarray analysis and reverse
transcription-quantitative polymerase chain reaction (RT-qPCR).
Similarly, 29 miRNAs were found to be differentially expressed in
degenerative nucleus pulposus (NP), and deregulated miRNA-155
promoted Fas-mediated apoptosis through targeting caspase-3 and
fas-associated death domain containing protein (7). In addition, miRNA-34a induced by p53
lead to cell apoptosis resulting in the development of
osteoarthritis (8). In addition, a
previous study demonstrated that miRNA-140 expression is associated
with chondrocyte differentiation, and therefore contributes to the
development of osteoarthritis (9).
Since mRNA is an important intermediary agent for
miRNA action, the interaction between miRNA and mRNA is important
in the development of complex diseases. Therefore, the objective of
this study was to comprehensively investigate the IDD-related gene
regulation by constructing miRNA-target gene networks. Furthermore,
their underlying molecular mechanisms were also characterized by
function annotation and Kyoto Encyclopedia of Genes and Genomes
(KEGG) pathway enrichment analysis.
Materials and methods
Affymetrix microarray data
GSE 19943 (7) and
GSE 34095 datasets were accessible at the National Center for
Biotechnology Information Gene Expression Omnibus data-base
(http://www.ncbi.nlm.nih.gov/geo/). The
miRNA and mRNA microarray datasets are based on the platforms of
GPL9964-Exiqon human miRCURY LNA™ miRNA Array V11.0 (Exiqon,
Vedbaek, Denmark) and GPL96-[HG-U133A] Affymetrix Human Genome
U133A Array (Affymetrix, Santa Clara, CA, USA), respectively. miRNA
expression profiling of human NP cells derived from 3 patients with
disc degeneration compared with 3 controls with scoliosis.
Similarly, mRNA datasets included human intervertebral disc tissues
harvested from 3 elderly and 3 younger patients with degenerative
disc disease and adolescent idiopathic scoliosis, respectively.
Data processing and DEG screen
The correlation between miRNA and the target gene
was determined based on the original expression profiling, and log
2-transformed microarray data was used to screen the differentially
expressed genes (DEGs) in intervertebral disc tissues from patients
with degenerative disc disease and adolescent idiopathic scoliosis
by Linear Models for Microarray Data (LIMMA) package in R (10). False discovery rates (FDRs) were
calculated using the method of Benjamini and Hochberg (11). FDR-corrected P<0.05 and |log
(fold change)|>1 were defined as the thresholds for screening
DEGs.
Differentially expressed analysis of
miRNA and the target genes
miRNA and mRNA integrated analysis (MMIA) is a
versatile web server integrating miRNA and mRNA expression data
with predicted miRNA target information for analyzing
miRNA-associated phenotypes and biological functions by gene set
analysis (12). Target genes of
differentially expressed miRNA were screened by combining
TargetScan 5.1 (http://www.targetscan.org; Whitehead Institute for
Biomedical Research, Cambridge, MA, USA) and Pictar4way algorithms
(http://pictar.mdc-berlin.de; Center for
Comparative Functional Genomics and the Max Delbruck Centrum,
Berlin, Germany). To explore the association between miRNA and DEGs
in the development of IDD, the enrolled DEGs were then further
screened to analyze the miRNA and the target DEGs in human
intervertebral disc tissue.
Regulation association analysis and
network construction
The software of Search Tool for the Retrieval of
Interacting Genes (STRING; http://string-db.org/) is a tool that could cluster
networks on demand, update on-screen previews of structural
information including homology models and extensive data updates
(13). In order to correctly
uncover and annotate all functional interactions among proteins in
the human NP cells, STRING was employed to determine the
correlation between the differentially expressed miRNA and DEGs in
the IDD process. A confidence score was employed to define the
interaction between miRNA and DEGs based on experimental
measurements and computational prediction techniques. The
confidence score >0.4 was defined statistically significant.
Cytoscape (http://cytoscape.org/) is a popular
bioinformatics package for biological network visualization and
data integration (14). The
interaction network was visualized by the Cytoscape tool based on
the above association.
Function annotation and pathway
analysis
The Biological Networks Gene Ontology tool (BiNGO;
http://www.psb.ugent.be/cbd/papers/BiNGO/), as a
cytoscape plugin, is an open-source Java tool to determine which
Gene Ontology (GO) terms are significantly overrepresented in a set
of genes (15). BiNGO was used to
perform functional annotation for the network with a threshold of
adjusted P<0.05 based on hypergeometric distribution. Web-based
Gene Set Enrichment Analysis Toolkit (WebGestalt; http://www.webgestalt.org) is composed of four
modules: Gene set management, information retrieval,
organization/visualization and statistics, and shifted the study
from 'single genes' to 'gene sets' (16,17).
WebGestalt was used to perform KEGG pathway analysis for DEGs
regulated by differentially expressed miRNA in IDD tissue and
P<0.05 was considered to indicate a statistically significant
difference.
Results
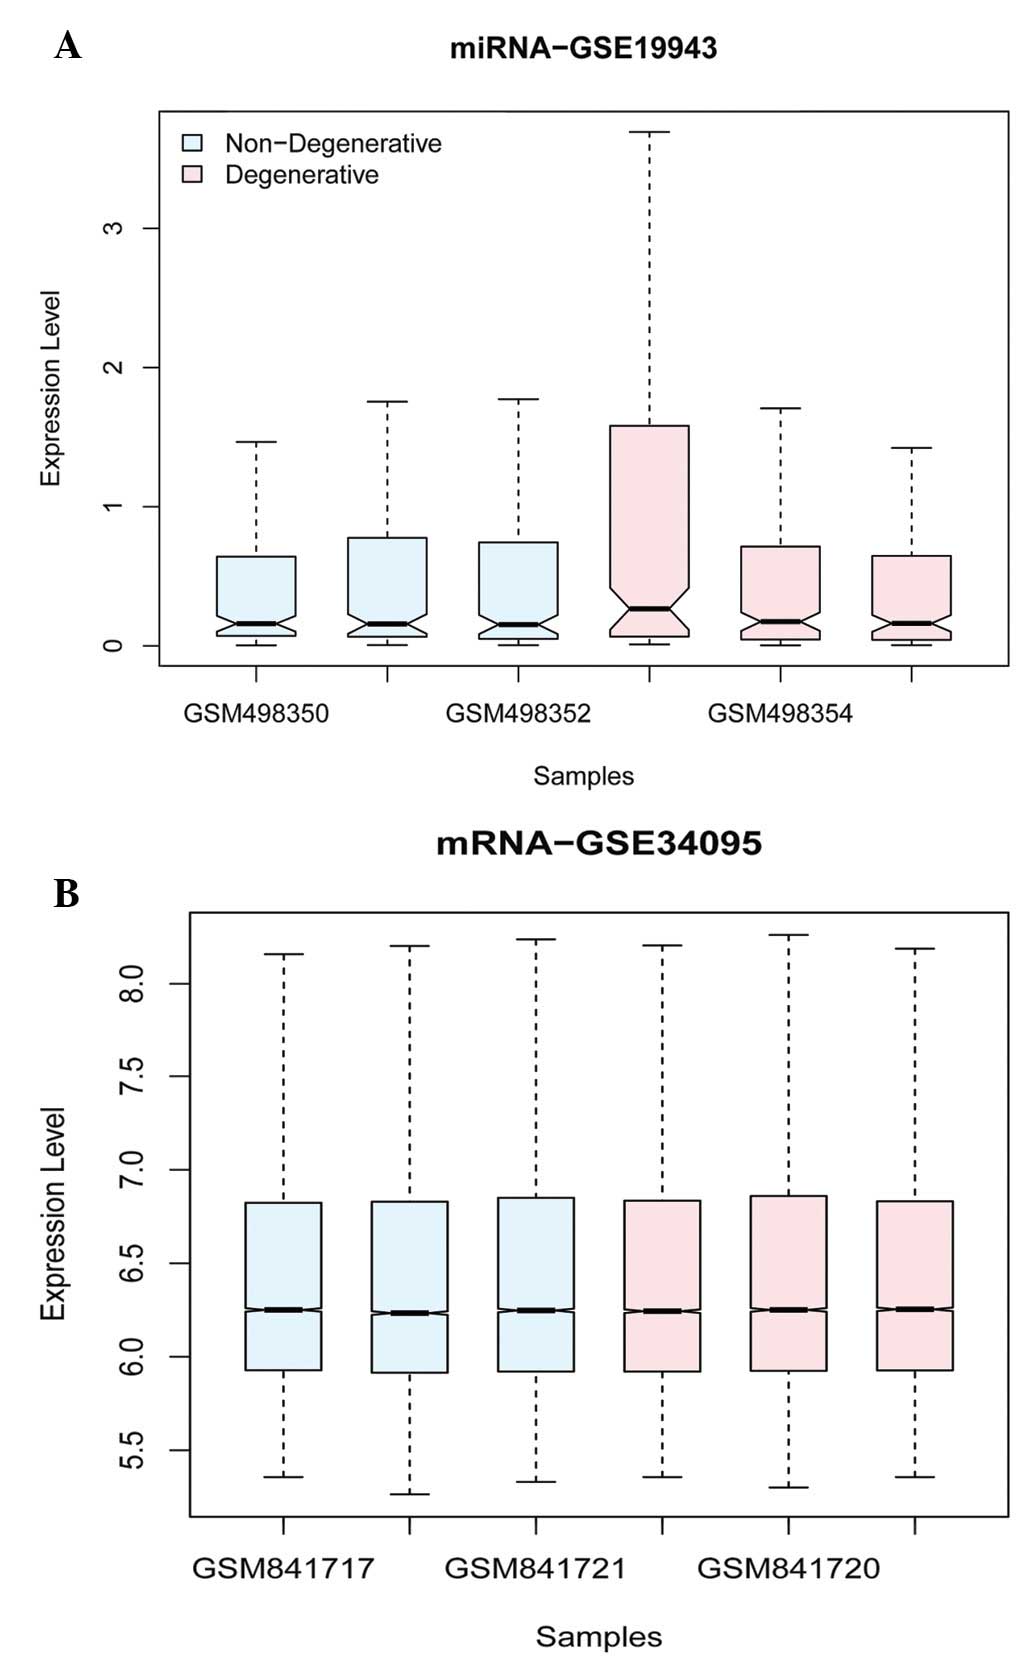
Differentially expressed miRNA and mRNA
analysis
A total of 253 miRNAs and their associated 22,2215
genes were obtained based on their correlation between the miRNAs
and associated genes of the original expression profile.
Differentially expressed analyses of miRNA and mRNA were performed
between cases and control by LIMMA package in R language and
multiple comparisons using FDR and Benjamini and Hochberg after
normalization (Fig. 1). A total of
850 DEGs and 9 miRNAs, including 3 up- and 6 downregulated miRNAs
(Table I), were identified to be
significantly expressed with thresholds of |log2
FC|>1 and FDR-corrected P<0.05.
 | Table IDifferentially expressed miRNAs in
intervertebral disc degeneration tissue and the target genes. |
Table I
Differentially expressed miRNAs in
intervertebral disc degeneration tissue and the target genes.
| miRNA_ID_LIST | ID | FDR | logFC | Target genes |
|---|
|
hsa-miR-30c-1a | 1158 | 0.0315 | −3.01 | – |
| hsa-miR-638 | 1151 | 0.0483 | −2.254 | PAK2 |
| hsa-miR-1275 | 1223 | 0.0387 | −2.252 | SERBP1, BAIAP2,
USF2 |
| hsa-miR-589 | 1104 | 0.0407 | 2.5 | FBXW2, GRSF1, PKN2,
SMAD4 |
| hsa-miR-1286 | 1026 | 0.0387 | 2.767 | ABCF2, BACH2, BAZ1B,
CELSR2, |
| | | | SYP, VAMP1 |
| hsa-miR-222 | 1012 | 0.0315 | 3.05 | ATXN1, BMI1, CDKN1B,
DCUN1D4, |
| | | | GTF2E1, KIAA0368,
NAP1L1, NFYB, |
| | | | PAIP1, T1MP3,
TRAM2 |
| hsa-miR-220b | 1122 | 0.0387 | 4.216 | ACVR1B, ARL4C,
FAM20B, SMYD5 |
| hsa-miR-640 | 1030 | 0.0132 | 4.559 | GRIK2, TNP01 |
| hsa-miR-532-3p | 1060 | 0.0315 | 4.755 | FOXJ3, LBH, PBX2,
PI4KB, UBL3, WAC |
miRNA-target gene regulation
association
Target genes of nine differentially expressed miRNAs
were obtained from the TargetScan database, and the abnormally
expressed miRNAs were then screened based on conservative property
at the 3′UTR and context score. Among them, target genes of 8
abnormally expressed miRNAs were found to be differentially
expressed. As shown in Table I, a
total of 8 miRNAs and 37 target DEGs were screened. No predicted
target genes were identified for miRNA-30c-1.
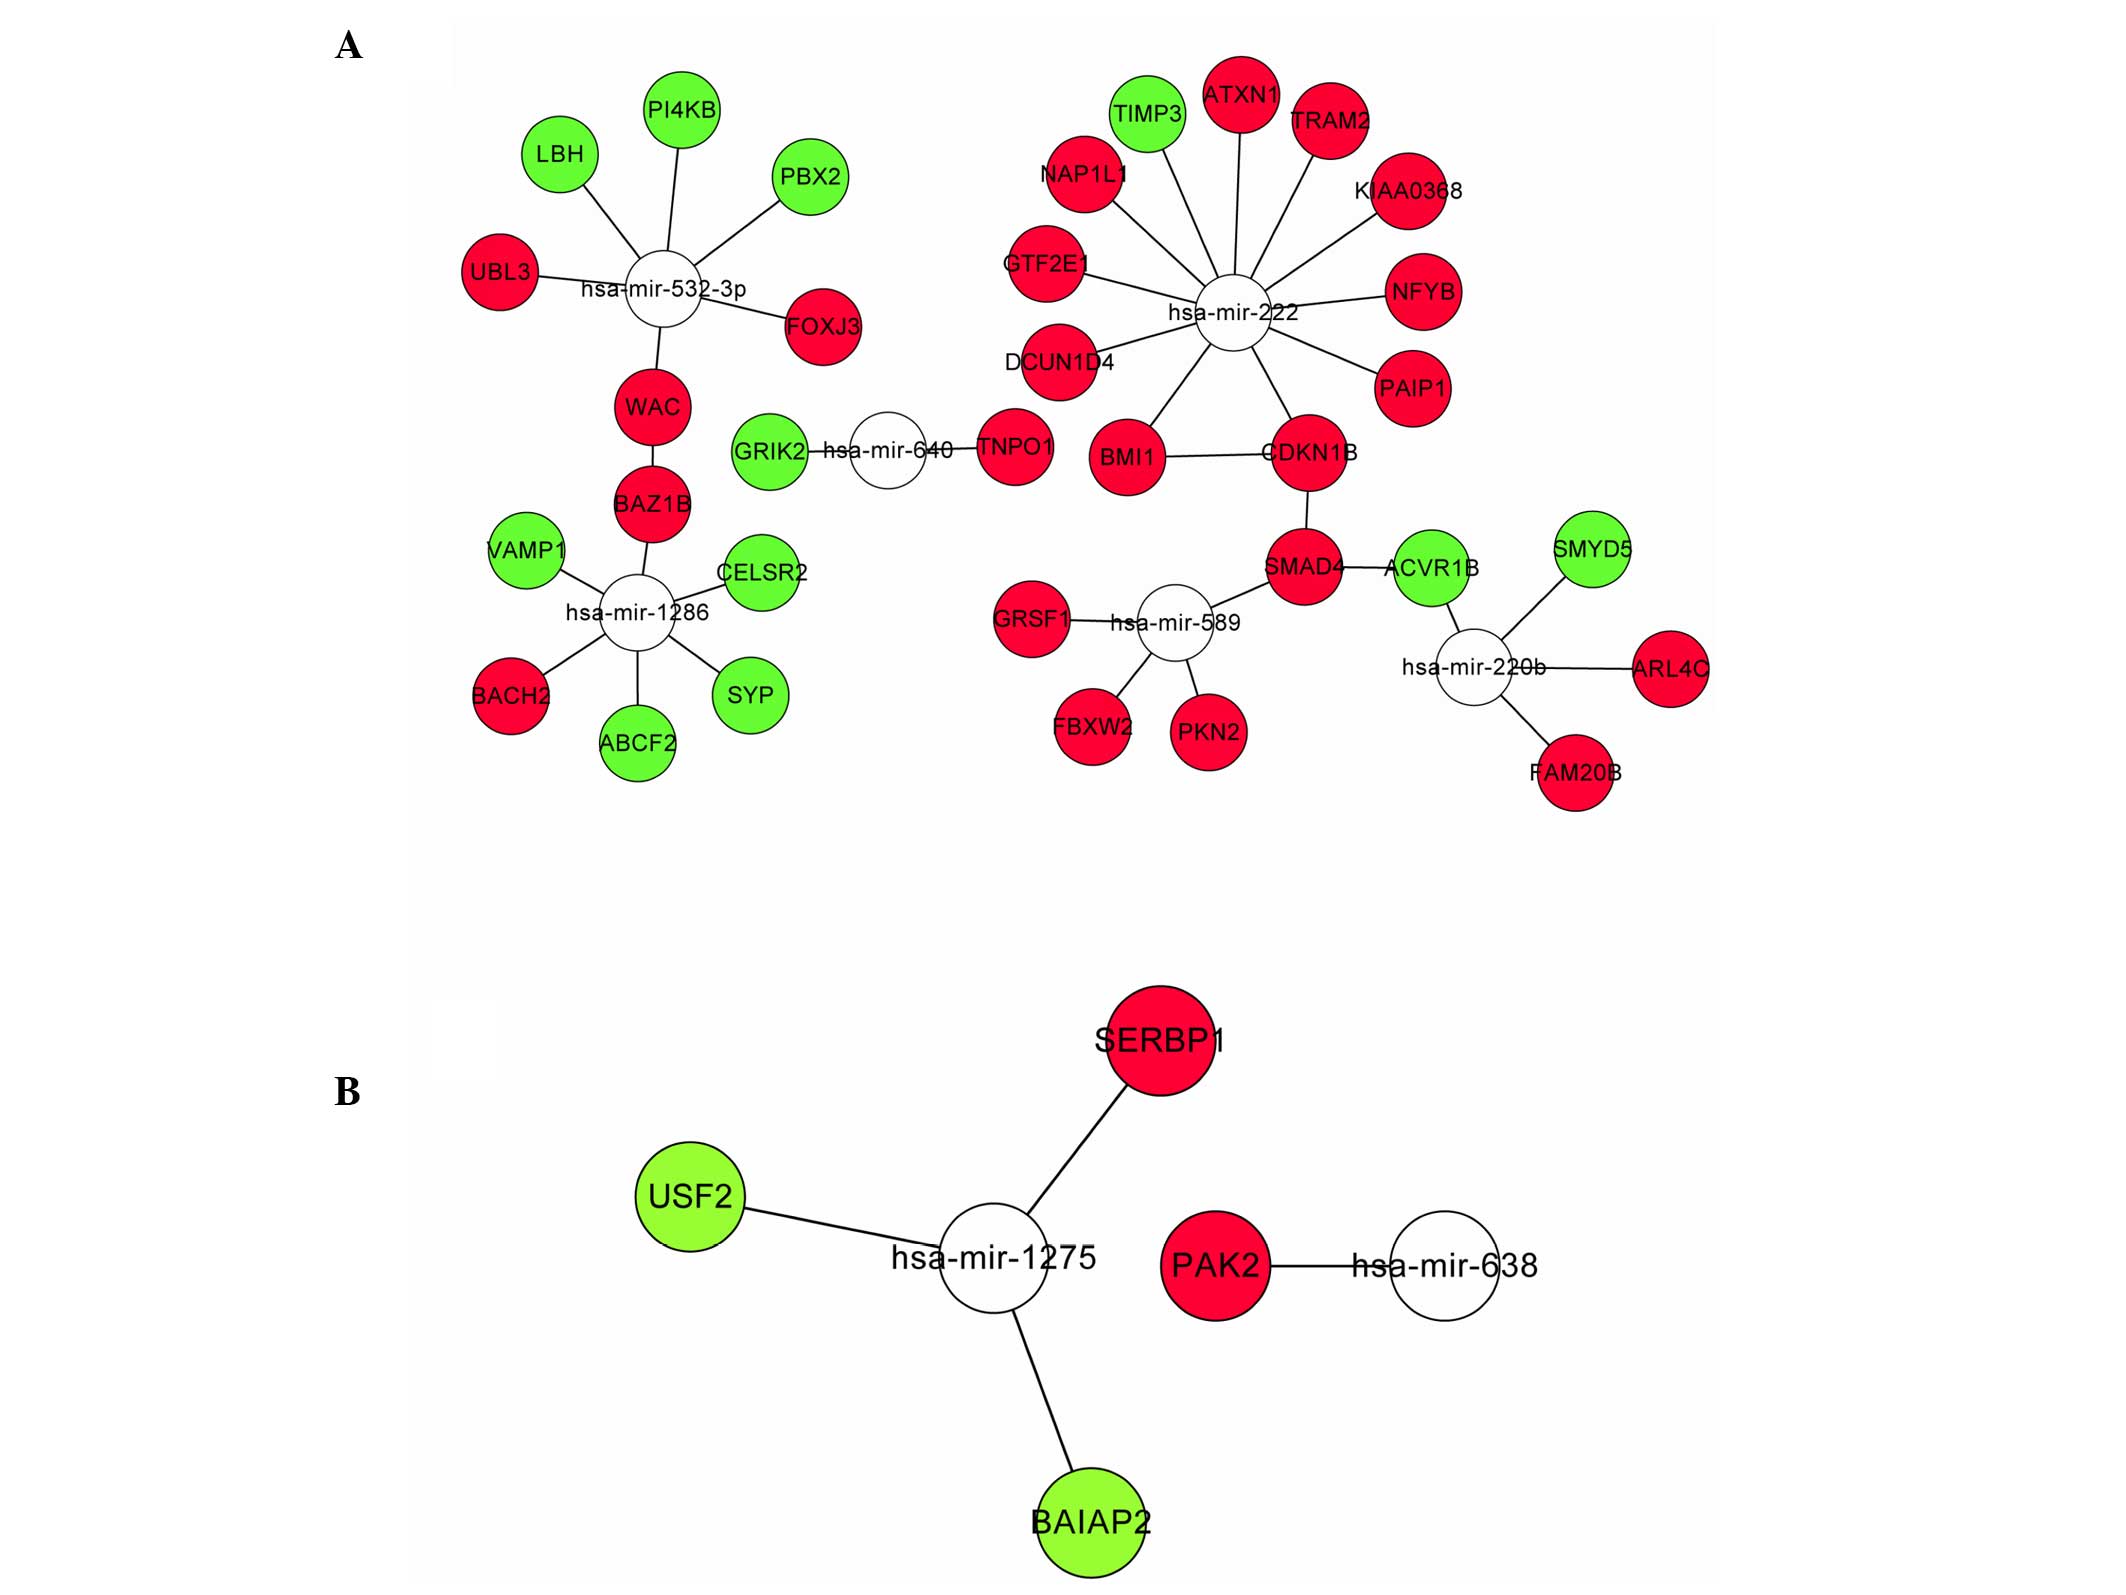
miRNA-DEG regulation network
construction
To explore the regulation network for the target
genes regulated by miRNAs, the correlation between proteins encoded
by DEGs was identified by mapping both up- and downregulated DEGs
to STRING. A total of 4 interaction pairs were constructed with a
confidence score >0.4, including interaction relationships of
SMAD family member 4 (SMAD4) and activin A receptor, type IB, WW
domain containing adaptor with coiled-coil and bromodomain adjacent
to zinc finger domain, 1B, BMI1 polycomb ring finger oncogene and
cyclin-dependent kinase inhibitor 1B (CDKN1B), SMAD4 and CDKN1B. As
shown in (Fig. 2), the
interactions were visualized by Cytoscape. The network included 8
miRNA and 37 target DEGs, including miRNA-222 targeting the gene
set of ataxin 1, BMI1, CDKN1B and defective in cullin neddylation
1, domain containing 4 and miRNA-589 targeting the gene set of
F-box and WD repeat domain containing 2, G-rich RNA sequence
binding factor 1, protein kinase N2 and SMAD4.
Function and pathway annotation
miRNAs regulate specific target gene products via
hybridization to mRNA, the 8 miRNAs regulated 37 common target
genes, which may be important in the development of IDD. Therefore,
the present study used function annotation and pathway analysis for
the DEGs regulated by the differential miRNAs in human NP cells. As
shown in Table II, the top 10 GO
biological processes were identified for DEGs involved in
upregulated miRNA networks, including negative regulation of cell
growth, negative regulation of cell size and negative regulation of
growth, and DEGs associated with downregulated miRNAs, such as
positive regulation of transcription by glucose, positive
regulation of transcription from the RNA polymerase II promoter by
glucose and positive of transcription from RNA polymerase II
promoter by carbon catabolites, based on the hypergeometric test
and P<0.05 (Table II). Two
KEGG pathways were screened using the WebGestalt tool according to
adjusted P<0.05, the cell cycle and pathways in cancer (Table III). Notably, the two pathways
involved CDKN1B and SMAD4.
| Table IIGene functional annotation for up- and
downregulated miRNA-target genes networks. |
Table II
Gene functional annotation for up- and
downregulated miRNA-target genes networks.
| A, Upregulated miRNA
network |
|---|
|
|---|
| GO-ID | Adj P-value | Description | Gene sets |
|---|
| 30308 | 0.044851 | Negative regulation
of cell growth | ACVR1B, CDKN1B,
SMAD4 |
| 45792 | 0.044851 | Negative regulation
of cell size | ACVR1B, CDKN1B,
SMAD4 |
| 45926 | 0.044851 | Negative regulation
of growth | ACVR1B, CDKN1B,
SMAD4 |
| 12502 | 0.046347 | Induction of
programmed cell death | ACVR1B, CDKN1B,
GRIK2, TIMP3 |
| 60255 | 0.046347 | Regulation of
macromolecule metabolic process | BMI1, BACH2, PAIP1,
SMAD4, NFYB, CELSR2, FOXJ3, ATXN1, GTF2E1, ACVR1B, LBH, CDKN1B,
BAZ1B, PBX2 |
| 31323 | 0.046347 | Regulation of
cellular metabolic process | BMI1, BACH2, PAIP1,
SMAD4, NFYB, CELSR2, FOXJ3, ATXN1, GTF2E1, ACVR1B, LBH, CDKN1B,
BAZ1B, PBX2 |
| 19219 | 0.046347 | Regulation of
nucleobase, nucleoside, nucleotide and nucleic acid metabolic
process | BMI1, BACH2, PAIP1,
SMAD4, NFYB, CELSR2, FOXJ3, ATXN1, GTF2E1, ACVR1B, LBH, BAZ1B,
PBX2 |
| 19222 | 0.046347 | Regulation of
metabolic process | BMI1, BACH2, PAIP1,
SMAD4, NFYB, CELSR2, FOXJ3, ATXN1, GTF2E1, ACVR1B, LBH, CDKN1B,
BAZ1B, PBX2 |
| 10556 | 0.046347 | Regulation of
macromolecule | BMI1, BACH2, PAIP1,
SMAD4, NFYB, CELSR2, FOXJ3, ATXN1, GTF2E1, ACVR1B, LBH, BAZ1B,
PBX2 |
| 8361 | 0.046347 | Regulation of cell
size | ACVR1B, CDKN1B,
SMAD4 |
| B, Downregulated
miRNA network |
|---|
|
|---|
| GO-ID | Adj P-value | Description | Gene set |
|---|
| 46016 | 0.011654 | Positive regulation
of transcription by glucose | USF2 |
| 432 | 0.011654 | Positive regulation
of transcription from RNA polymerase II promoter by glucose | USF2 |
| 436 | 0.011654 | Positive regulation
of transcription from RNA polymerase II promoter by carbon
catabolites | USF2 |
| 429 | 0.011654 | Regulation of
transcription from RNA polymerase II promoter by carbon
catabolites | USF2 |
| 430 | 0.011654 | Regulation of
transcription from RNA polymerase II promoter by glucose | USF2 |
| 45991 | 0.011654 | Positive regulation
of transcription by carbon catabolites | USF2 |
| 46015 | 0.01311 | Regulation of
transcription by glucose | USF2 |
| 45990 | 0.01311 | Regulation of
transcription by carbon catabolites | USF2 |
| 43488 | 0.017476 | Regulation of mRNA
stability | SERBP1 |
| 31670 | 0.017476 | Cellular response
to nutrient | USF2 |
| Table IIIKyoto encyclopedia of genes and
genomes pathways for differentially expressed genes regulated by
miRNAs. |
Table III
Kyoto encyclopedia of genes and
genomes pathways for differentially expressed genes regulated by
miRNAs.
| Pathway | Adj P-value | Gene sets |
|---|
| Cell cycle | 0.0062 | CDKN1B, SMAD4 |
| Pathways in
cancer | 0.0258 | CDKN1B, SMAD4 |
Discussion
In an effort to gain greater understanding of the
mechanism underlying IDD, miRNA and mRNA datasets were down-loaded
to explore the IDD-related genes and an miRNA regulation network
was constructed to investigate the potential mechanism in the
development of IDD. Functional annotation showed that the
upregulated miRNA predominantly regulated pathways associated with
cell activity, such as the negative regulation of cell growth, cell
size and cell death, and downregulated miRNAs predominantly
regulated pathways associated with the regulation of transcription
by glucose and the regulation of transcription by carbon
catabolites. In the present study, the differentially expressed
miRNAs were predicted to control 2 pathways relevant to IDD,
including the cell cycle and pathways in cancer. Notably, the
pathways were regulated by CDKN1B and SMAD4 genes. Furthermore,
CDKN1B and SMAD4 were shown to exhibit a significant interaction
and were regulated by miRNA-222 and miRNA-589, respectively.
The disc is composed of the central highly hydrated
NP, the surrounding elastic and fibrous annulus fibrosus (AF), and
the cartilaginous endplate (CEP), and each of these tissues has a
different function and consists of a specific matrix structure that
is maintained by a cell population with a distinct phenotype.
Disturbed homeostasis of these tissues may lead to pathological
conditions, including pathologies associated with cellular
phenotype and biochemical factors (18). In accordance with the study by Wang
et al (7), Fas-mediated
apoptosis in human IDD triggered by miRNA-155 via targeting
Fas-associated death domain containing protein and caspase-3
contributes to IDD. In the current study, the upregulated miRNA
predominantly regulated pathways associated with cell activity,
such as the negative regulation of cell growth, cell size and cell
death. Moreover, the critical roles of type II collagen and
proteoglycan (predominantly aggrecan) were demonstrated to be
important for proper disc function, particularly in the nucleus
pulposus (19). A previous study
also demonstrated that significant changes in the extracellular
matrix occur in the development of IDD (20). Consistent with the above research,
our results suggest that downregulated miRNAs predominantly
regulate pathways associated with the regulation of transcription
by glucose and regulation of transcription by carbon
catabolites.
In the current study, miRNA-222 levels were found to
be upregulated in the IDD tissue and CDNK1B is one of the important
target gene sets. A previous study demonstrated that miRNA-222
could directly target the 3′-UTR of CDKN1B and CDKN1C mRNAs to
reduce CDN1B and CDN1C protein levels (21). The CDKN1B gene is a member of the
Cip/Kip family of cyclin-dependent kinase (CDK) inhibitors that
function to negatively control cell cycle progression (22), and coordinate competency for
initiation of S phase with growth factor signaling pathways
stimulating cell proliferation. In addition, deregulated miR-221
and miR-222 promote cancerous growth by modulating the expression
of CDKN1B (23). The disturbed
homeostasis induced by cell proliferation may contribute to the
development and occurrence of IDD. Therefore, miRNA-222 may be a
crucial element for IDD progression by inhibiting cell
proliferation or pathways in cancer via targeting CDKN1B.
miRNA-589 levels are upregulated in the IDD tissue
and the miRNA targeted SMAD4 in this study. It has been
demonstrated that miRNA-589 mediates transforming growth factor
(TGF)-β induced epithelial mesenchymal transition in human
peritoneal mesothelial cell, and epithelial mesenchymal transition
is a key factor for the development and progression of peritoneal
fibrosis (24). TGF-β, as an
important proinflammatory factor, could promote the expression of
catabolic genes and suppress the expression of critical
extracellular matrix genes by the NP cells and AF cells in
intervertebral disc tissue (25).
Notably, SMAD4 is also a coactivator and mediator of signal
transduction by TGF-β, which encodes a member of the Smad family of
signal transduction proteins. Therefore, these results suggest that
SMAD4 may be synergistic with TGF-β, and miRNA-589 may influence
the extracellular matrix by targeting SMAD4. Although no
experimental evidence has demonstrated that miRNA-589 targets SMAD4
in NP cells, the results of the present study provides further
clarification.
In conclusion, the present study has provided novel
information regarding the regulation network of IDD. The
overexpression of miRNA-222 may be associated with IDD progression
by inhibiting cell proliferation or pathways in cancer via
targeting CDKN1B. Overexpression of miRNA-589 represses SMAD4 and
influences the extracellular matrix via intracellular TGF-β signal
transduction. However, further studies are required to confirm the
role of these miRNAs and target genes.
References
|
1
|
Kalichman L and Hunter DJ: The genetics of
intervertebral disc degeneration. Familial predisposition and
heritability estimation. Joint Bone Spine. 75:383–387. 2008.
View Article : Google Scholar : PubMed/NCBI
|
|
2
|
Roberts S, Evans H, Trivedi J and Menage
J: Histology and pathology of the human intervertebral disc. J Bone
Joint Surg Am. 2:10–14. 2006. View Article : Google Scholar
|
|
3
|
Adams MA, Freeman BJ, Morrison HP, Nelson
IW and Dolan P: Mechanical initiation of intervertebral disc
degeneration. Spine (Phila Pa 1976). 25:1625–1636. 2000. View Article : Google Scholar
|
|
4
|
Bartel DP: MicroRNAs: Genomics,
biogenesis, mechanism and function. Cell. 116:281–297. 2004.
View Article : Google Scholar : PubMed/NCBI
|
|
5
|
Khvorova A, Reynolds A and Jayasena SD:
Functional siRNAs and miRNAs exhibit strand bias. Cell.
115:209–216. 2003. View Article : Google Scholar : PubMed/NCBI
|
|
6
|
Zhao B, Yu Q, Li H, Guo X and He X:
Characterization of microRNA expression profiles in patients with
intervertebral disc degeneration. Int J Mol Med. 33:43–50.
2014.
|
|
7
|
Wang HQ, Yu XD, Liu ZH, Cheng X, Samartzis
D, Jia LT, Wu SX, Huang J, Chen J and Luo ZJ: Deregulated miR-155
promotes Fas-mediated apoptosis in human intervertebral disc
degeneration by targeting FADD and caspase-3. J Pathol.
225:232–242. 2011. View Article : Google Scholar : PubMed/NCBI
|
|
8
|
Abouheif MM, Nakasa T, Shibuya H, Niimoto
T, Kongcharoensombat W and Ochi M: Silencing microRNA-34a inhibits
chondrocyte apoptosis in a rat osteoarthritis model in vitro.
Rheumatology (Oxford). 49:2054–2060. 2010. View Article : Google Scholar
|
|
9
|
Miyaki S, Nakasa T, Otsuki S, Grogan SP,
Higashiyama R, Inoue A, Kato Y, Sato T, Lotz MK and Asahara H:
MicroRNA-140 is expressed in differentiated human articular
chondrocytes and modulates interleukin-1 responses. Arthritis
Rheum. 60:2723–2730. 2009. View Article : Google Scholar : PubMed/NCBI
|
|
10
|
Smyth GK: Limma: Linear models for
microarray data. Bioinformatics and computational biology solutions
using R and Bioconductor. Springer; pp. 397–420. 2005, View Article : Google Scholar
|
|
11
|
Benjamini Y and Hochberg Y: Controlling
the false discovery rate: A practical and powerful approach to
multiple testing. J R Stat Soc Series B Stat Methodol. 289–300.
1995.
|
|
12
|
Nam S, Li M, Choi K, Balch C, Kim S and
Nephew KP: MicroRNA and mRNA integrated analysis (MMIA): A web tool
for examining biological functions of microRNA expression. Nucleic
Acids Res. 37:W356–W362. 2009. View Article : Google Scholar : PubMed/NCBI
|
|
13
|
Szklarczyk D, Franceschini A, Kuhn M,
Simonovic M, Roth A, Minguez P, Doerks T, Stark M, Muller J, Bork
P, et al: The STRING database in 2011: Functional interaction
networks of proteins, globally integrated and scored. Nucleic Acids
Res. 39:D561–D568. 2011. View Article : Google Scholar :
|
|
14
|
Smoot ME, Ono K, Ruscheinski J, Wang PL
and Ideker T: Cytoscape 2.8: New features for data integration and
network visualization. Bioinformatics. 27:431–432. 2011. View Article : Google Scholar :
|
|
15
|
Maere S, Heymans K and Kuiper M: BiNGO: A
Cytoscape plugin to assess overrepresentation of gene ontology
categories in biological networks. Bioinformatics. 21:3448–3449.
2005. View Article : Google Scholar : PubMed/NCBI
|
|
16
|
Zhang B, Kirov S and Snoddy J: WebGestalt:
An integrated system for exploring gene sets in various biological
contexts. Nucleic Acids Res. 33:W741–W748. 2005. View Article : Google Scholar : PubMed/NCBI
|
|
17
|
Duncan D, Prodduturi N and Zhang B:
WebGestalt2: An updated and expanded version of the web-based gene
set analysis toolkit. BMC Bioinformatics. 11:P102010. View Article : Google Scholar
|
|
18
|
Pattappa G, Li Z, Peroglio M, Wismer N,
Alini M and Grad S: Diversity of intervertebral disc cells:
Phenotype and function. J Anat. 221:480–496. 2012. View Article : Google Scholar : PubMed/NCBI
|
|
19
|
Le Maitre CL, Pockert A, Buttle DJ,
Freemont AJ and Hoyland JA: Matrix synthesis and degradation in
human intervertebral disc degeneration. Biochem Soc Trans.
35:652–655. 2007. View Article : Google Scholar : PubMed/NCBI
|
|
20
|
de Oliveira CP, Rodrigues LM, Fregni MV,
Gotfryd A, Made AM and Pinhal MA: Extracellular matrix remodeling
in experimental intervertebral disc degeneration. Acta Ortop Bras.
21:144–149. 2013. View Article : Google Scholar
|
|
21
|
Medina R, Zaidi SK, Liu CG, Stein JL, van
Wijnen AJ, Croce CM and Stein GS: MicroRNAs 221 and 222 bypass
quiescence and compromise cell survival. Cancer Res. 68:2773–2780.
2008. View Article : Google Scholar : PubMed/NCBI
|
|
22
|
Koff A: How to decrease p27Kip1 levels
during tumor development. Cancer Cell. 9:75–76. 2006. View Article : Google Scholar : PubMed/NCBI
|
|
23
|
Wurz K, Garcia RL, Goff BA, Mitchell PS,
Lee JH, Tewari M and Swisher EM: MiR-221 and MiR-222 alterations in
sporadic ovarian carcinoma: Relationship to CDKN1B, CDKNIC and
overall survival. Genes Chromosomes Cancer. 49:577–584.
2010.PubMed/NCBI
|
|
24
|
Zhang K, Zhang H, Zhou X, Tang WB, Xiao L,
Liu YH, Liu H, Peng YM, Sun L and Liu FY: MiRNA589 regulates
epithelial-mesenchymal transition in human peritoneal mesothelial
cells. J Biomed Biotechnol. 2012:6730962012. View Article : Google Scholar : PubMed/NCBI
|
|
25
|
Risbud MV and Shapiro IM: Role of
cytokines in intervertebral disc degeneration: Pain and disc
content. Nat Rev Rheumatol. 10:44–56. 2014. View Article : Google Scholar :
|