Introduction
Type 2 diabetes (T2D) is a metabolic disorder, which
affects >300,000,000 individuals worldwide, and its incidence is
increasing, particularly in developing countries, including China
(1). At present, there are several
therapeutic strategies available for the intervention of patients
with T2D. However, the long term efficacy of anti-diabetic
therapies requires improvement, and potential
hyperglycemia-associated complications remain a leading cause of
diabetes-associated mortality (2).
The pathogenesis of T2D remains to be fully elucidated, therefore,
understanding the pathogenic process of T2D may promote the
development of effective therapies for patients with T2D.
Previous studies have suggested that chronic
inflammation is associated with the development of T2D (3,4).
Activated macrophages, T cells and B cells infiltrate into the
adipose and muscle tissues, contributing to the development of
insulin resistance, a hallmark of the pathogenesis of T2D (5–7).
Furthermore, activated inflammatory cells secrete proinflammatory
cytokines, including tumor necrosis factor (TNF)α, interleukin
(IL)-6, which positively regulate insulin resistance. Higher levels
of serum proinflammatory cytokines are detected in T2D patients
(8). However, the precise
regulation of chronic inflammation during the pathogenesis of T2D
in humans remains to be fully elucidated.
Nuclear receptor-related protein 1 (Nurr1) is one
member of the nuclear receptor subfamily and regulates several
physiological functions (9). In
addition to the central nervous system, Nurr1 is expressed in
adipose tissues, the liver, skeletal muscles, and heart tissues,
and is closely associated with the development of metabolic
diseases in humans (10). Previous
studies have demonstrated that Nurr1 inhibits muscular cell
proliferation and inflammation (11–13),
and protects against activated microglial cell-mediated neuronal
cytotox-icity (14,15). Furthermore, Nurr1 also inhibits the
production of pro-inflammatory cytokines by macrophages and
microglial cells (16,17). Nurr1 can interact with the nuclear
factor (NF)-κB pathway to downregulate inflammation, which is
dependent on the activity of glycogen synthase kinase (GSK)-3β
(18–20). However, high expression levels of
Nurr1 are detected in inflamed human synovial tissue, psoriatic
skin, atherosclerotic lesions, lung and colorectal cancer cells
(21–24). Therefore, Nurr1 may have a dual
function in regulating inflammatory process, depending on the
nature of the individual diseases. Whether Nurr1 regulates chronic
inflammation during the pathogenic process of T2D in humans remains
to be elucidated, and the association between the expression levels
of Nurr1 and the production of inflammatory cytokines in human
peripheral blood mononuclear cells (PBMCs) from diabetic patients
has not been investigated.
In the present study, the relative expression levels
of Nurr1 in human PBMCs and the level of serum pro-inflammatory
cytokines were examined in 40 newly diagnosed T2D patients and 40
healthy controls, and the potential association between the
expression levels of Nurr1, serum cytokine levels and clinical
measures were investigated.
Materials and methods
Subjects
A total of 40 patients, newly diagnosed with T2D and
40 age and gender-matched healthy control individuals (HC) were
recruited at Zhongnan Hospital of Wuhan University (Wuhan, China)
between October 2012 and February 2013. The patients with T2D were
diagnosed, according to the diagnostic criteria of the American
Diabetes Association 2003 (25).
Individuals were excluded if they had a history of hypoglycemia,
ketoacidosis, hypertension, cardiovascular disease, liver disease,
any autoimmune disease or a recent infectious disease. Written
informed consent was obtained from each individual involved, and
the experimental procedure was approved by the Ethics Committee of
Zhongnan Hospital of Wuhan University (Approval no. 2012012).
Clinical measurements and laboratory
assessments
The body weight, height and body mass index of each
individual subject were measured. Individual subjects were fasted
for at least 12 h, and median cubital venous blood samples (4 ml
per patient) were obtained. The concentrations of fasting plasma
glucose (FPG), total triglycemia (TG), total cholesterol (TC), high
density lipoprotein (HDL), low density lipoprotein, (LDL) as well
as the levels of plasma alanine aminotransferase (ALT) were
measured by scatter turbidimetry using a Siemens Special Protein
Analysis instrument (Siemens Healthcare Diagnostics Products, GmbH,
Marburg, Germany). The plasma concentrations of fasting insulin
(FINS) were measured by chemiluminescent immunoassay, using the
Insulin (Human) CLIA kit, according to manufacturer's instructions
(Abnova, Walnut, CA, USA). The values of homeostasis model
assessment of insulin resistance (HOMA-IR) in individual subjects
were calculated, according to the formula: Fasting insulin
(microU/L) x fasting glucose (nmol/l)/22.5 (26).
Isolation of human PBMCs and
stimulation
Fasting blood samples were obtained from individual
subjects and their PBMCs were prepared by density gradient
centrifugation using Ficoll-Hypaque (PAA Laboratories GmbH,
Pasching, Austria). PBMCs were used to analyze the levels of the
Nurr1 mRNA transcript using reverse transcription-quantitative
polymerase chain reaction (RT-qPCR), and Nurr1 protein expression
and GSK-3β phosphorylation using western blot analysis.
In addition, a quantity of the PBMCs
(3×10⁵/ml) were stimulated with, or without, 250 or 500
µM palmitic acid, or with 16.7 or 33.3 mM glucose
(Sigma-Aldrich, St Louis, MO, USA) in 10% fetal bovine serum (FBS)
RPMI-1640 (Invitrogen Life Technologies, Carlsbad, CA, USA) at 37°C
for 45 min and 24 h, respectively. The supernatants were then
harvested for analysis of cytokines, and the cells were collected
for the extraction of RNA and proteins for further analyses.
RT-qPCR
The levels of the Nurr1 mRNA transcripts relative to
GAPDH in individual PBMC samples were determined using RT-qPCR.
Briefly, total RNA was isolated from the PBMCs using TRIzol reagent
(Invitrogen Life Technologies), and reverse-transcribed into cDNA
using a RevertAid™ First Strand cDNA Synthesis kit (Fermentas,
Pittsburgh, PA, USA), according to the manufacturer's instructions.
The qPCR was performed using SYBR Green PCR Master Mix and specific
primers on a 7500 Fast Real-Time PCR system (Applied Biosystems,
Foster City, CA, USA), and 40 ng cDNA per sample was used for the
template. The following primer sequences were used: Nurr1 forward
5′-CCTTGTGTTCAGGCGCAGTAT-3′ and reverse
5′-GTGGCAGTGATTTCAGTGTTGGT-3′ (158 bp); TNF-α forward
5′-GCCAGCTCCCTCTATTTATG-3′ and reverse 5′-TGGTCACCAAATCAGCATTG-3′
for TNF-α (272 bp), and GAPDH forward 5′-GGC
TGAGAACCGGAAGCTTGTCAT-3′ and reverse 5′-CAGCCT
TCTCCATGCTGGTGGTGAAGA-3′ for (314 bp). The amplification was
performed at 95°C for 5 min followed by 40 cycles of 94°C for 15
sec, 55°C for 20 sec, 72°C for 20 sec, followed by 72°C for 7 min.
The levels of mRNA transcripts were analyzed using the
2−ΔΔCt method (27).
Western blot analysis
The collected PBMC samples were lyzed in
radioimmunoprecipitation assay buffer containing 1% Triton X-100,
50 mM KCl, 25 mM Hepes (pH 7.8), 10 µg/ml leupeptin, 20
µg/ml aprotinin, 125 µM dithiothreitol, 1 mM
phenylmethanesulfonyl fluoride and 1 mM sodium orthovanadate
(Sigma-Aldrich), and centrifuged at 12,000 x g for 15 min at 4°C.
Following quantification of the protein concentrations using a
bicinchoninic acid assay (Santa Cruz Biotechnology, Inc., Dallas,
TX, USA), the individual cell lysates (40 µg/lane) were
separated by 12% sodium dodecyl sulfate polyacrylamide gel
electrophoresis and transferred onto polyvinylidene fluoride
membranes (EMD Millipore, Billerica, MA, USA). The membranes were
blocked with 5% fat-free dry-milk in Tris-buffered saline with 0.1%
Tween 20 and incubated with the following antibodies: Mouse
monoclonal anti-Nurr1 (cat. no. ab54366; 1:1,000; Abcam, Cambridge,
MA, USA), rabbit polyclonal anti-pho-GSK-3β (cat. no. ab75745;
1:1,000; Abcam), goat polyclonal anti-GAPDH (cat. no. sc-20356;
1:10,00; Santa Cruz Biotechnology, Inc.) and rabbit polyclonal
anti-β-actin (cat. no. sc1616R; 1:1,000; Santa Cruz Biotechnology,
Inc.) overnight at 4°C, respectively. Following washing twice, the
bound antibodies were detected using horseradish
peroxidase-conjugated anti-rabbit (cat. no. sc-2030; 1:3,000; Santa
Cruz Biotechnology, Inc.), or anti-mouse (cat. no. sc-2005;
1:3,000; Santa Cruz Biotechnology, Inc.)at room temperature for 1
h, and visualized using enhanced chemiluminescence (Santa Cruz
Biotechnology, Inc.). Purified mouse, or rabbit immunoglobulin G
were used as negative controls. The levels of targeting proteins
relative to β-actin or GAPDH were determined using Alpha EaseFC 4.0
(Alpha Innotech, San Leandro, CA, USA).
ELISA
The levels of IL-6 and TNFα in individual plasma
samples were determined using specific ELISA kits (Boster Statems,
Inc., Wuhan, China), according to the manufacturer's instructions.
The limitations of detection for plasma IL-6 and TNFα were 1.8
pg/ml, and 13.3 pg/ml, respectively.
Statistical analysis
Data are presented as the median (range) or the mean
± standard deviation. Differences between groups were analyzed
using Student's t-test for normally distributed data or using a
Wilcoxon signed-rank test for skewed data. The differences in the
category data between these two groups were analyzed using a
χ2-square test. The potential association between
variants was analyzed using Spearman's rank correlation
coefficient. All statistical analyses were performed using the SPSS
statistics 16.0 software package. P<0.05 was considered to
indicate a statistically significant difference.
Results
Increased plasma levels of
pro-inflammatory cytokines are observed in patients with T2D
To understand the potential regulation of the
expression Nurr1 on chronic inflammation during the development of
T2D, 40 patients with newly diagnosed T2D and 40 age- and
gender-matched HC were recruited to the present study. As shown in
Table I, no significant
differences were apparent in the distribution of age and gender or
BMI between the T2D patients and HC group. The levels of FPG and
FINS, and the HOMA IR values in the T2D patients were significantly
higher, as compared with that in the HC group (P<0.01 for all),
demonstrating hyperglycemia and compensated increased secretion of
insulin and the development of insulin resistance in the T2D
patients. Furthermore, although no significant difference was
observed in the levels of plasma levels of TC and LDL-c between the
patients and HC group, significantly higher levels of plasma TG and
lower levels of HDL-c were detected in the T2D patients (P<0.01
for all), indicating dysfunctional lipid metabolism in T2D
patients.
 | Table IDemographic and clinical
characteristics of the recruited patients and healthy control
subjects. |
Table I
Demographic and clinical
characteristics of the recruited patients and healthy control
subjects.
| Variable | Diabetic group | Control group | P-value |
|---|
| Age (years) | 53.03±8.3 | 51.05±11.45 | NS |
| Male/female | 24/16 | 18/22 | NS |
| Body mass index | 22.80±2.79 | 21,87±2.18 | NS |
| Total cholesterol
(mmol/l) | 5.56±2.45 | 4.80±0.94 | NS |
| Total triglycemia
(mmol/l) | 2.07±0.75 | 1.15±0.59 | <0.01 |
| High density
lipoprotein (mmol/l) | 1.02±0.25 | 1.34±0.31 | <0.01 |
| Low density
lipoprotein (mmol/l) | 3,02±0.66 | 2.84±0.51 | NS |
| Fasting insulin
(µU/ml) | 16.26±3.95 | 6.60±2.38 | <0.01 |
| Fasting plasma
glucose (mmol/l) | 9.01±1.62 | 4.96±0.43 | <0.01 |
| HOMA-IR | 6.56±1.98 | 1.46±0.57 | <0.01 |
| Alanine
aminotransferase (U/l) | 22.23±10.18 | 21.23±12.33 | NS |
| Tumor necrosis
factor α (pg/ml) | 75.29±16.52 | 49.63±13.92 | <0.01 |
| Interleukin-6
(pg/ml) | 19.32±7.12 | 10.68±5.83 | <0.01 |
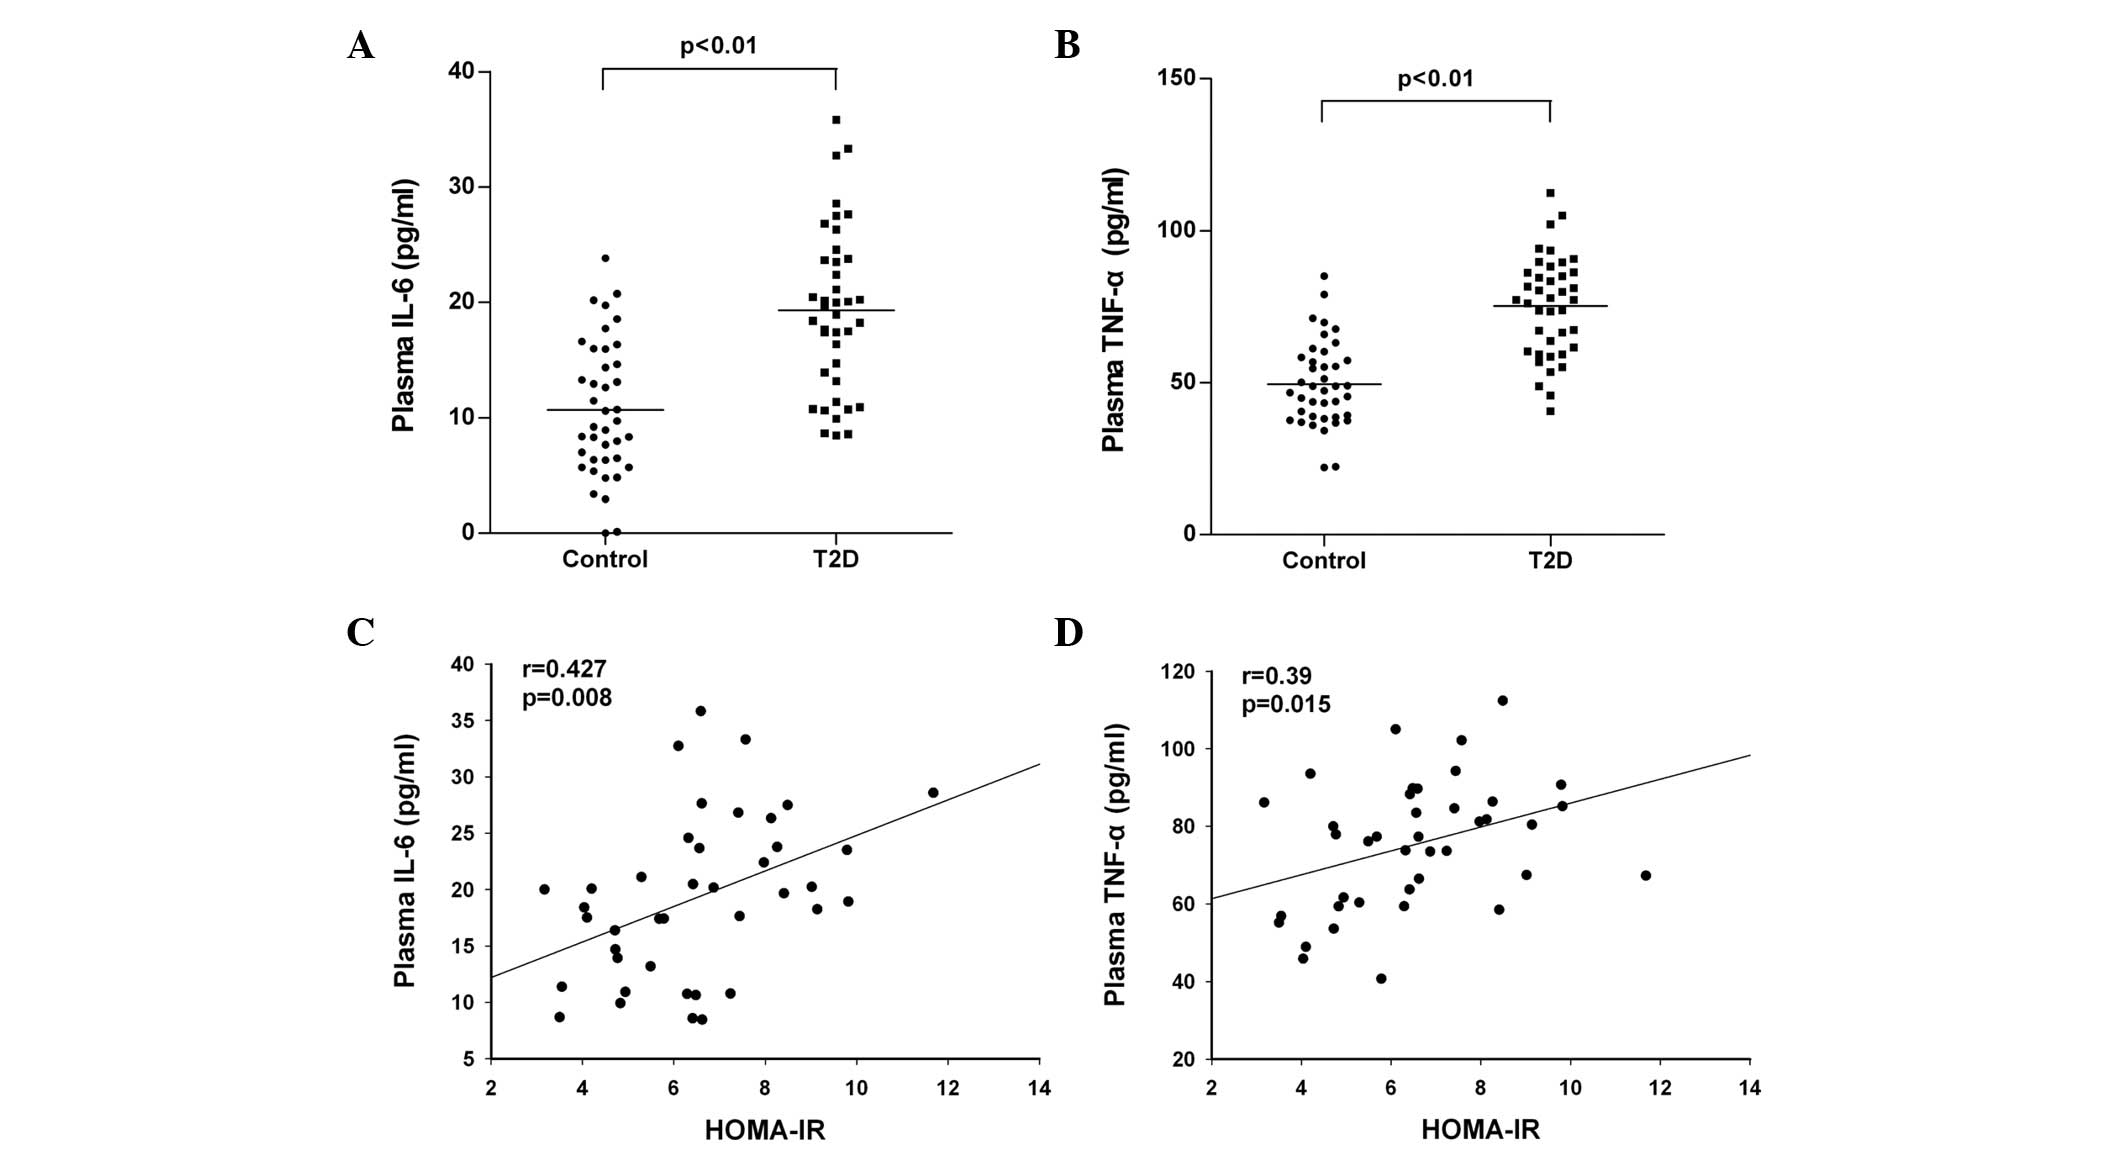
Further analysis revealed that the plasma levels of
IL-6 and TNFα in the T2D patients were significantly higher than
those in the HC group (P<0.01; Fig.
1A and B). Notably, the levels of IL-6 and TNFα were positively
correlated with the values of HOMA-IR in the T2D patients (r=0.427:
P=0.008 and r=0.39; P=0.015, respectively), as shown in Fig. 1C and D. In addition, PBMCs were
isolated from the HC and T2D patients, and were stimulated with
PMA/ionomycin in vitro, followed by assessment of the
relative expression levels of IL-6 and TNFα using western blot
analysis. The results revealed that the relative expression levels
of IL-6 and TNFα in the PBMCs from the T2D patients were
significantly higher than those in the PBMCs from the HC group
(1.08±0.11, vs. 0.49±0.14 for IL-6; P<0.01 and 1.14±0.11, vs.
0.56±0.09 for TNFα; P<0.01). These data suggested that high
levels of pro-inflammatory cytokines were present in patients with
T2D and may be associated with the development of insulin
resistance during the development of T2D.
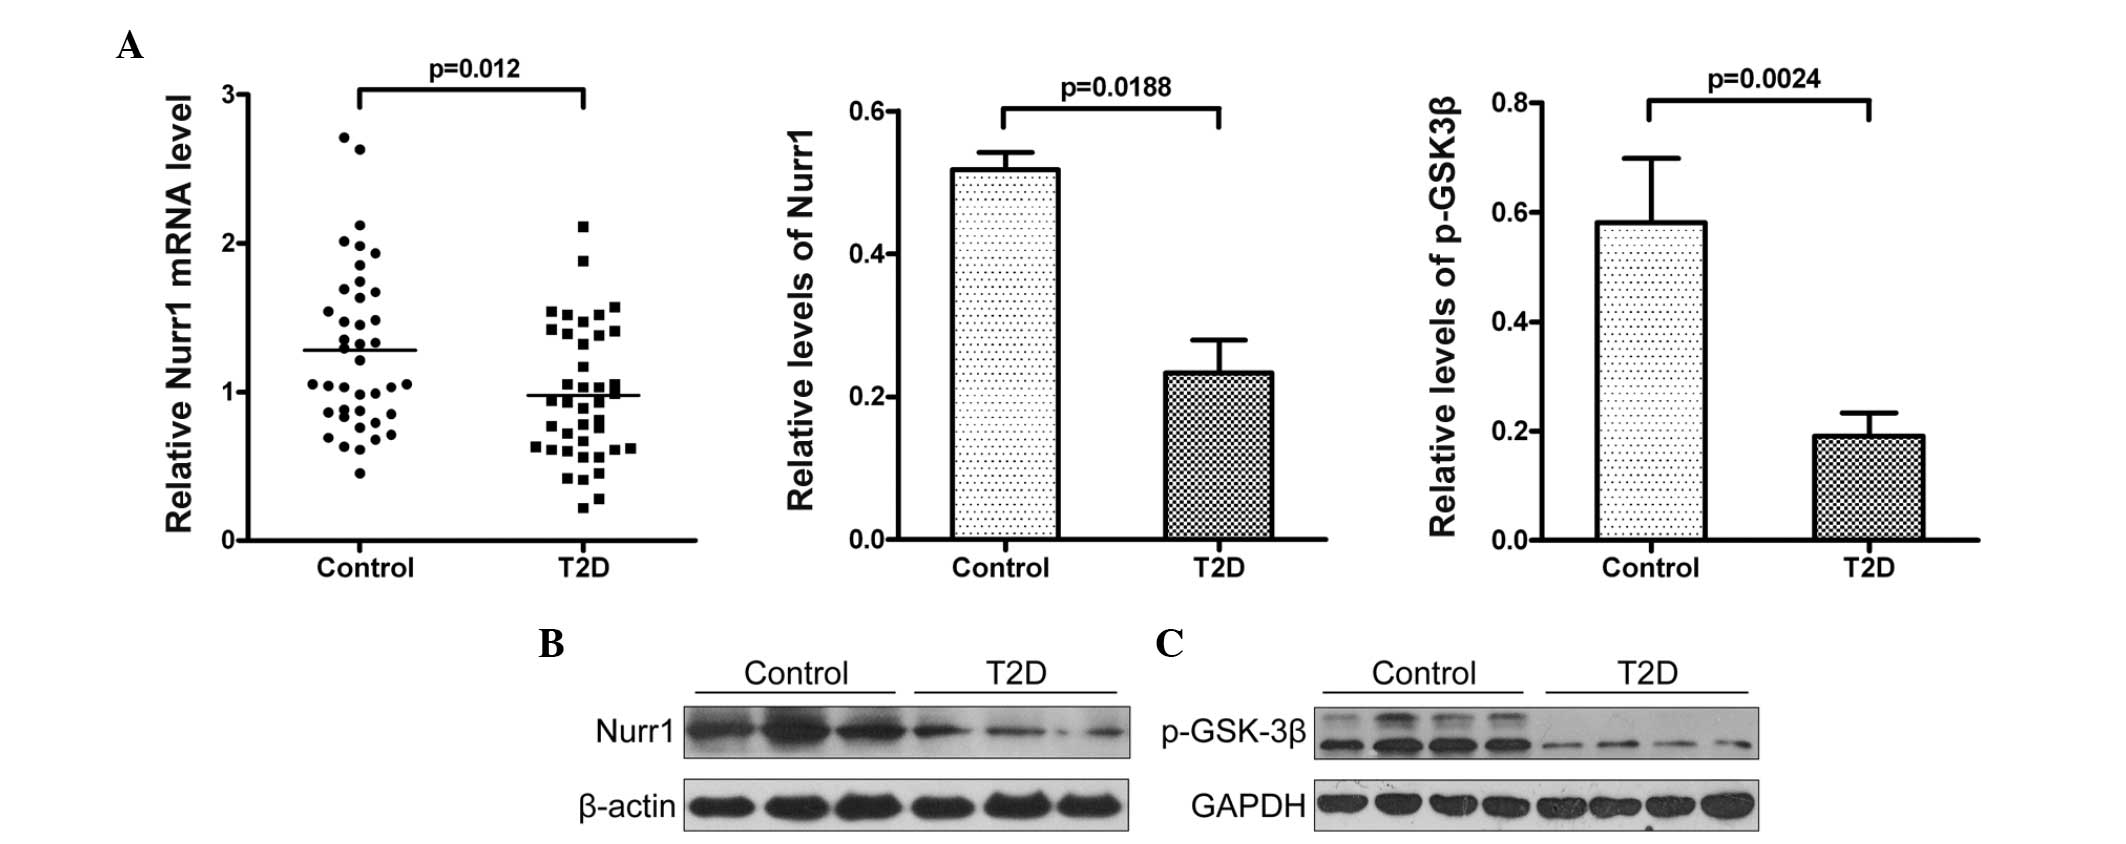
Decreased expression of Nurr1 and
phosphorylation of GSK-3β are associated with the development of
T2D
Nurr1 can downregulate inflammation and
pro-inflammatory cytokine production, which depends on activity of
GSK-3β in astrocytes and microglial cells (11,19,21).
To understand the molecular mechanisms underlying the role of Nurr1
in the development of chronic inflammation, the present study
analyzed the relative expression levels of Nurr1 in the PBMCs from
the patients with T2D and the HC group using RT-qPCR and western
blot analysis. As shown in Fig.
2A, the relative levels of Nurr1 mRNA transcripts in the T2D
patients were significantly lower, compared with those in the HC
group (P=0.012). The western blot analysis indicated that the
relative protein levels of Nurr1 in the PBMCs from the T2D patients
were also significantly lower, compared with those in the HC
(P=0.0188; Fig. 2B). GSK-3β is
crucial for the recruitment of Nurr1 to the promoter of
pro-inflammatory cytokines in immunocompetent cells, and the
phosphorylation of GSK-3β at tyrosine-216 can enhance its activity
(19). To understand the potential
role of GSK-3β phosphorylation in regulating the Nurr1-mediated
inhibition of cytokine production in human immunocompetent cells,
the present study analyzed the relative levels of GSK-3β
tyrosine-216 phosphorylation in the PBMCs from the T2D patients and
HC group. The relative levels of GSK-3β tyrosine-216
phosphorylation in the PBMCs from the T2D patients were
significantly lower than those in the HC (Fig. 2C), which may have contributed to
the higher levels of pro-inflammatory cytokines in the T2D
patients. Therefore, the decreased expression of Nurr1 and
phosphorylation of GSK-3β tyrosine-216 may be associated with the
development of chronic inflammation and T2D.
Decreased expression levels of Nurr1 are
inversely correlated with the plasma levels of pro-inflammatory
cytokines and the degree of insulin resistance in patients with
T2D
To understand the clinical significance of the
results, the present study analyzed the association between the
relative levels of Nurr1 mRNA transcripts in the PBMCs, the levels
of plasma cytokines and insulin, and the degree of insulin
resistance in the T2D patients. As shown in Fig. 3, the relative levels of Nurr1 mRNA
transcripts in the PBMCs were positively correlated with the plasma
levels of HDL-c (r=0.45, P=0.005), but negatively correlated with
the plasma levels of IL-6 (r=−0.353; P=0.030), TNF-α (−0.426;
P=0.008), FINS (r=−0.485; P=0.002) and HOMA-IR (r=−0.424; P=0.008).
Therefore, decreased expression levels of Nurr1 were inversely
correlated with the levels of plasma pro-inflammatory cytokines and
the degree of insulin resistance in the T2D patients.
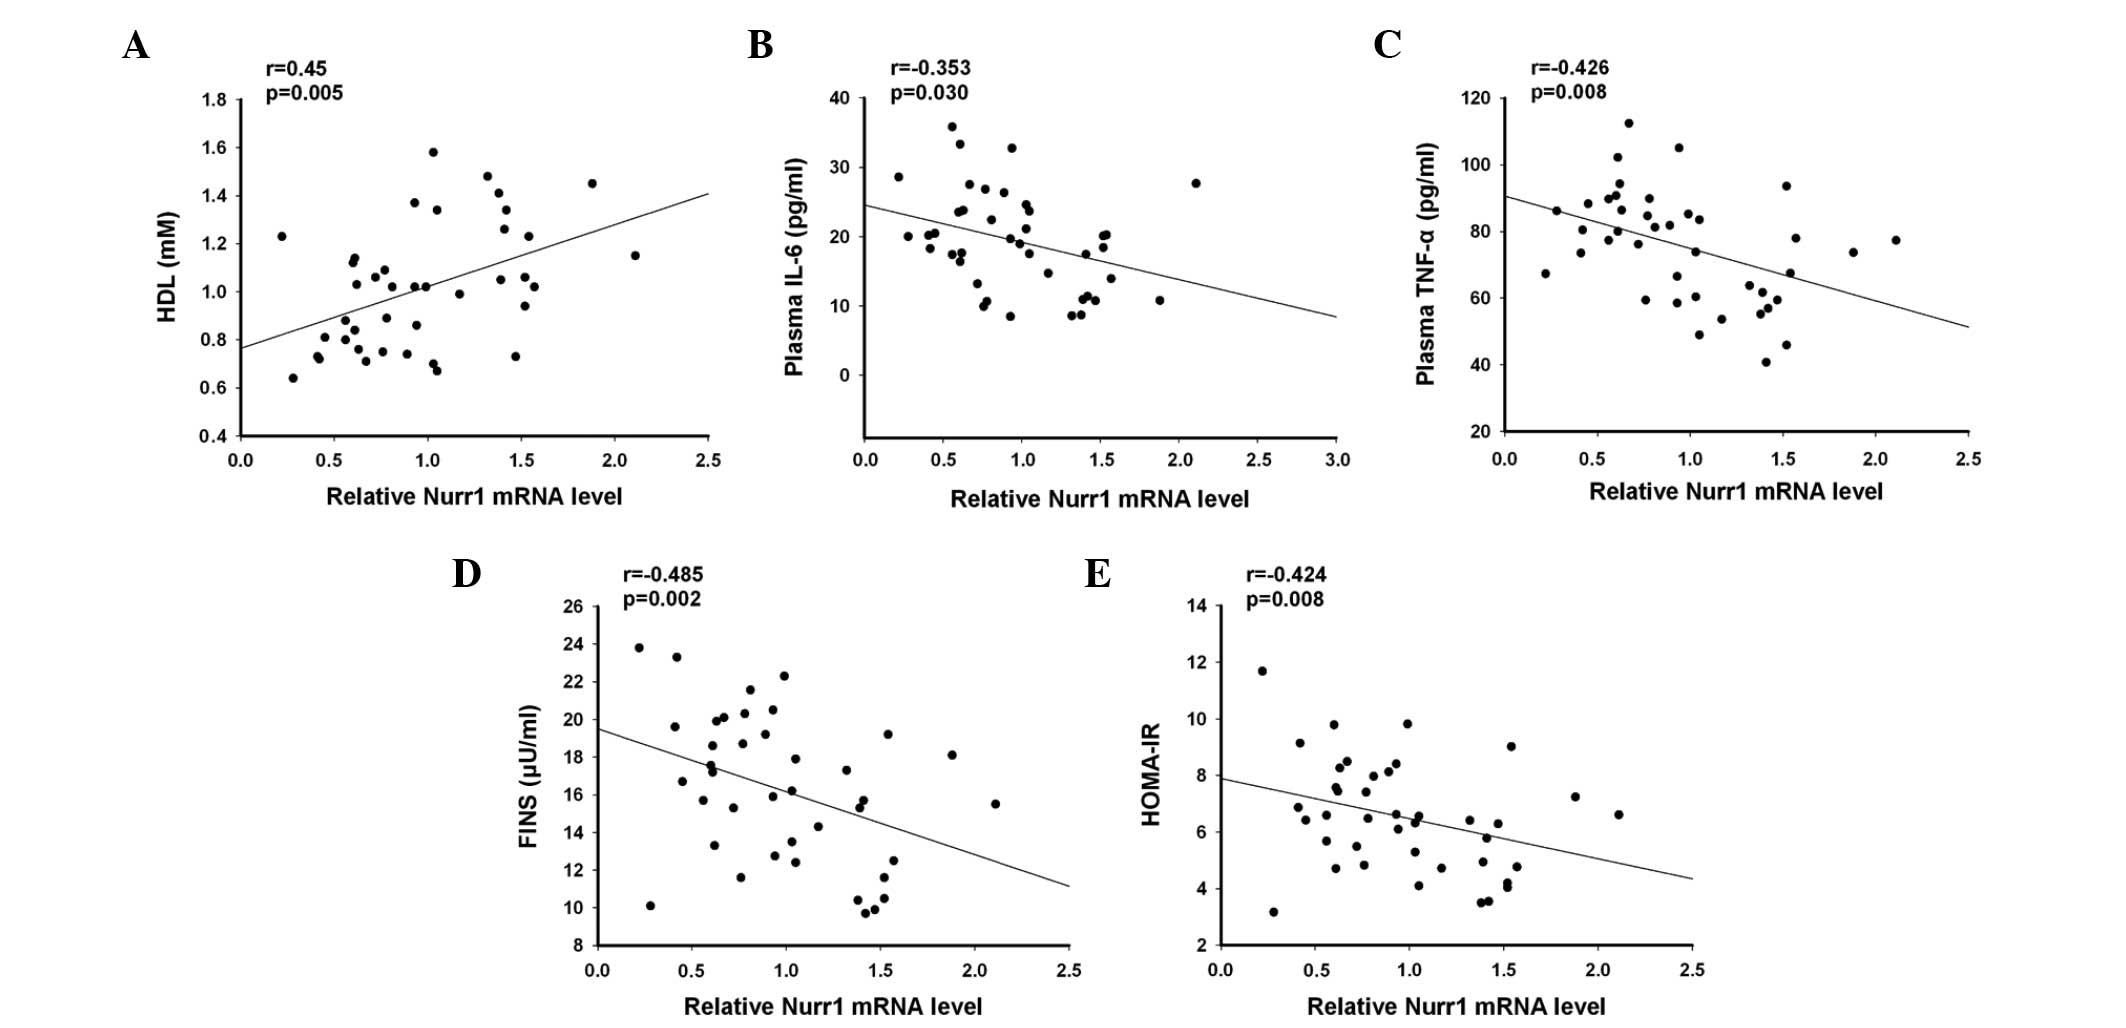 | Figure 3Anaylses of the correlation and
potential association between the relative levels of Nurr1 mRNA
transcripts in the PBMCs with clinical measurements in the T2D
patients. Analysis of the potential correlation between the
relative levels of Nurr1 mRNA transcripts in the PBMCs and the
plasma levels of (A) HDL, (B) IL-6, (C) TNF-α, (D) FINS and (E)
HOMA-IR in 40 patients with T2D were performed using Spearman's
rank correlation coefficient. Data are presented as the mean levels
of Nurr1 mRNA transcripts against the values of the indicated
clinical parameters in individual patients. Nurr1, nuclear
receptor-related protein 1; PBMC, peripheral blood mononuclear
cell; T2D, type 2 diabetes. HDL, high density lipoprotein; IL,
interleukin; TNF, tumor necrosis factor; FINS, fasting insulin;
HOMA-IR, homeostasis model assessment of insulin resistance. |
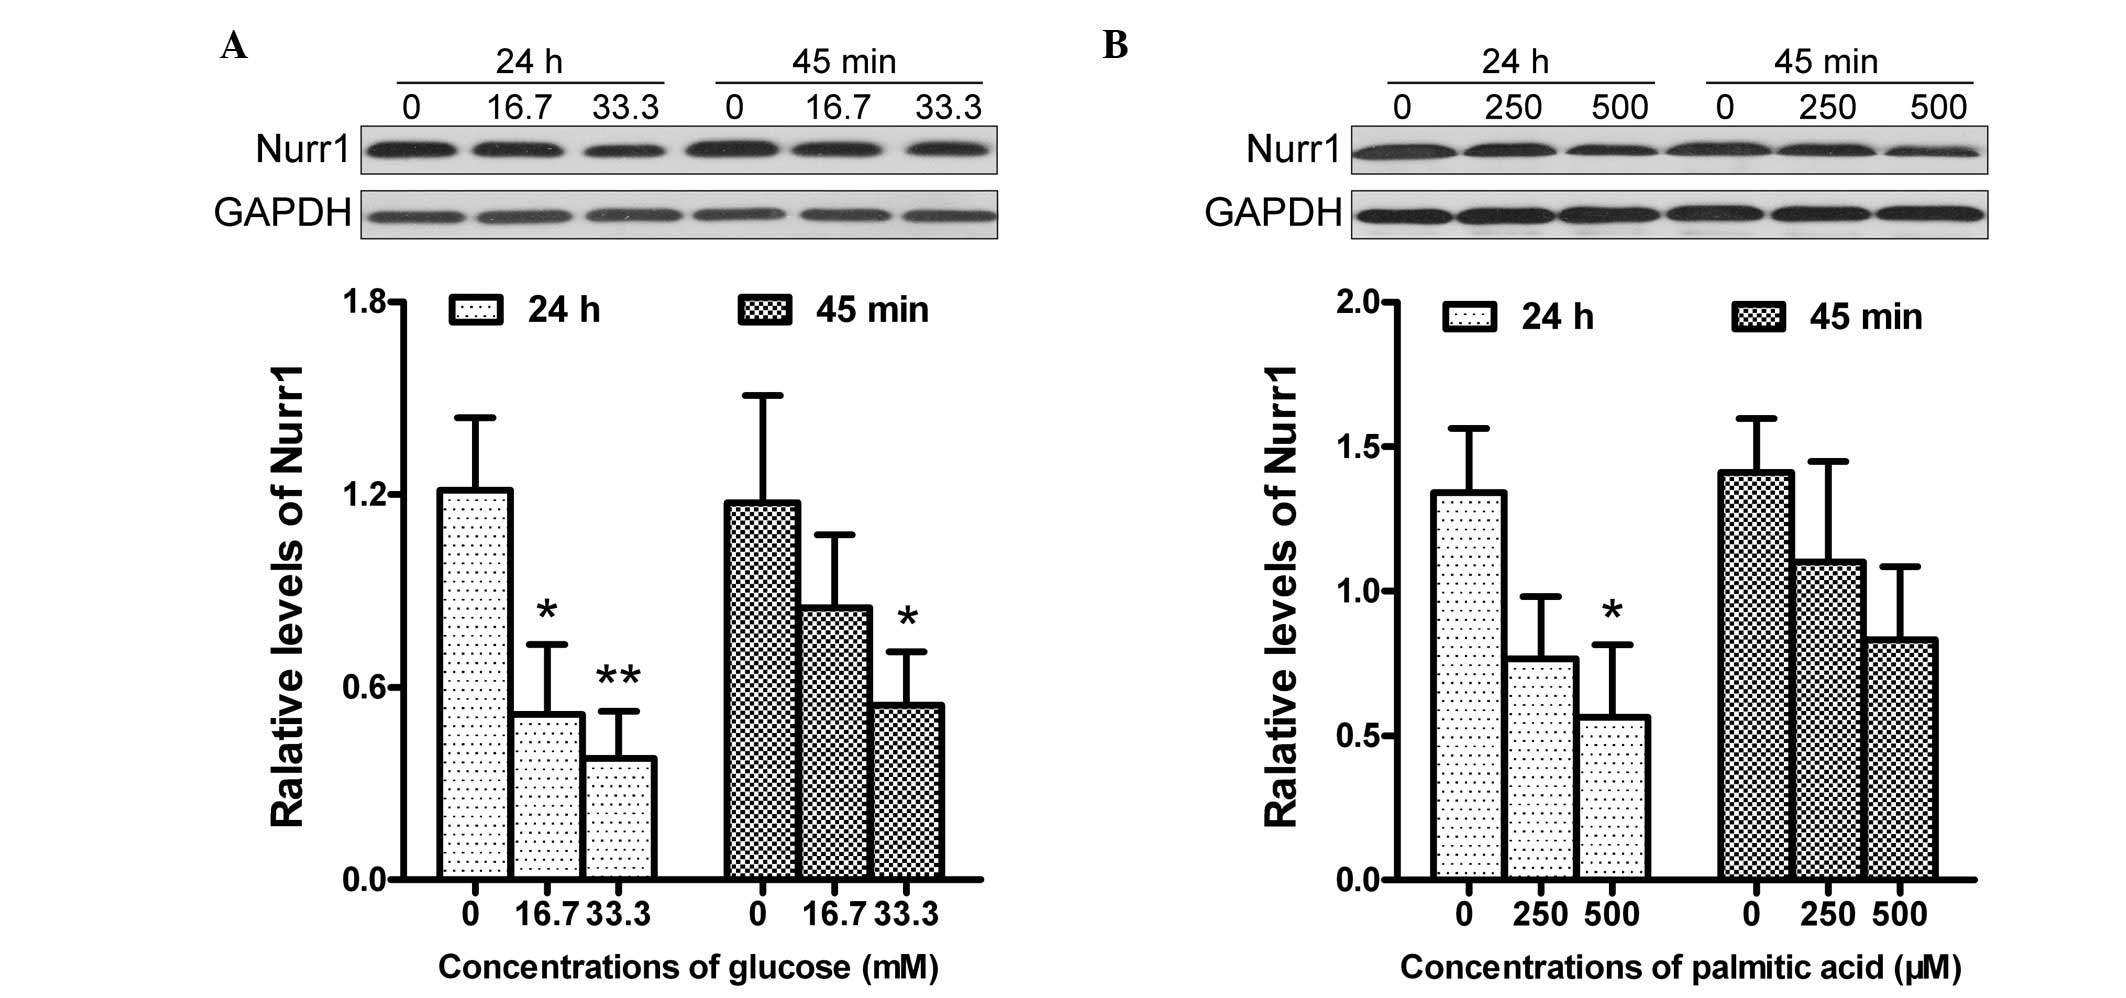
High levels of glucose or palmitic acid
inhibit the expression of Nurr1 in PBMCs
Previous studies have demonstrated that high levels
of glucose and saturated fatty acids can enhance the activity of
NF-kB and promote the production of TNF-α in human PBMCs (28–30).
To further understand the role of hyperglycemia and hyperlipidemia
in the development of chronic inflammation, the present study
examined the impact of different concentrations of glucose and
palmitic acid on the expression levels of Nurr1 in the PBMCs from
the HC group. As shown in Fig. 4,
treatment with 16.7 mmol/l glucose significantly reduced the
expression levels of Nurr1 in the PBMCs, compared with the
untreated PBMCs. Treatment with a higher concentration of glucose
further reduced the expression of Nurr1 in the PBMCs. In addition,
treatment with a lower dose of glucose for 45 min reduced the
expression levels of Nurr1 by almost 30%, and treatment with the
same dose of glucose decreased the expression levels of Nurr1 by
57% for 24 h. Notably, a similar pattern of reduced levels of Nurr1
were observed in the PBMCs following treatment with different
concentrations of palmitic acid for varying time-periods in
vitro. Therefore, high levels of glucose or palmitic acid
inhibited the expression of Nurr1 in the PBMCs in a dose- and
time-dependent manner.
Discussion
Chronic inflammation is associated with the
development of T2D, and previous studies have demonstrated that
abnormal exprssion levels of Nurr1 are associated with the
pathological process of metabolic syndrome in humans (3,9,10,31).
However, whether alteration in the expression of Nurr1 in PBMCs
occurs in T2D patients, and how these changes in Nurr1 are
associated with the insulin resistance, a pathogenic basis of T2D
remain to be fully elucidated. In the present study, the plasma
levels of IL-6 and TNF-α in the T2D patients were significantly
higher than those in the HC group. Furthermore, the significantly
higher levels of plasma IL-6 and TNF-α were positively correlated
with the degree of insulin resistance in the T2D patients. These
data are consistent with previous observations (8,32)
and support the hypothesis that pro-inflammatory cytokines
contribute to the development of insulin resistance and T2D in
humans.
Nurr1 is considered an inhibitor of inflammation,
and its abnormal expression is associated with the development of
insulin resistance and metabolic syndrome (10,31).
Furthermore, Nurr1 can interact with the NF-κB pathway to
downregulate inflammation, which is dependent on GSK-3β
phosphorylation (19). In the
present study, the expression levels of Nurr1 in the PBMCs from the
T2D patients were significantly lower than those in the HC group.
Similarly, the relative levels of GSK-3β phosphorylation in the
PBMCs from the T2D patients were significantly lower than those in
the HC group. Notably, the relative expression levels of Nurr1 were
correlated negatively with the levels of plasma IL-6 and TNF-α, as
well as the degree of insulin resistance, in the T2D patients. To
the best of our knowledge, this is the first report to demonstrate
that significantly reduced expression levels of Nurr1 in PBMCs were
negatively correlated with the levels of pro-inflammatory cytokines
in the plasma and with the degrees of insulin resistance in T2D
patients. Previous studies have reported lower expression levels of
Nurr1 in patients with neuroimmunological and inflammatory
disorders, including Parkinson's disease and metabolic syndrome
(9,10,12,33,34).
The findings of the present study extended those of previous
observations and suggested that lower expression levels of Nurr1
may be present in patients with other types of inflammatory
diseases. Given that insulin resistance is crucial for the
development of T2D and other metabolic syndrome-associated chronic
inflammatory diseases, the significant inverse correlation
identified between the expression of Nurr1 and insulin resistance
suggested that the expression of Nurr1 in PBMCs may be a biomarker
for clinically evaluating the degrees of insulin resistance in T2D
and other insulin-resistance-associated metabolic disorders
(31).
It is well established that high levels of glucose
and saturated fat acid can stimulate inflammatory cytokine
production in human immunocompetent cells (28–30).
In the present study, high levels of glucose and palmitic acid
inhibited the expression of Nurr1 in the PBMCs from healthy
subjects in vitro, in a dose- and time-dependent manner.
Previous studies have suggested that Nurr1, together with its
co-factor of phosphorylated GSK-3β and CoREST can interact with the
NF-kB transcription factor in the promoters of inflammatory
cytokines to inhibit their transcription (19,20).
NR4A3 and NR4A1, members of the same family as Nurr1, have been
observed to regulate the membrane translocation of glucose
transporter of GLUT4 and insulin receptor phosphorylation in
muscular cells, and enhances insulin sensitivity (11). The present study demonstrated
significantly lower expression levels of Nurr1 and GSK-3β
phosphorylation in the PBMCs from T2D patients. It is possible that
metabolic disorder-associated high levels of glucose and high
levels of saturated fatty acids inhibit the expression of Nurr1 and
GSK-3β phosphorylation, to mitigate their inhibition on NF-κB
activation, leading to increased levels of pro-inflammatory
cytokine production, particularly for TNF-α. High levels of
pro-inflammatory cytokines, together with lower expression levels
of NR4A members inhibit glucose transporter expression and insulin
receptor phosphorylation, leading to insulin resistance. Long term
insulin resistance results in hyperglycemia and hyperlipidemia,
which further downregulate the expression of Nurr1, creating
positive feedback regulation and driving the pathogenesis of T2D.
Further investigation of the regulatory effect of Nurr1 on
inflammation, insulin resistance and T2D development is
suggested.
The present study had limitations of a small sample
size and the lack of longitudinal observations and investigation of
the molecular mechanisms underlying the regulation of Nurr1 on
inflammation and insulin resistance. Therefore, further
longitudinal studies in a larger population are warranted.
In conclusion, the present study demonstrated
signifi-cantly higher levels of pro-inflammatory cytokines, but
lower expression levels of Nurr1 and GSK-3β phosphorylation in
PBMCs from T2D patients. Furthermore, the expression levels of
Nurr1 in the PBMCs were negatively correlated with the degree of
insulin resistance in the T2D patients. High levels of glucose and
palmitic acid inhibited the expression of Nurr1 in the PBMCs from
healthy subjects in vitro, in a dose- and time-dependent
manner. These data suggested that the expression levels of Nurr1
may serve as a biomarker for evaluating the severity of insulin
resistance. These findings may provide novel insight in the
pathogenesis of chronic inflammation-associated insulin resistance
and T2D.
Acknowledgments
This study was supported by grants from the National
Natural Science Foundation of China (grant. nos. 81170769 and
81370872).
References
|
1
|
Tuomi T, Santoro N, Caprio S, Cai M, Weng
J and Groop L: The many faces of diabetes: a disease with
increasing heterogeneity. Lancet. 383:1084–1094. 2014. View Article : Google Scholar
|
|
2
|
Ma RC and Chan JC: Type 2 diabetes in east
Asians: similarities and differences with populations in Europe and
the United States. Ann N Y Acad Sci. 1281:64–91. 2013. View Article : Google Scholar : PubMed/NCBI
|
|
3
|
Cildir G, Akincilar SC and Tergaonkar V:
Chronic adipose tissue inflammation: all immune cells on the stage.
Trends Mol Med. 19:487–500. 2013. View Article : Google Scholar : PubMed/NCBI
|
|
4
|
Tilg H and Moschen AR: Inflammatory
mechanisms in the regulation of insulin resistance. Mol Med.
14:222–231. 2008. View Article : Google Scholar : PubMed/NCBI
|
|
5
|
Osborn O and Olefsky JM: The cellular and
signaling networks linking the immune system and metabolism in
disease. Nat Med. 18:363–374. 2012. View
Article : Google Scholar : PubMed/NCBI
|
|
6
|
Feuerer M, Herrero L, Cipolletta D, et al:
Lean, but not obese, fat is enriched for a unique population of
regulatory T cells that affect metabolic parameters. Nat Med.
15:930–939. 2009. View
Article : Google Scholar : PubMed/NCBI
|
|
7
|
DeFuria J, Belkina AC, Jagannathan-Bogdan
M, et al: B cells promote inflammation in obesity and type 2
diabetes through regulation of T-cell function and an inflammatory
cytokine profile. Proc Natl Acad Sci USA. 110:5133–5138. 2013.
View Article : Google Scholar : PubMed/NCBI
|
|
8
|
Navarro-Gonzalez J, Mora-Fernandez C,
Gomez-Chinchon M, Muros M, Herrera H and Garcia J: Serum and gene
expression profile of tumor necrosis factor-alpha and interleukin-6
in hypertensive diabetic patients: effect of amlodipine
administration. Int J Immunopathol Pharmacol. 23:51–59.
2010.PubMed/NCBI
|
|
9
|
Hamers AA, Hanna RN, Nowyhed H, Hedrick CC
and de Vries CJ: NR4A nuclear receptors in immunity and
atherosclerosis. Curr Opin Lipidol. 24:381–385. 2013.PubMed/NCBI
|
|
10
|
Pearen MA and Muscat GE: Minireview:
Nuclear hormone receptor 4A signaling: implications for metabolic
disease. Mol Endocrinol. 24:1891–1903. 2010. View Article : Google Scholar : PubMed/NCBI
|
|
11
|
Fu Y, Luo L, Luo N, Zhu X and Garvey WT:
NR4A orphan nuclear receptors modulate insulin action and the
glucose transport system: potential role in insulin resistance. J
Biol Chem. 282:31525–31533. 2007. View Article : Google Scholar : PubMed/NCBI
|
|
12
|
Bonta PI, Pols TW, van Tiel CM, et al:
Nuclear receptor Nurr1 is expressed in and is associated with human
restenosis and inhibits vascular lesion formation in mice involving
inhibition of smooth muscle cell proliferation and inflammation.
Circulation. 121:2023–2032. 2010. View Article : Google Scholar : PubMed/NCBI
|
|
13
|
McEvoy AN, Bresnihan B, Fitzgerald O and
Murphy EP: Corticotropin-releasing hormone signaling in synovial
tissue vascular endothelium is mediated through the cAMP/CREB
pathway. Ann N Y Acad Sci. 966:119–130. 2002. View Article : Google Scholar : PubMed/NCBI
|
|
14
|
Zhang Z, Li X, Xie WJ, et al:
Anti-parkinsonian effects of Nurr1 activator in
ubiquitin-proteasome system impairment induced animal model of
Parkinson's disease. CNS Neurol Disord Drug Targets. 11:768–773.
2012. View Article : Google Scholar : PubMed/NCBI
|
|
15
|
Block Ml, Zecca L and Hong JS:
Microglia-mediated neuro-toxicity: uncovering the molecular
mechanisms. Nat Rev Neurosci. 8:57–69. 2007. View Article : Google Scholar
|
|
16
|
Bonta PI, van Tiel CM, Vos M, et al:
Nuclear receptors Nur77, Nurr1 and NOR-1 expressed in
atherosclerotic lesion macrophages reduce lipid loading and
inflammatory responses. Arterioscler Thromb Vasc Biol.
26:2288–2294. 2006. View Article : Google Scholar : PubMed/NCBI
|
|
17
|
Wang T, Jiang Q, Chan C, et al: Inhibition
of activation-induced death of dendritic cells and enhancement of
vaccine efficacy via blockade of MINOR. Blood. 113:2906–2913. 2009.
View Article : Google Scholar : PubMed/NCBI
|
|
18
|
Buss H, Dörrie A, Schmitz Ml, et al:
Phosphorylation of serine 468 by GSK-3beta negatively regulates
basal p65 NF-kappaB activity. J Biol Chem. 279:49571–49574. 2004.
View Article : Google Scholar : PubMed/NCBI
|
|
19
|
Saijo K, Winner B, Carson CT, et al: A
Nurr1/CoREST pathway in microglia and astrocytes protects
dopaminergic neurons from inflammation-induced death. Cell.
137:47–59. 2009. View Article : Google Scholar : PubMed/NCBI
|
|
20
|
Wan F and Lenardo MJ: The nuclear
signaling of NF-kappaB: current knowledge, new insights and future
perspectives. Cell Res. 20:24–33. 2010. View Article : Google Scholar
|
|
21
|
McMorrow JP and Murphy EP: Inflammation: a
role for NR4A orphan nuclear receptors? Biochem Soc Trans.
39:688–693. 2011. View Article : Google Scholar : PubMed/NCBI
|
|
22
|
O'Kane M, Murphy EP and Kirby B: The role
of cortico-tropin-releasing hormone in immune-mediated cutaneous
inflammatory disease. Exp Dermatol. 15:143–153. 2006. View Article : Google Scholar : PubMed/NCBI
|
|
23
|
Pei L, Castrillo A, Chen M, Hoffmann A and
Tontonoz P: Induction of NR4A orphan nuclear receptor expression in
macrophages in response to inflammatory stimuli. J Biol Chem.
280:29256–29262. 2005. View Article : Google Scholar : PubMed/NCBI
|
|
24
|
Safe S, Jin UH, Hedrick E, Reeder A and
Lee SO: Minireview: role of orphan nuclear receptors in cancer and
potential as drug targets. Mol Endocrinol. 28:157–172. 2014.
View Article : Google Scholar :
|
|
25
|
Expert Committee on the Diagnosis and
Classification of Diabetes Mellitus: Report of the expert committee
on the diagnosis and classification of diabetes mellitus. Diabetes
Care. 26(Suppl 1): S5–S20. 2003. View Article : Google Scholar
|
|
26
|
Turner RC, Holman RR, Matthews D, Hockaday
TD and Peto J: Insulin deficiency and insulin resistance
interaction in diabetes: Estimation of their relative contribution
by feedback analysis from basal plasma insulin and glucose
concentrations. Metabolism. 28:1086–1096. 1979. View Article : Google Scholar : PubMed/NCBI
|
|
27
|
Livak KJ and Schmittgen TD: Analysis of
the relative gene expression data using real-time quantitative PCR
and the 2(-Delta Delta C(T)) Method. Methods. 25:402–408. 2001.
View Article : Google Scholar
|
|
28
|
Hâncu N, Netea MG and Baciu I: High
glucose concentrations increase the tumor necrosis factor-alpha
production capacity by human peripheral blood mononuclear cells.
Rom J Physiol. 35:325–330. 1998.
|
|
29
|
Fogeda M, Gallart L, Gutierrez C, et al:
High expression of tumor necrosis factor alpha receptors in
peripheral blood mono-nuclear cells of obese type 2 diabetic women.
Eur Cytokine Netw. 15:60–66. 2004.PubMed/NCBI
|
|
30
|
Mylona EE, Mouktaroudi M, Crisan TO, et
al: Enhanced interleukin-1beta production of PBMCs from patients
with gout after stimulation with Toll-like receptor-2 ligands and
urate crystals. Arthritis Res Ther. 14:R1582012. View Article : Google Scholar
|
|
31
|
D'Amore S, Vacca M, Graziano G, et al:
Nuclear receptors expression chart in peripheral blood mononuclear
cells identifies patients with metabolic syndrome. Biochim Biophys
Acta. 1832:2289–2301. 2013. View Article : Google Scholar : PubMed/NCBI
|
|
32
|
Giulietti A, Stoffels K, Decallonne B,
Overbergh L and Mathieu C: Monocytic expression behavior of
cytokines in diabetic patients upon inflammatory stimulation. Ann N
Y Acad Sci. 1037:74–78. 2004. View Article : Google Scholar
|
|
33
|
Davies MR, Harding CJ, Raines S, et al:
Nurr1 dependent regulation of pro-inflammatory mediators in
immortalised synovial fibroblasts. J Inflamm (Lond). 2:152005.
View Article : Google Scholar
|
|
34
|
Lee JK, Tran T and Tansey MG:
Neuroinflammation in Parkinson's disease. J Neuroimmune Pharmacol.
4:419–429. 2009. View Article : Google Scholar : PubMed/NCBI
|