Introduction
Pancreatic carcinoma, a major contributor to
cancer-related mortality globally, has witnessed a distressing
two-fold increase in its burden over the past 25 years (1). Despite the advent of innovative
modalities such as laparoscopic technology and neoadjuvant
chemoradiotherapy, the prognosis for patients remains
unsatisfactory (2). Moreover, the
persisting dearth of molecular and genetic biomarkers guiding
clinical decisions concerning patient management is notable
(3), despite the demonstrated
efficacy of molecular targets such as TP53, CDKN2A and SMAD4 in
investigative pursuits (4). Thus,
the identification of novel prospective biological markers is of
utmost significance.
Tetratricopeptide repeat domain 22 (TTC22), an
integral constituent of the TRP gene family, has predominantly been
implicated to be involved in colon cancer, where its ability to
upregulate WTAP and SNAI1 expression has been shown to facilitate
metastasis (5) or participate in
the miR663a-TTC22V1 axis, suppressing colon cancer metastasis
(6). However, to the best of our
knowledge, the ramifications of TTC22 in other malignancies,
notably pancreatic carcinoma, have remained unexplored.
Alterations in the tumor microenvironment (TME)
exert a profound influence on tumor progression, metastasis and
therapeutic response (7).
Differential gene expression engenders variations in immune
infiltration within tumors, serving as a pivotal mechanism
underlying TME modifications (8).
Consequently, the precise identification of targeted molecules and
the prospective prediction of TME compositions hold great potential
for augmenting the effectiveness of immunotherapeutic interventions
(9). Nevertheless, the precise
implications of TTC22 on immune infiltration within pancreatic
carcinoma and its impact on the development of pancreatic cancer
cells remain unknown.
Accordingly, in the present study, a comprehensive
investigative approach encompassing bioinformatics, single-cell
sequencing and cytological experiments was performed to
authenticate the distinctive expression patterns of TTC22,
ascertain its clinical relevance and unravel its potential
molecular mechanisms in pancreatic carcinoma development.
Specifically, by scrutinizing single cell sequencing data and
mining The Cancer Genome Atlas (TCGA) and Genotype-Tissue
Expression (GTEx) databases, the expression profile, survival
prognosis and putative molecular pathways associated with TTC22 in
pancreatic carcinoma were corroborated. Moreover, employing single
sample Gene Set Enrichment Analysis (ssGSEA) and the ESTIMATE
algorithm, the extent of immune infiltration was validated.
Additionally, in-depth cytological experiments were performed to
further elucidate the ramifications of TTC22 on the carcinogenic
progression of pancreatic adenocarcinoma (PAAD) cells.
Materials and methods
Gene expression analysis
A total of 33 different types of tumor project STAR
process RNAseq data from TCGA database in the transcripts per
million format (https://portal.gdc.cancer.gov, accessed on May 12,
2023) were obtained. The GTEx database contains important
information regarding healthy tissues and cells, and the
information was downloaded. For statistical analysis, the R program
ggplot2 (version 3.3.6, http://ggplot2.tidyverse.org) was used, together with
R software version 4.2.1 (10), car
(version 3.1.0) (11) and stats
(version 4.2.1, https://www.r-project.org/) (10). The Wilcoxon rank-sum test was used
to compare the data from the two groups, and P<0.05 was
considered to indicate a statistically significant difference. In
Table SI, the full tumor names
based on the terms used by TCGA are listed.
TTC22 expression in immune subtypes of
PAAD
TISIDB (http://cis.hku.hk/TISIDB/index.php accessed on 12
April 2023) is a web portal for the analysis of tumor and immune
system interaction, integrating multiple heterogeneous data types.
This database was used to evaluate the correlation of TTC22
expression in the following immune subtypes of PAAD: C1 (wound
healing); C2 (IFN-γ dominant); C3 (inflammatory); C4 (lymphocyte
depleted); C5 (immunologically quiet); C6 (TGF-β dominant).
Single-cell sequencing
Cancer Single-cell Expression Map (https://ngdc.cncb.ac.cn/cancerscem/ accessed on
01 June 2023) was created with the goal of gathering, analyzing and
displaying single-cell RNA-Seq data of human cancers (accessed on
June 1, 2023 at http://ngdc.cncb.ac.cn). To thoroughly examine the
tumor microenvironment of several types of human cancer,
multi-level analyses were performed and a robust online analysis
platform was installed in the database. In database samples, the
t-distributed stochastic neighbor embedding (t-SNE) plot displayed
the TTC22 expression profile of individual cells.
Survival prognosis analysis
The association between TTC22 expression and overall
survival (OS) and disease-specific survival (DSS) of pancreatic
tumors was evaluated using Kaplan-Meier plots. The survival package
(version 3.3.1, http://CRAN.R-project.org/package=survival) was used
to perform fitted survival regression and proportional-hazards
hypothesis testing, and the ggplot2 and survminer (version 3.3.1,
http://CRAN.R-project.org/package=survminer) packages
were used to display the findings. When using the log-rank test,
P<0.05 was considered to indicate a statistically significant
difference.
Clinical significance of TTC22 in
PAAD
For further study of the clinical significance of
TTC22 in PAAD, diagnostic receiver operating characteristic (ROC)
curves, time-dependent area under the curve (AUC), risk score,
calibration, nomogram analysis and forest maps were employed.
Time-dependent AUC-related data were examined using the timeROC
package (version 0.4) (12) and
both findings were shown using ggplot2. The pROC package (version
1.18.0) (13), was used for ROC
analysis of the data, and the data without clinical information
were deleted. Cox regression analysis and proportional hazards
hypothesis testing were performed using the survival package, while
calibration analysis and visualization were performed using the rms
package (version 6.3–0, http://CRAN.R-project.org/package=rms). The nomogram
correlation model was also built and visualized using the rms
package. The ggplot2 package was used to show the forest map and
risk score map.
Pan-cancer microsatellite instability
(MSI) and mutant-allele tumor heterogeneity (MATH) analysis of
TTC22
The UCSC (https://xenabrowser.net/) pan-cancer dataset was
downloaded, which was carefully standardized. The expression data
of the gene ENSG00000006555 (TTC22) were extracted from each sample
and screened based on two sources: Primary Blood Derived
Cancer-Peripheral Blood and Primary Tumor. The MSI scores for each
tumor were obtained from a previous study (14) and integrated with the gene
expression data. Additionally, a log2(x+0.001) transformation was
applied to each expression value. Finally, cancer types with <3
samples were excluded, resulting in gene expression data for 37
cancer types. For MATH analysis, the UCSC (https://xenabrowser.net/) pan-cancer dataset was
downloaded, which was carefully standardized. Additionally, the
level 4 Simple Nucleotide Variation dataset for all TCGA samples,
which was processed by the MuTect2 software (15), was downloaded from GDC (https://portal.gdc.cancer.gov/). Using the
inferHeterogeneity function of the R package maftools (version
2.8.05) (16), the MATH score for
each tumor was calculated. The tumor mutational burden and gene
expression data from the samples were integrated and a
log2(x+0.001) transformation was further applied to each expression
value. Finally, cancer types with <3 samples in a single cancer
type were excluded, resulting in expression data for 37 cancer
types.
Co-expression gene analysis of TTC22
and functional enrichment in PAAD
According to the expression of TTC22, the data of
the relevant molecules were obtained from TCGA in the pancreatic
cancer dataset and split into high and low-expression groups (50%
vs. 50%). The difference between the initial counts matrix was
examined using the DESeq2 (version 1.36.0) (17) and the ggplot2 was used to plot the
volcano plots. The top 5 positively correlated genes and the top 5
negatively correlated genes were identified using a heat map and
chord diagram, along with Spearman's correlation coefficient. The
circlize (version 0.4.1) (18),
package was used to show the chord diagram, and ggplot2 was used to
plot the heat maps. Using the clusterProfiler package (version
4.4.4) (19), Kyoto Encyclopedia of
Genes and Genomes (KEGG) and Gene Ontology (GO) were used for
enrichment analysis, and the GOplot package (version 1.0.2)
(20) was used to obtain the zscore
value corresponding to each enriched element. clusterProfiler was
used for GSEA. ggplot2 was used to display data from KEGG, GO and
GSEA.
Immune checkpoint gene profiling and
immunomodulatory gene analysis
For immune checkpoint gene profiling, the harmonized
pan-cancer dataset was downloaded from UCSC (https://xenabrowser.net/): TCGA TARGET GTEx (PANCAN,
n=19,131, G=60,499), ENSG00000006555 (TTC22) and 60 two-class
immune checkpoint pathway genes (inhibitory for 24 and stimulatory
for 36) were extracted from the literature Immune Landscape of
Cancer (21) marker gene expression
data in each sample, and the sample source was screened for Primary
Solid Tumor, Primary Tumor, Primary Blood-Derived Cancer-Bone
Marrow, and Primary Blood-Derived Cancer-Peripheral. log2(x+0.001)
transformation was applied to each expression value, and then the
Pearson's correlation coefficient was calculated between
ENSG00000006555 (TTC22) and the marker genes of five immune
pathways. For immunomodulatory gene analysis, in step one, the
harmonized pan-cancer dataset was downloaded from the UCSC
(https://xenabrowser.net/) database, which was
carefully standardized. Furthermore, ENSG00000006555 (TTC22) and
150 immune pathways (including 41 chemokines, 18 receptors, 21
major histocompatibility complex, 24 immune inhibitors and 46
immune stimulators) expression data of marker genes in each sample
were further extracted from step one. Furthermore, the sample
sources were screened as follows: Primary Solid Tumor, Primary
Tumor, Primary Blood-Derived Cancer-Bone Marrow and Primary
Blood-Derived Cancer-Peripheral. log2(x+0.001) transformation was
applied to each expression value. The Pearson's correlation was
then calculated between ENSG00000006555 (TTC22) and the marker
genes of five immune pathways.
Immune infiltration analysis
The expression levels of TTC22 in pancreatic cancer
stroma and immune scores were calculated using the R package,
estimate (version 1.0.13, http://R-Forge.R-project.org/projects/estimate/)
On the basis of the ssGSEA algorithm provided in the R package-GSVA
(version 1.46.0) (22), 24
immune-cell markers (23) were
annotated to determine specifics of immune infiltrates. Spearman's
correlation analysis was used to assess the correlation between the
expression levels of TTC22 and immune cell infiltration.
Differences in the degree of immune cell infiltration between the
high- and low-expression groups were assessed using a Wilcoxon's
rank-sum test. The results were visualized using ggplot2.
Cell lines and cell culture
The Jiangsu University School of Medicine's
Institute of Basic Medicine and the Central Laboratory of the
Affiliated Hospital of Jiangsu University both provided and
maintained the pancreatic cancer cell lines PaTu8988, MIA PACA2 and
PANC-1. Cells were maintained in a humidified incubator at 37°C
supplied with 5% CO2. Cells were cultured in DMEM
(HyClone; Cytiva) supplemented with 10% FBS and 100 mg/ml
penicillin (both from Beyotime Institute of Biotechnology).
Reverse transcription-quantitative
PCR
TRIzol® (Invitrogen; Thermo Fisher
Scientific, Inc.) was used to extract total RNA(from pancreatic
cancer cell lines including PANC-1, MIA PACa2 and PaTu8988 cells).
RevertAid first-strand cDNA Synthesis Kit was used for reverse
transcription according to the manufacturer's protocol (Thermo
Fisher Scientific, Inc.). iQ SYBR Premix Ex Taq Perfect Real Time
(Bio-Rad Laboratories, Inc.) and SYBR MasterMix were used for qPCR.
β-actin was used as the housekeeping gene. The sequences of the
primers were as follows: TTC22 forward, 5′-ATCCACATCAGAGCCTACCTG-3′
and reverse, 5′-CGTCCACGCCCATATAGTAGT-3′; and β-actin forward, 5′-
CACGAAACTACCTTCAACTCC-3′, and reverse, 5′- CATACTCCTGCTTGCTGATC-3′.
The sequences of the primers used for the amplification of
epithelial-mesenchymal transition (EMT)-related molecules are
listed in Table SII. The
thermocycling conditions samples for qPCR were: Initial
denaturation at 95°C for 3 min, followed by 40 cycles of 20 sec,
56°C for 20 sec and 72°C for 30 sec. The relative expression of
genes was calculated using the comparative Cq method
(ΔΔCq) and the fold enrichment was determined as
follows: 2−[ΔCq(sample)−ΔCq(calibrator)] (24).
Knockdown of gene expression using
siRNAs
In the present study, three siRNA constructs
targeting TTC22 were obtained from Shanghai GenePharma, Co., Ltd.
The specific sequences of the siRNAs are shown in Table SIII. The PANC-1 and PaTu8988 cell
lines were used for siRNA transfection. The cell medium was
replaced with DMEM without FBS in a cell ultra-clean table, and 100
µl DMEM was added to each of the two sterile Eppendorf (EP) tubes.
In one EP tube, 5 µl each of the three siRNAs, and in the other EP
tube, 5 µl Lipofectamine® 2000 reagent, was added,
gently shaken to fully mix and left for 5 min. The solutions in the
two EP tubes were mixed and allowed to stand for 25 min after
thorough mixing. The mixture was slowly dropped into the cell
culture medium, and the six-well plate was gently shaken to ensure
all the solutions were fully mixed. The original medium was
discarded and replaced with supplemented DMEM 6 h after incubation
with the transfection mix. After a further 48 h, the efficiency of
knockdown in the PANC-1 and PaTu8988cells was verified by qPCR.
Subsequent experiments were performed 72 h post-transfection.
Wound healing assays
A total of 1.25×10⁵ transfected PaTu8988
and PANC-1 cells/well were seeded for 24 h and cultured with DMEM
(HyClone; Cytiva) only. Subsequently, a wound was created by
scratching the monolayer of cells using a 10-µl plastic tip,
nonadherent cells were washed away by PBS. With 0 h as the starting
time point, 18 h later, the wound was imaged using a brightfield
microscope (×10 magnification) connected to a digital camera. The
wound healing rate (%) was calculated as follows: 100 × [(wound
width at 0 h-width at 20 h)/width at 0 h]. All experiments were
repeated three times.
Transwell migration and invasion
assay
According to the manufacturer's instructions,
Transwell assays were performed using a Transwell insert (Corning
Inc.; 8-µm pores). PaTu8988 and PANC-1 cells were collected,
resuspended in serum-free media, and then added to the upper
chamber of the inserts (1×10⁵ cells/well). In the lower
chamber, supplemented media (10% FBS) and the cells were cultured
for 24 h at 37°C). Subsequently, the upper layer of cells was
scraped off, and the cells that had migrated to the lower layer
were fixed in 500 µl 4% paraformaldehyde for 20 min at 26°C and
stained with 0.05% crystal violet for 30 min at 26°C. The mean
number of cells per field was calculated across five independent
fields of view. For the invasion assay, Transwell inserts were
pre-coated with Matrigel (BD Biosciences, Inc.), in serum-free
media to assess cell invasion at 37°C for 24 h. The number of cells
that had invaded were counted in four fields of view (×10
magnification; brightfield microscopy). All experiments were
repeated at least three times.
Colony formation assay
Cells were resuspended in media, transferred to
6-well plates (500 cells/well) and cultured for 10–14 days until
colonies were visible at 37°C. To count the number of colonies,
cells were fixed in 4% paraformaldehyde for 15 min and stained with
0.05% crystal violet for 30 min at room temperature. When a single
cell proliferates in vitro for more than six passages, the
population of cells composed of its progeny is considered a clonal
colony. Clusters of cells consisting of ≥50 cells ranging in size
from 0.3–1.0 mm were considered colonies. The number of colonies
was counted.
Statistical analysis
All data are presented as the mean ± standard
deviation of at least three independent experiments. Two
independent groups were analyzed with unpaired Student's t-test.
And a one-way ANOVA and Bonferroni's post hoc test was used for
comparisons between multiple groups. Kaplan-Meier survival analysis
with a log-rank test was used for survival analysis. P<0.05 was
considered to indicate a statistically significant difference.
Results
Differential expression of TTC22 in
pan-cancer and pancreatic cancer
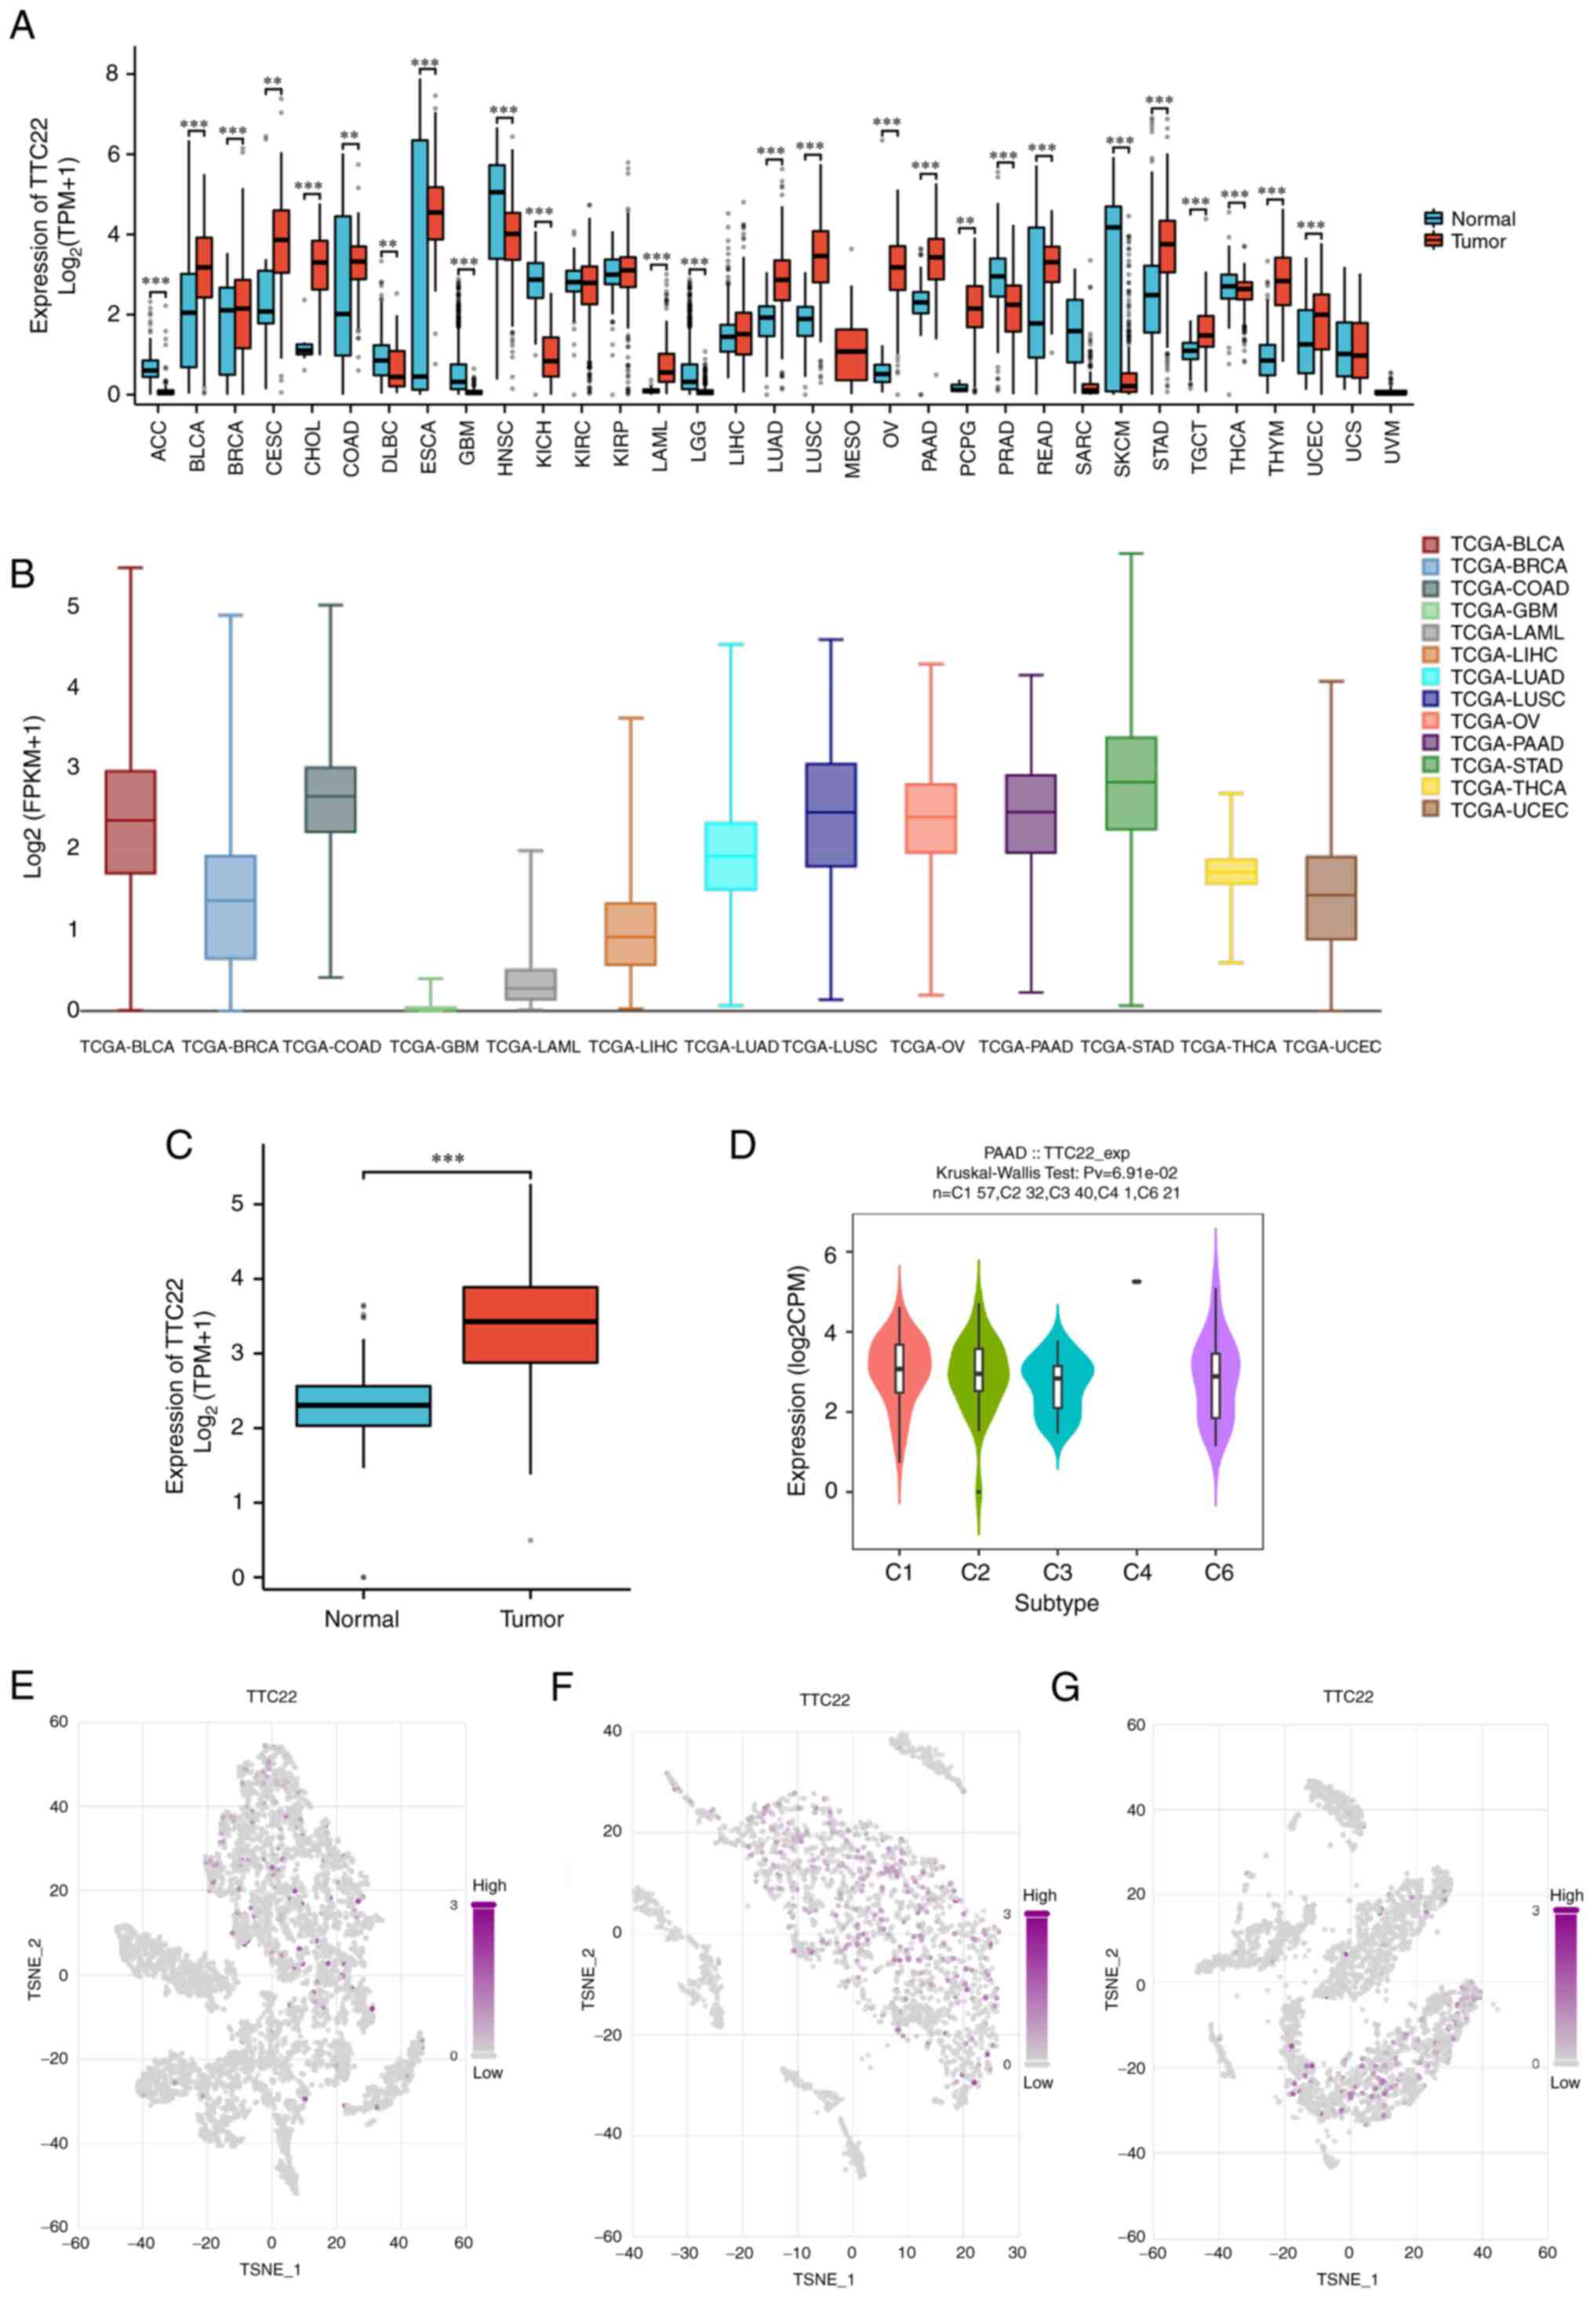
The relative expression levels of TTC22 in
pan-cancer tissues and adjacent normal tissues were assessed, which
suggested that TTC22 was differentially expressed in 33 tumors,
among which TTC22 was highly expressed in cervical squamous cell
carcinoma and endocervical adenocarcinoma (CESC), PAAD, ovarian
serous cystadenocarcinoma (OV) and stomach adenocarcinoma (STAD),
as well as other tumors (Fig. 1A).
Further comparison of TTC22 expression between tumors in single
cell public database, Cancer Single-cell Expression Map showed that
it was highly expressed in PAAD, OV, STAD and bladder urothelial
carcinoma amongst other tumors (Fig.
1B). It was further found that TTC22 expression was
significantly higher in pancreatic cancer samples than in normal
tissues in TCGA (Fig. 1C). The
TISIDB database suggested that TTC22 was highly expressed in
different immune subtypes of pancreatic cancer (Fig. 1D). The t-SNE plots also showed the
TTC22 pancreatic cancer expression profile was high at the
single-cell level and three representative single-cell sequencing
results from the single cell public database, Cancer Single-cell
Expression Map, were selected (Fig.
1E-G).
Prognostic and clinical significance
of TTC22 in pancreatic cancer
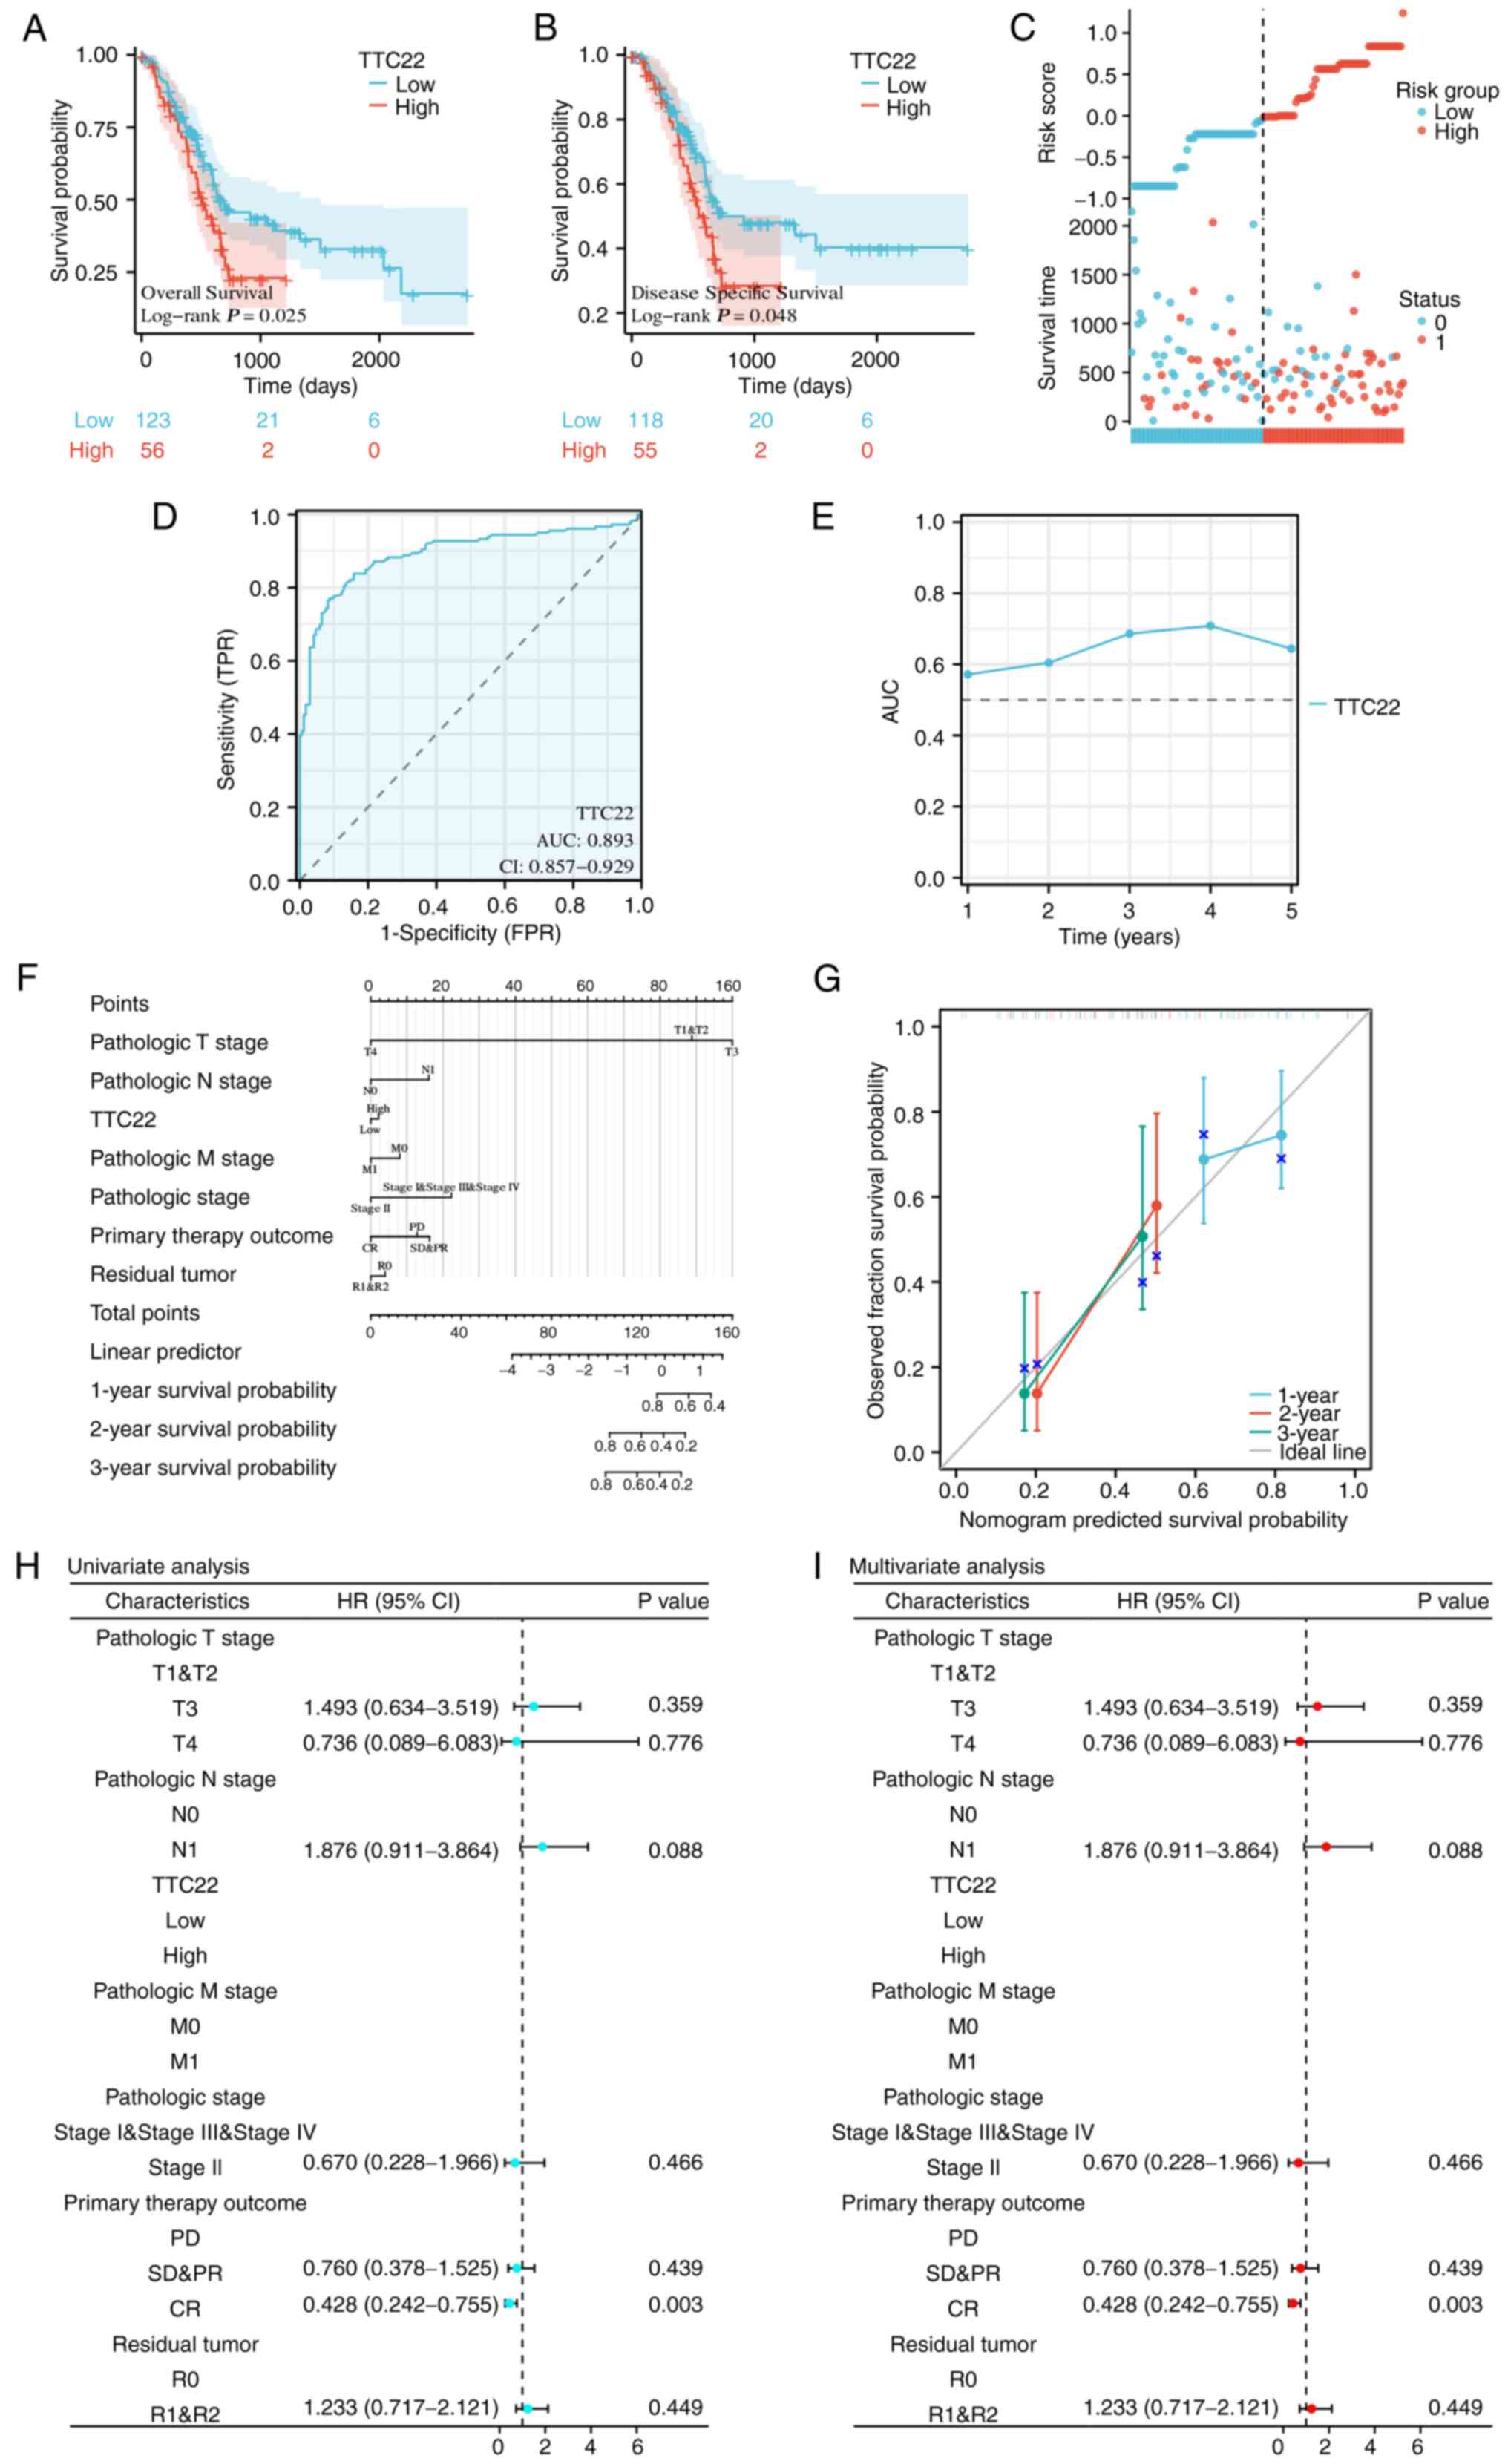
The effect of TTC22 on pancreatic cancer prognosis
was assessed using Kaplan-Meier curves, which showed that low TTC22
expression was associated with a better prognosis, while high TTC22
expression was associated with a poor prognosis regarding both OS
and DSS (Fig. 2A and B). The risk
score plot further demonstrated that high TTC22 expression was
associated with a poor prognosis in patients with pancreatic cancer
(Fig. 2C). In addition, the ROC
curve showed that TTC22 expression had good predictive ability in
distinguishing patients with pancreatic cancer, with an area under
the curve AUC value of 0.893 (95% CI, 0.857–0.929; Fig. 2D). Furthermore, the time-dependent
AUC curve suggested that TTC22 expression had good predictive
ability for prognostic efficacy from 1–5 years, among which, the
best prognostic efficacy was predicted at 3 and 4 years (Fig. 2E). Calibration analysis was used to
predict the relationship between TTC22 expression and the 1, 2 and
3-year prognosis in patients with pancreatic cancer to better
determine the clinical significance of TTC22 in pancreatic cancer.
The survival rate was consistent with the predicted results of the
model, and at the same time, TTC22 was used as one of the
independent OS factors to construct a prognostic calibration curve
for predicting the prognosis of patients with pancreatic cancer
(Fig. 2F and G). Finally,
univariate and multivariate Cox regression analyses were used to
identify the prognostic factors. Univariate prognostic analysis
showed that TTC22 expression was significantly associated with
tumor complete response (CR) (HR, 0.428; 95% CI, 0.242–0.755;
P=0.003). On multivariate analysis, TTC22 expression was also
significantly associated with CR stage (HR, 0.428; 95% CI,
0.242–0.755; P=0.003; Fig.
2H-I).
MATH and MSI analysis of TTC22
pan-cancer
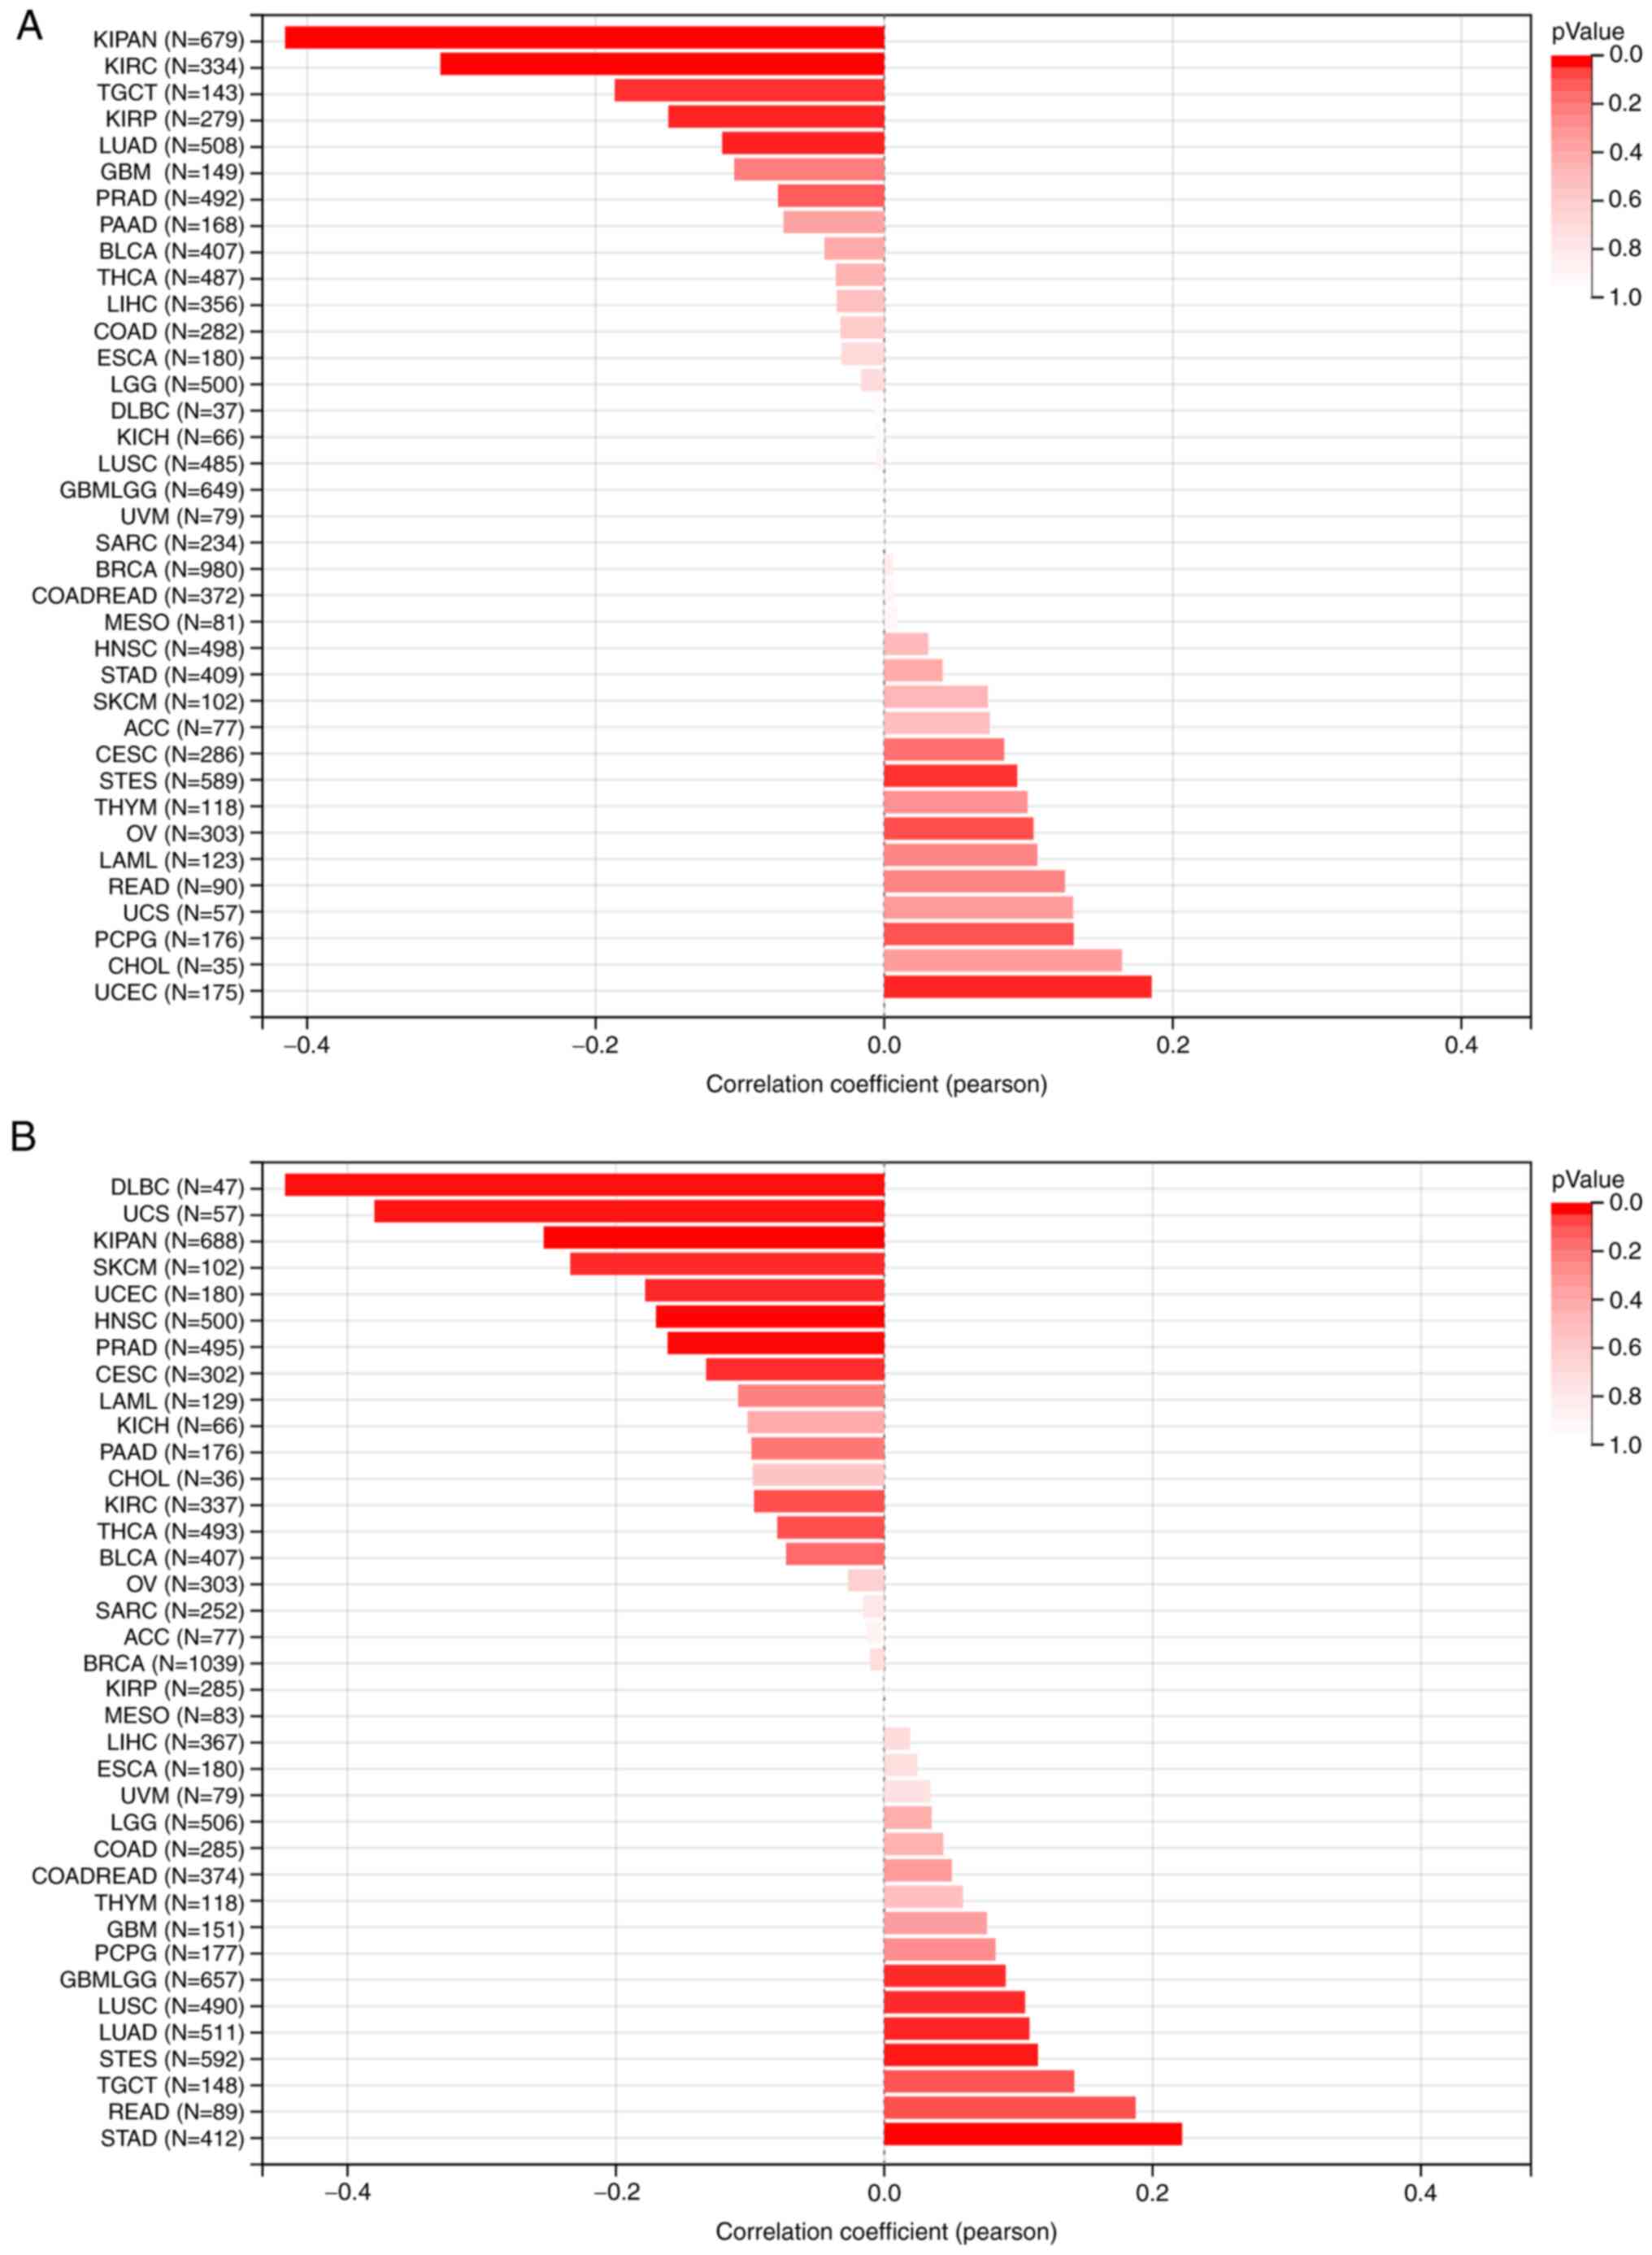
For the MATH analysis, the Pearson correlation
coefficient in each type of tumor was calculated, and significant
correlations were observed in seven tumors, including significant
positive correlations in two types of tumors: Stomach and
esophageal carcinoma (STES) (n=589, R=0.092, P=0.025) and uterine
corpus endometrial carcinoma (UCEC) (n=175; R=0.185, P=0.014). Lung
adenocarcinoma (LUAD) (n=508; R=−0.112, P=0.011), kidney renal
papillary cell carcinoma (KIRP) (n=279; R=−0.149, P=0.012),
pan-kidney cohort [kidney chromophobe + kidney renal clear cell
carcinoma (KIRC) + kidney renal papillary cell carcinoma (KIRP)]
(KIPAN) (n=679; R=−0.415, P<0.01), KIRC (n=334, R=−0.307,
P<0.01) and testicular germ cell tumors (n=143, R=−0186,
P=0.025) exhibited significant negative correlations with TTC22
(Fig. 3A). For MSI analysis, the
Pearson correlation coefficient in each tumor was calculated, and
significant correlations were observed in 13 tumors, including
significant positive correlations in 5 tumors: Glioma (n=657,
R=0.091, P=0.020), LUAD (n=511, R=0.108, P=0.014), STES (n=592,
R=0.114, P=0.005), STAD (n=412, R=0.222, P<0.01) and lung
squamous cell carcinoma (n=490, R=0.105, P=0.02). Negative
correlations with TTC22 were found in CESC (n=302, R=−0.132,
P=0.021), KIPAN (n=688, R=−0.254, P<0.01), prostate
adenocarcinoma (n=495, R=−0.132, P=0.021), UCEC (n=180, R=−0.178,
P=0.016), head and neck squamous cell carcinoma (n=500, R=−0.17,
P<0.01), skin cutaneous melanoma (n=102, R=−0.234, P=0.017),
uterine carcinosarcoma (n=57, R=0.379, P<0.01) and lymphoid
neoplasm diffuse large B-cell lymphoma (n=47, R=−0.446, P=0.001)
(Fig. 3B).
Analysis of differentially expressed
genes (DEGs) related to TTC22 and functional enrichment in
PAAD
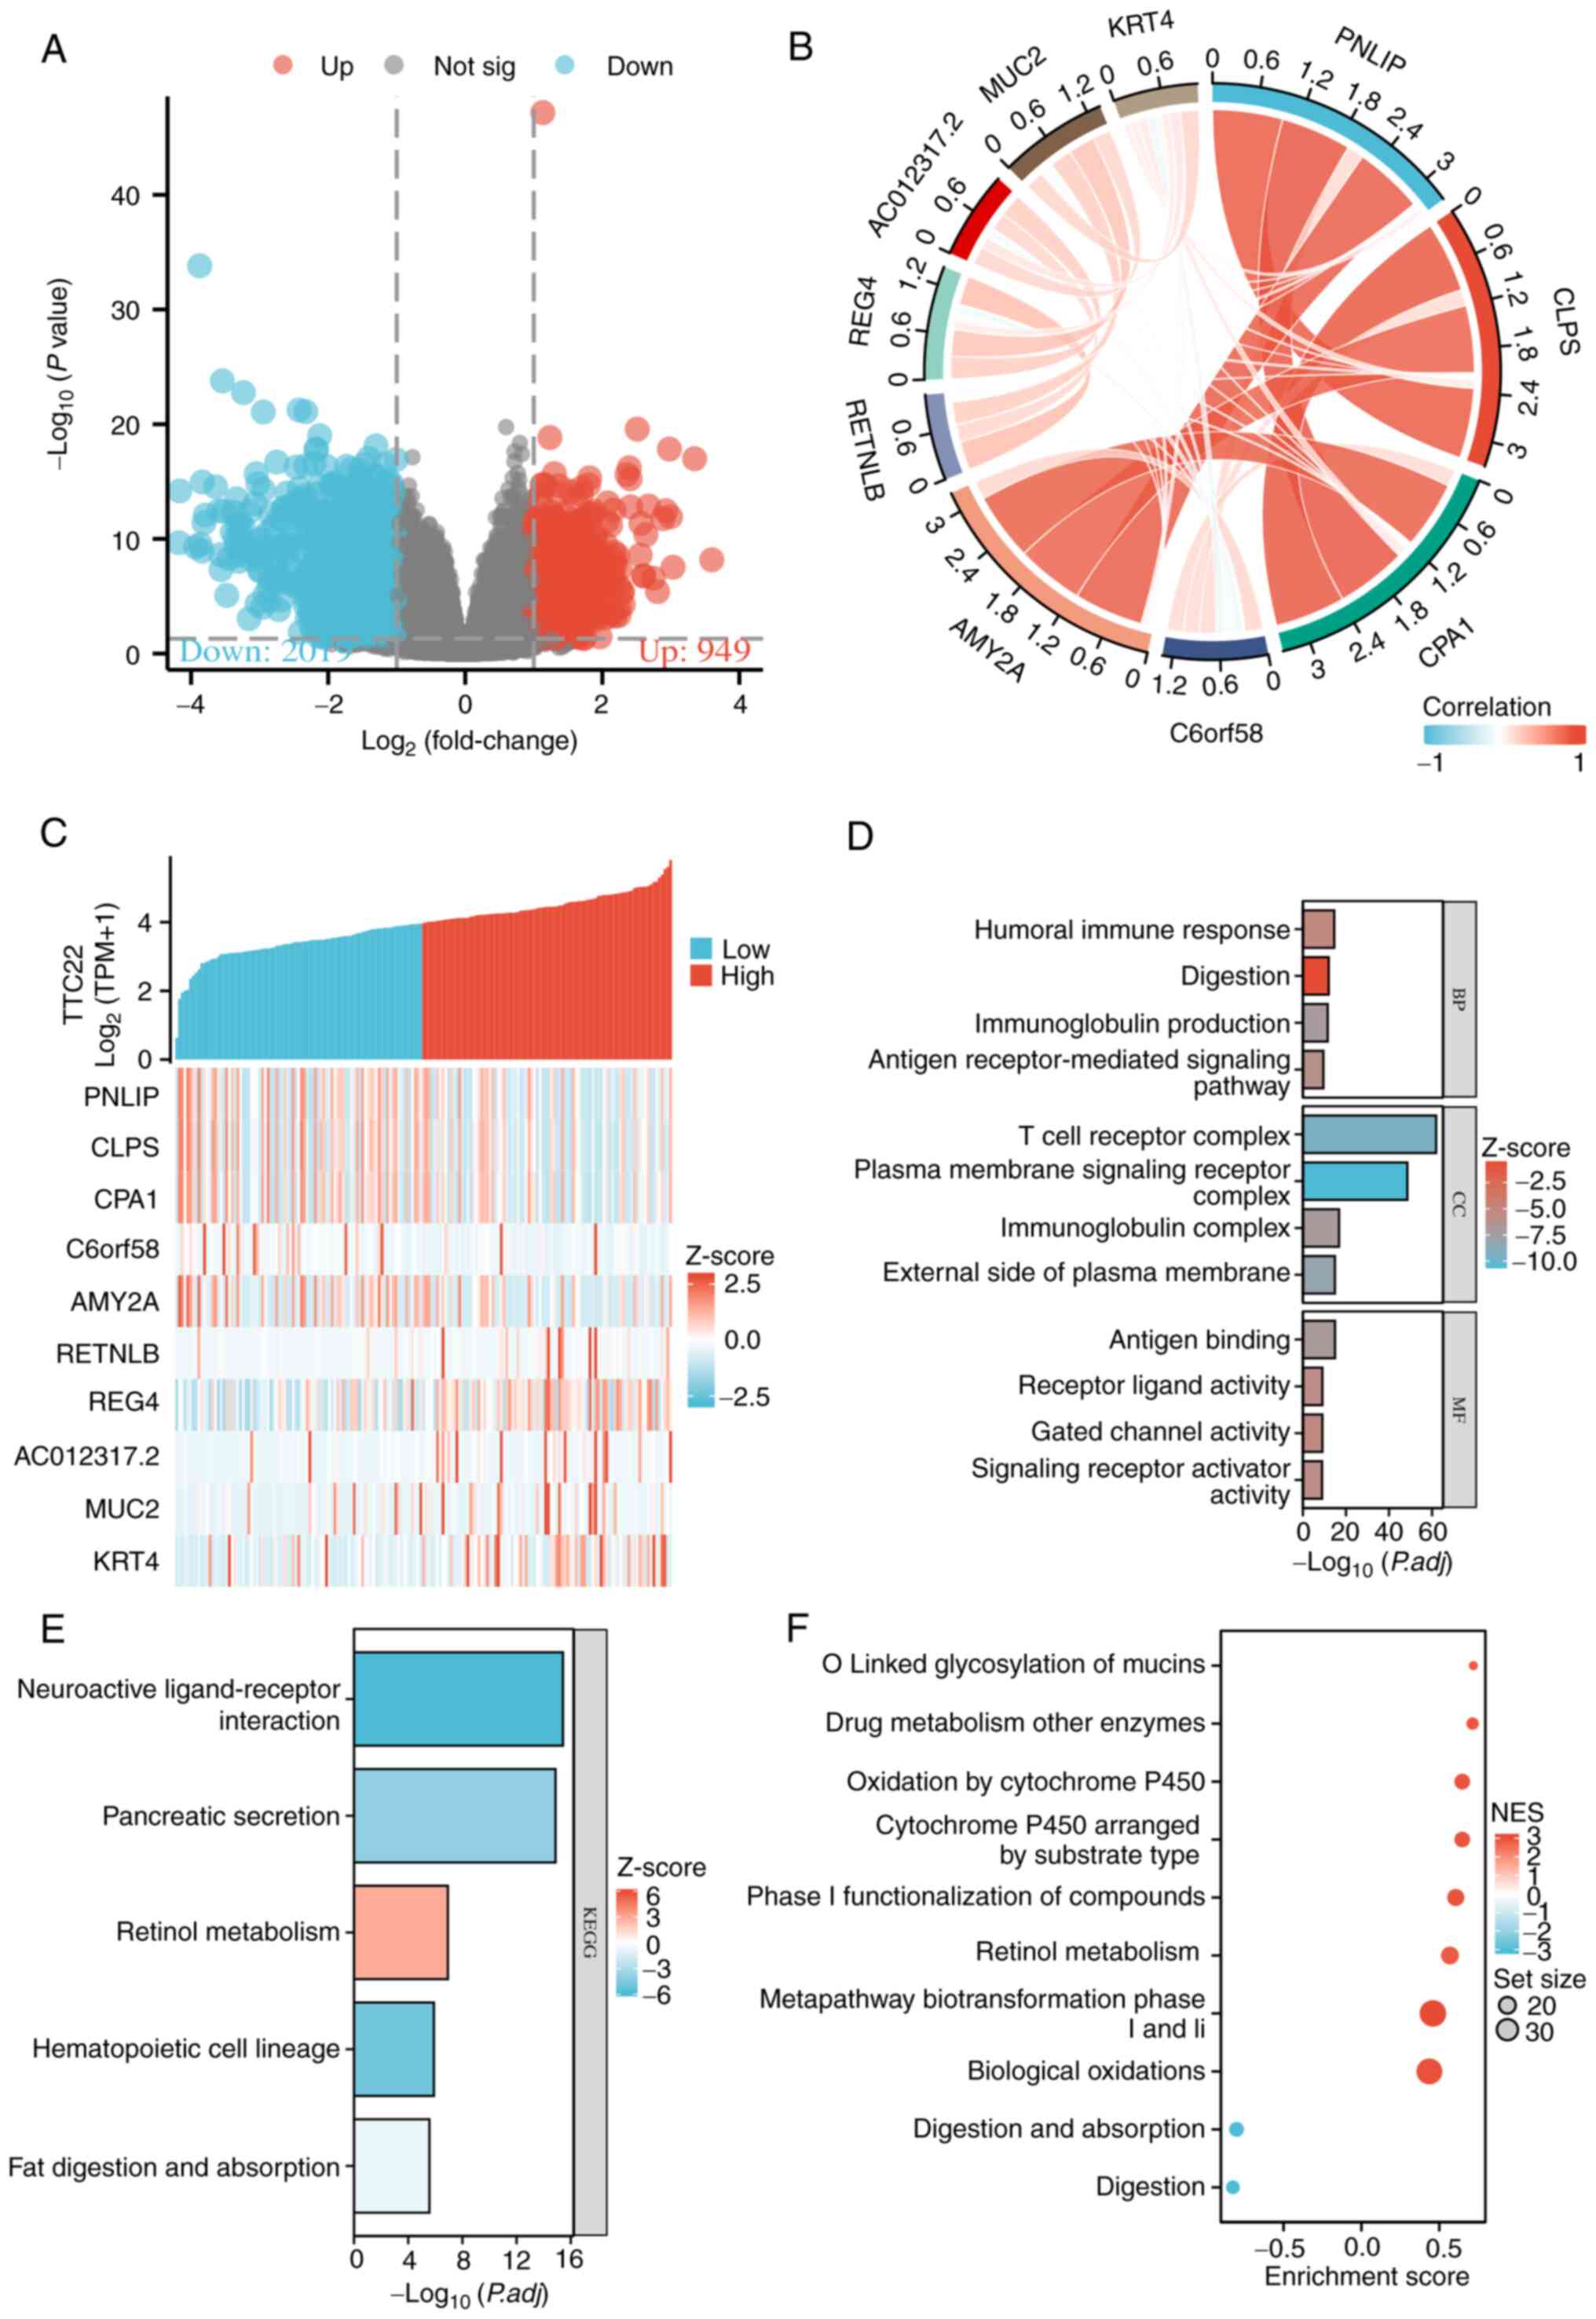
Dseq2 was used to analyze the DEGs associated with
TTC22 in PAAD. The results showed that there were 2,118
differentially expressed genes between the TTC22 high-expression
group and the TTC22 low-expression group, including 949 upregulated
genes and 2,019 downregulated genes [P<0.05; |Log2-FC|>1;
Fig. 4A). The relationship between
the top 5 highly expressed DEGs and the top 5 low expression DEGs
(including downregulated PNLIP, CLPS, CPA1, C6orf58 and AMY2A, and
upregulated RETNLB, REG4, AC012317.2, MUC2, KRT4) is shown in
Fig. 4B and C. Furthermore, KEGG,
GO and GSEA were used to explore the functional enrichment. In the
GO enrichment, the terms were primarily enriched in ‘humoral immune
response’, ‘digestion’, ‘immunoglobulin production’, ‘antigen
receptor-mediated signaling pathway’, ‘T cell receptor complex’,
‘plasma membrane signaling receptor complex’, ‘immunoglobulin
complex’, ‘external side of plasma membrane’, ‘antigen binding’,
‘receptor ligand activity’, ‘gated channel activity’ and ‘signaling
receptor activator activity’. For KEGG, the primarily enriched
terms were ‘neuroactive ligand-receptor interaction’, ‘pancreatic
secretion’, ‘retinol metabolism’, ‘hematopoietic cell lineage’, and
‘fat digestion and absorption’. For GSEA, the primarily enriched
terms were ‘o-linked glycosylation of mucins’, ‘drug metabolism
other enzymes’, ‘oxidation by cytochrome p450’, ‘cytochrome p450
arranged by substrate type’, ‘phase i functionalization of
compounds’, ‘retinol metabolism’, ‘metapathway biotransformation
phase I and II’, ‘biological oxidations’, ‘digestion and
absorption’, and ‘digestion’ (Fig.
4D-F). These results showed that TTC22 was associated with
immunoinfiltration and EMT in pancreatic cancer.
Correlation between TTC22 expression
levels and immune checkpoint genes and immune-related genes
pan-cancer
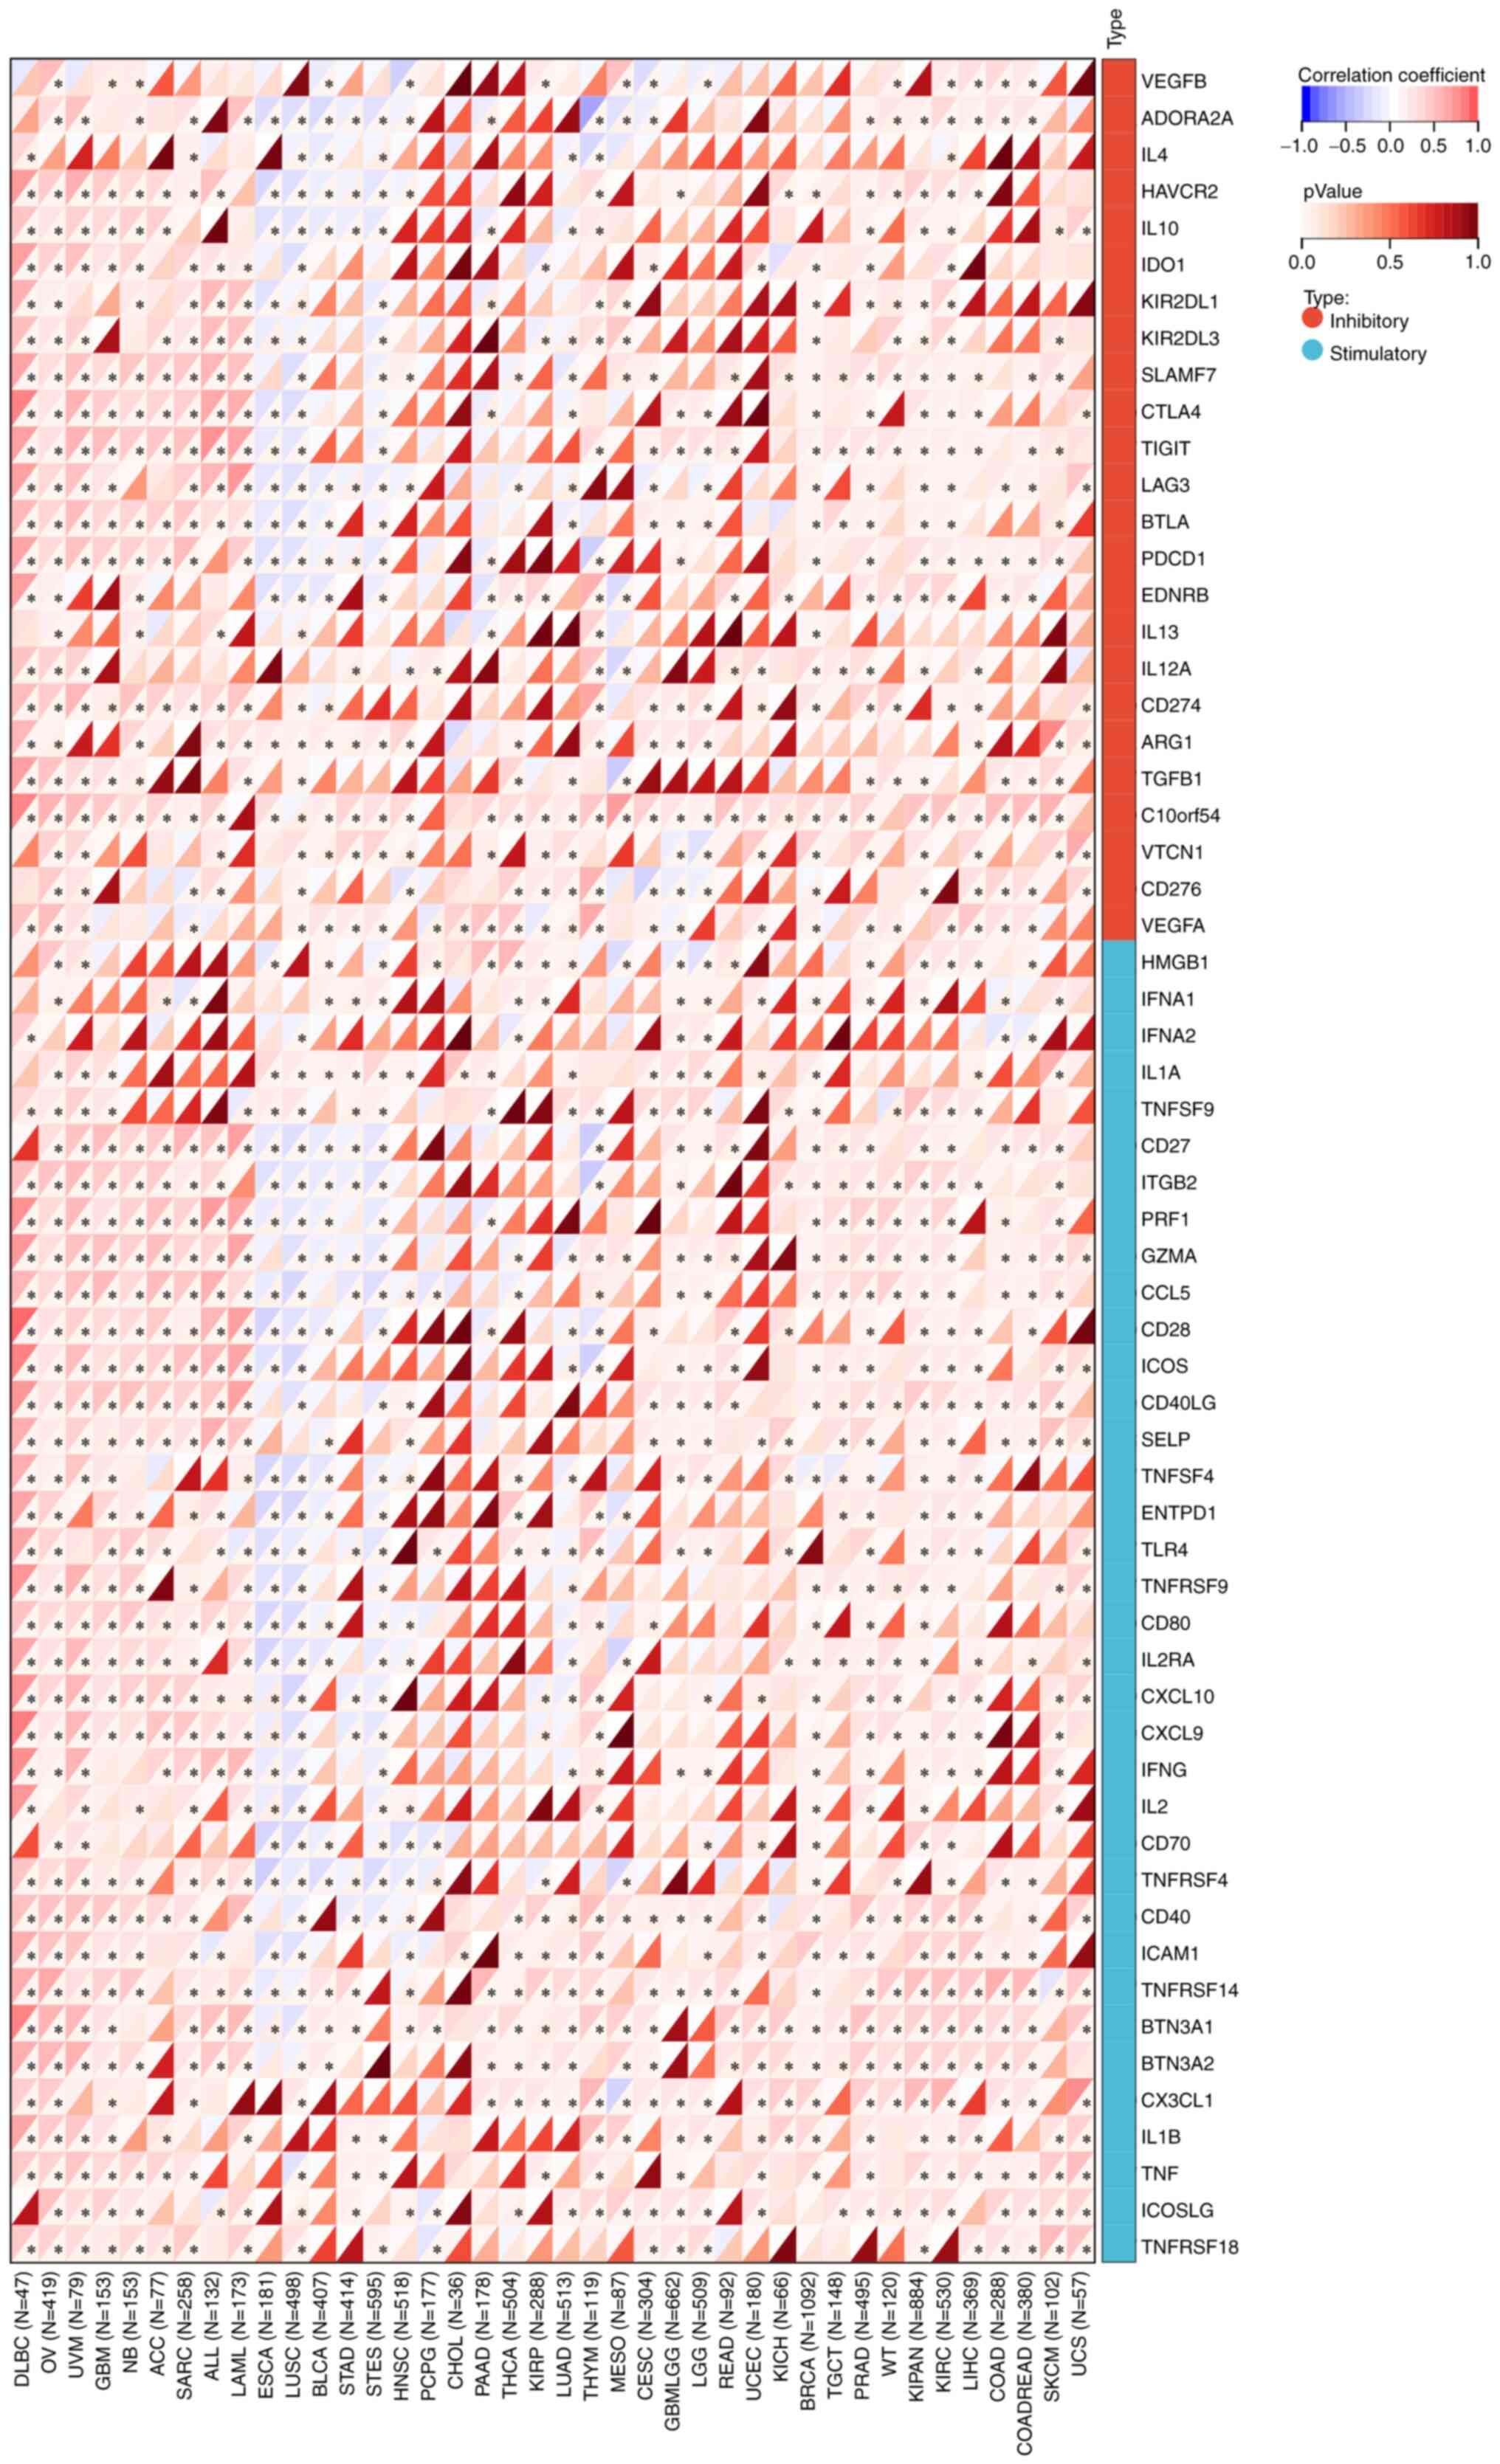
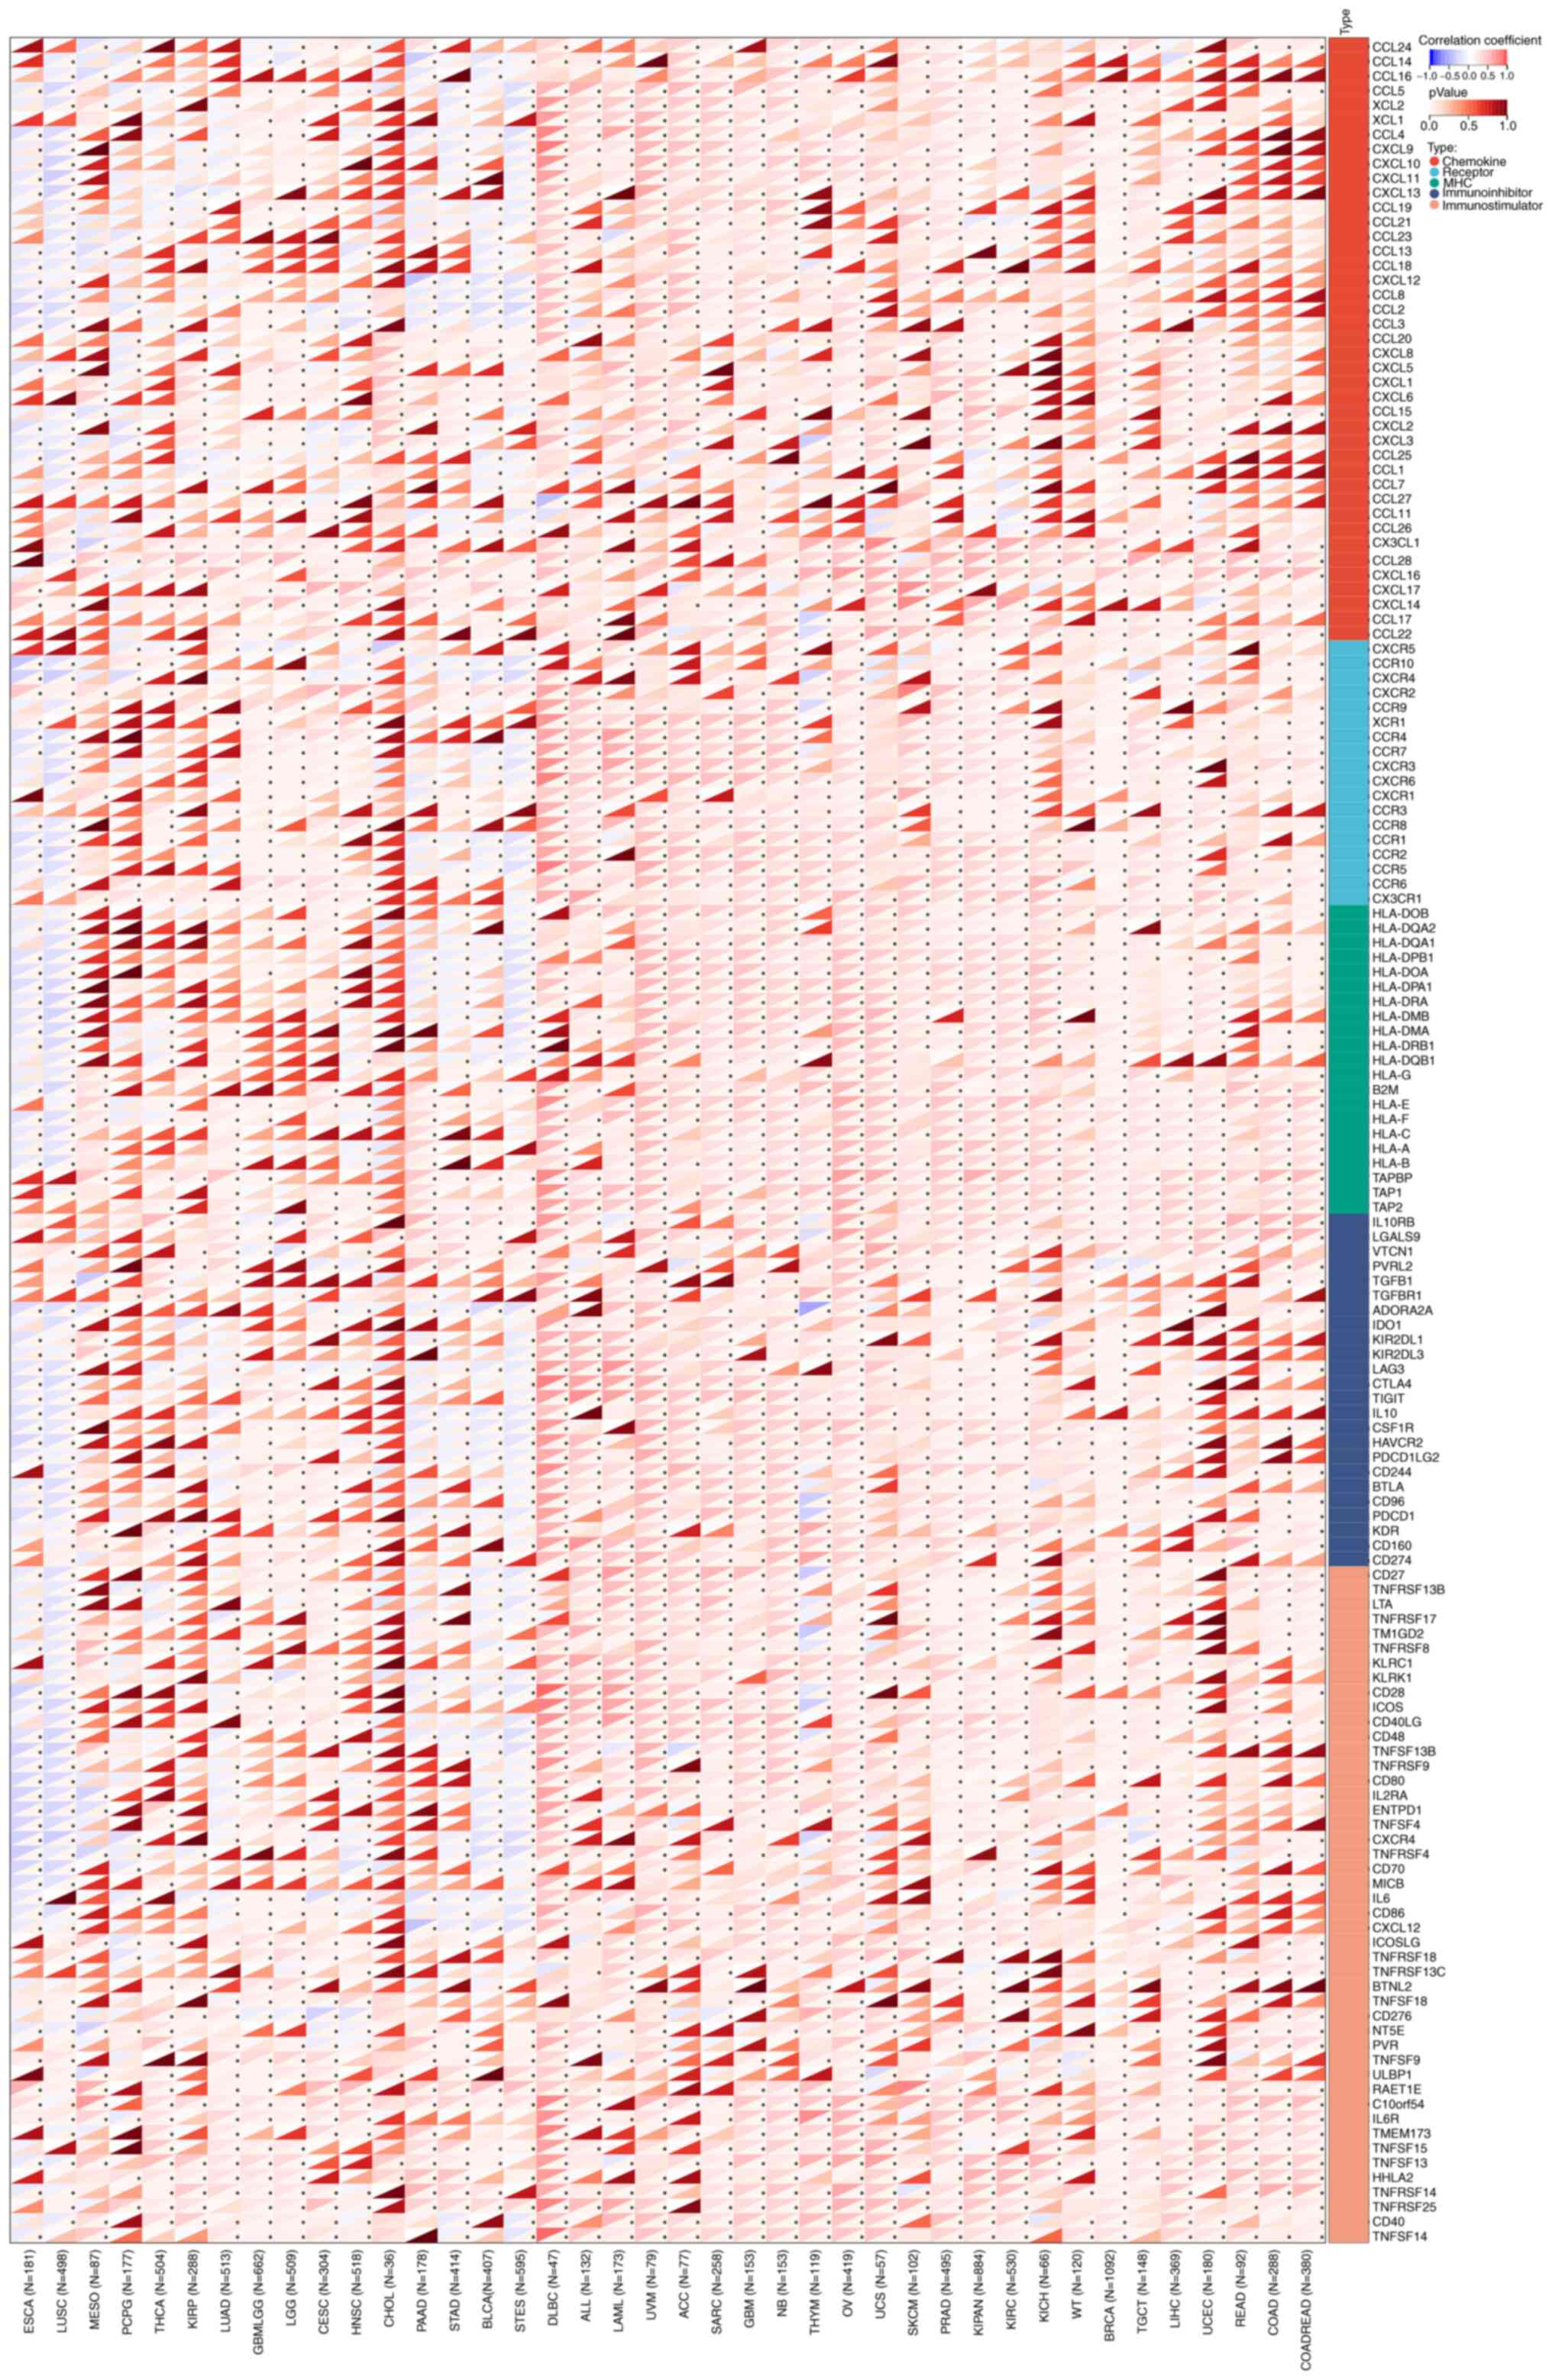
As shown in Figs. 5A
and 6A, it was suggested that TTC22
was positively correlated with most immunomodulatory genes in the
pan-cancer analysis. Similarly, TTC22 was positively correlated
with the majority of the immune checkpoint genes in the pan-cancer
analysis. In pancreatic cancer, the trend was not consistent with
the majority of tumors; however, ~50% of immune-related genes and
immune checkpoint genes were negatively correlated with the
expression of TTC22 (Figs. 5A and
6A).
Correlation between TTC22 expression
levels and immune infiltration
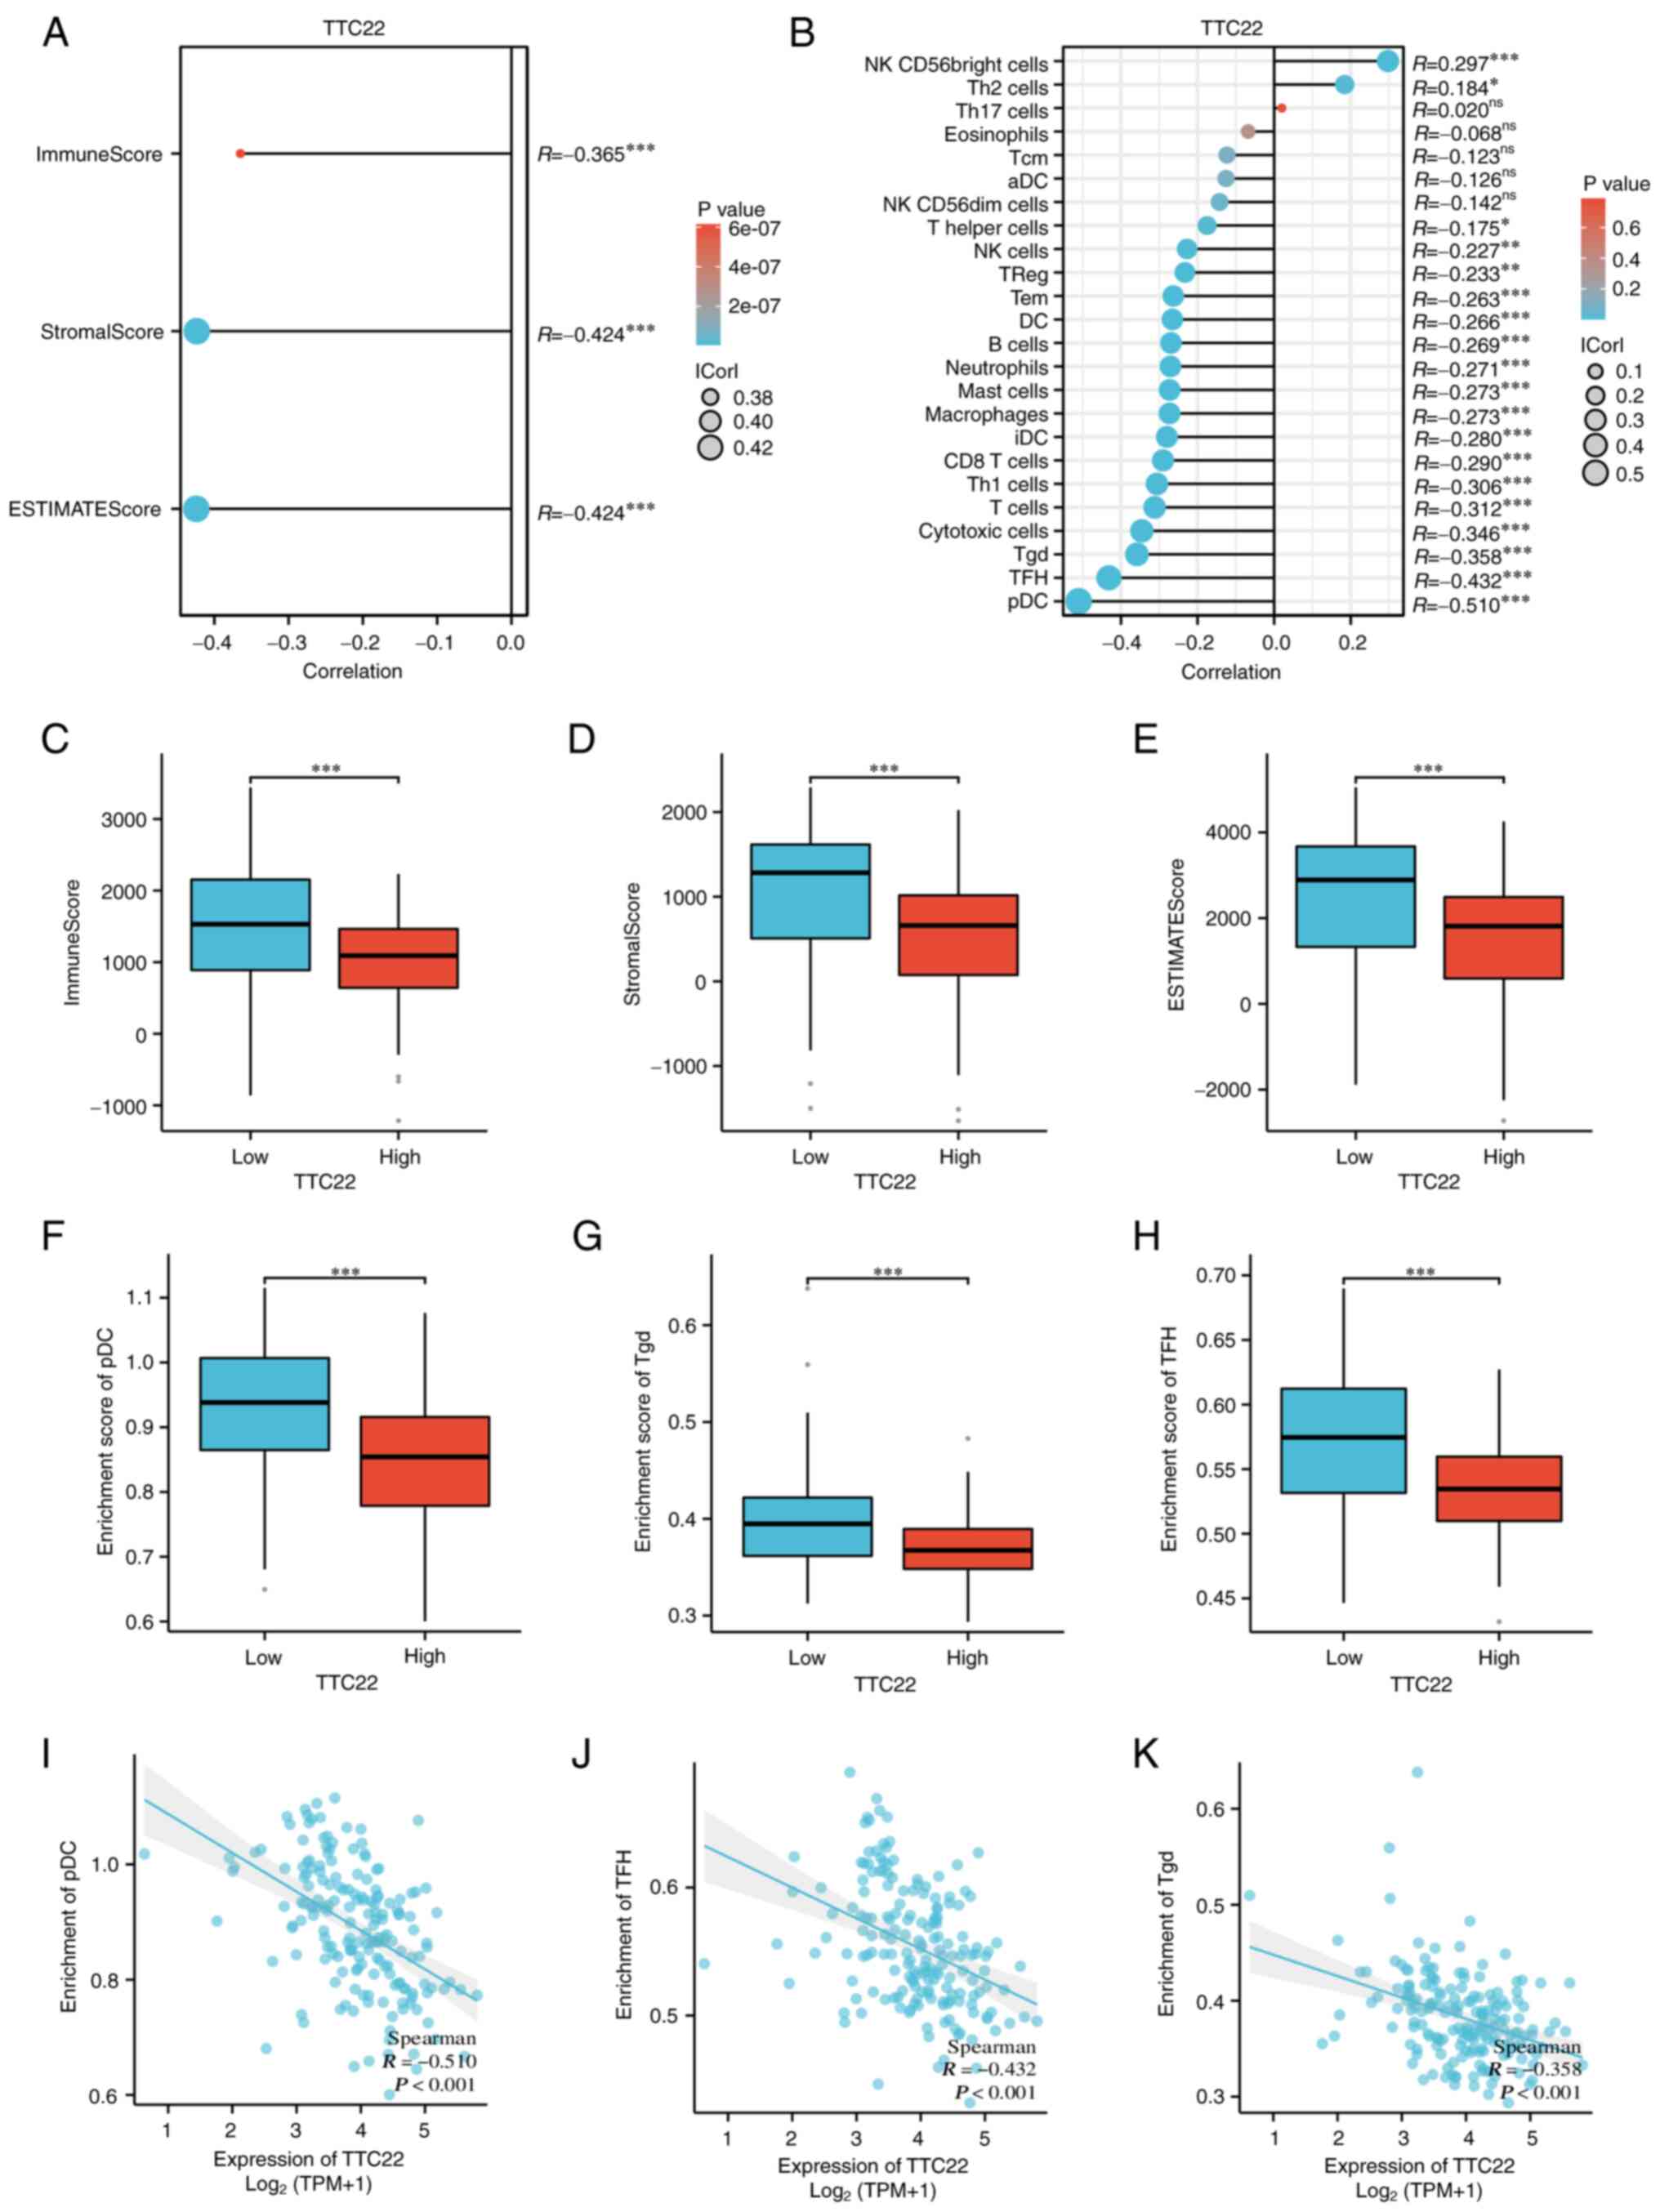
Spearman's correlation using the ESTIMATE algorithm
showed that the expression of TTC22 was negatively correlated with
ImmuneScore (R=−0.365), StromalScore (R=−0.424), and ESTIMATEScore
(R=−0.424) (Fig. 7A), and this was
also observed using box plots (Fig.
7C-E). The relationship between TTC22 expression and 24 types
of immune cells in PAAD was assessed, and it was mainly negatively
associated with plasmacytoid dendritic cells (pDCs), follicular
helper T cells (TFH cells) and T γδ (Tgd) cells, which were the top
three immune cells (Fig. 7B). The
correlation coefficients of TTC22 enrichment with three immune
cells were as follows: pDCs (R=−0.510, P<0.001), TFH cells
(R=−0.432, P<0.001), and Tgd cells (R=−0.358, P<0.001)
(Fig. 7I-K); the enrichment scores
exhibited the same trend as the correlation coefficients (Fig. 7F-H). In addition, by analyzing the
10 Hub-genes co-expressed with TTC22, it was found that C6orf58 was
negatively correlated with TTC22 (Fig.
S1A), while the immune infiltration analysis of C6orf58
suggested that it was positively correlated with pDC immune
infiltration (Fig. S1B). The
negative correlation between TTC22 and pDC immune infiltration may
thus be related to the role of a TTC22-C6orf58 axis.
Relative expression of TTC22 in PAAD
cell lines
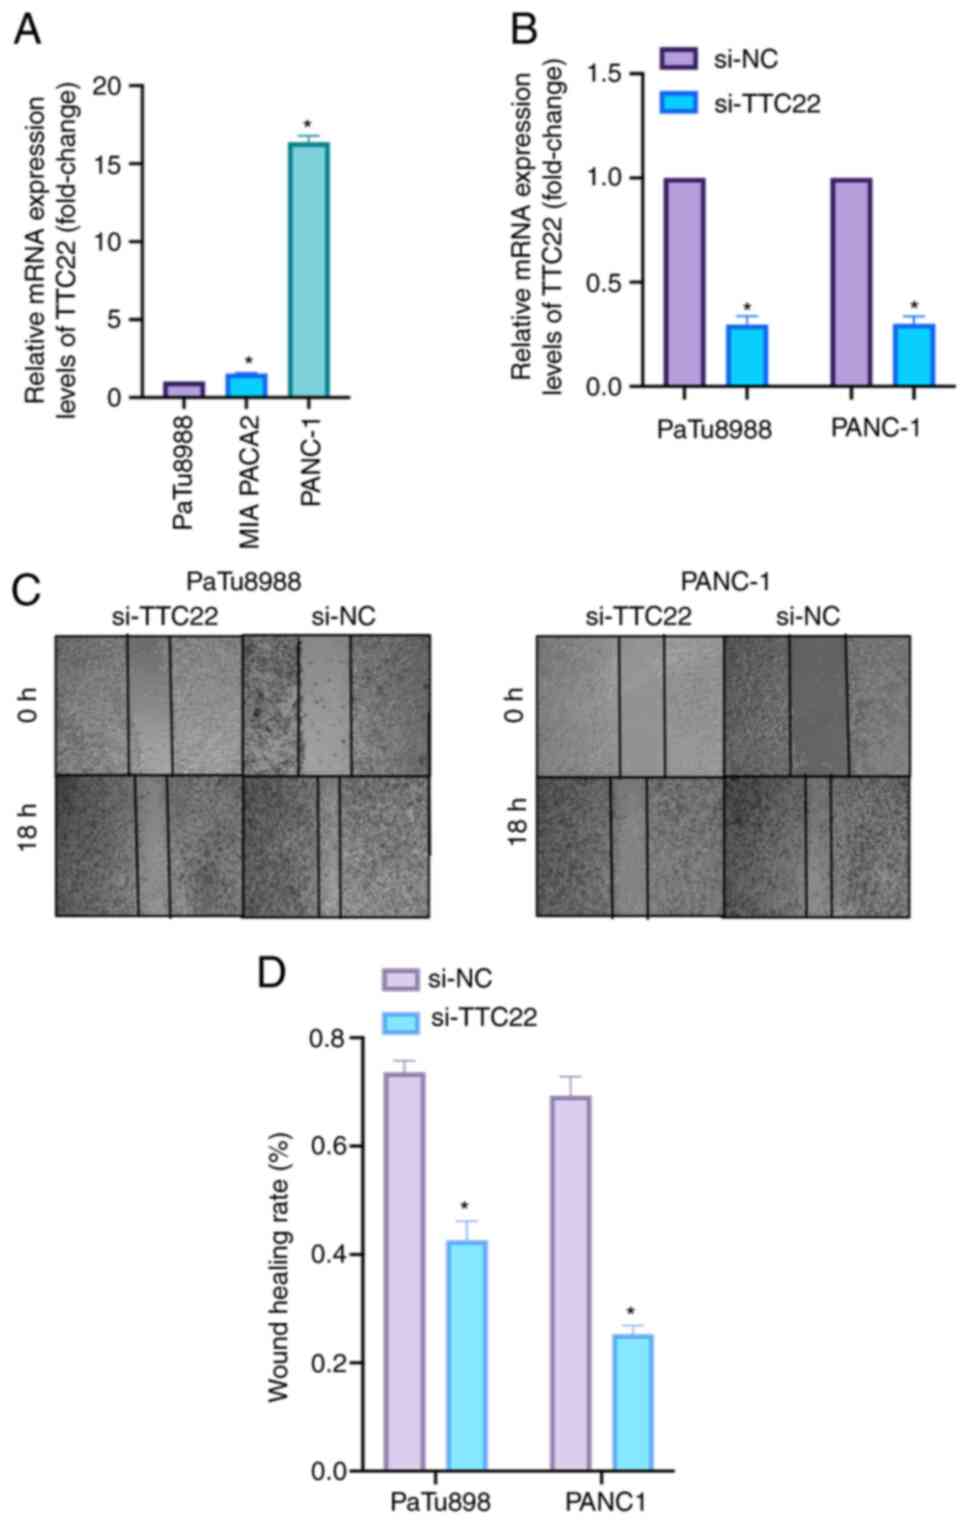
TTC22 was found to be differentially expressed in
pancreatic cancer cell lines by RT-qPCR, with the highest
expression levels in PANC-1 cells, the second highest in MIA PACa2
cells and the lowest in PaTu8988 cells (Fig. 8A). Based on the expression levels of
TTC22 in the three pancreatic cancer cell lines, PaTu8988 and
PANC-1 were selected as cell lines for further experiments. The
effectiveness of si-TTC22 (including siTTC22 1, 2 and 3), which was
used to knock down TTC22 expression in PaTu8988 and PANC-1 cell
lines, is shown in Fig. 8B.
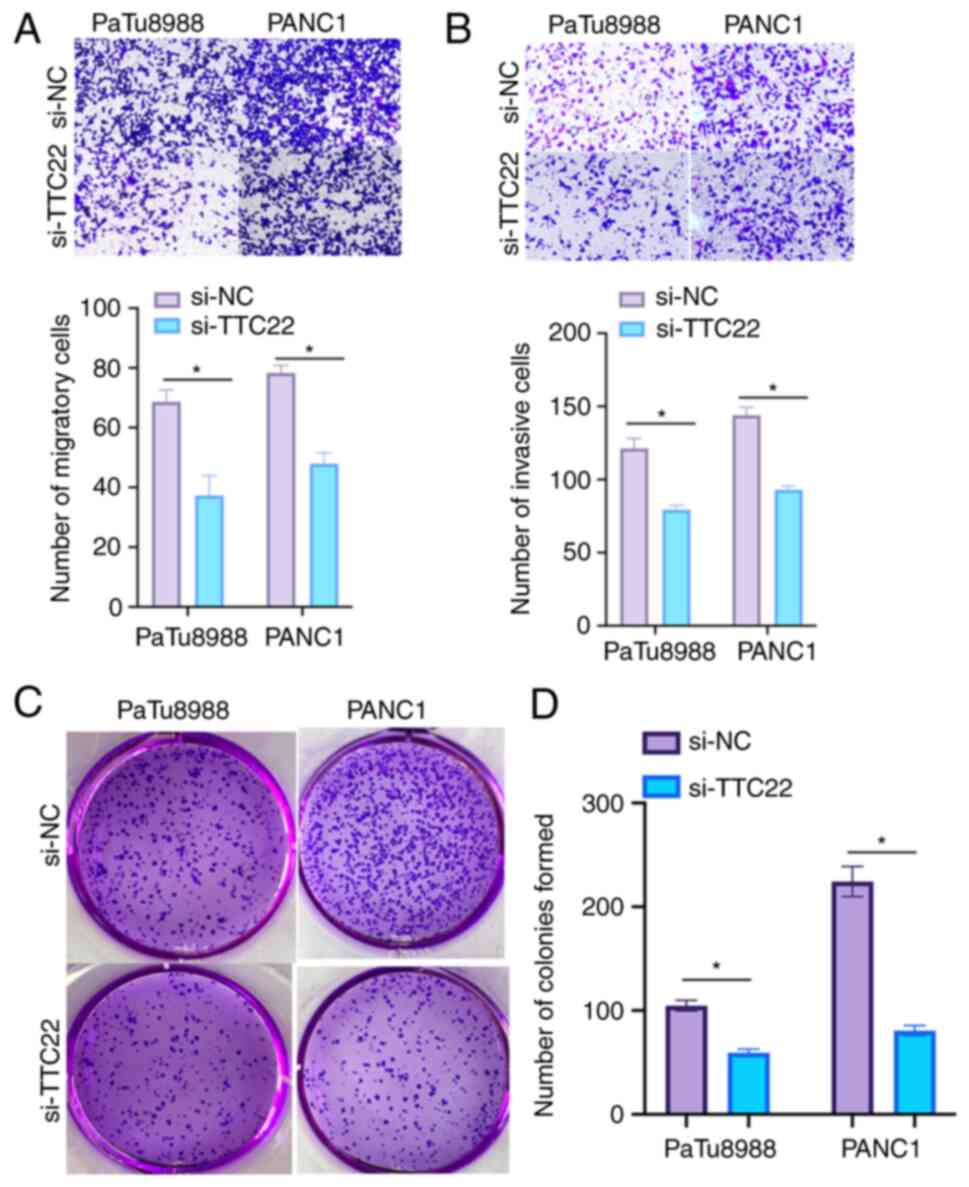
Effect of TTC22 on the migration and
invasion of PAAD cells
Cell migration was assessed using a wound-healing
assay. TTC22 expression was knocked down in PaTu8988and PANC-1 cell
lines, and the migratory ability of the si-TTC22 cells was
significantly lower compared with the si-NC group (Fig. 8C and D). Transwell experiments
further showed a decrease in the migratory and invasive ability of
the TTC22 knockdown cells. When TTC22 was knocked down in
PaTu8988and PANC-1 cells, it was found that the si-TTC22 cells
exhibited reduced invasion and migration compared with the
respective control cells (Fig. 9A and
B).
Effect of TTC22 on pancreatic cancer
proliferation
The effect of TTC22 on the proliferation and colony
formation ability of cells was assessed using colony formation
assays. TTC22 knockdown in PaTu8988and PANC-1 cells significantly
reduced the proliferation and colony formation of cells compared
with the respective control cells (Fig.
9C and D). The differential expression of EMT-related molecules
in the control si-NC group of PANC-1 cells compared with the
respective TTC22 knockdown cells is shown in Fig. S2. The results showed an oncogenic
role for TTC22 in PAAD progression.
Discussion
Pancreatic cancer has emerged as one of the most
lethal types of cancer, and is characterized by high mortality
rates and an increasing incidence (25,26).
Early detection and targeted therapy facilitated by the discovery
of effective biological markers have significantly improved patient
outcomes (27,28). Notably, molecules such as METTL3 and
calcium/calmodulin-dependent protein kinases have been identified
as influential factors in the initiation and progression of
pancreatic cancer cells, thus representing potential biological
markers (29,30). Nevertheless, there remains a need to
identify additional markers with diagnostic and therapeutic
relevance.
TTC22 belongs to the TRP protein family, which
facilitates protein-protein interactions and engages with a range
of ligands or substrates, and is thereby implicated in various
diseases (31). In the context of
tumors, the TRP protein family has been associated with the nuclear
export of tRNA, protein synthesis and cell growth (32). For example, TRPV1 has been
identified as a potential tumor suppressor and has been found to
positively correlate with an anti-tumor immune response in
pan-cancer analyses (33), whereas
TRV6, in collaboration with NFATC2, promotes breast cancer
metastasis (34). However, there is
a dearth of research exploring the role of TTC22 in most types of
cancer, including pancreatic cancer.
Drawing from the aforementioned research, it was
hypothesized that TTC22 may exert influence on the initiation and
progression of pancreatic cancer cells, and thus may hold promise
as a valuable biological marker and therapeutic target. To gain
further insights into the clinical significance of TTC22 in
pancreatic cancer, a comprehensive pan-cancer analysis of its
expression patterns, with a specific focus on pancreatic cancer,
utilizing data from TCGA and GTEx was performed. Subsequently, its
clinical relevance was assessed by constructing various clinical
models, including Kaplan-Meier curves, hazard ratio plots, column
line plots, calibration plots, as well as univariate and
multivariate Cox regression analyses. Moreover, techniques such as
tumor microsatellite instability analysis, assessment of tumor
heterogeneity and t-SNE plots based on single-cell sequencing data
were used to gain a deeper understanding of the role of TTC22 in
tumor biology. The present findings indicated that TTC22 may serve
as a novel biological marker for pancreatic cancer. Functional
enrichment analysis of genes co-expressed with TTC22 in pancreatic
cancer showed that such T-cell receptor complex, antigen binding
and immunoglobulin complex may promote pancreatic cancer immune
infiltration and serve an important role in tumor biology.
Immunotherapeutic approaches for pancreatic cancer,
such as monotherapy immune regulation, have demonstrated limited
efficacy in clinical settings and often necessitate combination
therapy with other treatment modalities (35,36).
Therefore, an analysis of potential immune infiltrates associated
with pancreatic cancer biomarkers is imperative. To address this,
the relationship between TTC22 and immune checkpoint genes, as well
as immune-related genes across various cancer types was analyzed.
Additionally, the ssGSEA algorithm was utilized to enrich the
profiles of 24 immune cell types. The results indicated a
predominantly negative correlation between TTC22 and immune cells
in pancreatic cancer, particularly pDCs.
pDCs belong to the DC family, and serve a pivotal
role in initiating cellular and humoral immune responses, and
safeguarding the body against infectious diseases and tumor
infiltration (37). The robust
capacity of pDCs to initiate and regulate adaptive immune responses
forms the foundation for generating successful anti-tumor immune
responses (38) and has long been a
focal point in cancer immunotherapy (39). In liver cancer, inhibition of DC
cell increases the likelihood of immune evasion (40), while in pancreatic cancer,
restoration of pDC function is associated with disease progression
and sensitivity to radiotherapy (41). Hence, it was hypothesized that TTC22
inhibits tumor immune processes in pancreatic cancer and modulates
the tumor microenvironment by altering immune cell infiltration,
thereby establishing its association with pancreatic cancer as an
immune-related biomarker. Furthermore, in pan-cancer analysis of
TTC22 and tumor immune cells, it was found that the expression of
TTC22 was correlated with the immune infiltration of a variety of
tumor cells. It was hypothesized that this may be related to the
different target molecules of TTC22 in different types of cancer,
and its downstream secreted proteins recruit immune cells to alter
the tumor immune microenvironment; this is an important direction
that is deserved of further study.
EMT is a cellular program involved in a variety of
biological processes and has been shown to play an important role
in a variety of tumors (42–44).
In the present study, the differential expression of TTC22 in
pancreatic cancer cell lines was assessed using RT-qPCR. Moreover,
functional assays, including wound healing, Transwell and colony
formation assays, were performed to demonstrate the influence of
TTC22 on the migration, invasion and development of pancreatic
cancer. However, considering that the relative expression levels of
TTC22 in PANC-1 cells were still higher than those in PaTu8988cells
after siRNA knockdown of TTC22. Therefore, the genes co-expressed
with TTC22 should be further analyzed and screened for validation
in clinical samples and animal models, with the aim of identifying
genes that are co-downregulated with TTC22 that also affect
proliferation and migration. It is plausible that the absolute
expression levels of TTC22 mRNA may not be directly correlated with
the proliferation and migration of the two cancer cell types. Other
genes may also be involved in cell proliferation and migration.
This requires further exploration in future studies.
Notably, it is important to acknowledge several
limitations of the present study. Firstly, the analysis was
primarily based on online databases, namely TCGA and GTEx, with
in vitro validation limited to pancreatic cancer cell lines,
lacking corresponding clinical samples. Secondly, elucidating the
specific molecular mechanisms by which TTC22 affects immune
infiltration of pDCs in pancreatic cancer warrants further
investigation, possibly employing techniques such as western
blotting. Moreover, the establishment of appropriate animal models
will be crucial to unravel the mechanisms underlying the actions of
TTC22 in pancreatic cancer. Thus, in future studies, clinical
samples will be used to verify the accuracy of the bioinformatics
prediction results, and explore the potential downstream
metabolites by flow cytometric sorting and metabolomics-related
sequencing. Additionally, a mouse pancreatic cancer model will be
used to verify the downstream pathways and specific mechanisms
after knocking down TTC22 expression. In summary, the validity and
reliability of bioinformatics in clinical samples and the potential
downstream molecules and products will be assessed in future
studies. After identifying the target molecules, animal and cell
models will be constructed to further confirm these conjectures and
verify the underlying molecular mechanisms in vivo and in
vitro.
In conclusion, the present study elucidated the
potential role of TTC22 in pancreatic cancer through comprehensive
bioinformatics analyses, supported by a series of analytical in
vitro techniques. TTC22 was revealed to serve a significant
role in various aspects of pancreatic cancer, particularly immune
infiltration. By influencing the immune infiltration of pDCs, it
may hinder tumor immune responses, promote metastasis and
contribute to a poor prognosis. Thus, TTC22 holds substantial
biological value as a novel therapeutic target in pancreatic
cancer.
Supplementary Material
Supporting Data
Supporting Data
Acknowledgements
The authors would like to thank Dr Yuqiang Pei
(Department of Neurology, Affiliated Hospital of Nantong
University, Nantong University, Nantong, China) for their
assistance in manuscript writing and figure preparation.
Funding
This study was supported by the National Natural Science
Foundation of China (grant nos. 82072754 and 32170910), Jiangsu
Provincial Key Research and Development Program (grant no.
BE2018689), Natural Science Foundation of Jiangsu Province (grant
no. BK20211124), Postgraduate Research & Practice Innovation
Program of Jiangsu Province (grant no. KYCX22_3711), and Zhenjiang
Key Research and Development Program (grant nos. SH2021037 and
SH2018033).
Availability of data and materials
The datasets generated and/or analyzed during the
current study are available in TCGA repository, https://www.cancer.gov/ccg/research/genome-sequencing/tcga.
Other datasets used and/or analyzed during the current study are
available from the corresponding author on reasonable request.
Authors' contributions
YD, HW and WC were major contributors in writing the
manuscript. YD and HW performed the in vitro experiments and
designed the study. YD and WC performed the bioinformatics
analysis. TC, HJ, ZY, and YZ edited the manuscript, analyzed the
data and confirm the authenticity of all the raw data. MX designed
the study, interpretated the results, obtained the main financial
support, and edited and revised the manuscript. All authors have
read and approved the final manuscript.
Ethics approval and consent to
participate
Not applicable.
Patient consent for publication
Not applicable.
Competing interests
The authors declare that they have no competing
interests.
References
|
1
|
Klein A: Pancreatic cancer epidemiology:
Understanding the role of lifestyle and inherited risk factors. Nat
Rev Gastroenterol Hepatol. 18:493–502. 2021. View Article : Google Scholar : PubMed/NCBI
|
|
2
|
McGuigan A, Kelly P, Turkington RC, Jones
C, Coleman HG and McCain RS: Pancreatic cancer: A review of
clinical diagnosis, epidemiology, treatment and outcomes. World J
Gastroenterol. 24:4846–4861. 2018. View Article : Google Scholar : PubMed/NCBI
|
|
3
|
De Dosso S, Siebenhüner AR, Winder T,
Meisel A, Fritsch R, Astaras C, Szturz P and Borner M: Treatment
landscape of metastatic pancreatic cancer. Cancer Treat Rev.
96:1021802021. View Article : Google Scholar : PubMed/NCBI
|
|
4
|
Qian Y, Gong Y, Fan Z, Luo G, Huang Q,
Deng S, Cheng H, Jin K, Ni Q, Yu X and Liu C: Molecular alterations
and targeted therapy in pancreatic ductal adenocarcinoma. J Hematol
Oncol. 13:1302020. View Article : Google Scholar : PubMed/NCBI
|
|
5
|
You A, Tian W, Yuan H, Gu L, Zhou J and
Deng D: TTC22 promotes m6A-mediated WTAP expression and colon
cancer metastasis in an RPL4 binding-dependent pattern. Oncogene.
41:3925–3938. 2022. View Article : Google Scholar : PubMed/NCBI
|
|
6
|
Tian W, Du Y, Ma Y, Zhang B, Gu L, Zhou J
and Deng D: miR663a-TTC22V1 axis inhibits colon cancer metastasis.
Oncol Rep. 41:1718–1728. 2019.PubMed/NCBI
|
|
7
|
Jin MZ and Jin WL: The updated landscape
of tumor microenvironment and drug repurposing. Signal Transduct
Target Ther. 5:1662020. View Article : Google Scholar : PubMed/NCBI
|
|
8
|
de Visser KE and Joyce JA: The evolving
tumor microenvironment: From cancer initiation to metastatic
outgrowth. Cancer Cell. 41:374–403. 2023. View Article : Google Scholar : PubMed/NCBI
|
|
9
|
Pitt JM, Marabelle A, Eggermont A, Soria
JC, Kroemer G and Zitvogel L: Targeting the tumor microenvironment:
removing obstruction to anticancer immune responses and
immunotherapy. Ann Oncol. 27:1482–1492. 2016. View Article : Google Scholar : PubMed/NCBI
|
|
10
|
R Core Team: R: A language and environment
for statistical computing. R Foundation for Statistical Computing;
Vienna, Austria: 2022
|
|
11
|
Fox J and Weisberg S: _An R Companion to
Applied Regression_,. Third edition. Sage; Thousand Oaks CA:
2019
|
|
12
|
Blanche P, Dartigues JF and Jacqmin-Gadda
H: Estimating and comparing time-dependent areas under receiver
operating characteristic curves for censored event times with
competing risks. Stat Med. 32:5381–5397. 2013. View Article : Google Scholar : PubMed/NCBI
|
|
13
|
Robin X, Turck N, Hainard A, Tiberti N,
Lisacek F, Sanchez JC and Müller M: pROC: An open-source package
for R and S+ to analyze and compare ROC curves. BMC Bioinformatics.
12:772011. View Article : Google Scholar : PubMed/NCBI
|
|
14
|
Bonneville R, Krook MA, Kautto EA, Miya J,
Wing MR, Chen HZ, Reeser JW, Yu L and Roychowdhury S: Landscape of
microsatellite instability across 39 cancer types. JCO Precis
Oncol. 2017:172017.PubMed/NCBI
|
|
15
|
Beroukhim R, Mermel CH, Porter D, Wei G,
Raychaudhuri S, Donovan J, Barretina J, Boehm JS, Dobson J,
Urashima M, et al: The landscape of somatic copy-number alteration
across human cancers. Nature. 463:899–905. 2010. View Article : Google Scholar : PubMed/NCBI
|
|
16
|
Mayakonda A, Lin DC, Assenov Y, Plass C
and Koeffler HP: Maftools: Efficient and comprehensive analysis of
somatic variants in cancer. Genome Res. 28:1747–1756. 2018.
View Article : Google Scholar : PubMed/NCBI
|
|
17
|
Love MI, Huber W and Anders S: Moderated
estimation of fold change and dispersion for RNA-seq data with
DESeq2. Genome Biol. 15:5502014. View Article : Google Scholar : PubMed/NCBI
|
|
18
|
Gu Z, Gu L, Eils R, Schlesner M and Brors
B: circlize Implements and enhances circular visualization in R.
Bioinformatics. 30:2811–2812. 2014. View Article : Google Scholar : PubMed/NCBI
|
|
19
|
Wu T, Hu E, Xu S, Chen M, Guo P, Dai Z,
Feng T, Zhou L, Tang W, Zhan L, et al: clusterProfiler 4.0: A
universal enrichment tool for interpreting omics data. Innovation
(Camb). 2:1001412021.PubMed/NCBI
|
|
20
|
Walter W, Sánchez-Cabo F and Ricote M:
GOplot: An R package for visually combining expression data with
functional analysis. Bioinformatics. 31:2912–2915. View Article : Google Scholar : PubMed/NCBI
|
|
21
|
Thorsson V, Gibbs DL, Brown SD, Wolf D,
Bortone DS, Ou Yang TH, Porta-Pardo E, Gao GF, Plaisier CL, Eddy
JA, et al: The immune landscape of cancer. Immunity.
48:812–830.e14. 2018. View Article : Google Scholar : PubMed/NCBI
|
|
22
|
Hänzelmann S, Castelo R and Guinney J:
GSVA: Gene set variation analysis for microarray and RNA-seq data.
BMC Bioinformatics. 14:72013. View Article : Google Scholar : PubMed/NCBI
|
|
23
|
Bindea G, Mlecnik B, Tosolini M,
Kirilovsky A, Waldner M, Obenauf AC, Angell H, Fredriksen T,
Lafontaine L, Berger A, et al: Spatiotemporal dynamics of
intratumoral immune cells reveal the immune landscape in human
cancer. Immunity. 39:782–795. 2013. View Article : Google Scholar : PubMed/NCBI
|
|
24
|
Livak KJ and Schmittgen TD: Analysis of
relative gene expression data using real-time quantitative PCR and
the 2(−Delta Delta C(T)) method. Methods. 25:402–408. 2001.
View Article : Google Scholar : PubMed/NCBI
|
|
25
|
Loveday BPT, Lipton L and Thomson BN:
Pancreatic cancer: An update on diagnosis and management. Aust J
Gen Pract. 48:826–831. 2019. View Article : Google Scholar : PubMed/NCBI
|
|
26
|
Cai J, Chen H, Lu M, Zhang Y, Lu B, You L,
Zhang T, Dai M and Zhao Y: Advances in the epidemiology of
pancreatic cancer: Trends, risk factors, screening, and prognosis.
Cancer Lett. 520:1–11. 2021. View Article : Google Scholar : PubMed/NCBI
|
|
27
|
Wood LD, Canto MI, Jaffee EM and Simeone
DM: Pancreatic cancer: Pathogenesis, screening, diagnosis, and
treatment. Gastroenterology. 163:386–402.e1. 2022. View Article : Google Scholar : PubMed/NCBI
|
|
28
|
Chapa-González C, López K, Lomelí KM,
Roacho-Pérez JA and Stevens JC: A review on the efficacy and safety
of Nab-paclitaxel with gemcitabine in combination with other
therapeutic agents as new treatment strategies in pancreatic
cancer. Life (Basel). 12:3272022.PubMed/NCBI
|
|
29
|
Xia T, Wu X, Cao M, Zhang P, Shi G, Zhang
J, Lu Z, Wu P, Cai B, Miao Y and Jiang K: The RNA m6A
methyltransferase METTL3 promotes pancreatic cancer cell
proliferation and invasion. Pathol Res Pract. 215:1526662019.
View Article : Google Scholar : PubMed/NCBI
|
|
30
|
Lei Y, Yu T, Li C, Li J, Liang Y and Wang
X, Chen Y and Wang X: Expression of CAMK1 and its association with
clinicopathologic characteristics in pancreatic cancer. J Cell Mol
Med. 25:1198–1206. 2020. View Article : Google Scholar : PubMed/NCBI
|
|
31
|
Graham JB, Canniff NP and Hebert DN:
TPR-containing proteins control protein organization and
homeostasis for the endoplasmic reticulum. Crit Rev Biochem Mol
Biol. 54:103–118. 2019. View Article : Google Scholar : PubMed/NCBI
|
|
32
|
Chen M, Long Q, Borrie MS, Sun H, Zhang C,
Yang H, Shi D, Gartenberg MR and Deng W: Nucleoporin TPR promotes
tRNA nuclear export and protein synthesis in lung cancer cells.
PLoS Genet. 17:e10098992021. View Article : Google Scholar : PubMed/NCBI
|
|
33
|
Nie R, Liu Q and Wang X: TRPV1 Is a
potential tumor suppressor for its negative association with tumor
proliferation and positive association with antitumor immune
responses in pan-Cancer. J Oncol. 2022:69645502022. View Article : Google Scholar : PubMed/NCBI
|
|
34
|
Xu X, Li N, Wang Y, Yu J and Mi J: Calcium
channel TRPV6 promotes breast cancer metastasis by NFATC2IP. Cancer
Lett. 519:150–160. 2021. View Article : Google Scholar : PubMed/NCBI
|
|
35
|
Schizas D, Charalampakis N, Kole C,
Economopoulou P, Koustas E, Gkotsis E, Ziogas D, Psyrri A and
Karamouzis MV: Immunotherapy for pancreatic cancer: A 2020 update.
Cancer Treat Rev. 86:1020162020. View Article : Google Scholar : PubMed/NCBI
|
|
36
|
Bear AS, Vonderheide RH and O'Hara MH:
Challenges and opportunities for pancreatic cancer immunotherapy.
Cancer Cell. 38:788–802. 2020. View Article : Google Scholar : PubMed/NCBI
|
|
37
|
Balan S, Saxena M and Bhardwaj N:
Dendritic cell subsets and locations. Int Rev Cell Mol Biol.
348:1–68. 2019. View Article : Google Scholar : PubMed/NCBI
|
|
38
|
Lee YS and Radford KJ: The role of
dendritic cells in cancer. Int Rev Cell Mol Biol. 348:123–178.
2019. View Article : Google Scholar : PubMed/NCBI
|
|
39
|
Gardner A, de Mingo Pulido Á and Ruffell
B: Dendritic cells and their role in immunotherapy. Fron Immunol.
11:9242020. View Article : Google Scholar : PubMed/NCBI
|
|
40
|
Wang S, Wu Q, Chen T, Su R, Pan C, Qian J,
Huang H, Yin S, Xie H, Zhou L and Zheng S: Blocking CD47 promotes
antitumour immunity through CD103 dendritic cell-NK cell axis in
murine hepatocellular carcinoma model. J Hepatol. 77:467–478. 2022.
View Article : Google Scholar : PubMed/NCBI
|
|
41
|
Hegde S, Krisnawan VE, Herzog BH, Zuo C,
Breden MA, Knolhoff BL, Hogg GD, Tang JP, Baer JM, Mpoy C, et al:
Dendritic cell paucity leads to dysfunctional immune surveillance
in pancreatic cancer. Cancer Cell. 37:289–307.e9. 2020. View Article : Google Scholar : PubMed/NCBI
|
|
42
|
Dongre A and Weinberg RA: New insights
into the mechanisms of epithelial-mesenchymal transition and
implications for cancer. Nat Rev Mol Cell Biol. 20:69–84. 2019.
View Article : Google Scholar : PubMed/NCBI
|
|
43
|
Lüönd F, Sugiyama N, Bill R, Bornes L,
Hager C, Tang F, Santacroce N, Beisel C, Ivanek R, Bürglin T, et
al: Distinct contributions of partial and full EMT to breast cancer
malignancy. Dev Cell. 56:3203–3221.e11. 2021. View Article : Google Scholar : PubMed/NCBI
|
|
44
|
Li S, Cong X, Gao H, Lan X, Li Z, Wang W,
Song S, Wang Y, Li C, Zhang H, et al: Tumor-associated neutrophils
induce EMT by IL-17a to promote migration and invasion in gastric
cancer cells. J Exp Clin Cancer Res. 38:62019. View Article : Google Scholar : PubMed/NCBI
|