Introduction
Tumor cells are characterized by hypoxia, with
pO2 levels reaching up to <10 mmHg at the center of a
solid tumor (1,2). The lack of vascularity leads to a
mismatch between oxygen delivery and consumption and is thought to
be the main cause of tumor hypoxia. Subsequently, abnormal
angiogenesis, tumor invasion, and metastasis are activated;
additionally the frequently observed resistance to immune-, chemo-,
and radiotherapies can contribute to tumor progression (3,4).
Hence, tumor hypoxia is generally considered a promising target for
cancer therapy (5,6).
Mounting evidence suggests that autophagy plays a
pivotal role in maintaining tumor cell survival under hypoxic
conditions. Autophagy is an intracellular self-degradative
mechanism that is facilitated in response to environmental
stressors, such as nutrient deficiency and hypoxia (7). Mitophagy is a selective form of
autophagy that removes defective or excessive mitochondria from the
cell. Recent studies have shown that tumor cells exploit both auto-
and mitophagy to cope with reduced oxygen and metabolic supplies,
control the neogenesis and functions of mitochondria, and promote
cell survival in hypoxic tumor microenvironments (TMEs) (8,9). In
this context, inhibiting auto- or mitophagy might prove beneficial
in inducing tumor cell death in hypoxic TMEs. However, predominant
autophagy that exceeds its adaptive capacity within the cell can
facilitate tumor cell death (10,11);
hence, the stimulation of auto- or mitophagy under hypoxic TME may
provide an alternative therapeutic scheme. Nonetheless, the effect
of inhibiting or stimulating auto- or mitophagy while targeting
hypoxic tumor cells during anticancer therapy remains unclear.
Recent studies, including ours, have demonstrated
that azithromycin (AZM), a widely used antibiotic belonging to the
macrolide group, exhibits antiproliferative, pro-apoptotic,
anti-autophagy, and anti-angiogenic effects in cancer cells
(12). Furthermore, it can
potentiate the anticancer effects of chemotherapeutic drugs, such
as DNA-damaging chemotherapeutic agents, tyrosine kinase
inhibitors, and proteasome inhibitors, by inhibiting autophagy
(13–18). One study, in particular, outlined
the involvement of AZM in cytoskeletal protein dynamics, which
subsequently inhibited autophagy (19). Additionally, AZM is reported to
inhibit mitochondrial ribosome in cancer cells, thereby interfering
with the process of mitophagy (20). Thus, the role of AZM is directly
linked to enhancing apoptosis and exhibiting caspase 3/7, as
demonstrated in glioblastoma and leukemia (21,22).
In the present study, we hypothesized that AZM might specifically
target hypoxic cancer cells by suppressing auto- and mitophagy for
cancer cell survival under hypoxic conditions. To test this
hypothesis, we extended our previous research to evaluate the
effect of AZM on lung cancer cell survival under hypoxic and
normoxic conditions.
Materials and methods
Cell culture
Human non-small cell lung cancer cell lines (A549,
H1299, and NCI-H441) were obtained from the American Type Culture
Collection (Manassas, VA, USA). A549 cells were maintained on
bovine type I collagen-coated plates in Dulbecco's Modified Eagle
medium (DMEM; Gibco; Thermo Fisher Scientific, Inc., Waltham, MA,
USA) supplemented with 10% fetal bovine serum (FBS) and 1%
penicillin/streptomycin (growth medium) at 37°C in a humidified
incubator (CO2 incubator 900EX, Wakenyaku Co., Ltd.,
Tokyo, Japan) saturated with a gas mixture containing 5%
CO2 and 20% O2. The H1299 and NCI-H441 cells
were maintained on bovine type I collagen-coated plates in Roswell
Park Memorial Institute (RPMI; Gibco) supplemented with 10% FBS and
1% penicillin/streptomycin. The A549 and H1299 cell lines were
authenticated via short tandem repeat profiling, which was
performed using the Promega PowerPlex® 16 HS system
(Promega Corporation, Madison, WI). At 24 h prior to each
experiment, the cells were replated on a new plate and grown in the
relevant medium. Just before the experiment, A549 and H1299 cells
were saturated with RPMI and supplemented with 1% FBS
(serum-reduced experimental medium), while the NCI-H441 cells with
RPMI were supplemented with 5% FBS. Thereafter, the cells were
stored in a humidified incubator containing 5% CO2 with
either 20% O2 (normoxia) or 0.3% O2 (hypoxia)
in the presence (5, 10, or 25 µM or 25 µM unless otherwise
indicated) or absence of AZM (Tokyo Chemical Industry, Tokyo,
Japan). In some experiments, the cells were incubated in the
presence of Z-VAD-FMK (25 µM, Adooq Bioscience, Irvine, CA,
USA).
Cell survival assay
Cell survival was evaluated in a 96-well flat-bottom
culture plate using the Hoechst 33342 DNA quantification assay.
Briefly, the cells were lysed in 100 µl of distilled water,
followed by a freeze-thaw cycle. The cell lysates were then
solubilized in 100 µl of TNE buffer (10-mM Tris, 1-mM EDTA, and 2-M
NaCl; pH 7.4) containing 10 µg/ml of Hoechst 33342 (Sigma-Aldrich
Japan, Tokyo, Japan). The fluorescence intensities were read at an
excitation wavelength (Ex) of 350 nm and emission wavelength (Em)
of 460 nm using a microplate fluorometer (PerkinElmer ArvoX2;
PerkinElmer Japan Co., Ltd., Tokyo, Japan).
Cell morphology
Cells in an 8-chamber cell culture slide were
stained with a Diff-quick solution (Agilent, Santa Clara, CA, USA)
and examined under a Nikon Optiphot-2 microscope (Nikon Solutions
Co., Ltd., Tokyo, Japan). Apoptotic cells were identified based on
nuclear pyknosis or chromatin condensation and the cell
shrinkage.
Western blotting
The cell samples were lysed in a
radioimmunoprecipitation assay buffer (50-mM Tris hydrochloride,
150-mM NaCl, 0.4-mM EDTA, 0.5% Nonidet P-40, and 0.1% SDS; pH 7.4)
supplemented with a protease inhibitor (#P8340; Sigma-Aldrich
Japan) and a phosphatase inhibitor (#sc-45065; Santa Cruz
Biotechnology, Santa Cruz, CA, USA) cocktail. The samples were
centrifuged at 13,000 g for 10 min, and the total protein
concentration in the supernatants was assessed using the DC protein
assay kit (#5000112, Bio-Rad Laboratories). After adding 5X sample
buffer (500-mM Tris, 5% 2-mercaptoethanol, 10% glycerin, 2.5% SDS,
and 0.0125% bromophenol blue; pH 6.8), the samples with equal
amounts of proteins were fractionated by SDS-polyacrylamide gel
electrophoresis and transferred to a polyvinylidene difluoride
membrane (EMD Millipore Immobilon®-P; Millipore, Co.,
Billerica, MA, USA). The membranes were blocked with 4% bovine
serum albumin (BSA; Biowest), probed with the primary antibodies
described below, diluted in an immunoreaction enhancer solution
(Can Get Signal® Solution 1; Toyobo Co., Ltd., Osaka,
Japan), and reacted with horseradish peroxidase (HRP)-conjugated
secondary antibodies, such as stabilized goat anti-rabbit
immunoglobulin (Ig) G (1:1,000; #32460, Thermo Fisher Scientific)
and stabilized goat anti-mouse IgG (1:1,000; #32430, Thermo Fisher
Scientific). The immune complexes were visualized using an enhanced
chemiluminescence reagent (#34579, SuperSignal West Pico Plus;
Thermo Fisher Scientific). The signal intensities were quantified
by densitometric scanning using ImageJ (version 1.49V; National
Institutes of Health, Bethesda, MD, USA).
The primary antibodies used in this study were
rabbit polyclonal anti-poly (ADP-ribose) polymerase 1 (1:1,000;
sc-7150, Santa Cruz Biotechnology), rabbit polyclonal
anti-caspase-3/p17/p19 (1:1,000; 19677-1-AP, Proteintech Group,
Inc., Rosemont, IL, USA), rabbit polyclonal
anti-ubiquinol-cytochrome b-c1 complex subunit 1 (UQCRC1; 1:1,000;
21705-1-AP, Proteintech), rabbit polyclonal anti-p62 (1:1,000;
18420-1-AP, Proteintech, Rosemont, IL, USA), mouse monoclonal
anti-heat shock protein 60 (HSP 60; 1:1,000; SPA-807, Stressgen
Biotechnologies, San Diego, CA, USA), rabbit polyclonal
anti-microtubule-associated protein 1 light chain 3B (LC3B;
1:1,000; NB600-1384, Novus Biologicals, Inc., Littleton, CO, USA),
rabbit monoclonal anti-Bcl-2/E1B-19kDa interacting protein 3
(BNIP3; 1:1,000; #44060, Cell Signaling Technology, Danvers, MA,
USA), rabbit monoclonal anti-Bcl-2/E1B-19kDa interacting protein
3-like (BNIP3L/Nix; 1:1,000; #12396, Cell Signaling Technology),
and mouse monoclonal anti-β-actin conjugated with horseradish
peroxidase (1:6,000; #017-24573, Fujifilm Wako Chemicals, Osaka,
Japan).
Immunofluorescence staining
Cells in an 8-chamber cell culture slide were fixed
with 3% paraformaldehyde and permeabilized with 0.5%
Triton® X-100 (Nacalai Tesque, Inc., Kyoto, Japan) in
PBS for 10 min. After blocking the nonspecific binding sites with
3% BSA, the slides were incubated with rabbit polyclonal
anti-cleaved caspase-3 (Asp175) (1:100; #9661, Cell Signaling
Technology), followed by alpaca anti-rabbit IgG (VHH) conjugated
with Alexa Fluor 488 (1:1,000; SA510322, Thermo Fisher Scientific).
The cell nuclei were then counterstained with
4′,6-diamidino-2-phenylindole (DAPI), and fluorescence images were
obtained using a Nikon Optiphot-2 microscope.
Assessment of the lysosomal pH
The lysosomal pH was assessed using the Lysosomal
Acidic pH Detection kit (#L266; Dojindo Laboratories, Kumamoto,
Japan), according to the manufacturer's instructions. Briefly,
cells in an 8-chamber cell culture slide were loaded with
pHLys®Red for 30 min at 37°C, and fluorescence images
were acquired using a Nikon Optiphot-2 microscope. The fluorescence
intensity of pHLys®Red, which accumulates in intact
lysosomes, increases with the increase in acidity, and only weak
fluorescence is detected when lysosomes are neutralized.
Assessment of the auto- and mitophagy
flux in live cells
Cells in an 8-chamber cell culture slide were loaded
with DAP®Red (#D677, Dojindo Laboratories), which
detected both autophagosomes and autolysosomes, and
DAL®Green (#D676, Dojindo Laboratories), which detected
only autolysosomes, for 30 min at 37°C as per the manufacturer's
instructions. DAL®Green and DAP®Red are
generally incorporated in the autophagosome. The
DAL®Green fluorescence becomes stronger after the fusion
of the lysosome with the autophagosome, due to the increase in the
acidity, whereas the DAP®Red fluorescence remains
unchanged.
For the mitophagy flux, cells in an 8-chamber cell
culture slide were loaded with Mtphagy®Dye (#MT01,
Dojindo Laboratories) and Lyso®Dye (Dojindo
Laboratories), which accumulate in intact mitochondria and
lysosomes, respectively. When mitophagy is induced, the
mitophagosomes fuse to lysosomes to form mitolysosomes, and the
Mtphagy®Dye emits a strong red fluorescence due to the
increase in acidity. Fluorescence images were obtained using a
Nikon Optiphot-2 microscope.
Measurement of the oxygen consumption
rate
The oxygen consumption rate was measured using a
Seahorse XFp analyzer (Agilent, Santa Clara, CA) and an XFp Cell
Mito Stress Test Kit (#103010-100, Agilent), according to the
manufacturer's instructions (23).
Assessment of the mitochondrial
membrane potential
Cells in an 8-chamber cell culture slide were loaded
with the mitochondrial membrane potential (MMP) indicator,
tetramethylrhodaminemethyl ester (TMRM); 250 nM; #T688, Thermo
Fisher Scientific) for 30 min at 37°C, and fluorescence images were
acquired using a Nikon Optiphot-2 microscope. The cells were plated
in a 96-well flat-bottom culture plate and stained with TMRM (250
nM) and Hoechst 33342 (2 µg/ml) for 30 min at 37°C to quantify the
MMP. The medium was substituted with PBS, and the fluorescence
intensities of TMRM (Ex 530 nm, Em 600 nm) and Hoechst33342 (Ex 355
nm, Em 460 nm) were recorded on a microplate fluorometer. The TMRM
fluorescence was normalized to that of Hoechst 33342 in the
corresponding wells.
Assessment of caspase activation in
live cells
The cells placed in an 8-chamber cell culture slide
were impregnated with a CellEvent® caspase-3/7 green
detection reagent (7.5 µM; #C10423, Thermo Fisher Scientific), a
fluorogenic substrate for activated caspase-3/7, for 30 min at
37°C, and fluorescence images were obtained using a Nikon
Optiphot-2 microscope. This reagent is non-fluorescent because the
DEVD peptide hinders the binding of the dye to DNA. However, after
the activation of caspase-3/7 in apoptotic cells, the DEVD peptide
is cleaved, enabling the dye to connect to DNA and produce a bright
fluorogenic response.
Measurements of the total, healthy,
and damaged mitochondrial masses
Cells in a 96-well flat-bottom culture plate were
loaded with MitoTraker®Green FM (200 nM, #M7514, Thermo
Fisher Scientific) for 30 min at 37°C and placed in a normoxic or
hypoxic CO2 incubator in the presence or absence of AZM
for 24 h. Thereafter, the hypoxic cells were reoxygenated in a
normoxic CO2 incubator for 3 h. The cells that were
exposed to hypoxia or normoxia were stained with TMRM (250 nM) and
Hoechst33342 (10 µg/ml; Sigma-Aldrich Japan) for 30 min at 37°C,
and the fluorescence intensities of MitoTraker®Green FM
(Ex 485 nm, Em 535 nm), TMRM (Ex 531 nm, Em 600 nm), and
Hoechst33342 (Ex 350 nm, Em 460 nm) were detected on a microplate
fluorometer (PerkinElmer ArvoX2). The fluorescence intensities of
MitoTracker®Green FM and TMRM were normalized to that of
Hoechst 33342 in the corresponding wells. The normalized
fluorescence intensity of MitoTracker®Green FM was
defined as the cellular amount of the total (healthy plus damaged)
mitochondria, which was the product of the number of mitochondria
per cytoplasm and the average individual mitochondrial volume; data
were expressed as percentages relative to cells exposed to normoxia
without AZM and set as value A. The normalized fluorescence
intensity of TMRM was outlined as the cellular amount of
MMP-positive healthy mitochondria; the data were expressed as
percentages relative to cells with normoxia and without AZM and set
as value B. All the mitochondria in cells with normoxia and without
AZM were assumed to be healthy and MMP-positive. Based on this
assumption, the percentage of MMP-positive mitochondria was
calculated by dividing B by A and multiplying by 100. The cellular
amount of MMP-negative, damaged mitochondria was calculated by
subtracting B from A.
Depletion of mitochondrial DNA
A549 cells devoid of mitochondrial DNA (A549 ρ°)
were prepared as described previously (24) by culturing the cells in DMEM
supplemented with 10% FBS in the presence of ethidium bromide (50
ng/ml), sodium pyruvate (1 mM), and uridine (100 µg/ml) for >20
generations. The successful establishment of the A549 ρ° cell line
was confirmed by polymerase chain reaction, using mitochondrial
DNA-specific primers, as described in our previous study (25).
Statistical analysis
Data pertaining to the descriptive statistics for
continuous variables are expressed as means ± the standard
deviations. A P-value of <0.05 was considered statistically
significant. All statistical analyses were performed using the Eazy
R statistical software (version 1.54), which is available at
https://www.jichi.ac.jp/saitama-sct/SaitamaHP.files/statmedEN.html
(26). The statistical difference
between two groups was calculated using the Welch t-test. Multiple
comparisons between more than two groups were made using one-way
ANOVA when a single variable was compared among groups or two-way
ANOVA when two variables were compared simultaneously. If the
results of the ANOVA were significant, Tukey's test was used as a
post hoc test for multiple comparisons. The required sample size
was determined based on our preliminary experiments and the
relevant literature (13–16).
Results
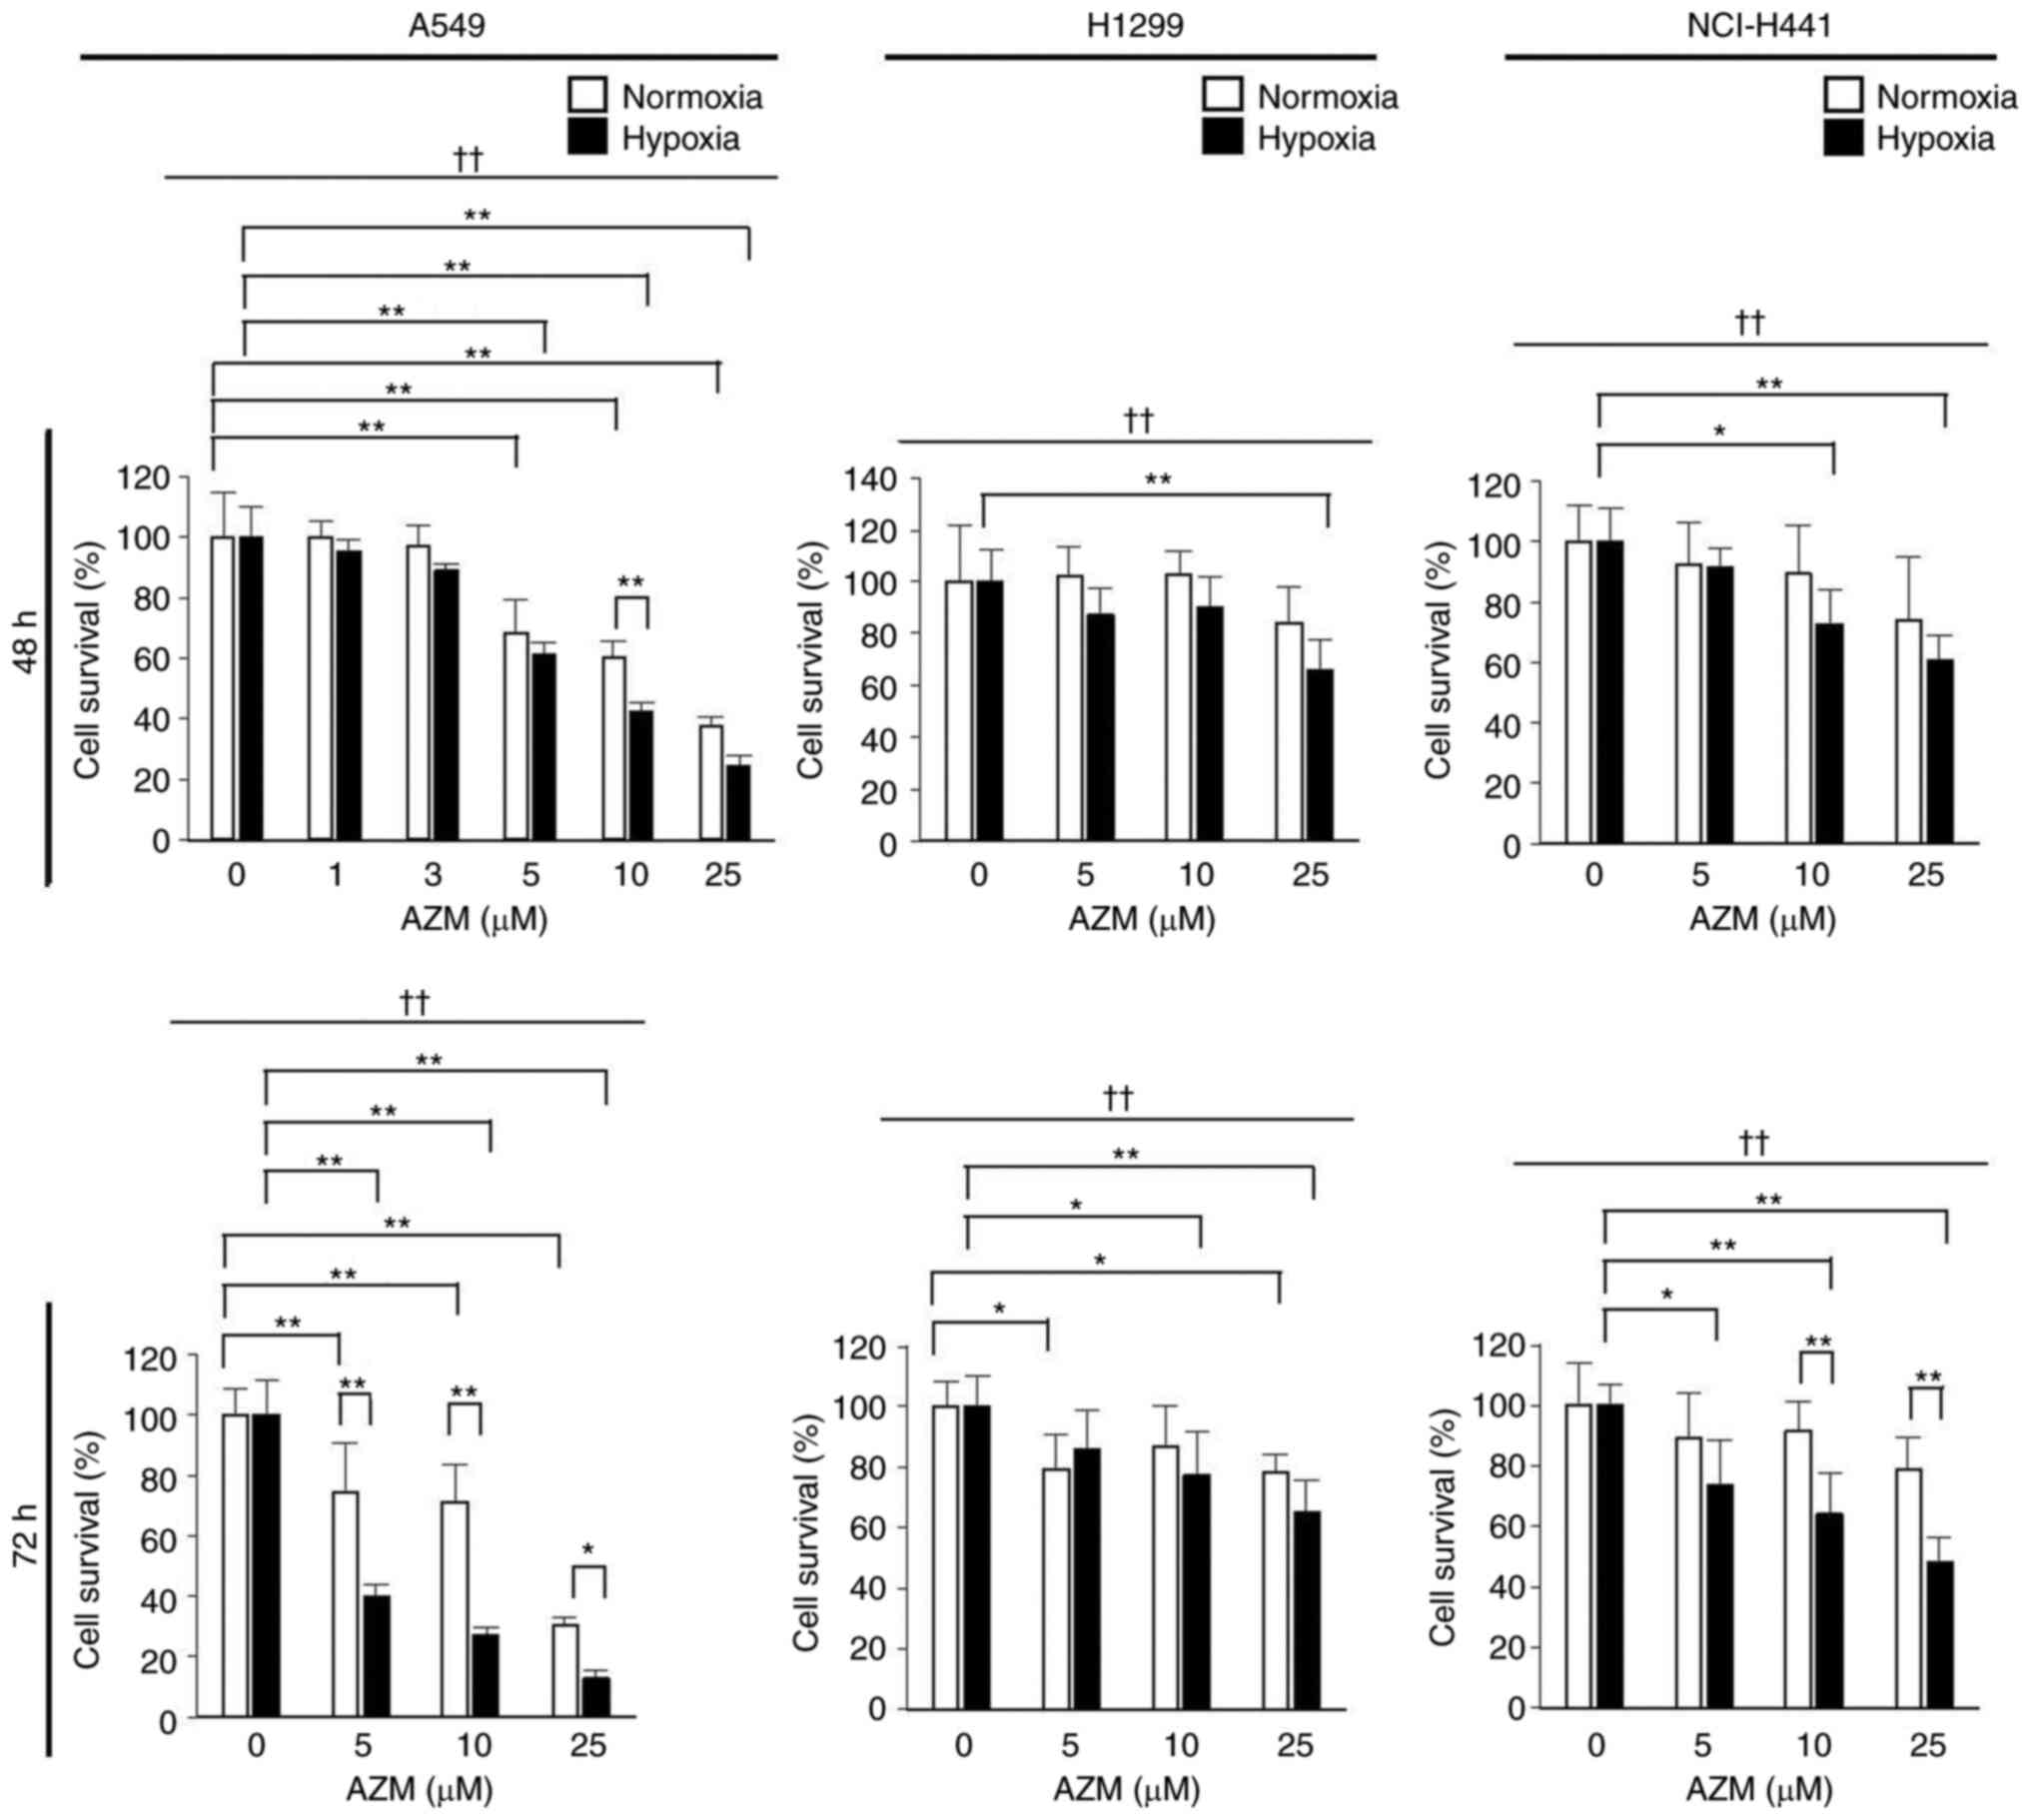
AZM reduces the survival of lung
cancer cells exposed to hypoxia
AZM treatment under normoxia (20% O2) had
minimal impact on the survival of H1299 and NCI-H441 cells but
significantly reduced that of A549 cells, indicating that
susceptibility to AZM cytotoxicity was cell-type specific (Fig. 1). However, AZM treatment tended to
diminish the survival rates of all the tested cell types more
effectively under hypoxic (0.3% O2) conditions than
under normoxic conditions, indicating that the cytotoxic action of
AZM was enhanced under hypoxia. The A549 cells were used in
subsequent experiments because they were found to be the most
susceptible to AZM treatment.
AZM induces apoptosis under hypoxic
conditions
The morphologies of A549 cells stained with
Diff-quick and DAPI showed that AZM treatment along with exposure
to hypoxia induced apoptosis (characterized by nuclear condensation
and fragmentation with cytoplasmic shrinkage) (Fig. 2A-D). Immunofluorescence staining
revealed that AZM treatment with hypoxia exposure induced caspase-3
cleavage (Fig. 2E). Furthermore,
AZM treatment with hypoxia exposure stimulated the cleavage of PARP
and caspase-3 in the Western blot analysis (Fig. 2F). These results indicated that AZM
treatment induced apoptosis under hypoxic conditions. The reduction
in the cell survival rate triggered by the aforementioned measures
was attenuated in the presence of the pan-caspase inhibitor,
Z-VAD-FMK (Fig. 2G). A549 cells
treated with AZM demonstrated a moderate (but significant) decrease
in cell survival even under normoxic conditions (Fig. 1). However, under the latter, no
evidence of apoptosis induction by AZM treatment (Fig. 2A-D) or the improvement in cell
survival in the presence of Z-VAD-FMK (Fig. 2G), suggesting that hypoxia is a
prerequisite for apoptosis induction by AZM.
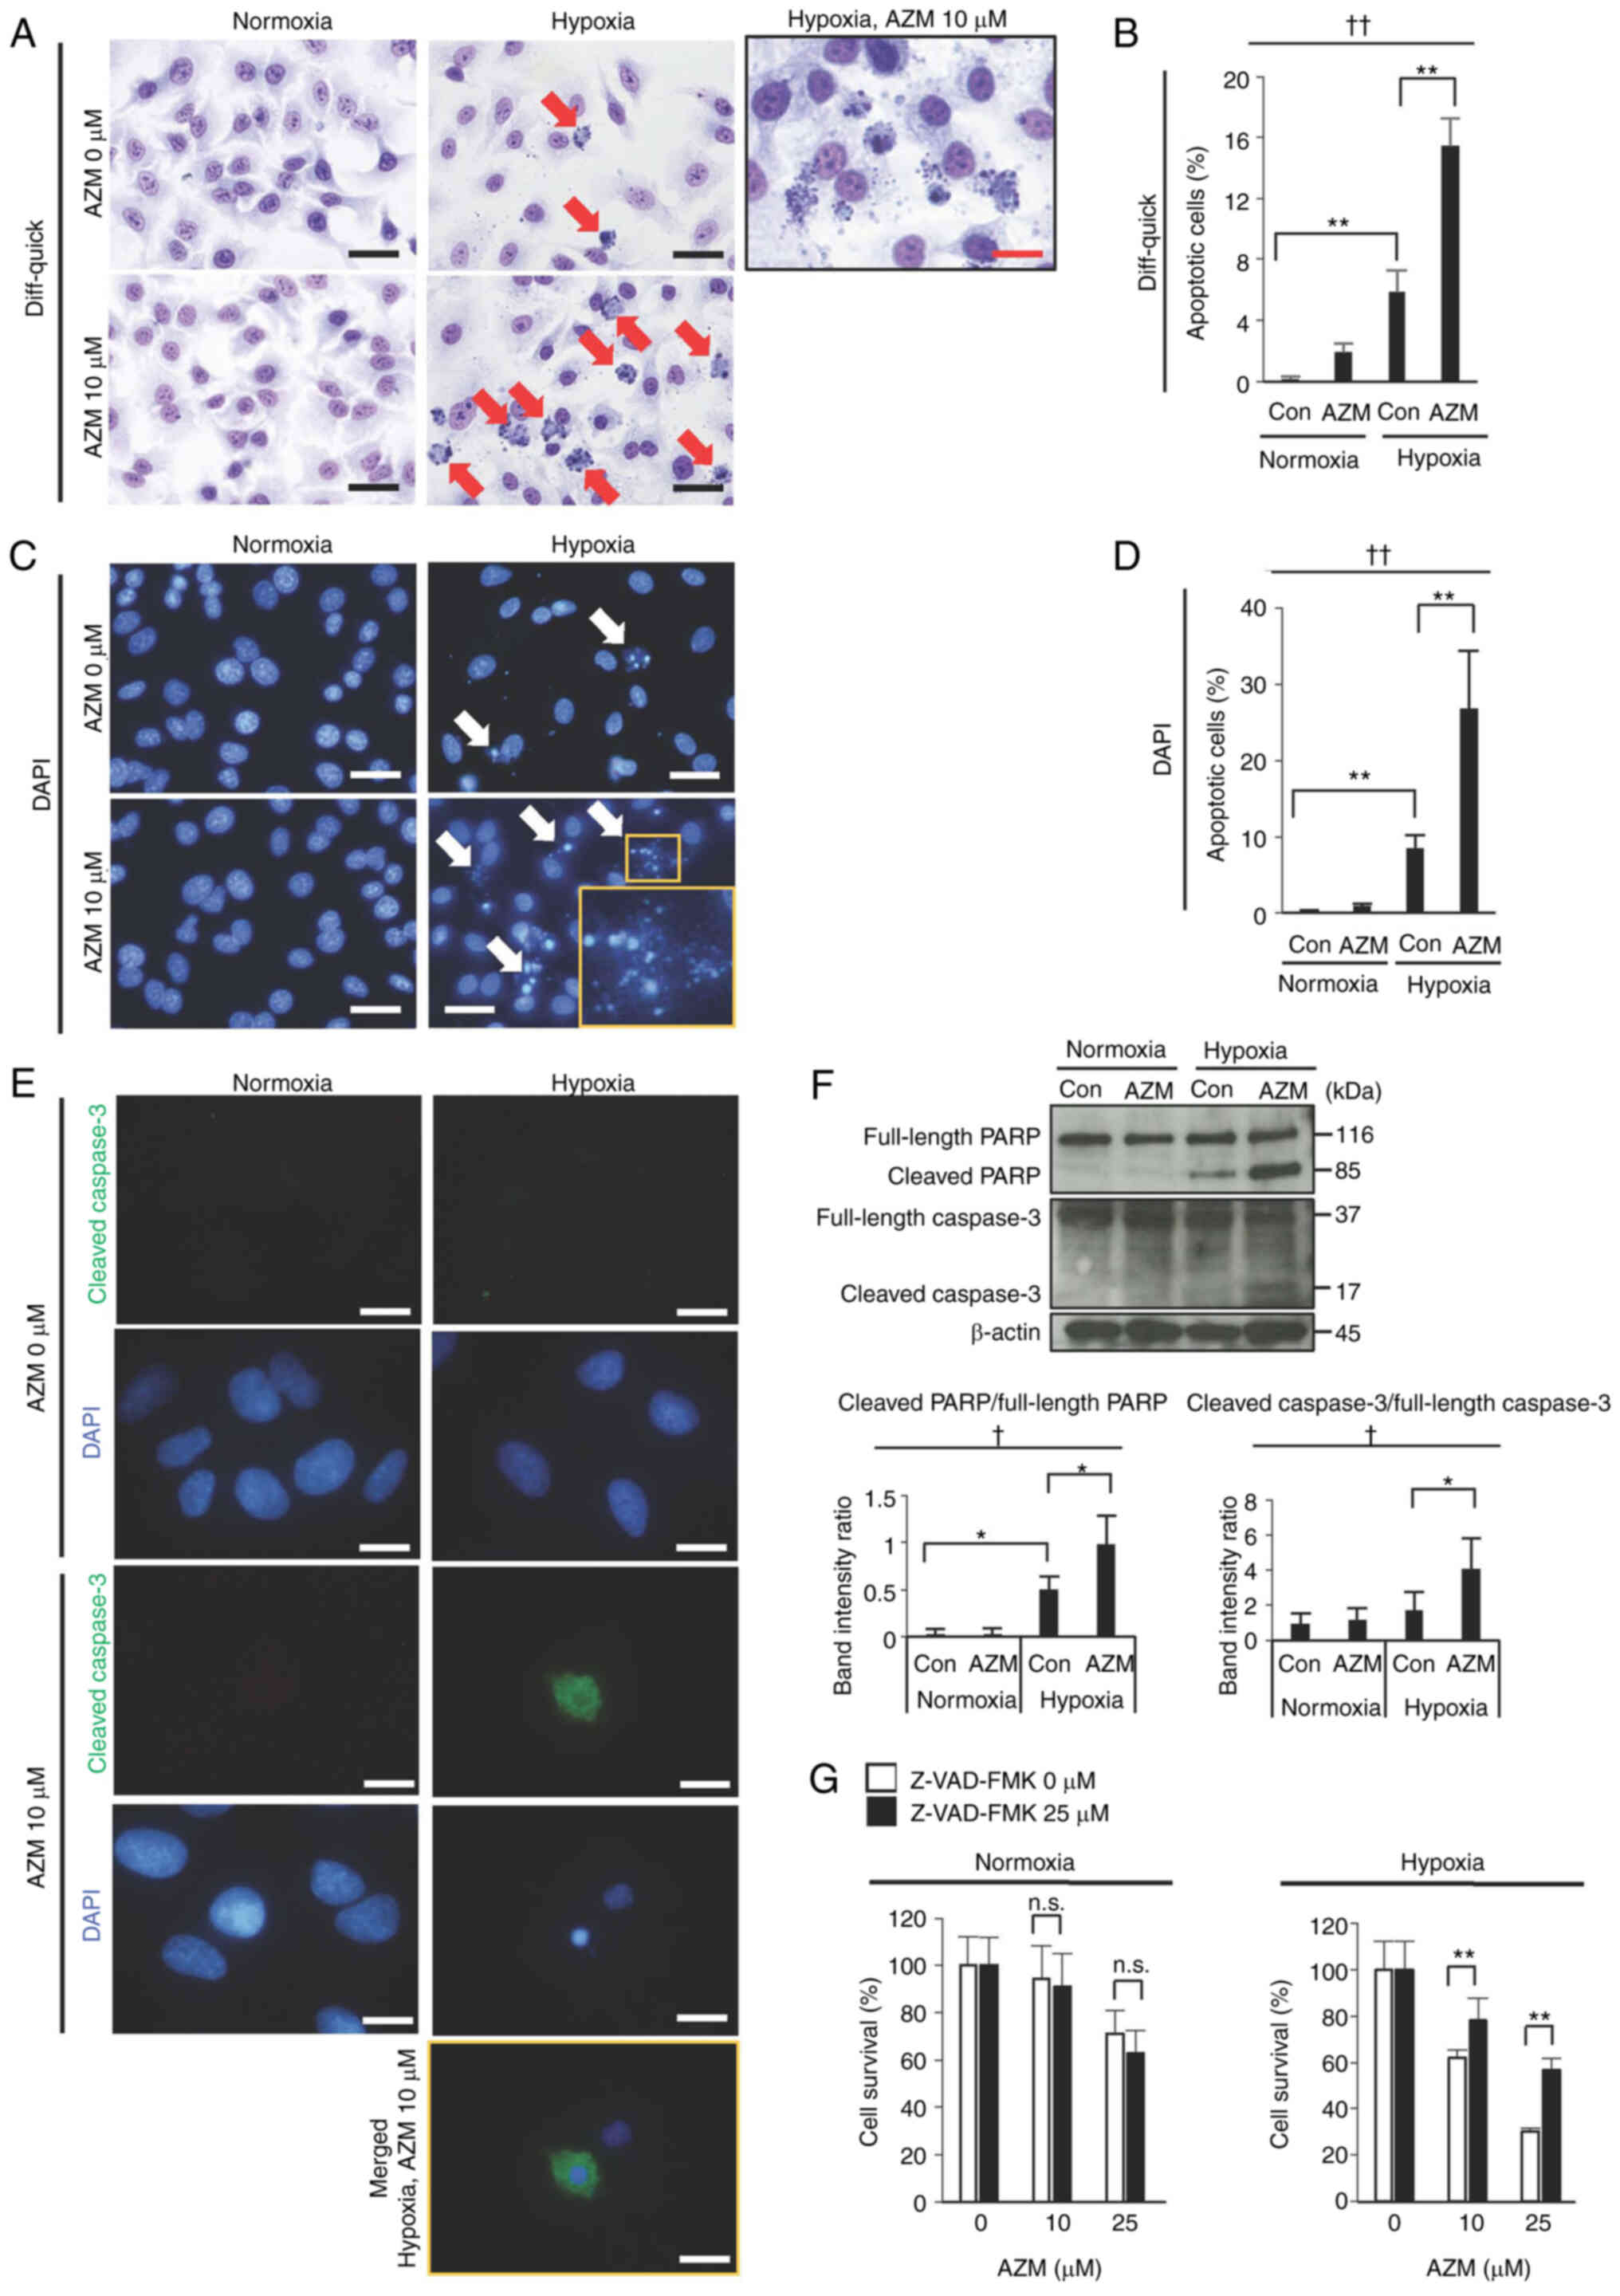 | Figure 2.Effect of AZM on the apoptosis of
A549 cells under normoxia or hypoxia. (A) Representative images of
Diff-quick-stained A549 cells exposed to normoxia (20%
O2) or hypoxia (0.3% O2) for 48 h in the
presence or absence of AZM (10 µM). Red arrows indicate apoptotic
cells exhibiting nuclear condensation and fragmentation with
cytoplasmic shrinkage. The box shows a magnified image of apoptotic
cells observed after hypoxia exposure in the presence of AZM. Black
scale bar, 20 µm; red scale bar, 10 µm. (B) Quantitative analysis
of apoptotic cells in Diff-quick-stained A549 cells exposed to
normoxia (20% O2) or hypoxia (0.3% O2) for 48
h in the presence or absence of AZM (10 µM). Data are presented as
the mean and standard deviation (n=4). ††P<0.01 (one-way ANOVA).
**P<0.01 (Tukey's test). (C) Representative fluorescence
microscopy images of A549 cells exposed to normoxia or hypoxia for
48 h in the presence or absence of AZM (10 µM). Cell nuclei were
stained with DAPI (blue). Scale bar, 20 µm. White arrows indicate
apoptotic cells exhibiting nuclear condensation and fragmentation.
The right lower inset shows a magnified image of apoptotic cells.
(D) Quantitative analysis of apoptotic cells in DAPI-stained A549
cells exposed to normoxia or hypoxia for 48 h in the presence or
absence of AZM (10 µM). Data are presented as the mean and standard
deviation (n=4). ††P<0.01 (one-way ANOVA). **P<0.01 (Tukey's
test). (E) Cells were immunostained with anti-cleaved caspase-3
(green) and counterstained with DAPI (blue). Scale bar, 10 µm. A
merged image is only included for the hypoxia + AZM group because
the other groups showed no positive signal for cleaved caspase-3 in
immunostaining. (F) Western blot analysis of the cleavage of PARP
and caspase-3 in A549 cells exposed to normoxia or hypoxia for 48 h
in the presence or absence of AZM (10 µM). The relative protein
levels were semi-quantified using densitometry and expressed as the
cleaved protein/full-length protein ratio. Data are presented as
the mean and standard deviation (n=4). †P<0.05 (one-way ANOVA).
*P<0.05 (Tukey's test). (G) To examine whether apoptosis is
involved in reduced cell survival under hypoxic conditions with AZM
treatment, A549 cells were exposed to normoxia or hypoxia for 48 h
with or without AZM treatment (10 or 25 µM) in the presence or
absence of Z-VAD-FMK (25 µM). The cell survival rate was calculated
using the Hoechst 33342 DNA quantification assay. Data are
presented as the mean and standard deviation (n=6). The
representative results of three independent experiments are shown.
**P<0.01 vs. cells not treated with Z-VAD-FMK (Welch t-test).
AZM, azithromycin; Con, control; PARP, poly[ADP-ribose]polymerase
1; Z-VAD-FMK,
benzyloxycarbonyl-L-valyl-L-alanyl-[(2S)-2-amino-3-(methoxycarbonyl)propionyl]fluoromethane;
n.s., not significant. |
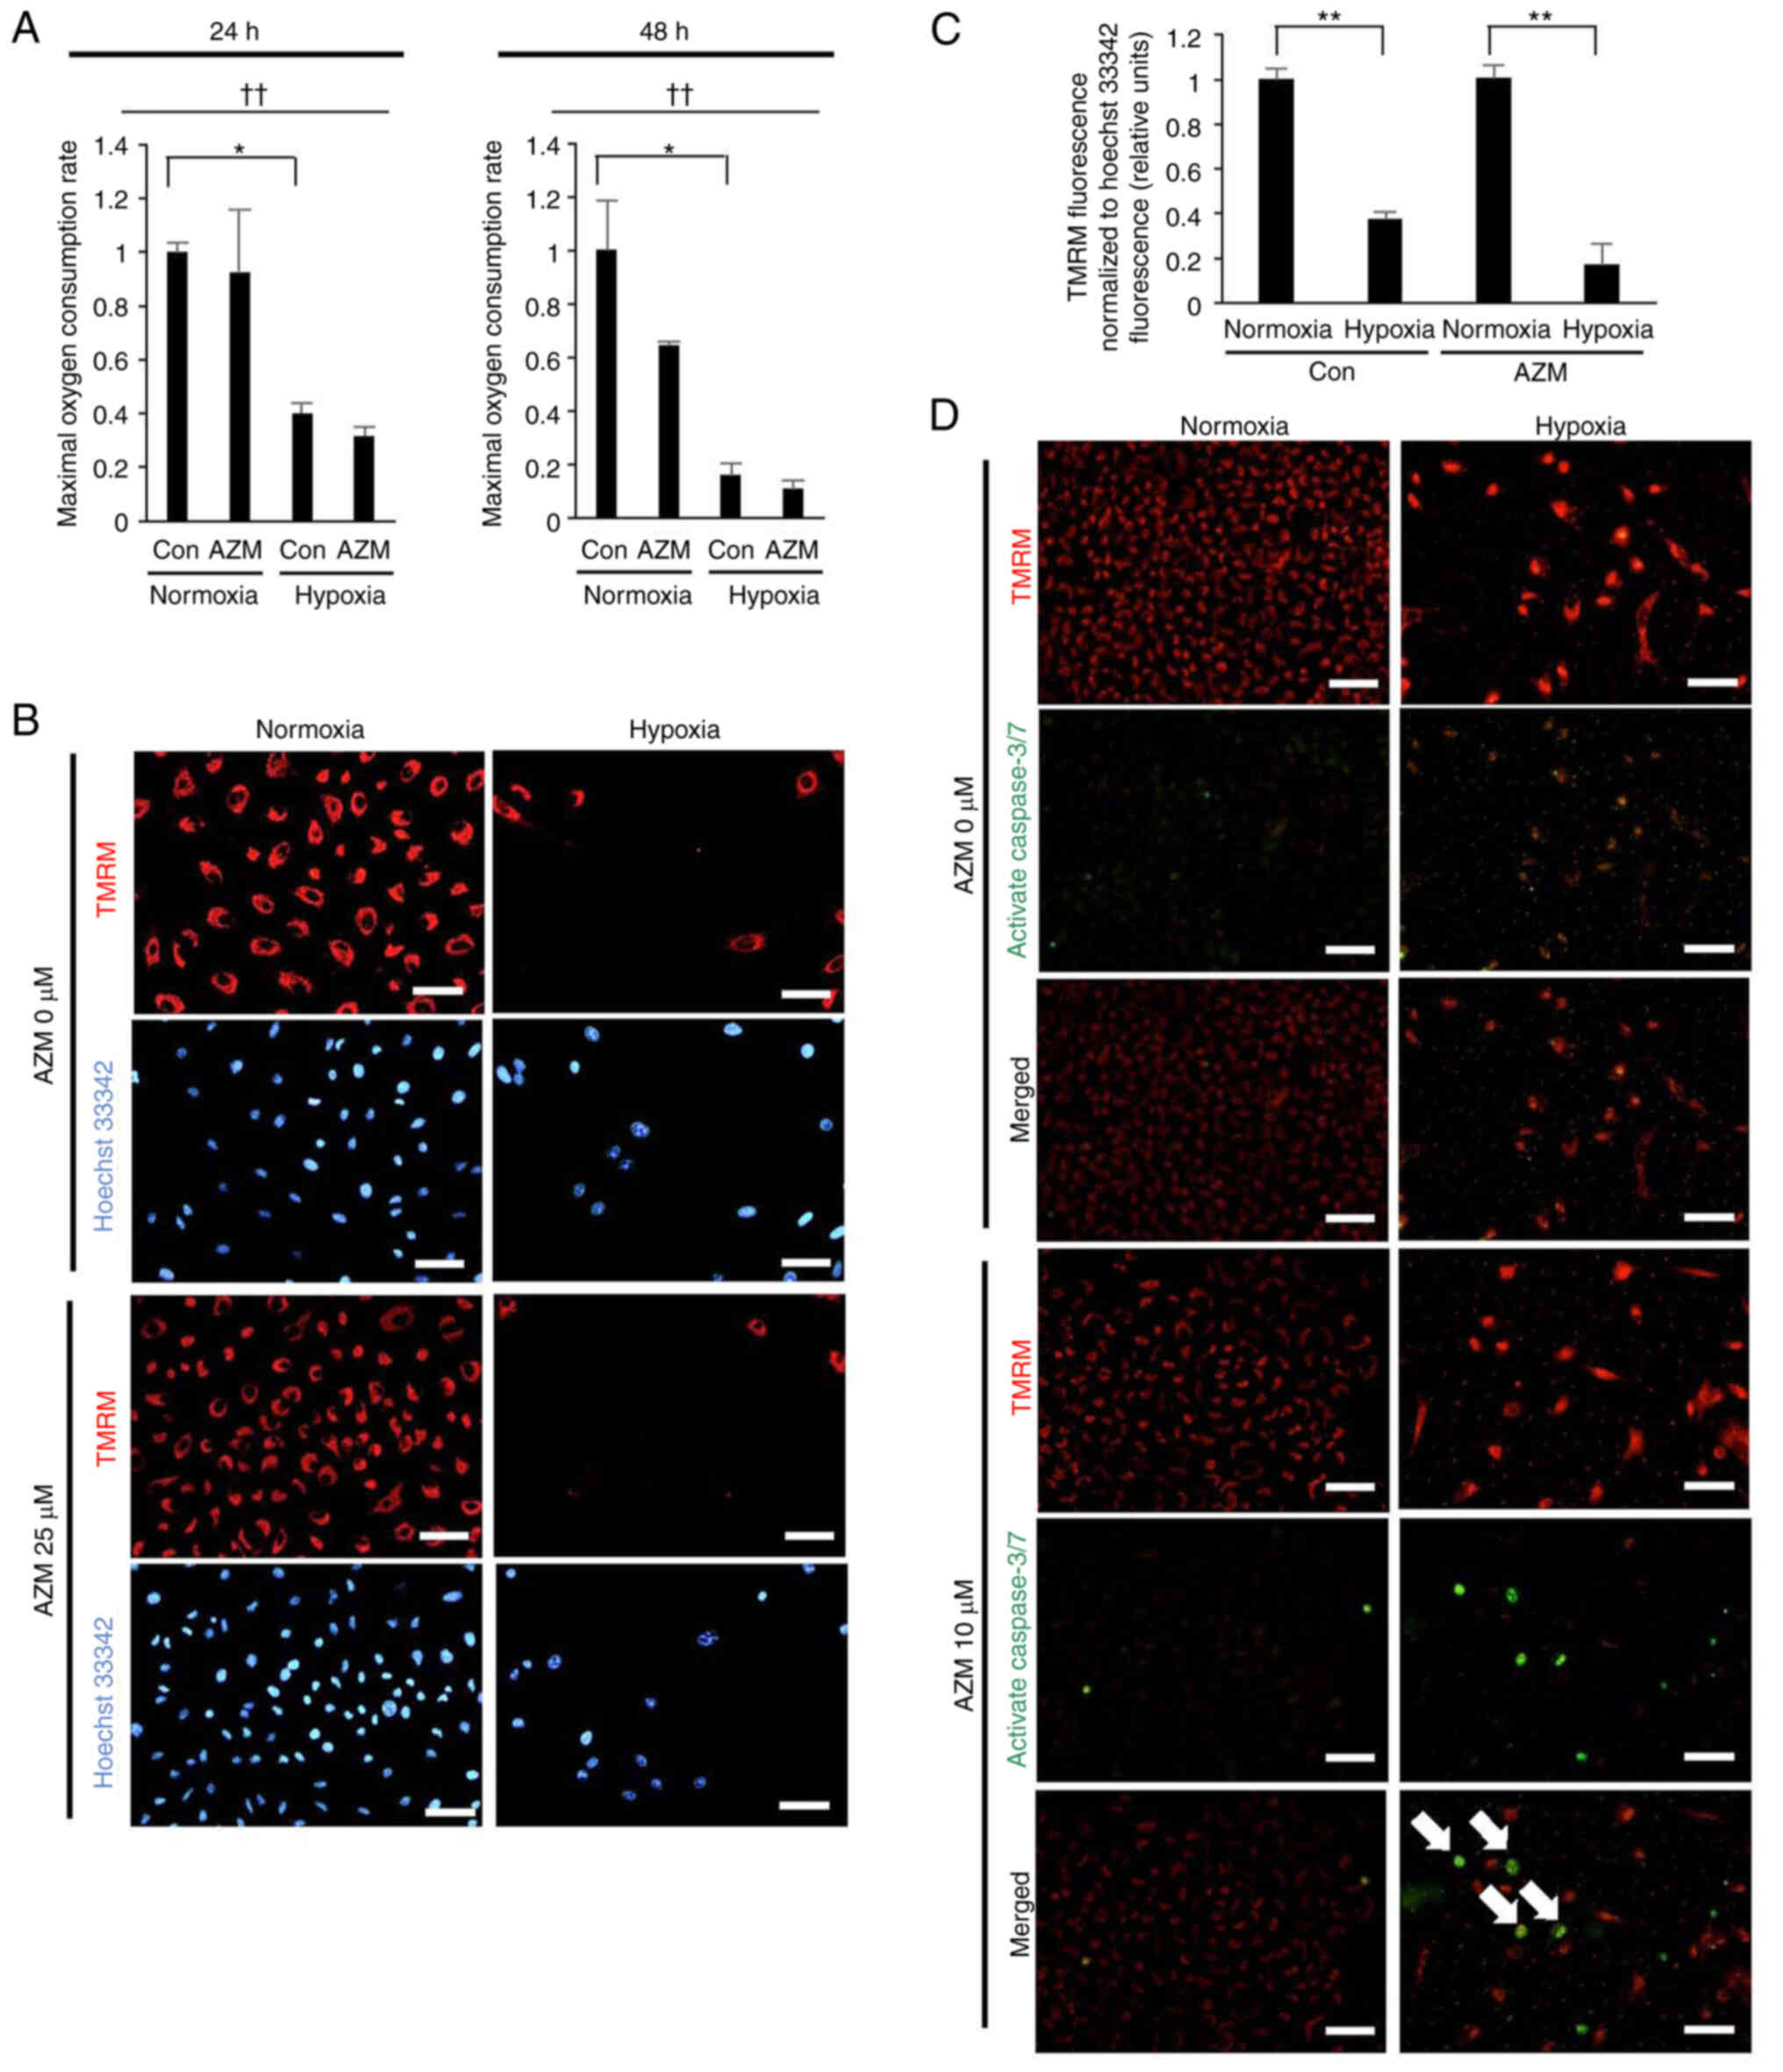
Hypoxia exposure induces sustained
mitochondrial damage
Mitochondrial damage is known to elicit apoptosis
(27); therefore, the effect of
hypoxia exposure on the induction of mitochondrial damage in lung
cancer cells was assessed in this study. The A549 cells, which were
exposed to hypoxia for 24 h or 48 h and had returned to normoxia
for 3 h prior to the assay, exhibited marked reductions in their
maximal oxygen consumption capacity (Fig. 3A) and MMP (Fig. 3B and C). These results indicated
that hypoxia exposure promoted mitochondrial damage that was
sustained even after reoxygenation. Additionally, the loss of MMP
after exposure to hypoxia was associated with apoptosis induction
in the presence, but not absence, of AZM (Fig. 3D), indicating that hypoxia-induced
mitochondrial damage resulted in apoptosis induction only when AZM
was present.
AZM inhibits the autophagy and
mitophagy flux by inducing lysosomal dysfunction in lung cancer
cells exposed to hypoxia
Damaged mitochondria are known to be effectively
removed by mitophagy (28–31). Western blot analyses demonstrated
that hypoxia exposure in the absence of AZM decreased the autophagy
substrate, p62, and the mitochondrial proteins, HSP60 and UQCRC1,
but increased the autophagosomal marker, LC3B-II (Fig. 4A). However, the presence of AZM
inhibited the hypoxia-induced reductions in p62 and HSP60 and
markedly increased the level of LC3B-II, suggesting that AZM
treatment inhibited the autophagy and mitophagy flux promoted by
hypoxia. Fluorescent small molecules that differentially stained
autophagosomes and autolysosomes were used to confirm the findings
of the Western blot analysis. DAL®Green and
DAP®Red cross the plasma membranes of living cells and
are incorporated in the autophagosome. DAL®Green
fluorescence becomes stronger after a lysosome fuses with an
autophagosome due to the increase in the acidity, whereas
DAP®Red fluorescence remains unchanged. The hypoxic A549
cells displayed much stronger DAP®Red fluorescence than
the normoxic cells (which reflected the elevated formation of
autophagosomes and/or autolysosomes) and much stronger
DAL®Green fluorescence with a bright fluorescent
punctate (which was indicative of the formation of acidic
autolysosomes) (Fig. 4B). However,
in the presence of AZM, the hypoxic cells showed weak
DAL®Green fluorescence without any bright fluorescent
punctate while the DAP®Red fluorescence remained
unchanged. These results indicated that hypoxia stimulated the
formation of autophagosome/autolysosomes, whereas AZM treatment
blocked this process. Mtphagy®Dye and
Lyso®Dye, which accumulate in intact mitochondria and
lysosomes, respectively, were used in this study. The mitophagosome
fuses to the lysosome to form a mitolysosome when mitophagy is
induced, and the Mtphagy®Dye emits a strong red
fluorescence due to the resultant acidity. Hypoxic cells
demonstrated brighter Mtphagy®Dye punctate compared to
normoxic cells, indicating a higher number of mitolysosomes
(Fig. 4C). However, in the presence
of AZM, the hypoxia-induced punctuation of Mtphagy®Dye
almost disappeared, proving that AZM treatment had inhibited the
formation of acidic mitolysosomes. Furthermore, the
Lyso®Dye fluorescence was more common in the presence of
AZM than in its absence, irrespective of normoxia and hypoxia
(Fig. 4C). These findings implied
that AZM treatment had blocked acidic mitolysosome formation via
lysosomal dysfunction but not via lysosome disappearance.
Therefore, we next assessed the lysosomal pH using the
pHLys®Red dye, which accumulates in lysosomes, and emits
intense fluorescence, as the acidity increases. As shown in
Fig. 4D, pHLys®Red
fluorescence almost diminished in the presence of AZM, irrespective
of normoxia, or hypoxia exposure, showing that normal lysosome
acidification was impaired by AZM treatment. Overall, these
findings revealed that AZM treatment inhibited hypoxia-induced
mitophagy via lysosomal dysfunction, probably due to the increase
in the lysosomal pH.
 | Figure 4.Effect of AZM on the autophagy and
mitophagy flux under normoxic or hypoxic conditions. A549 cells
were subjected to either normoxia (20% O2) or hypoxia
(0.3% O2) for (B-D) 24 or (A) 48 h in the presence or
absence of AZM (A, 10 µM; B-D, 25 µM). (A) Western blot analysis of
the autophagy substrate p62, the autophagosomal marker LC3B, and
the mitochondrial abundance markers HSP 60 and UQCRC1. Band
intensities were normalized to β-actin expression and data were
summarized in the graphs on the right. Data are presented as the
mean and standard deviation (n=3). †P<0.05 and ††P<0.01
(one-way ANOVA). *P<0.05 and **P<0.01 (Tukey's test). (B)
Representative images for the detection of the autophagy flux by
staining with DAP®Red (red) and DAL®Green
(green). Scale bar, 20 µm. (C) Representative images for the
detection of the mitophagy flux by staining with
Mtphagy®Dye (red) and Lyso®Dye (green). Scale
bar, 20 µm. (D) Representative images for the detection of
lysosomal acidification by staining with pHLys®Red.
Scale bar, 20 µm. AZM, azithromycin; Con, control; HSP 60, heat
shock protein 60; UQCRC1, ubiquinol-cytochrome b-c1 complex subunit
1. |
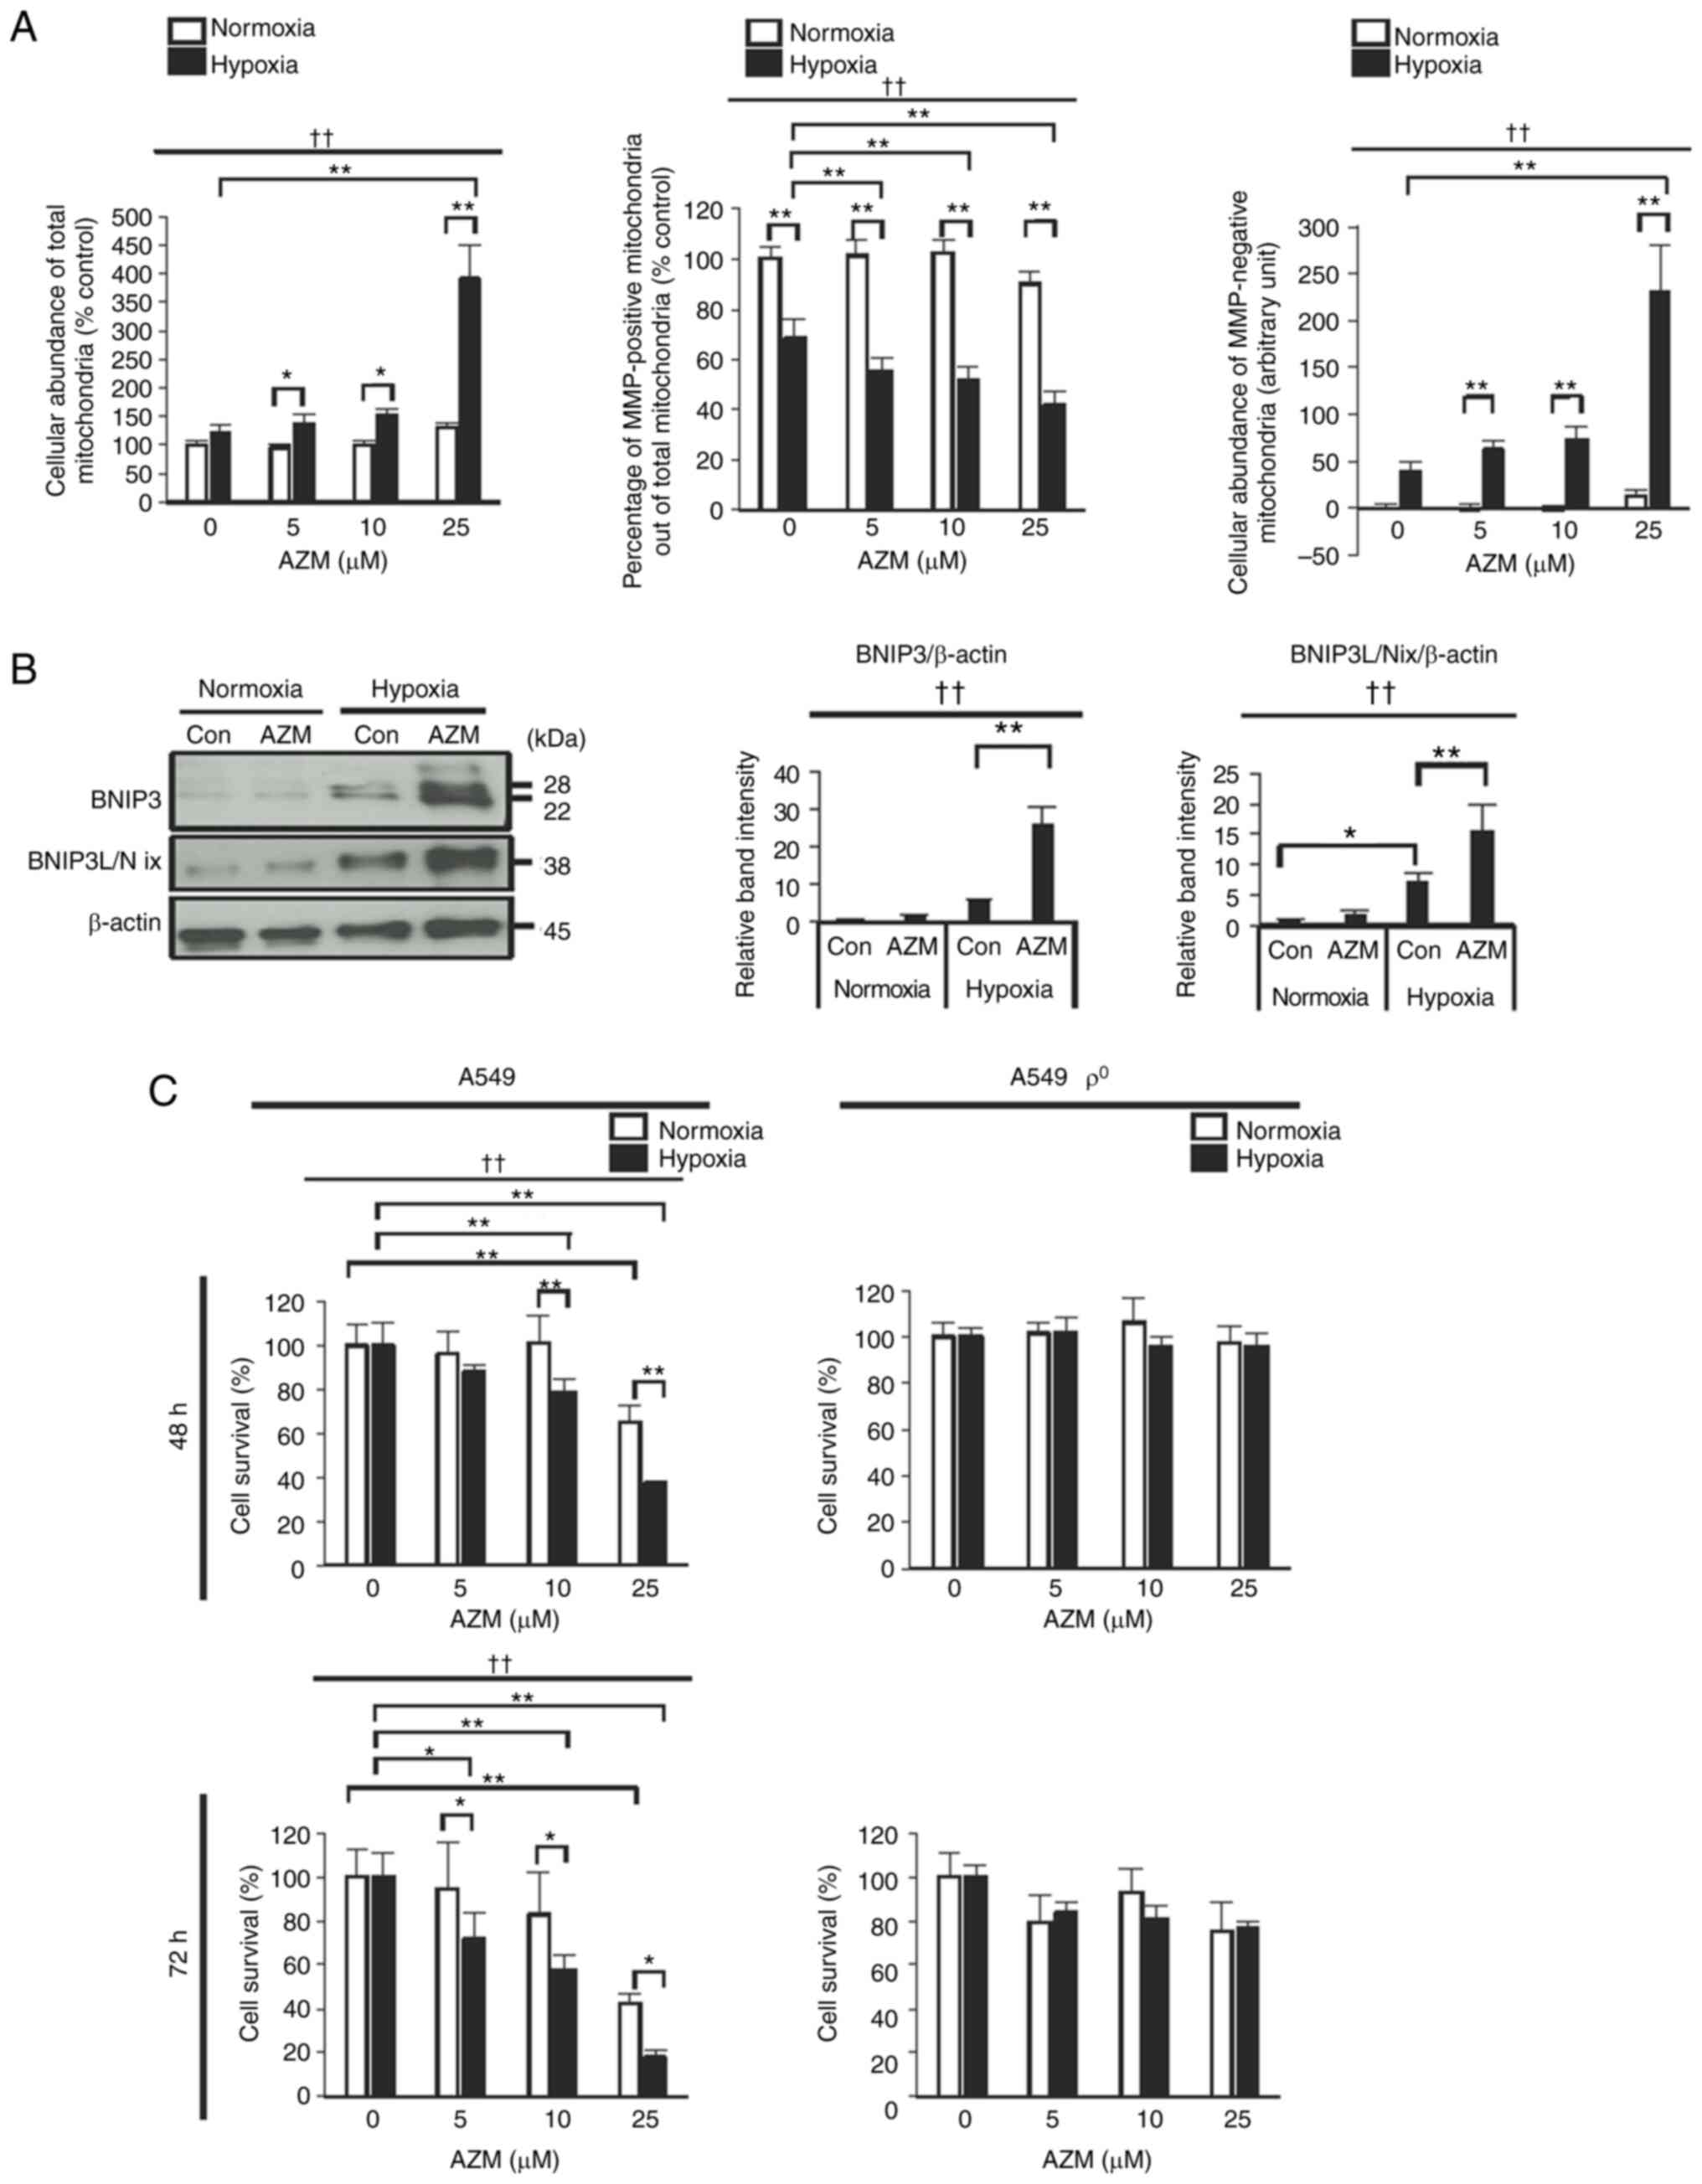
AZM treatment induces the accumulation
of damaged mitochondria under hypoxic conditions
Based on these findings, we assumed that AZM
treatment under hypoxic conditions induced the cellular
accumulation of damaged mitochondria via the inhibition of the
mitophagy flux, which eventually induced apoptosis. To test this
assumption, we estimated the abundance of total mitochondria
(healthy plus damaged mitochondria) stained positive for
Mito®Tracker Green, MMP-positive healthy mitochondria
stained positive for TMRM, and MMP-negative, damaged mitochondria
stained negative for TMRM. Hypoxia exposure in the absence of AZM
decreased the percentage of MMP-positive healthy mitochondria among
all mitochondria (Fig. 5A). Hypoxia
exposure in the presence of AZM decreased the proportion of
MMP-positive healthy mitochondria and markedly increased the
cellular amount of damaged mitochondria and also that of all
mitochondria. These results indicated that hypoxia exposure induced
the cellular accumulation of damaged mitochondria, particularly in
the presence of AZM. The mitophagy cargo receptors BNIP3 and
BNIP3L/Nix, which are highly expressed on the mitochondrial outer
membrane during hypoxia, transmit a mitophagy signal to degrade
mitochondria that are either damaged or superfluous due to reduced
oxygen supply (32–37). Western blot analyses demonstrated
that hypoxia exposure elevated the cellular amounts of BNIP3 and
BNIP3L/Nix, which was more evident in the presence of AZM than in
its absence (Fig. 5B), and
suggested the inhibition of the degradation of mitochondria
expressing BNIP3 and BNIP3L/Nix. Collectively, these results
indicated that the cellular accumulation of damaged mitochondria
observed in hypoxic lung cancer cells was attributable, at least in
part, to the inefficient removal of damaged (or superfluous)
mitochondria due to the AZM-induced inhibition of mitophagy. To
verify if the accumulation of damaged mitochondria (which should
have been targeted for degradation) had caused the increase in the
cell death rare after AZM treatment under hypoxic conditions, we
evaluated the effect of AZM on the survival of
mitochondria-deficient A549 cells (ρ° cells). In contrast to the
control A549 cells, ρ° A549 cells exhibited complete resistance to
AZM cytotoxicity during hypoxia, indicating that mitochondrial
homeostasis disturbances play an important role in the anticancer
effect of AZM under hypoxic conditions (Fig. 5C).
Discussion
In the present study, AZM treatment of lung cancer
cells under hypoxic conditions induced the accumulation of damaged
mitochondria via mitophagy inhibition, eventually leading to
apoptosis. Hypoxia plays a vital role in cancer progression and
therapeutic resistance (38,39).
It is reported to damage mitochondria and activate mitophagy to
remove the organelles (40–42). In line with this, hypoxia exposure
promoted mitochondrial damage in lung cancer cells, which utilized
mitophagy to remove the damaged (or superfluous) organelles to
maintain mitochondrial homeostasis in the current study. More
importantly, AZM exerted anticancer effects under hypoxic
conditions, which was attributed to the AZM-induced mitolysosome
dysfunction and the increase in the lysosomal pH that led to
impaired removal of the damaged mitochondria and eventually induced
apoptosis. Our findings highlight AZM as a promising anticancer
drug that exploits tumor hypoxia and interferes with the
mitochondrial homeostasis required to maintain cell survival under
hypoxic conditions.
The role of mitophagy in tumor biology is complex
and depends on the tumor type and TME (8,9,37).
Mitophagy generally promotes cancer cell survival by removing
damaged mitochondria and reducing reactive oxygen species
production. Conversely, it may reduce the cancer cell survival rate
by inducing mitophagy-dependent cell death. The findings of the
current study display that the activation of mitophagy in cancer
cells exposed to hypoxia provides a self-defense mechanism that
helps their survival. Based on these findings, we propose the
inhibition of mitophagy as a therapeutic target for cancer cells
surviving in hypoxic TMEs.
Hypoxia is the key factor in mitochondrial damage
and dysfunction (28,42). Profound reductions in the
mitochondrial oxygen consumption rate and MMP were observed in the
present study, which persisted after reoxygenation following
hypoxia. Unfortunately, it was not possible to determine whether
the mitochondrial dysfunction was due to hypoxia and/or
hypoxia-reoxygenation damage because the mitochondrial function was
assessed under atmospheric air following hypoxia exposure.
Nonetheless, some regions in solid tumors have been reported to
exhibit chronic hypoxia due to impaired oxygen diffusion, while
others are subjected to transient hypoxia, i.e.,
hypoxia-reoxygenation, due to the cyclic opening and closing of
tumor vessels (39). Furthermore,
hypoxia was found to stimulate the autophagy and mitophagy flux in
the present study, corroborating the findings of a previous study
(41). The hypoxia-stimulated
mitophagy flux appears to be beneficial for hypoxic cancer cells by
eliminating damaged and dysfunctional mitochondria that are
potentially harmful to the cell and adapting the overall
mitochondrial mass to the decreased oxygen supply.
In line with previous studies (including our own)
(14–17,43),
AZM suppressed the autophagy flux in the current study; in
addition, a decrease in the mitophagy flux was observed for the
first time in the present study. AZM treatment induced mitolysosome
dysfunction and an increase in the lysosomal pH. Under hypoxic
conditions, this led to the accumulation of damaged (or
superfluous) mitochondria, which may have induced apoptosis.
Additionally, the increase in the hypoxia-related mitophagy cargo
receptors BNIP3 and BNIP3L/Nix (9,32–37,41) in
the presence of AZM was more marked than that in its absence. These
data are interpreted as follows: hypoxia stimulates the
mitochondrial expression of BNIP3 and BNIP3L/Nix, which transmits a
mitophagy signal to remove damaged (or superfluous) mitochondria;
however, in the presence of AZM, the BNIP3- and
BNIP3L/Nix-expressing mitochondria are accumulated in abnormal
pattern due to blocking of the downstream mitolysosome formation.
The precise molecular mechanism by which AZM inhibits the autophagy
and mitophagy flux remains unclear. In line with the findings of a
previous study (43), AZM impaired
the acidification of auto- and mitolysosomes with raised lysosomal
pH, suggesting that vacuolar (V)-type ATPase may be a candidate
target molecule of AZM therapy. The other potential targets of AZM
therapy reportedly include valosin-containing protein/p97 (44), keratin-18, and α/β-tubulin (19).
Mitochondrial damage is the most well-known inducer
of apoptosis. Therefore, we speculated that AZM treatment
stimulated apoptosis under hypoxic conditions following the
accumulation of damaged mitochondria that were not eliminated due
to the AZM-induced inhibition of mitophagy. In addition to
mitochondrial damage, lysosomal dysfunction is reported to cause
apoptosis that may or may not be dependent on the mitochondria.
Recent studies (including ours) have demonstrated that AZM
treatment induces apoptosis in lung cancer cells exposed to
DNA-damaging drugs via lysosomal membrane permeabilization (LMP) by
lysophagy inhibition (16,45). Lysosome damage may also affect other
types of autophagy, such as endoplasmic reticulum-phagy and
peroxphagy. LMP is capable of inducing apoptosis via the
mitochondria-independent pathway (46). However, mitochondria-independent
mechanisms, such as LMP-mediated non-mitochondrial apoptosis, were
unlikely to play a role in the present study because
mitochondrion-deficient A549 cells (ρ° cells) exhibited complete
resistance to the cytotoxic action of AZM during hypoxia exposure,
validating our notion that the accumulation of damaged mitochondria
plays a primary role in the induction of apoptosis by AZM treatment
under hypoxic conditions.
In the present study, the cytotoxic efficacy of AZM
was estimated differently by Hoechst 33342 DNA quantification and
apoptosis assays. For example, in A549 hypoxic cells treated with
10-µM AZM for 48 h, around 55% of the cells did not survive in the
Hoechst 33342 DNA quantification assay, whereas only 15–25% of then
were found to be apoptotic. Furthermore, in A549 cells treated with
10-µM AZM for 48 h under normoxic conditions, around 30% of the
cells were dead in the Hoechst 33342 DNA quantification assay,
whereas less than 5% of the cells turned out to be apoptotic. We
think there are two possible reasons why the rate of apoptotic cell
death is lower than the percentages of cell death estimated in the
Hoechst 33342 DNA quantification assay. First, apoptotic cells that
had detached from the surfaces of the cell culture plates were
washed away during cell fixation for the Diff-quick and DAPI
staining methods. Second, non-apoptotic cell death, such as
necrosis and necroptosis, was involved in cell death induced by AZM
under normoxic and hypoxic conditions.
Furthermore, there were some variations in cell
survival between different experiments. Although not conclusive,
these variations may be attributed to different cell confluencies.
In additional experiments, we found that cell survival increased as
the initial plating cell density increased. Thus, we suspect that
cell-to-cell contact or cell-derived soluble substances may affect
cell survival and contribute, in part, to the observed variations
in cell survival. However, AZM consistently reduced cell survival
under hypoxic conditions at all the cell densities tested, which
supports our conclusion (data not shown).
Some bleedthrough was observed in the fluorescence
images when cells were co-stained with TMRM and the
CellEvent® caspase-3/7 green detection reagent,
following treatment with AZM for 48 h. This was the result of the
optical system on our microscope; however, this did not affect the
interpretation of the results. We could not quantify the results of
the detection of the autophagy flux by staining with
DAP®Red and DAL®Green and the detection of
the mitophagy flux by staining with Mtphagy®Dye and
Lyso®Dye because of the following technical reasons.
First, the fluorescence intensities from fluorochromes were too
weak to be measured using a conventional microplate fluorometer.
Second, it was difficult to count the number of small fluorescent
punctuates, which indicated increased formation of acidic
autolysosomes, using a fluorescent microscope, because they were
some and often formed aggregates.
In contrast to the control A549 cells, ρ° A549 cells
exhibited complete resistance to AZM cytotoxicity during hypoxia.
We interpreted the results of the experiments with ρ° A549 cells as
follows: no mitochondrial DNA => no mitochondrial translation
=> no functional mitochondria => no mitochondrial respiration
or electron transfer => hypoxia resistance => resistance to
AZM under hypoxia. We believe that AZM resistance during hypoxia in
ρ° A549 cells indicates that disturbances in functional
mitochondria in control A549 cells play an important role in the
anticancer effect of AZM under hypoxic conditions.
In addition to its high cytotoxic effect under
hypoxic conditions, AZM exerted weak but significant cytotoxicity
under normoxic conditions without any strong induction of
apoptosis. Furthermore, the cytotoxic effect of AZM under hypoxic
conditions was not completely abolished in the presence of the
pan-caspase inhibitor, Z-VAD-FMK. These findings suggest that AZM
may promote apoptotic and non-apoptotic cell death. For example,
previous studies showed that AZM potentiated the anticancer effects
of epidermal growth factor receptor tyrosine kinase inhibitors and
lansoprazole by inducing necroptosis (14) and necrosis (47), respectively.
In the present study, H1299 and HCI-H441 cells were
less susceptible to the cytotoxic effect of AZM under hypoxic
conditions than A549 cells. The reasons for the different
susceptibilities between the cell lines remain unclear. However,
the lower susceptibilities of H1299 and NCI-H441 cells to AZM
cytotoxicity under hypoxic conditions may be the result of genetic
deletion because they carry a mutant p53 gene, whereas A549 cells
carry a wild-type p53 gene (48).
Hypoxia in the TME is proposed to be a new target
for cancer therapy. Hypoxia-targeted drugs in pre-clinical and
clinical trials include nanoparticle oxygen carriers and
generators, hypoxia-activated prodrugs, and hypoxia-inducible
factor (HIF) inhibitors (5,6). However, many of these compounds cannot
be used due to side effects or failure in the aforementioned
studies. Furthermore, HIF inhibition, arguably the most attractive
tactics, could have serious side effects because HIFs are highly
expressed in cancer cells and some normal tissues. AZM has been
widely and safely used in clinical practice to treat infectious and
non-infectious diseases, such as bacterial infection, and
bronchiectasis. A recent in vivo study using a murine xenograft
model with A549 cells revealed that daily oral AZM administration
suppressed autophagy and the growth of tumor cells; however, the
relation between this effect and tumor hypoxia was not determined
(19).
In conclusion, this study shows, for the first time,
that AZM can target mitochondrial damage in hypoxic tumor cells by
inhibiting mitophagy. Additional studies are required to validate
these findings and determine their effect in the clinical
setting.
Acknowledgements
The authors would like to thank Mrs. Eriko Kurosawa
(Tokyo Medical University Ibaraki Medical Center, Ami-machi,
Ibaraki, Japan) for providing technical assistance.
Funding
This work was supported by a Grant-in-Aid for Scientific
Research from the Ministry of Education and Science, Japan (grant
no. 21K08189); Nippon Boelinger Ingelheim Co., Ltd., Chugai
Pharmaceutical Co., Ltd.; Daiichi Sankyo, Inc.; Kyowa Kirin Co.,
Ltd.; Eli Lilly Japan K. K.; Shionogi & Co., Ltd.; and Takeda
Pharmaceutical Co., Ltd.
Availability of data and materials
The datasets used and/or analyzed during the current
study are available from the corresponding author on reasonable
request.
Authors' contributions
KT and KA conceived and designed the project,
acquired, analyzed and interpreted the data, and wrote the original
draft. TO, SA and HN analyzed and interpreted the data. KT and KA
confirmed the authenticity of all the raw data. All authors read
and approved the final manuscript.
Ethics approval and consent to
participate
Not applicable.
Patient consent for publication
Not applicable.
Competing interests
The authors declare that they have no competing
interests.
Glossary
Abbreviations
Abbreviations:
|
AZM
|
azithromycin
|
|
BNIP3
|
Bcl-2/E1B-19kDa interacting protein
3
|
|
BNIP3L/Nix
|
Bcl-2/E1B-19kDa interacting protein
3-like
|
|
Em
|
emission wavelength
|
|
Ex
|
excitation wavelength
|
|
HIF
|
hypoxia-inducible factor
|
|
HSP 60
|
heat shock protein 60
|
|
LMP
|
lysosomal membrane
permeabilization
|
|
MMP
|
mitochondrial membrane potential
|
|
TME
|
tumor microenvironment
|
|
TMRM
|
tetramethylrhodaminemethyl ester
|
|
UQCRC1
|
ubiquinol-cytochrome β-c1 complex
subunit 1
|
References
|
1
|
Vaupel P, Mayer A and Höckel M: Tumor
hypoxia and malignant progression. Methods Enzymol. 381:335–354.
2004. View Article : Google Scholar : PubMed/NCBI
|
|
2
|
Finicle BT, Jayashankar V and Edinger AL:
Nutrient scavenging in cancer. Nat Rev Cancer. 18:619–633. 2018.
View Article : Google Scholar : PubMed/NCBI
|
|
3
|
Jain RK: Antiangiogenesis strategies
revisited: From starving tumors to alleviating hypoxia. Cancer
Cell. 26:605–622. 2014. View Article : Google Scholar : PubMed/NCBI
|
|
4
|
Whatcott CJ, Han H and Von Hoff DD:
Orchestrating the tumor microenvironment to improve survival for
patients with pancreatic cancer: Normalization, not destruction.
Cancer J. 21:299–306. 2015. View Article : Google Scholar : PubMed/NCBI
|
|
5
|
Chen Z, Han F, Du Y, Shi H and Zhou W:
Hypoxic microenvironment in cancer: Molecular mechanisms and
therapeutic interventions. Signal Transduct Target Ther. 8:702023.
View Article : Google Scholar : PubMed/NCBI
|
|
6
|
Zhuang Y, Liu K, He Q, Gu X, Jiang C and
Wu J: Hypoxia signaling in cancer: Implications for therapeutic
interventions. MedComm (2020). 4:e2032023.PubMed/NCBI
|
|
7
|
Mizushima N and Komatsu M: Autophagy:
Renovation of cells and tissues. Cell. 147:728–741. 2011.
View Article : Google Scholar : PubMed/NCBI
|
|
8
|
Levy JMM, Towers CG and Thorburn A:
Targeting autophagy in cancer. Nat Rev Cancer. 17:528–542. 2017.
View Article : Google Scholar : PubMed/NCBI
|
|
9
|
Xie Y, Liu J, Kang R and Tang D: Mitophagy
receptors in tumor biology. Front Cell Dev Biol. 8:5942032020.
View Article : Google Scholar : PubMed/NCBI
|
|
10
|
Green DR and Llambi F: Cell death
signaling. Cold Spring Harb Perspect Biol. 7:a0060802015.
View Article : Google Scholar : PubMed/NCBI
|
|
11
|
Denton D and Kumar S: Autophagy-dependent
cell death. Cell Death Differ. 26:605–616. 2019. View Article : Google Scholar : PubMed/NCBI
|
|
12
|
Hassan SN, Mohamed Yusoff AA, Idris Z,
Mohd Redzwan N and Ahmad F: A mini-review on anticancer-related
properties of azithromycin and its potential activities in
overcoming the challenges of glioblastoma. Fundam Clin Pharmacol.
37:918–927. 2023. View Article : Google Scholar : PubMed/NCBI
|
|
13
|
Moriya S, Komatsu S, Yamasaki K, Kawai Y,
Kokuba H, Hirota A, Che X, Inazu M, Gotoh A, Hiramoto M and
Miyazawa K: Targeting the integrated networks of aggresome
formation, proteasome, and autophagy potentiates ER stress-mediated
cell death in multiple myeloma cells. Int J Oncol. 46:474–486.
2015. View Article : Google Scholar : PubMed/NCBI
|
|
14
|
Mukai S, Moriya S, Hiramoto M, Kazama H,
Kokuba H, Che X, Yokoyama T, Sakamoto S, Sugawara A, Sunazuka T, et
al: Macrolides sensitize EGFR-TKI-induced non-apoptotic cell death
via blocking autophagy flux in pancreatic cancer cell lines. Int J
Oncol. 48:45–54. 2016. View Article : Google Scholar : PubMed/NCBI
|
|
15
|
Tanaka H, Hino H, Moriya S, Kazama H,
Miyazaki M, Takano N, Hiramoto M, Tsukahara K and Miyazawa K:
Comparison of autophagy inducibility in various tyrosine kinase
inhibitors and their enhanced cytotoxicity via inhibition of
autophagy in cancer cells in combined treatment with azithromycin.
Biochem Biophys Rep. 22:1007502020.PubMed/NCBI
|
|
16
|
Toriyama K, Takano N, Kokuba H, Kazama H,
Moriya S, Hiramoto M, Abe S and Miyazawa K: Azithromycin enhances
the cytotoxicity of DNA-damaging drugs via lysosomal membrane
permeabilization in lung cancer cells. Cancer Sci. 112:3324–3337.
2021. View Article : Google Scholar : PubMed/NCBI
|
|
17
|
Qiao X, Wang X, Shang Y, Li Y and Chen SZ:
Azithromycin enhances anticancer activity of TRAIL by inhibiting
autophagy and up-regulating the protein levels of DR4/5 in colon
cancer cells in vitro and in vivo. Cancer Commun (Lond).
38:432018.PubMed/NCBI
|
|
18
|
Asakura E, Nakayama H, Sugie M, Zhao YL,
Nadai M, Kitaichi K, Shimizu A, Miyoshi M, Takagi K, Takagi K and
Hasegawa T: Azithromycin reverses anticancer drug resistance and
modifies hepatobiliary excretion of doxorubicin in rats. Eur J
Pharmacol. 484:333–339. 2004. View Article : Google Scholar : PubMed/NCBI
|
|
19
|
Takano N, Hiramoto M, Yamada Y, Kokuba H,
Tokuhisa M, Hino H and Miyazawa K: Azithromycin, a potent autophagy
inhibitor for cancer therapy, perturbs cytoskeletal protein
dynamics. Br J Cancer. 128:1838–1849. 2023. View Article : Google Scholar : PubMed/NCBI
|
|
20
|
Fiorillo M, Tóth F, Sotgia F and Lisanti
MP: Doxycycline, azithromycin and vitamin C (DAV): A potent
combination therapy for targeting mitochondria and eradicating
cancer stem cells (CSCs). Aging (Albany NY). 11:2202–2216. 2019.
View Article : Google Scholar : PubMed/NCBI
|
|
21
|
Ozkan T, Hekmatshoar Y, Karabay AZ, Koc A,
Altinok Gunes B, Karadag Gurel A and Sunguroglu A: Assessment of
azithromycin as an anticancer agent for treatment of imatinib
sensitive and resistant CML cells. Leuk Res. 102:1065232021.
View Article : Google Scholar : PubMed/NCBI
|
|
22
|
Hassan SN, Mohamed Yusoff AA, Idris Z,
Mohd Redzwan N and Ahmad F: Exploring the cytotoxicity and
anticancer effects of doxycycline and azithromycin on human
glioblastoma multiforme cells. Neurol Res. 44:242–251. 2022.
View Article : Google Scholar : PubMed/NCBI
|
|
23
|
Hill BG, Benavides GA, Lancaster JR Jr,
Ballinger S, Dell'talia L, Jianhua Z and Darley-Usmar VM:
Integration of cellular bioenergetics with mitochondrial quality
control and autophagy. Biol Chem. 393:1485–1512. 2012. View Article : Google Scholar : PubMed/NCBI
|
|
24
|
Brar SS, Meyer JN, Bortner CD, Van Houten
B and Martin WJ II: Mitochondrial DNA-depleted A549 cells are
resistant to bleomycin. Am J Physiol Lung Cell Mol Physiol.
303:L413–L424. 2012. View Article : Google Scholar : PubMed/NCBI
|
|
25
|
Kikuchi R, Iwai Y, Tsuji T, Watanabe Y,
Koyama N, Yamaguchi K, Nakamura H and Aoshiba K: Hypercapnic tumor
microenvironment confers chemoresistance to lung cancer cells by
reprogramming mitochondrial metabolism in vitro. Free Radic Biol
Med. 134:200–214. 2019. View Article : Google Scholar : PubMed/NCBI
|
|
26
|
Kanda Y: Investigation of the freely
available easy-to-use software ‘EZR’ for medical statistics. Bone
Marrow Transplant. 48:452–458. 2013. View Article : Google Scholar : PubMed/NCBI
|
|
27
|
Ricci C, Pastukh V, Leonard J, Turrens J,
Wilson G, Schaffer D and Schaffer SW: Mitochondrial DNA damage
triggers mitochondrial-superoxide generation and apoptosis. Am J
Physiol Cell Physiol. 294:C413–C422. 2008. View Article : Google Scholar : PubMed/NCBI
|
|
28
|
Sulkshane P, Ram J, Thakur A, Reis N,
Kleifeld O and Glickman MH: Ubiquitination and receptor-mediated
mitophagy converge to eliminate oxidation-damaged mitochondria
during hypoxia. Redox Biol. 45:1020472021. View Article : Google Scholar : PubMed/NCBI
|
|
29
|
Liu L, Feng D, Chen G, Chen M, Zheng Q,
Song P, Ma Q, Zhu C, Wang R, Qi W, et al: Mitochondrial
outer-membrane protein FUNDC1 mediates hypoxia-induced mitophagy in
mammalian cells. Nat Cell Biol. 14:177–185. 2012. View Article : Google Scholar : PubMed/NCBI
|
|
30
|
Band M, Joel A, Hernandez A and Avivi A:
Hypoxia-induced BNIP3 expression and mitophagy: In vivo comparison
of the rat and the hypoxia-tolerant mole rat, Spalax ehrenbergi.
FASEB J. 23:2327–2335. 2009. View Article : Google Scholar : PubMed/NCBI
|
|
31
|
Zhang H, Bosch-Marce M, Shimoda LA, Tan
YS, Baek JH, Wesley JB, Gonzalez FJ and Semenza GL: Mitochondrial
autophagy is an HIF-1-dependent adaptive metabolic response to
hypoxia. J Biol Chem. 283:10892–10903. 2008. View Article : Google Scholar : PubMed/NCBI
|
|
32
|
Fu ZJ, Wang ZY, Xu L, Chen XH, Li XX, Liao
WT, Ma HK, Jiang MD, Xu TT, Xu J, et al: HIF-1α-BNIP3-mediated
mitophagy in tubular cells protects against renal
ischemia/reperfusion injury. Redox Biol. 36:1016712020. View Article : Google Scholar : PubMed/NCBI
|
|
33
|
Li Y, Zheng W, Lu Y, Zheng Y, Pan L, Wu X,
Yuan Y, Shen Z, Ma S, Zhang X, et al: BNIP3L/NIX-mediated
mitophagy: Molecular mechanisms and implications for human disease.
Cell Death Dis. 13:142021. View Article : Google Scholar : PubMed/NCBI
|
|
34
|
Shao Y, Liu Z, Liu J, Wang H, Huang L, Lin
T, Liu J, Wei Q, Zeng H, He G and Li X: Expression and epigenetic
regulatory mechanism of BNIP3 in clear cell renal cell carcinoma.
Int J Oncol. 54:348–360. 2019.PubMed/NCBI
|
|
35
|
Zhang J and Ney PA: Role of BNIP3 and NIX
in cell death, autophagy, and mitophagy. Cell Death Differ.
16:939–946. 2009. View Article : Google Scholar : PubMed/NCBI
|
|
36
|
Sowter HM, Ratcliffe PJ, Watson P,
Greenberg AH and Harris AL: HIF-1-dependent regulation of hypoxic
induction of the cell death factors BNIP3 and NIX in human tumors.
Cancer Res. 61:6669–6673. 2001.PubMed/NCBI
|
|
37
|
Poole LP and Macleod KF: Mitophagy in
tumorigenesis and metastasis. Cell Mol Life Sci. 78:3817–3851.
2021. View Article : Google Scholar : PubMed/NCBI
|
|
38
|
Jing X, Yang F, Shao C, Wei K, Xie M, Shen
H and Shu Y: Role of hypoxia in cancer therapy by regulating the
tumor microenvironment. Mol Cancer. 18:1572019. View Article : Google Scholar : PubMed/NCBI
|
|
39
|
Li Y, Zhao L and Li XF: Hypoxia and the
tumor microenvironment. Technol Cancer Res Treat.
20:153303382110363042021. View Article : Google Scholar : PubMed/NCBI
|
|
40
|
Sun Y, Wen F, Yan C, Su L, Luo J, Chi W
and Zhang S: Mitophagy protects the retina against anti-vascular
endothelial growth factor therapy-driven hypoxia via
hypoxia-inducible factor-1α signaling. Front Cell Dev Biol.
9:7278222021. View Article : Google Scholar : PubMed/NCBI
|
|
41
|
Daskalaki I, Gkikas I and Tavernarakis N:
Hypoxia and selective autophagy in cancer development and therapy.
Front Cell Dev Biol. 6:1042018. View Article : Google Scholar : PubMed/NCBI
|
|
42
|
Wang S, Tan J, Miao Y and Zhang Q:
Mitochondrial dynamics, mitophagy, and mitochondria-endoplasmic
reticulum contact sites crosstalk under hypoxia. Front Cell Dev
Biol. 10:8482142022. View Article : Google Scholar : PubMed/NCBI
|
|
43
|
Renna M, Schaffner C, Brown K, Shang S,
Tamayo MH, Hegyi K, Grimsey NJ, Cusens D, Coulter S, Cooper J, et
al: Azithromycin blocks autophagy and may predispose cystic
fibrosis patients to mycobacterial infection. J Clin Invest.
121:3554–3563. 2011. View Article : Google Scholar : PubMed/NCBI
|
|
44
|
Nujić K, Smith M, Lee M, Belamarić D,
Tomašković L, Alihodžić S, Malnar I, Polančec D, Schneider K and
Eraković Haber V: Valosin containing protein (VCP) interacts with
macrolide antibiotics without mediating their anti-inflammatory
activities. Eur J Pharmacol. 677:163–172. 2012. View Article : Google Scholar : PubMed/NCBI
|
|
45
|
Yamashita G, Takano N, Kazama H, Tsukahara
K and Miyazawa K: p53 regulates lysosomal membrane permeabilization
as well as cytoprotective autophagy in response to DNA-damaging
drugs. Cell Death Discov. 8:5022022. View Article : Google Scholar : PubMed/NCBI
|
|
46
|
Johansson AC, Appelqvist H, Nilsson C,
Kågedal K, Roberg K and Öllinger K: Regulation of
apoptosis-associated lysosomal membrane permeabilization.
Apoptosis. 15:527–540. 2010. View Article : Google Scholar : PubMed/NCBI
|
|
47
|
Takeda A, Takano N, Kokuba H, Hino H,
Moriya S, Abe A, Hiramoto M, Tsukahara K and Miyazawa K: Macrolide
antibiotics enhance the antitumor effect of lansoprazole resulting
in lysosomal membrane permeabilization-associated cell death. Int J
Oncol. 57:1280–1292. 2020. View Article : Google Scholar : PubMed/NCBI
|
|
48
|
Lai SL, Perng RP and Hwang J: p53 gene
status modulates the chemosensitivity of non-small cell lung cancer
cells. J Biomed Sci. 7:64–70. 2000. View Article : Google Scholar : PubMed/NCBI
|