Introduction
Prostate cancer is a malignancy that seriously
threatens men's health and ranks second in the cancer incidence
rate in men worldwide. The incidence of prostate cancer in China is
increasing, the age-standardized incidence rate of prostate cancer
was 17.3 individuals in 100,000 in 2019 in China, which was a 95.2%
rise compared with 1990 (1,2). Surgery and radiotherapy are the
standard treatments for early-stage prostate cancer. However,
patients with advanced or metastatic prostate cancer require
androgen deprivation therapy, which includes surgery or medical
castration (3). Prostate cancer
commonly leads to bone metastasis, which is the main cause of
morbidity and mortality in patients (4,5).
Therefore, it is necessary to investigate the molecular mechanism
of prostate cancer metastasis and develop novel therapeutic
approaches to inhibit the invasion and metastasis of prostate
cancer cells.
Heparanase (HPSE) is a β-D-endoglycosidase (also
referred to as an endo-β-D-glucuronidase) that degrades the heparan
sulfate (HS) side chain of HS proteoglycans (HSPGs) (6). HSPGs are a dynamic structural
component that are widely distributed on the cell surface and in
the extracellular matrix (ECM) (7).
Active HPSE is associated with various diseases, including cancer
(8). Furthermore, HPSE is
upregulated in almost all malignant tumor tissues (9) and is commonly associated with the
tumor microenvironment (10).
Myeloid cell leukemia-1 (MCL-1) is an antiapoptotic
member of the Bcl-2 family (11).
MCL-1 is mainly located in the cytoplasm and mitochondria and
interacts with proapoptotic proteins, including
phorbol-12-myristate-13-acetate-induced protein 1, Bcl-2-like
protein 11, Bcl-2 homologous antagonist/killer (BAK) and Bax, to
exert antiapoptotic effects (12).
The stability and functional activity of MCL-1 are regulated via
phosphorylation modifications (13). Moreover, MCL-1 is upregulated in
cancer following genetic, epigenetic or signaling pathway
alterations (14). Upregulation of
MCL-1 can inhibit tumor cell apoptosis and improve tumor cell
resistance to chemotherapy drugs (15). Furthermore, MCL-1 is highly
expressed in prostate cancer, particularly in metastatic prostate
cancer, and therefore inhibiting MCL-1 promotes prostate cancer
cell apoptosis and improves the chemotherapy sensitivity of
prostate cancer cells (16).
In the present study, the expression profiles of
HPSE and its correlation with MCL-1 in prostate cancer were
investigated using The Cancer Genome Atlas (TCGA) database
analysis. The roles of HPSE in prostate cancer were further
determined using prostate cancer cell line models in vitro
and a xenograft model in vivo. The mechanism of HPSE
regulating MCL-1 was also explored using HPSE inhibitor treatment
and western blotting, which may help to understand its role in
prostate cancer progression.
Materials and methods
Cell culture and treatments
The human prostate carcinoma PC-3 and DU-145 cell
lines were purchased from The Cell Bank of Type Culture Collection
of The Chinese Academy of Sciences. PC-3 cells were cultured in F12
medium (containing 300 mg/l L-glutamine and 1.5 g/l
NaHCO3; Thermo Fisher Scientific, Inc.) supplemented
with 10% FBS (Thermo Fisher Scientific, Inc.). DU-145 cells were
maintained in DMEM (Thermo Fisher Scientific, Inc.) supplemented
with 10% FBS. Both cell lines were cultured at 37°C in a humidified
incubator with 5% CO2. The HSPE inhibitor, OGT 2115,
MG-132 and cycloheximide (CHX) were purchased from
MedChemExpress.
TCGA data analysis
The analysis of TCGA prostate adenocarcinoma data
(17) was performed by using the
UALCAN (https://ualcan.path.uab.edu/analysis.html) platform
according to previously published protocols (18,19).
P<0.01 and log2 |Fold Change| >1 were considered as the
significant thresholds. In the survival analysis, the high and low
expression groups were determined using the median expression level
as the cut-off. The Pearson correlation coefficient between HPSE
and MCL-1 was calculated using the GEPIA (http://gepia.cancer-pku.cn/index.html) platform.
Patients
A total of six prostate cancer tissue samples
(including the adjacent normal tissue) were collected from Taizhou
Central Hospital (Taizhou, China), and written consent was obtained
from all patients for the use of their tissues in the present
study. Patients who were diagnosed with advanced prostate cancer
from May 2021 to Jan 2023 were included in the present study. The
inclusion criteria were as follows: i) Patients with stage IV–V
prostate cancer; and ii) patients with a single primary tumor or
patients who had only one prior tumor. The exclusion criteria were
as follows: i) Patients whose prior cancer was prostate cancer; ii)
patients with incomplete follow-up data; iii) patients with only
death certificates or autopsy records; and iv) patients whose time
of malignancy diagnosis was not known. The baseline patient
demographics and clinical characteristics are shown in Table I. Gleason score was determined by
following the ‘Gleason Grading of Prostatic Carcinoma: Definition
of Grading Patterns and Proposal for a New Grading System’
guidelines (20). The present study
was performed in accordance with the ethical standards of The
Taizhou Central Hospital Research Committee and The Declaration of
Helsinki, or comparable ethical standards. The study was approved
by The Medical Ethics Committee of Taizhou Central Hospital
(approval no. 2021-SC-076).
 | Table I.Baseline patient demographics and
clinical characteristics. |
Table I.
Baseline patient demographics and
clinical characteristics.
| Patient no. | Age, years | Gleason score | History of
anticancer drug treatment |
|---|
| 1 | 61 | 6 | No |
| 2 | 73 | 7 | No |
| 3 | 71 | 6 | No |
| 4 | 62 | 7 | No |
| 5 | 60 | 6 | No |
| 6 | 71 | 7 | No |
Immunohistochemistry
Each patient and mouse tissue sample was treated
according to the following protocol: The 30-µm free-floating
sections were deparaffinized, antigen retrieval was performed, and
the endogenous peroxidase activity was removed. Briefly, the
samples were rehydrated using xylene and graded concentrations of
ethanol (100% ethanol for 5 min three times, 95% ethanol for 5 min
once and 80% ethanol for 5 min once), incubated in sodium citrate
(10 mmol/l, pH 6.0) at 95°C for 10 min and then cooled down to room
temperature, followed with blocking for endogenous peroxidase using
3% hydrogen peroxide (Thermo Fisher Scientific, Inc.) for 30 min at
room temperature. Sections were permeabilized with 0.1% Triton and
blocked in 10% goat serum (Beyotime Institute of Biotechnology) for
30 min at room temperature. The tissue sections were then incubated
with the relevant primary antibody overnight at 4°C. The HPSE
antibody (1:200; cat. no. 24529-1-AP) was purchased from
Proteintech Group, Inc. and the MCL-1 (1:200; cat. no. 94296) and
Ki-67 (1:200; cat. no. 12202) antibodies were purchased from Cell
Signaling Technology, Inc. Following the primary incubation,
sections were washed using PBS and then incubated with a goat
anti-rabbit secondary antibody conjugated with HRP (cat. no.
554021; 1:200; BD Pharmingen; BD Biosciences) for 30 min at room
temperature. Then, DAB staining and hematoxylin counter-staining
were performed for 2 min at room temperature. Images of the
sections were collected using a light microscope (Olympus
BX-51).
Cell viability
Cell viability was assessed using the MTT assay.
PC-3 and DU-145 cells (3×10³ cells/well) were seeded
into 96-well cell culture plates and treated with OGT 2115 at
different concentrations (300, 100, 33.33, 11.11, 3.67 and 1.22 µM)
for 72 h at 37°C. 0.3% DMSO was set as control solvent.
Subsequently, 20 µl MTT reagent (5 mg/ml) was added to each well
and incubated at 37°C for 4 h. The MTT crystals were dissolved
using DMSO for 10 min at room temperature with gentle shaking, and
the absorbance at 492 nm was recorded.
Reverse transcription-quantitative PCR
(RT-qPCR)
Total RNA from cells following treatment (PC-3 cells
were treated with OGT 2115 at concentrations of 0, 10, 20 and 40
µM, whereas DU-145 cells were treated with concentrations of 0, 25,
50 and 100 µM, both for 24 h) was extracted using RNAiso reagent
(Takara Biotechnology Co., Ltd.) and complementary (c)DNA was
synthesized using an RT kit (Takara Biotechnology Co., Ltd.)
according to the manufacturer's protocol. Subsequently, the cDNA
was amplified using SYBR (Takara Biotechnology Co., Ltd.) in a PCR
Thermal Cycler Dice Real-Time System according to the
manufacturer's protocol. mRNA expression levels were analyzed using
the 2−∆∆Cq method (21)
and were normalized to the internal reference gene, GAPDH. The
primers used for qPCR were as follows: GAPDH forward,
5′-GCACCGTCAAGGCTGAGAAC-3′ and reverse, 5′-GCCTTCTCCATGGTGGTGAA-3′;
and MCL-1 forward, 5′-GGGCAGGATTGTGACTCTCATT-3′ and reverse,
5′-GATGCAGCTTTCTTGGTTTATGG-3′.
Western blotting
PC-3 cells were treated with OGT 2115 at
concentrations of 0, 10, 20 and 40 µM, whereas DU-145 cells were
treated with concentrations of 0, 25, 50 and 100 µM, both for 24 h.
For the CHX and MG132 assays, CHX or MG132 was added to the culture
medium at a final concentration of 35 µM or 10 mM, respectively.
The CHX group was pretreated with OGT 2115 at concentrations of 0,
25, 50 and 100 µM for 18 h, and cell lysates were collected 6 h
after CHX treatment. The MG-132 group was pretreated with OGT 2115
at concentrations of 0, 25, 50 and 100 µM for 22 h, and cell
lysates were collected 2 h after MG-132 treatment. Total protein
from cells following treatment was extracted using RIPA lysis
buffer (Beyotime Institute of Biotechnology). Equivalent amounts of
proteins (50 mg; quantified by BCA kit, Beyotime Institute of
Biotechnology) were then separated via SDS-PAGE using a 10% gel and
then transferred onto PVDF membranes (Bio-Rad Laboratories, Inc.).
Subsequently, the membranes were blocked with non-fat dry milk (5%)
in TBS with 0.1% Tween-20 for 2 h at room temperature, then probed
with primary antibodies against HPSE (1:1,000; cat. no. 24529-1-AP;
Proteintech Group, Inc), MCL-1 (1:1,000; cat. no. 94296; Cell
Signaling Technology, Inc.) and tubulin (1:5,000; cat. no.
sc-32293, Santa Cruz Biotechnology, Inc.) for 12 h at 4°C.
Following the primary antibody incubation, the membranes were
incubated with an anti-rabbit IgG HRP-conjugated secondary antibody
(1:5,000; cat. no. A0208; Beyotime Institute of Biotechnology) for
2 h at room temperature. The separated proteins were detected using
an enhanced chemiluminescence kit (Beyotime Institute of
Biotechnology). Tubulin was used as the loading control. The blots
were scanned and semi-quantified using an Image Quant LAS 4000 Min.
(GE Healthcare).
Small interfering (si)RNA
transfection
A synthetic siRNA targeting MCL-1 (si-MCL-1;
5′-GUGCCUUUGUGGCUAAACATT-3′) was purchased from Shanghai GenePharma
Co., Ltd. Scrambled siRNA (5′-UUCUCCGAACGUGUCACGUTT-3′) was used as
a negative control (NC). When the cell density reached 60–70%, PC-3
and DU-145 cells were transfected with siRNA using Lipofectamine®
2000 (Invitrogen; Thermo Fisher Scientific, Inc.) according to the
manufacturer's protocol with a final siRNA concentration of 100
nM.
Apoptosis determination assay
PC-3 cells were treated with OGT 2115 at
concentrations of 0, 10, 20 and 40 µM, whereas DU-145 cells were
treated with concentrations of 0, 25, 50 and 100 µM. Following
treatment with OGT 2115, the cells were cultured for 24 h and
apoptosis detected via flow cytometry. For this, PC-3 and DU-145
cells were digested using trypsin for 2 min at 37°C, washed with
PBS and resuspended in 100 µl 1X annexin V binding buffer
containing 5 µl annexin V-FITC and 10 µl PI (Beyotime Institute of
Biotechnology). Cells were then incubated for 15 min at room
temperature in the dark. The percentage of PI-positive annexin
V-FITC-positive/negative (PI+/AV− plus
PI+/AV+) and PI-negative
(PI−)/AV+ cells were quantified using flow
cytometry (CytoFlex S; Beckman Coulter, Inc.), and Kaluza Analysis
software version 1.2 (Beckman Coulter, Inc.) was used for
subsequent analysis.
Xenograft assay
PC-3 cells (2×10⁶ cells/200 µl) were
inoculated subcutaneously into the right side of male BALB/c nude
mice (age, 4–5 weeks; Beijing Vital River Laboratory Animal
Technology Co., Ltd.). The mice were housed in sterile cages under
laminar airflow hoods at 20°C, in a specific pathogen-free
environment, under a 12-h light/dark cycle and provided with
autoclaved chow and water ad libitum. Animal health and
behavior were monitored every day. Nude mice were divided into the
following two groups: i) Vehicle control (4% ethanol, 5% PEG 400
and 5% Tween 80) group, n=7; and ii) OGT 2115 treatment group, n=6
(gavage; 40 mg/kg; once daily). When the tumors reached 30–40
mm3 the mice were administered saline or OGT 2115 via
gavage daily for 35 days. Vernier calipers were used to measure the
length and width of the xenografts twice a week. The tumor volume
was calculated using the formula volume=(Width2 ×
length)/2. At the end of the experiment, the mice were anesthetized
with isoflurane (4%) and O2 gas at 300–500 ml/min using
the R540 Mice and Rat Animal Anesthesia Machine (RWD Life Science
Co., Ltd.) for 10 min prior to sacrifice via cervical dislocation.
The humane endpoints followed to determine whether animals should
be euthanized before the end of the study were body weight loss of
>20% and a tumor volume of >1,500 mm3. In the
present study, no animals reached these humane endpoints during the
3-month experiment. Subsequently, the tumors were dissected and
weighed. A part of the tumor tissue was fixed with 10% formalin for
24–48 h at room temperature for subsequent experiments, the rest
were immediately frozen in liquid nitrogen for storage in the event
of further experimentation.
All experimental procedures involving animals were
performed in accordance with The National Institutes of Health
Guide for the Care and Use of Laboratory Animals and the Guide for
the Care and Use of Laboratory Animals in China (22). The present animal study was approved
by The Medical Ethics Committee of Taizhou University Medical
School (Taizhou, China; approval no. 2021-SX-015).
TUNEL staining
To determine cell death, a TUNEL assay was
conducted. Each sample was fixed using 4% Paraformaldehyde Fix
Solution (cat. no. P0099: Beyotime Institute of Biotechnology) for
96 h at room temperature. The 5-µm free-floating sections were
deparaffinized, antigen retrieval was performed, and the endogenous
peroxidase activity was removed using 3% hydrogen peroxide (Thermo
Fisher Scientific, Inc.) for 30 min at room temperature. Briefly,
the samples were rehydrated using xylene and graded concentrations
of ethanol (100% ethanol for 5 min three times, 95% ethanol for 5
min once and 80% ethanol for 5 min once), then immersed in 50 µl
TUNEL reaction solution (cat. no. C1088; Beyotime Institute of
Biotechnology), and then the slides were incubated for 60 min at
37°C in a humid darkened chamber. 4′,6-diamidino-2-phenylindole was
subsequently applied to the slides for 5 min at room temperature in
the dark to stain the nuclei, then mounted with Antifade Mounting
Medium (cat no. P0128M; Beyotime Institute of Biotechnology), after
which the slides were imaged with a fluorescence microscope, five
fields of view observed by microscopy for each slide.
Statistical analysis
All statistical analyses were performed using
GraphPad Prism 8.0 (Dotmatics). Statistical significance was
assessed using an unpaired Student's t-test for two groups or a
one-way ANOVA followed by Tukey's post hoc test for more than two
groups. Data are presented as the mean ± SD. P<0.05 was
considered to indicate a statistically significant difference.
Results
HPSE and MCL-1 are upregulated in
prostate cancer tissues
To verify the abnormal expression of HPSE and MCL-1
in the development of prostate cancer, immunohistochemistry was
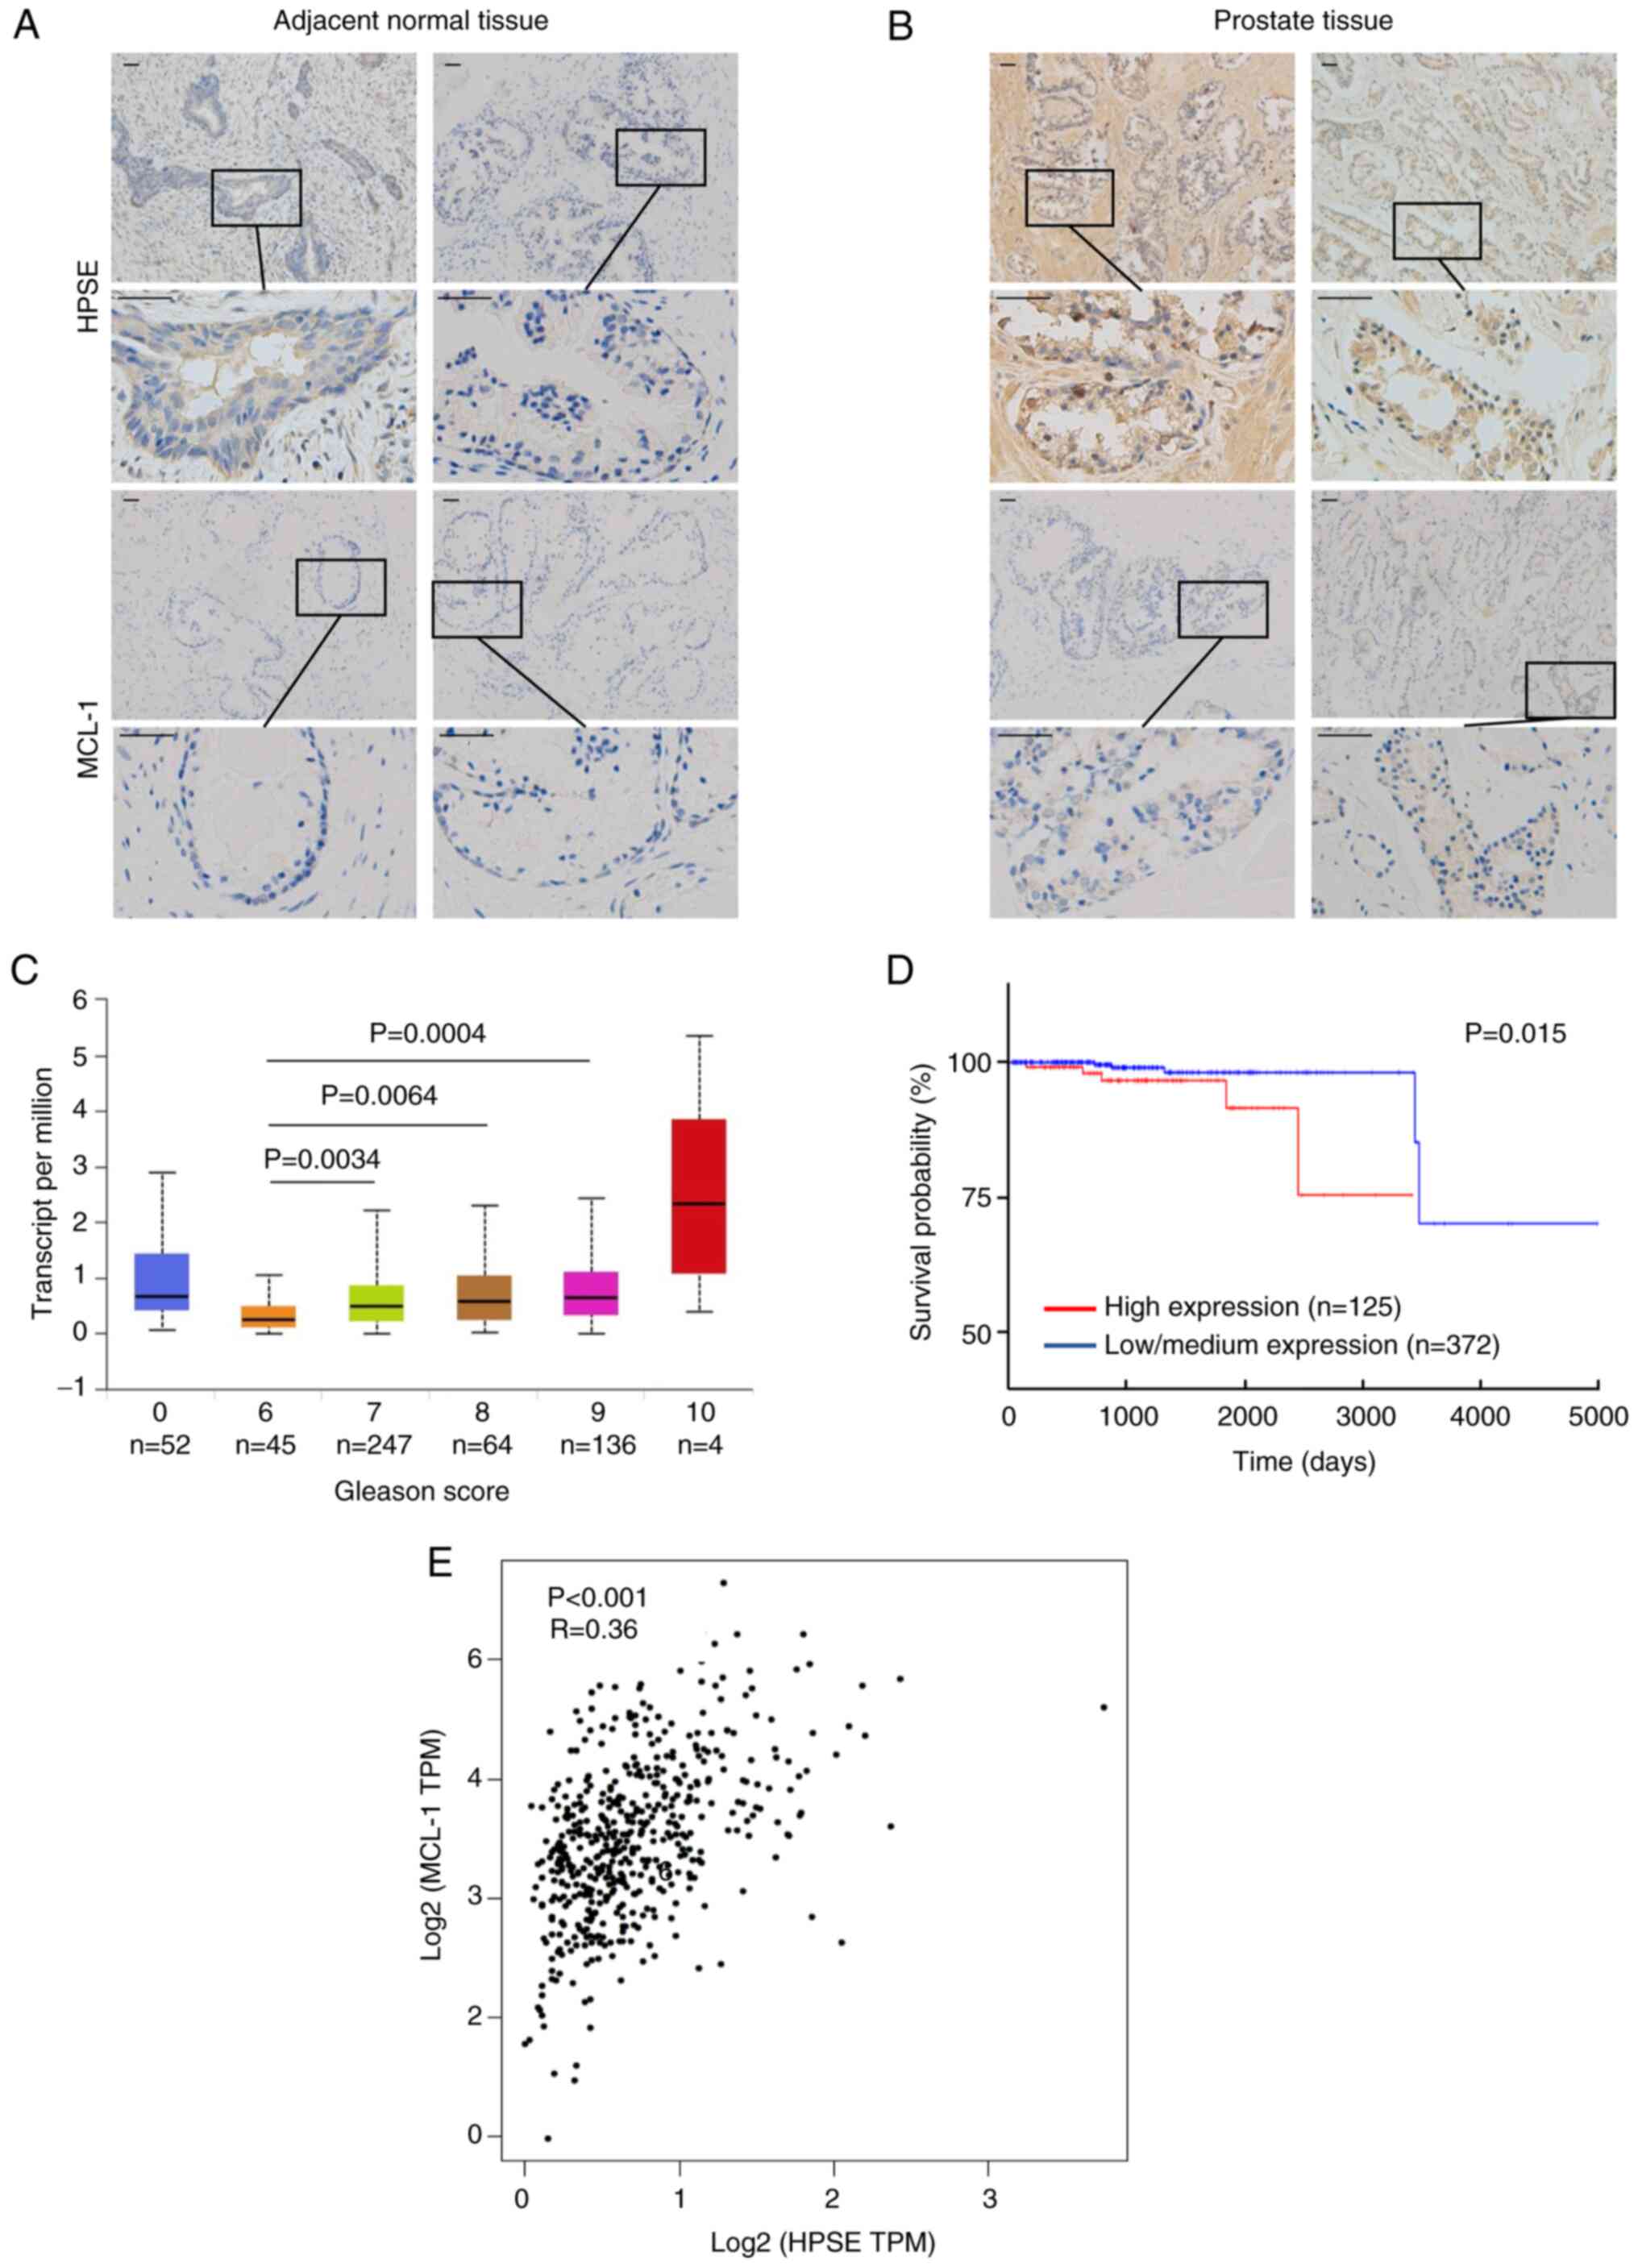
performed on adjacent normal and prostate cancer tissues from
patients. The results demonstrated that HPSE and MCL-1 were
expressed in the cytoplasm and that the protein expression levels
in the prostate cancer tissues were markedly higher compared with
the adjacent normal tissues (Fig. 1A
and B).
The expression profile of HPSE in prostate cancer
tissues was also explored using a TCGA dataset (17). As shown in Fig. 1C, statistical tabulation analysis of
the dataset demonstrated that HPSE expression was associated with
the pathological tumor grade, and expression in Gleason score 7, 8
and 9 tumors was significantly higher than that in Gleason score 6
tumors (P<0.001). Moreover, the 5,000 days overall survival rate
of patients with high expression of the HPSE gene was significantly
lower than that of patients with Low/Medium expression (P=0.015;
Fig. 1D).
A weak correlation between HPSE and MCL-1 expression
was also determined (r=0.36, P<0.01; Fig. 1E) using the GEPIA (http://gepia.cancer-pku.cn/index.html).
As HPSE expression is known to be associated with tumor progression
(23) and MCL-1 is related to
apoptosis (24), these results
suggested that HPSE and MCL-1 may be involved in cell survival in
prostate cancer cells.
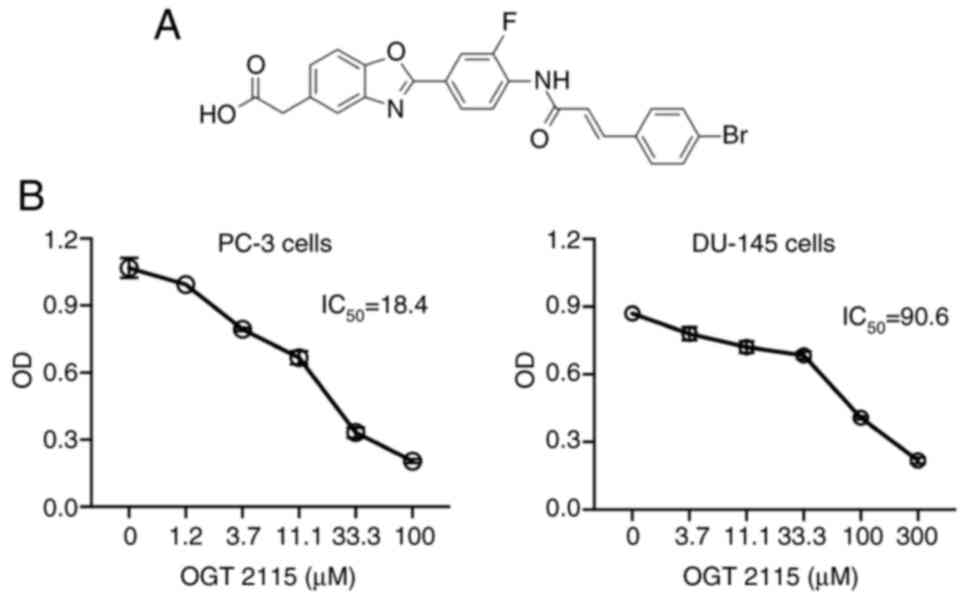
OGT 2115 decreases cell viability
To further explore the role of HSPE in the
progression of prostate cancer, PC-3 and DU-145 prostate cancer
cells were treated with the HSPE inhibitor, OGT 2115 (Fig. 2A). The results demonstrated that,
compared with cells treated with the control solvent, OGT 2115
treatment led to significantly decreased cell viability in both
cell lines in a dose-dependent manner (Fig. 2B). The IC50 of OGT 2115
in PC-3 cells was 18.4 µM and the IC50 in DU-145 cells
was 90.6 µM.
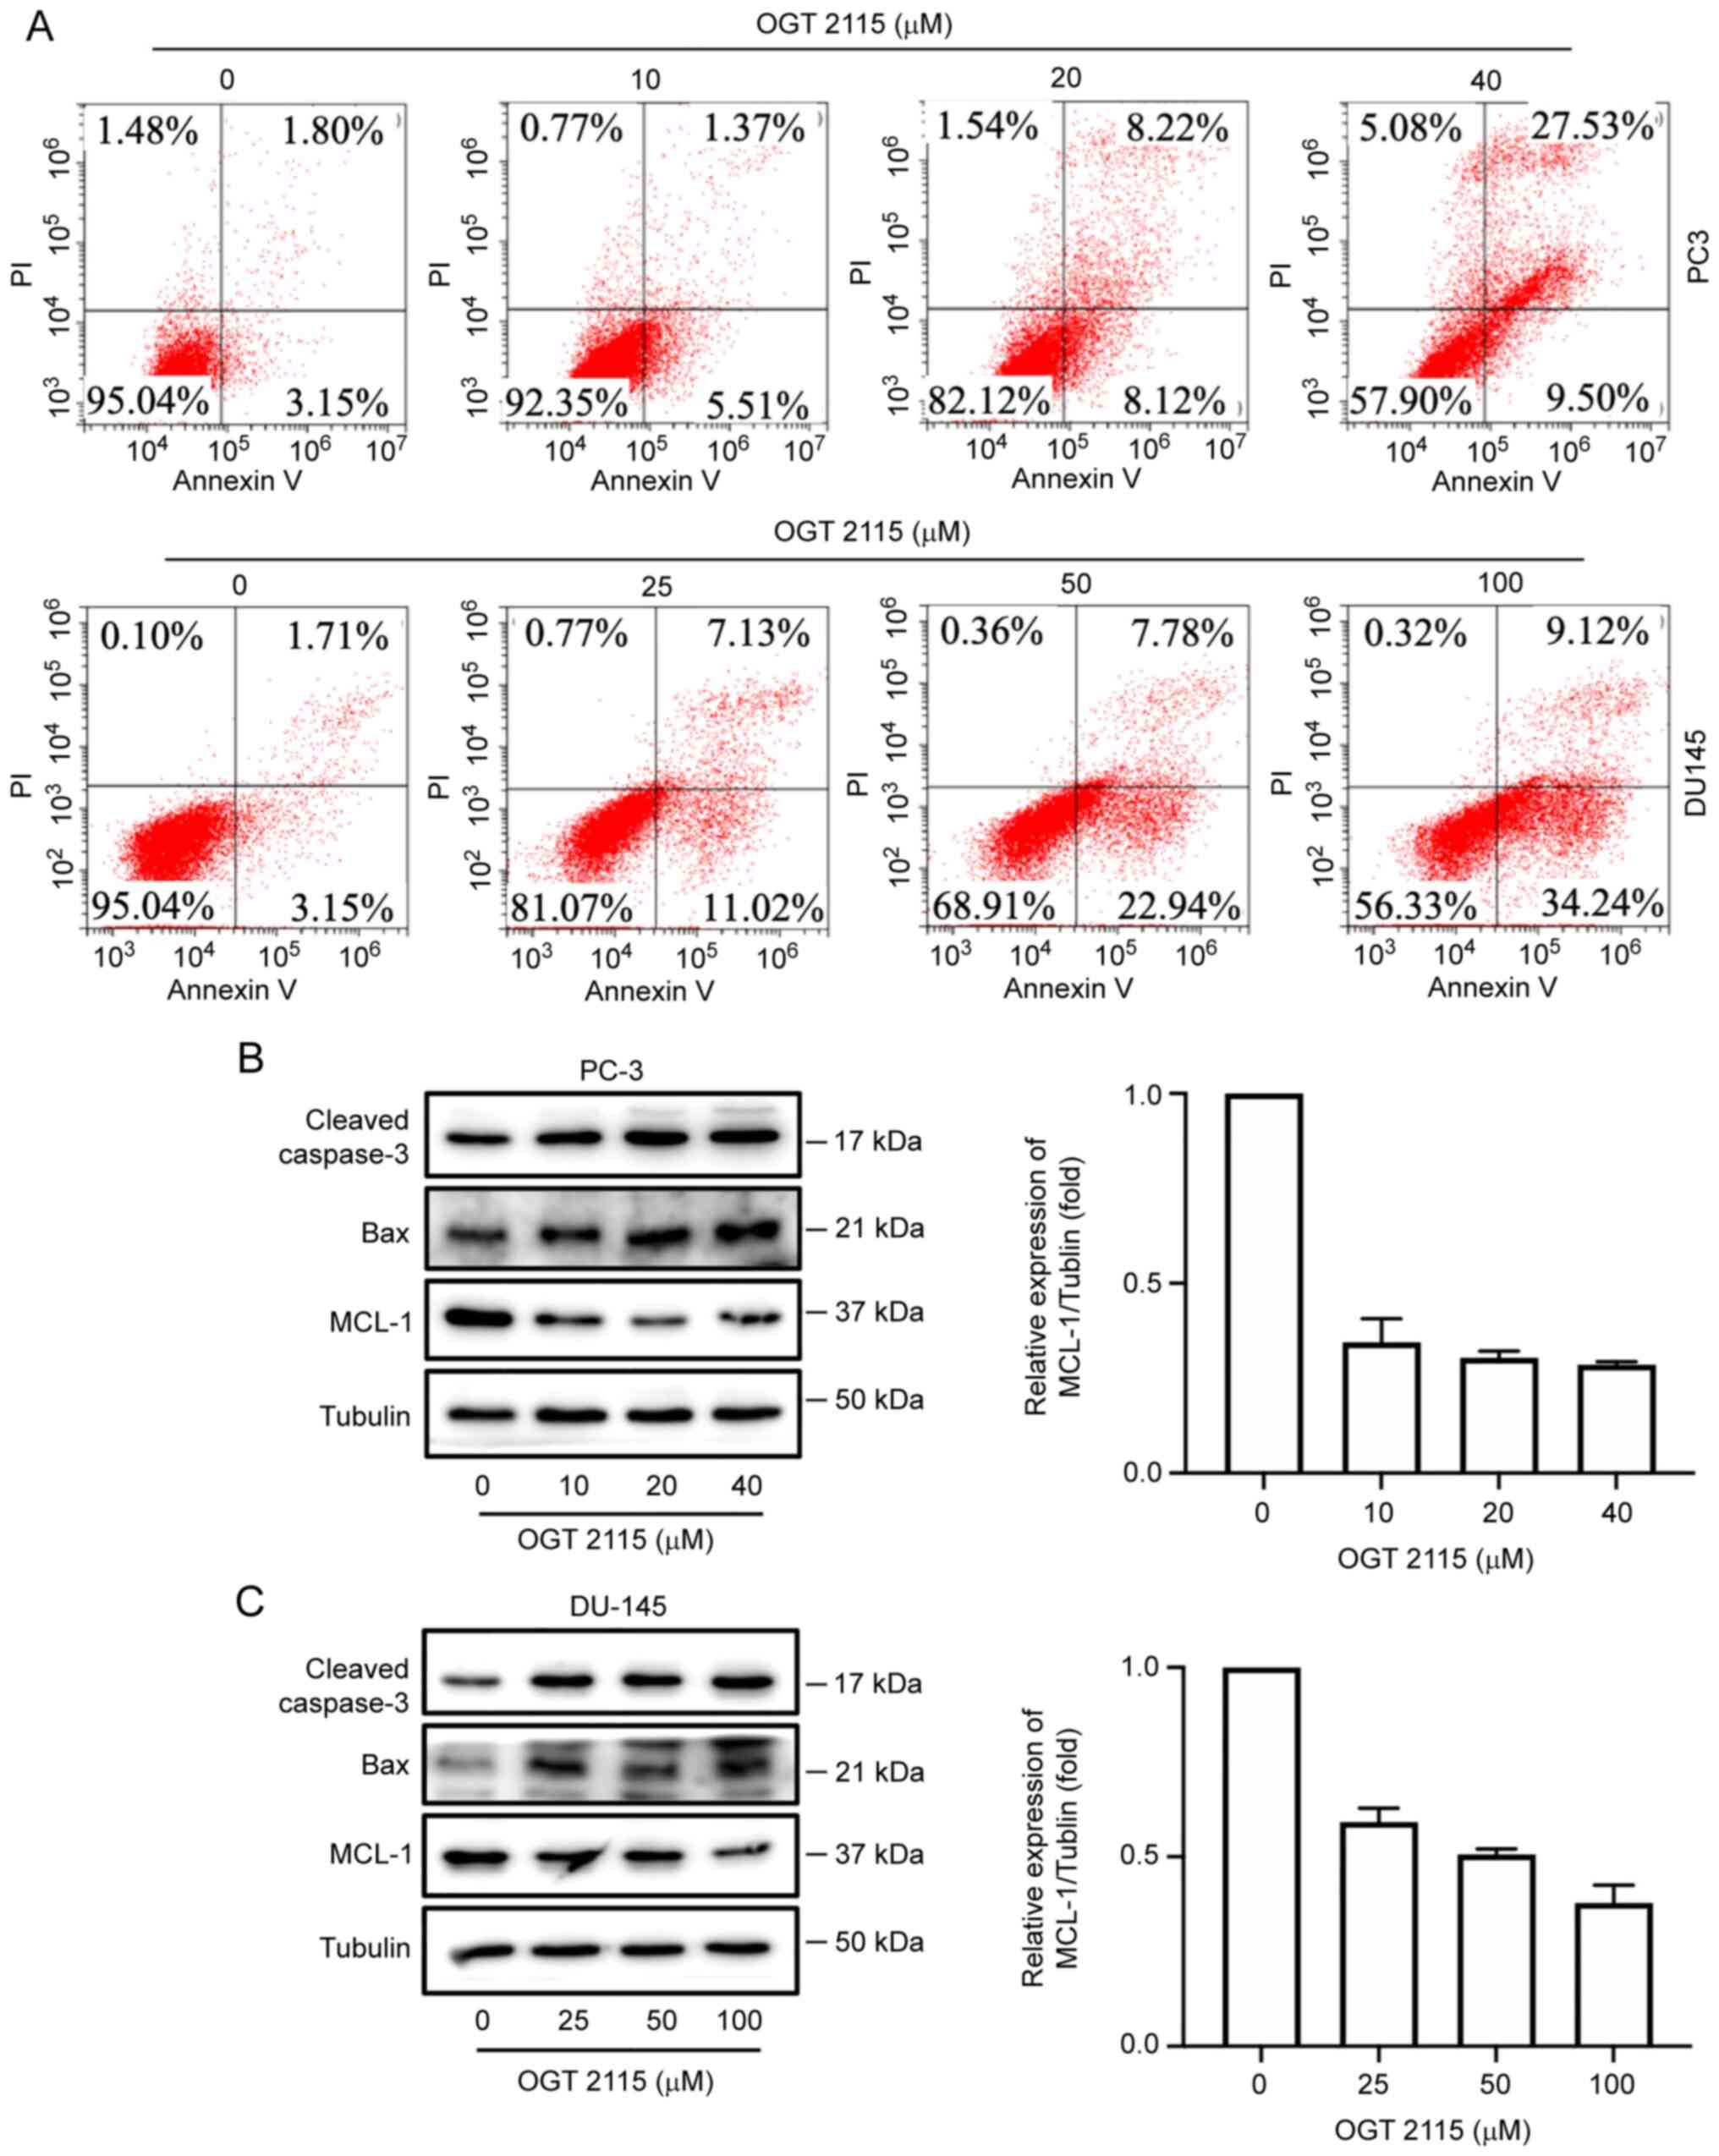
OGT 2115 induces apoptosis and MCL-1
downregulation in prostate cancer cells
The effect of OGT 2115 on prostate cancer cell
apoptosis was further determined using Annexin V-FITC/PI flow
cytometry. PC-3 cells were treated with OGT 2115 at concentrations
of 0, 10, 20 and 40 µM, whereas DU-145 cells were treated with
concentrations of 0, 25, 50 and 100 µM. Following treatment with
OGT 2115, the cells were cultured for 24 h and apoptosis detected
via flow cytometry. In a dose-dependent manner, from the lowest OGT
2115 concentration to the highest, the apoptosis rates of the PC-3
cells were 4.21, 5.51, 8.12 and 9.50%, respectively, whereas the
apoptosis rates of the DU-145 cells were 3.15, 11.02, 22.94 and
34.24%, respectively (Q1-LR in Fig.
3A).
In addition, OGT 2115 reduced MCL-1 protein
expression levels in PC-3 and DU-145 cells but promoted the protein
expression levels of caspase-3 and Bax (Fig. 3B and C).
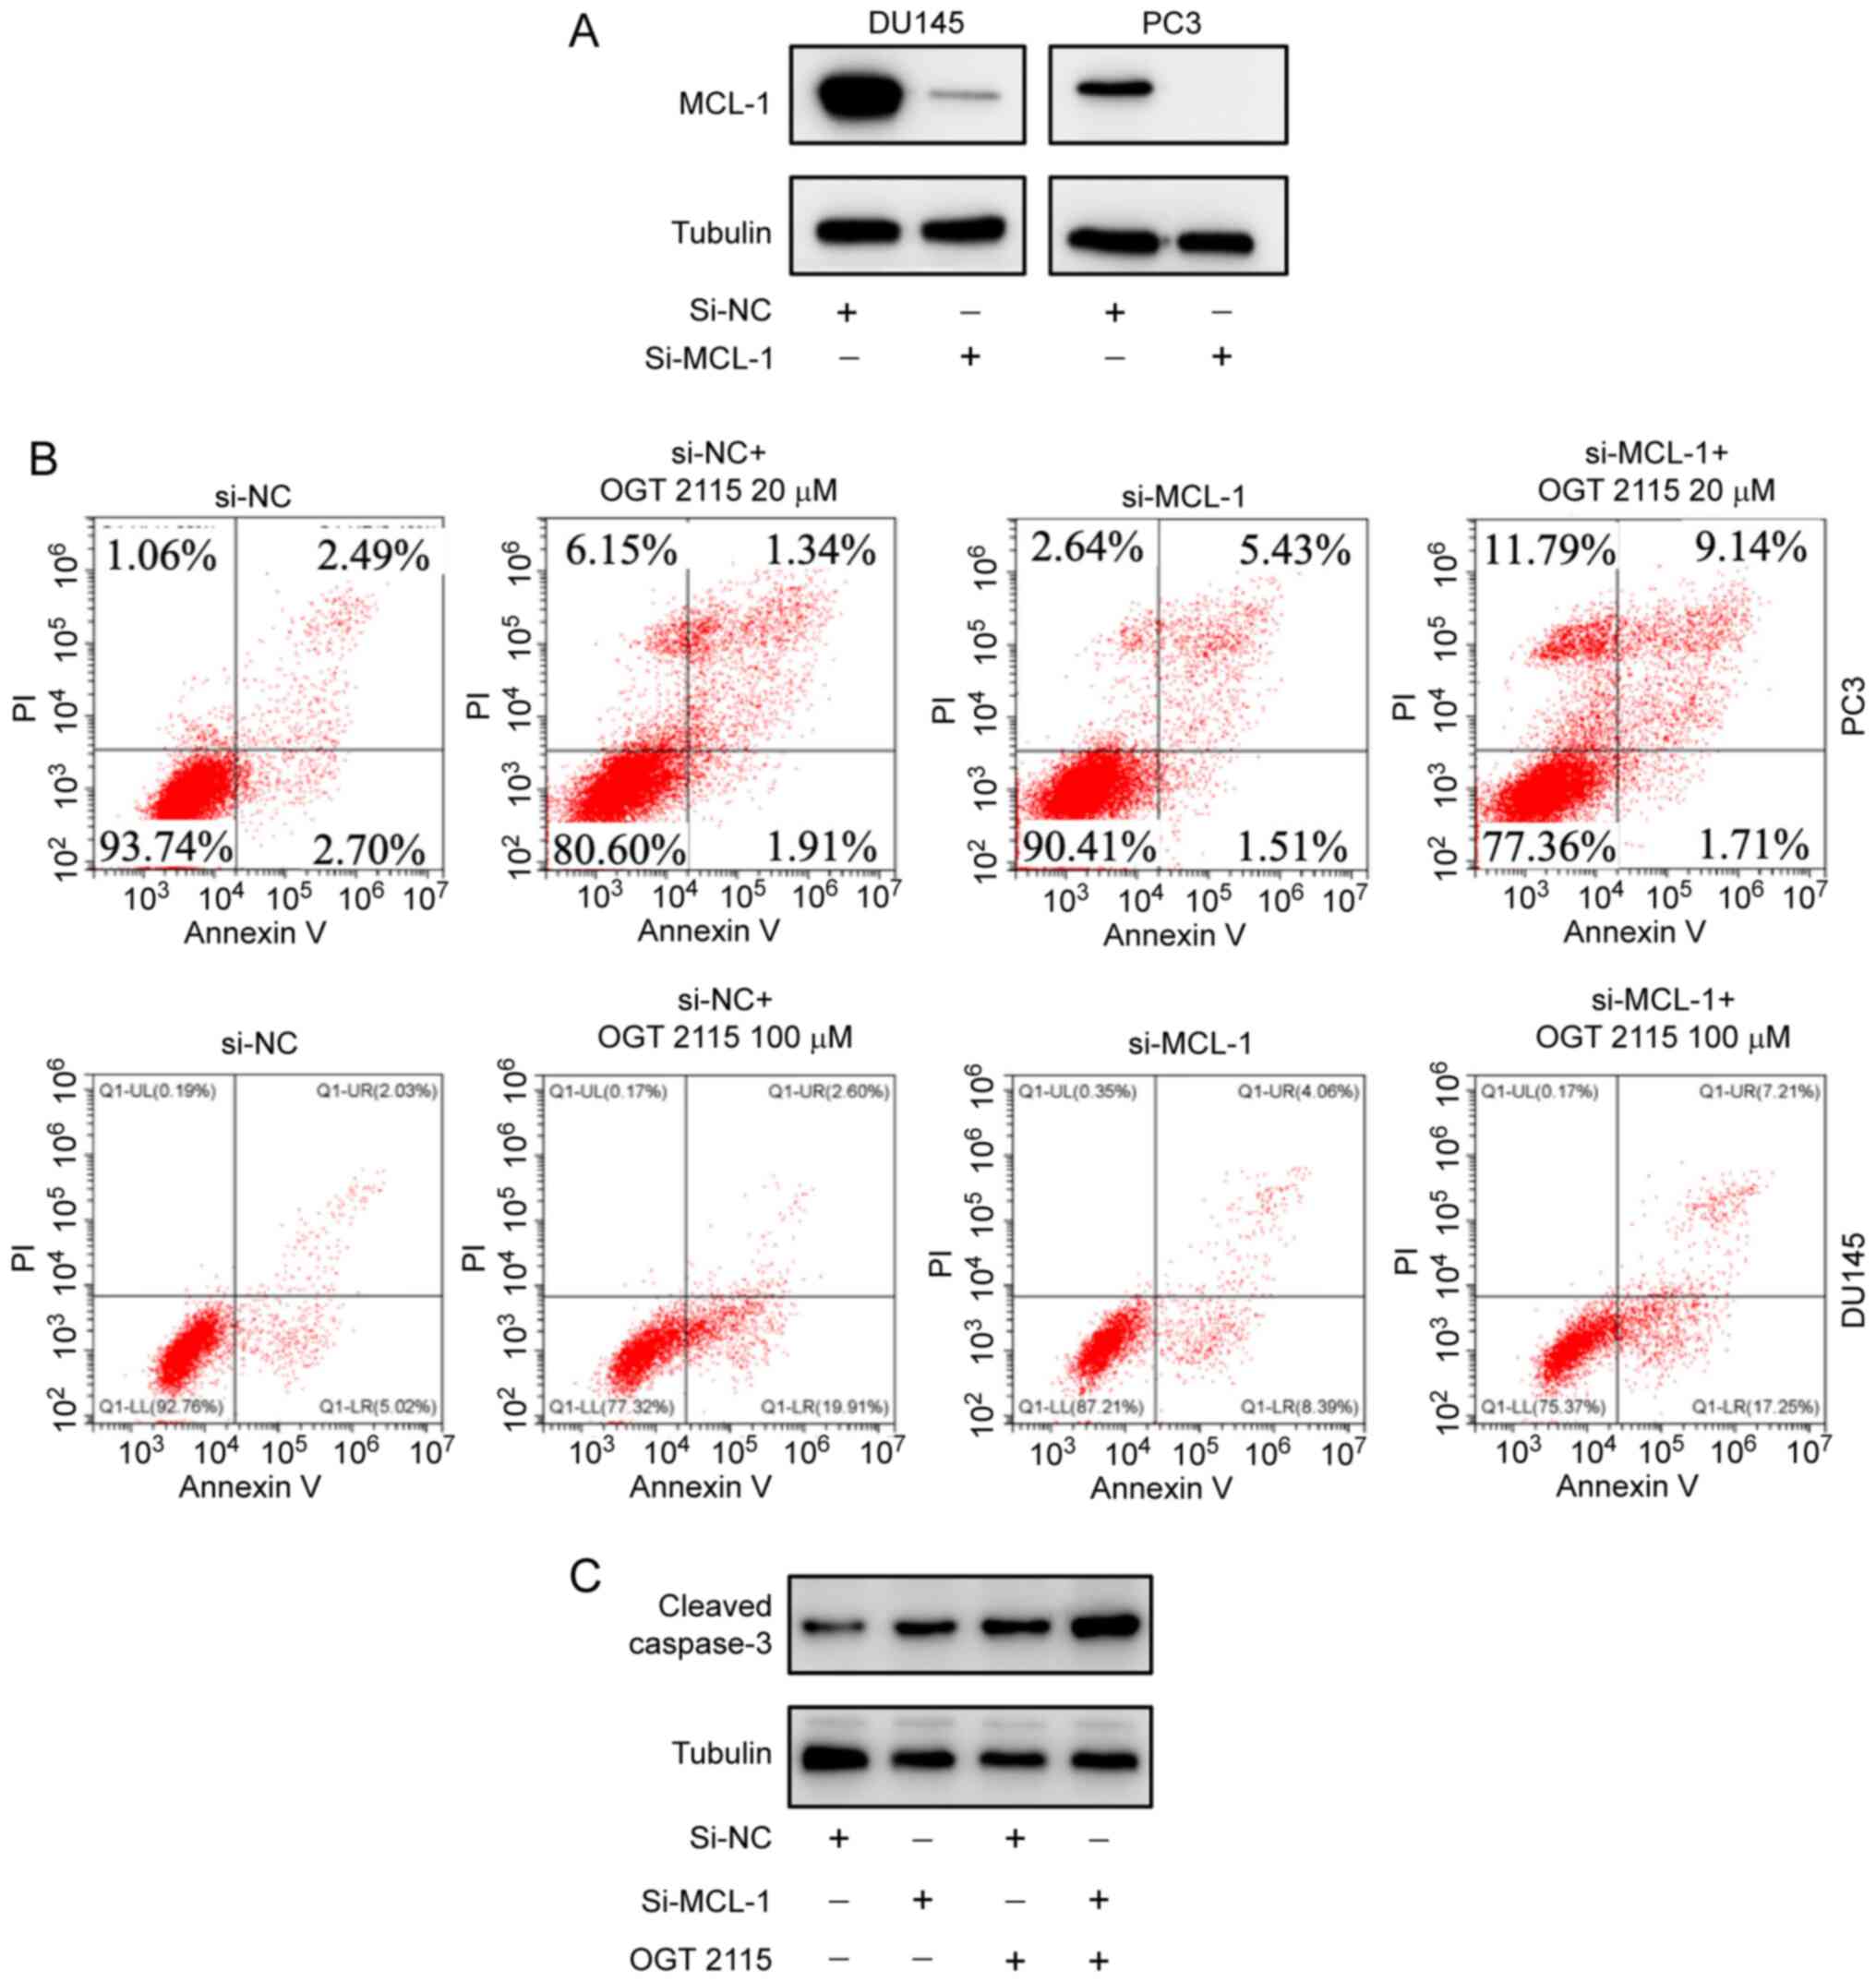
OGT 2115 inhibits prostate cancer cell
viability
To explore how the antitumor effect of OGT 2115 was
associated with MCL-1 protein expression levels, RNA silencing
experiments were conducted. MCL-1 protein expression levels were
successfully downregulated using si-MCL-1 in PC-3 and DU-145 cells
(Fig. 4A). Flow cytometry
demonstrated that the PC-3 cell death rate was 6.25% in the si-NC
group and 9.58% in the si-MCL-1 group (Fig. 4B). The cell death rate in the si-NC
+ OGT 2115 20 µM group was 19.4% and the cell death rate in the
si-MCL-1 + OGT 2115 20 µM group was 22.64%. In DU-145 cells, the
cell death rate was 7.24% in the si-NC group and 12.8% in the
si-MCL-1 group (Fig. 4B). As shown
in Fig. 4C, the cell death rate in
the si-NC + OGT 2115 100 µM group was 22.68%, whereas the cell
death rate of the si-MCL-1 + OGT 2115 100 µM group was 24.63%.
These results support the suggestion that OGT 2115 inhibits
prostate cancer cell viability.
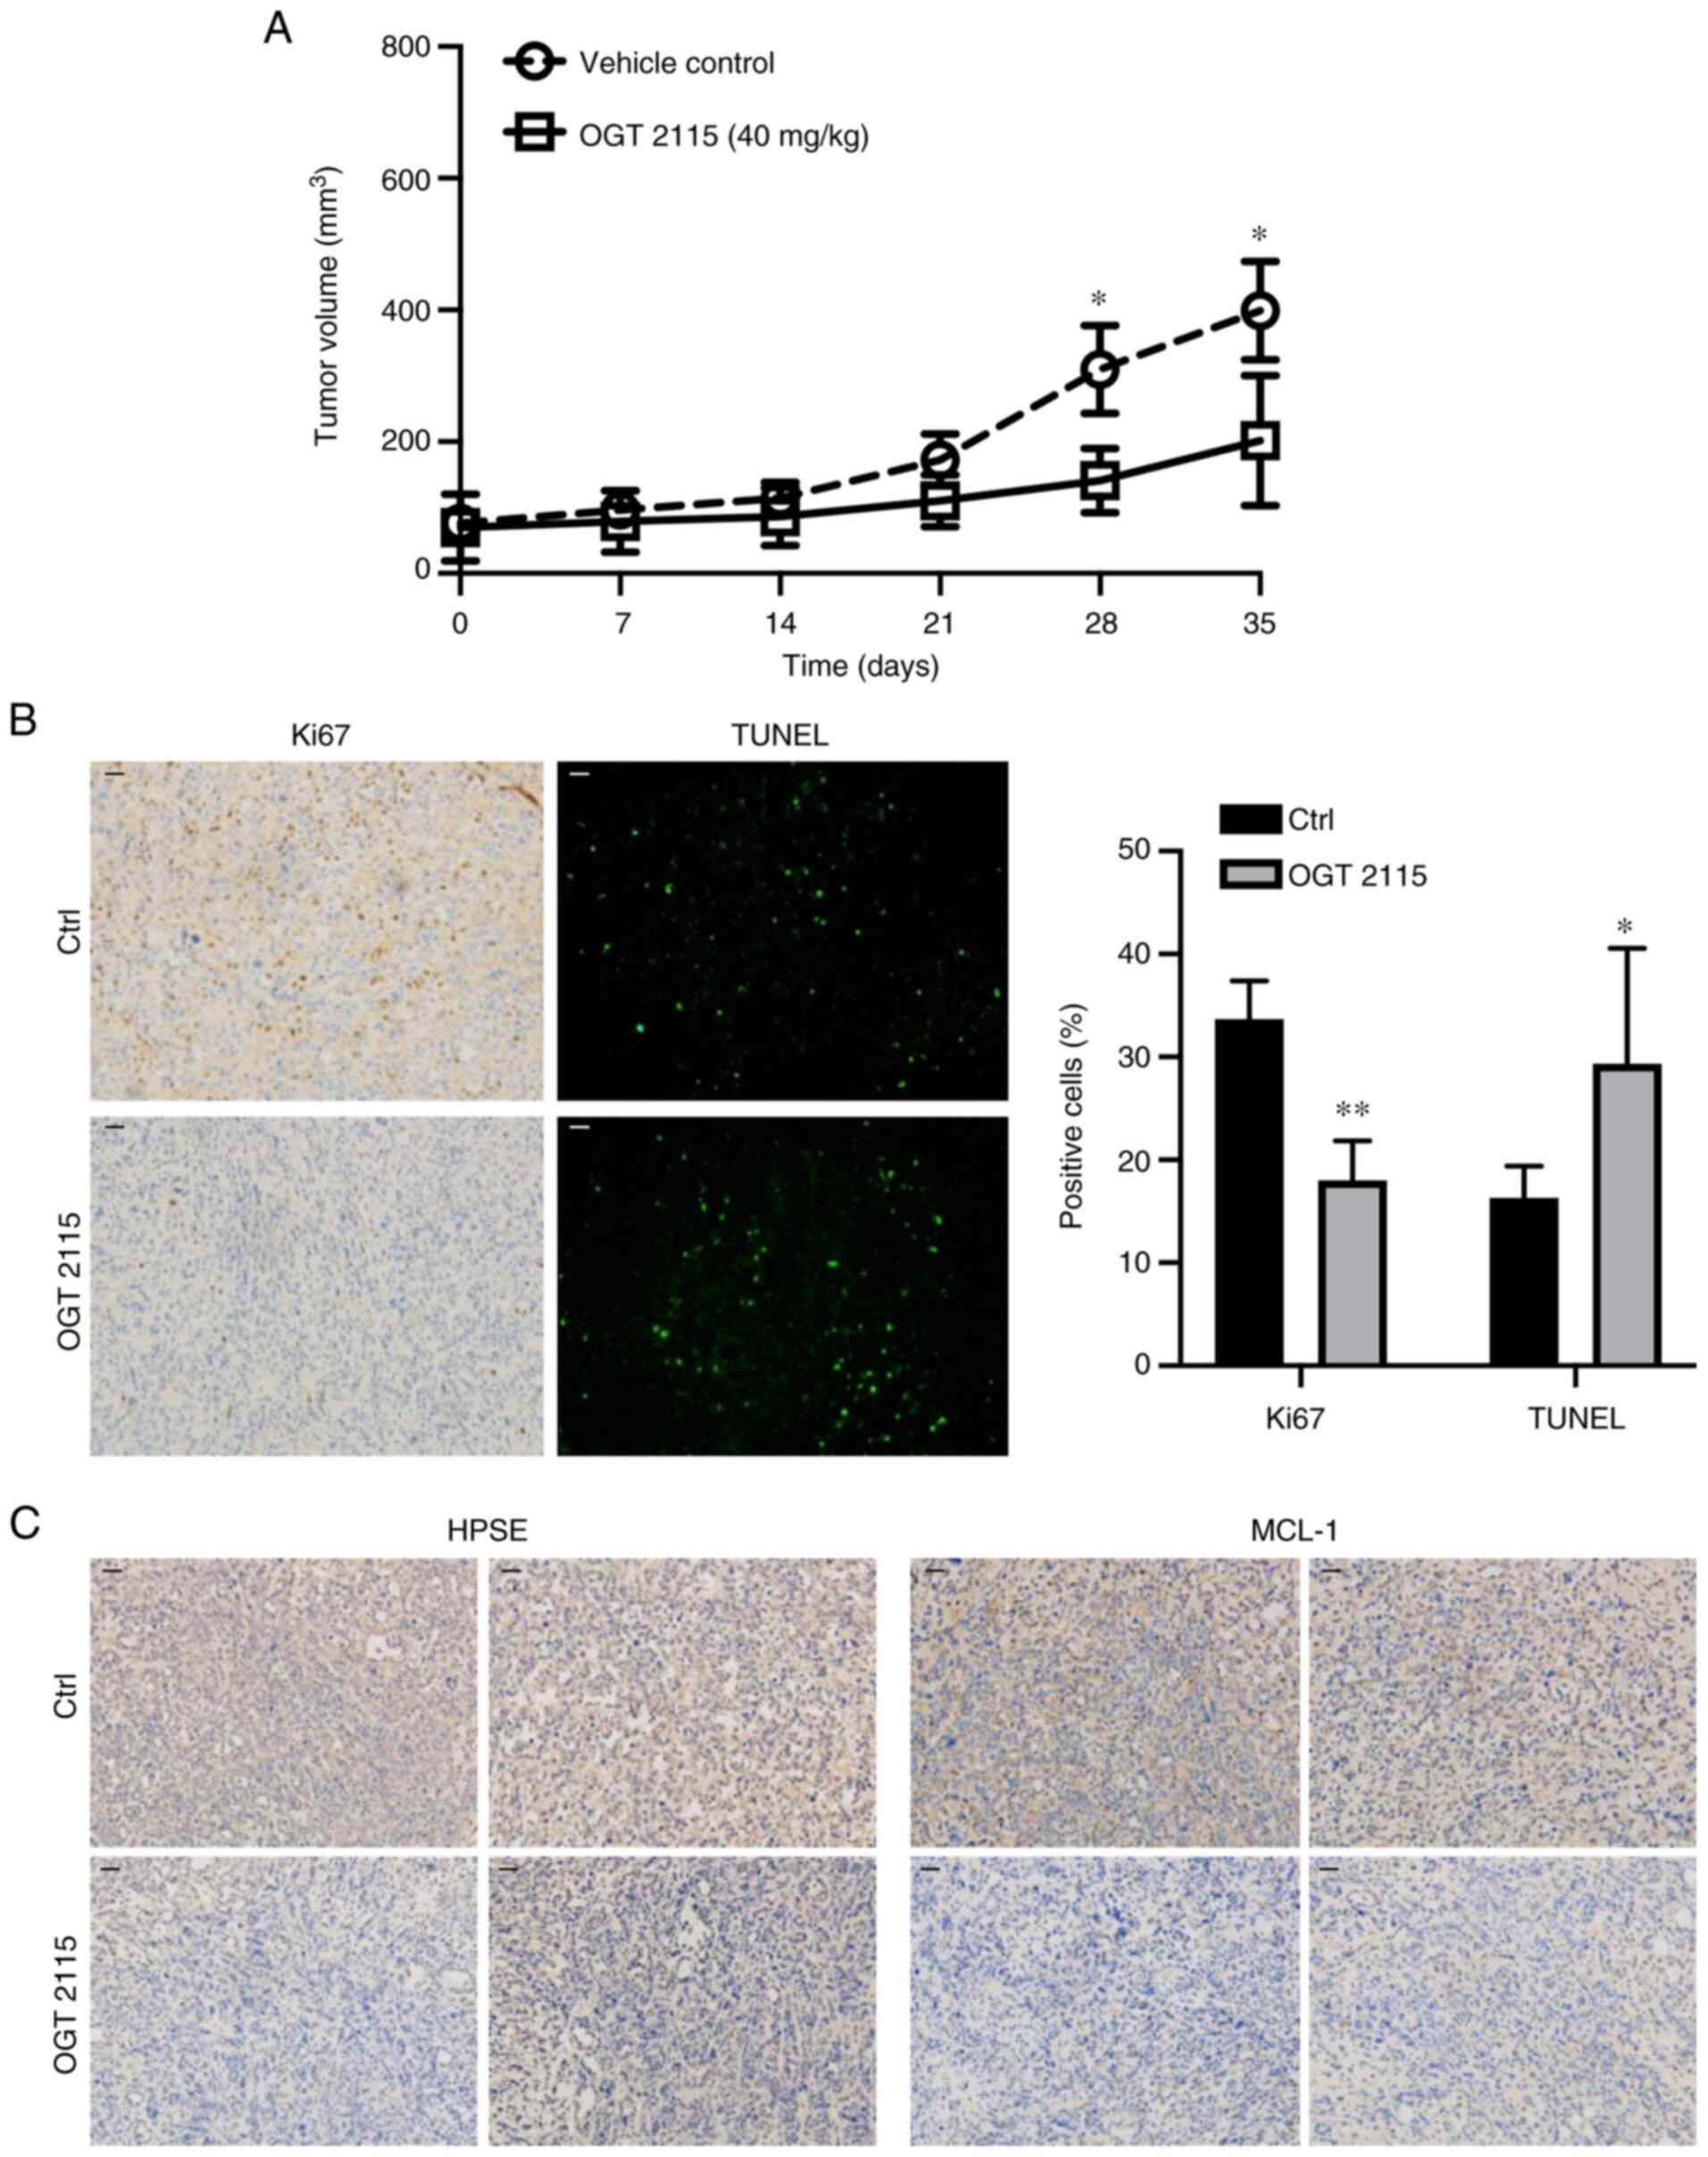
OGT 2115 inhibits prostate cancer cell
xenograft growth in nude mice
To further validate the role of OGT 2115 in prostate
cancer, in vivo experiments were conducted. PC-3 cells were
injected subcutaneously into the right side of nude mice. When the
tumors reached 30–40 mm3 the mice were administered
saline or OGT 2115 via gavage daily for 35 days. The results
demonstrated that tumor growth was significantly inhibited in the
OGT 2115 group compared with the control group at days 28 and 35
(Fig. 5A). The average tumor volume
of the control group was 399.2 mm3 and the largest was
738.1 mm3, whereas the average tumor volume of the OGT
2115 group was 201.7 mm3 and the largest was 365.5
mm3. Furthermore, Ki67 immunohistochemical analysis was
conducted to assess the proliferative ability of OGT 2115-treated
prostate cancer cells. The results demonstrated a significant
decrease in Ki67+ cells in the OGT 2115 group compared
with the control group (Fig. 5B).
To further explore the effect of OGT 2115 on apoptosis in nude mice
xenografts, TUNEL staining was performed. The results demonstrated
that OGT 2115 treatment significantly increased the percentage of
TUNEL+ apoptotic cells in nude mice xenografts compared
with the control (Fig. 5B).
Furthermore, the HPSE and MCL-1 protein expression levels in the
OGT 2115 group were markedly lower compared with the control group
(Fig. 5C).
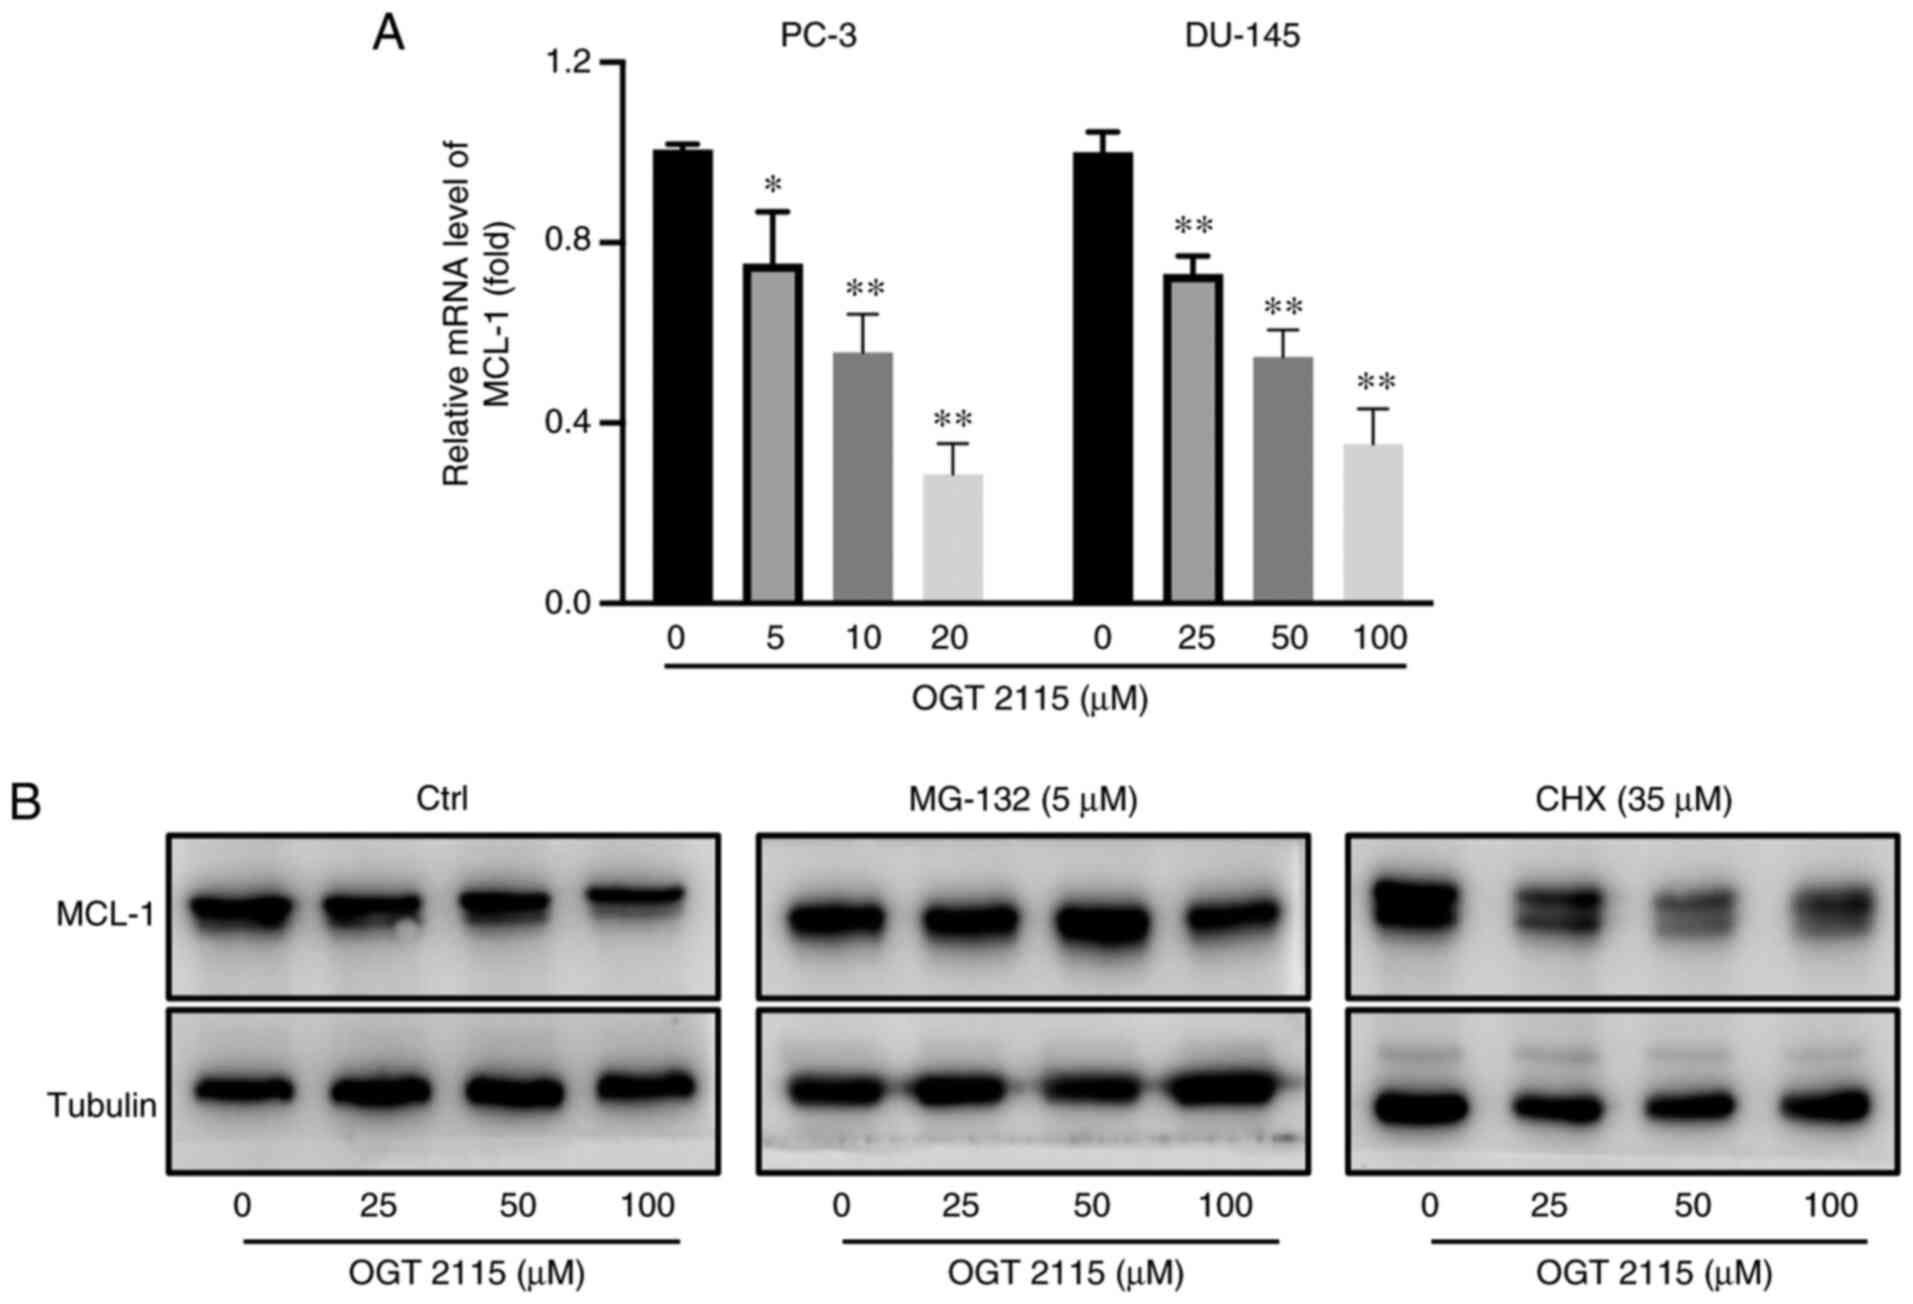
OGT 2115 decreases MCL-1 mRNA
expression levels and facilitates MCL-1 protein degradation in
prostate cancer cells
As OGT 2115 had been determined to reduce MCL-1
protein expression levels in prostate cancer cells and xenografts,
the underlying mechanism of OGT 2115-regulated MCL-1 expression was
further investigated. RT-qPCR and western blotting were conducted
to determine the MCL-1 mRNA and protein expression levels. In PC-3
cells, OGT 2115 treatment was administered at 0, 5, 10 and 20 µM
for 24 h. In DU-145 cells, OGT 2115 treatment was administered at
0, 25, 50 and 100 µM for 24 h. The results of the RT-qPCR analysis
demonstrated that OGT 2115 significantly reduced the MCL-1 mRNA
expression levels in PC-3 and DU-145 cells compared with the 0 µM
group, in a dose-dependent manner (Fig.
6A). Furthermore, the results of the western blotting analysis
demonstrated that OGT 2115 markedly reduced the MCL-1 protein
expression levels in prostate cancer cells in a dose-dependent
manner (Fig. 6B). The protein
synthesis inhibitor, CHX, was also administered to the OGT 2115
group for 6 h before detecting changes in MCL-1 protein expression.
The results demonstrated that CHX did not affect the MCL-1 protein
expression levels (Fig. 6B).
Furthermore, the OGT 2115 group was treated with MG132, an
inhibitor of proteasomal degradation. The results demonstrated that
MG-132 markedly inhibited the decrease in MCL-1 protein expression
levels caused by OGT 2115 treatment (Fig. 6B). It can therefore be concluded
that OGT 2115 facilitates MCL-1 protein degradation instead of
protein production in prostate cancer cells.
Discussion
In the present study, it was demonstrated that HPSE
expression was higher in prostate cancer tissues compared with
adjacent normal tissues. In addition, the HPSE inhibitor, OGT 2115,
inhibited the viability of prostate cancer cells by inducing
apoptosis. Further results demonstrated a correlation between HPSE
and MCL-1 expression. Treatment with OGT 2115 decreased MCL-1
protein expression levels, and both RNA interference-mediated
downregulation of MCL-1 and OGT 2115 treatment synergistically
induced apoptosis in prostate cancer cells. Additional studies
demonstrated that the proteasome inhibitor, MG-132, markedly
inhibited the decrease in MCL-1 protein expression levels induced
by OGT 2115. However, the protein synthesis inhibitor, CHX, did not
affect the role of OGT 2115 in regulating MCL-1. The present study
therefore demonstrated that the proapoptotic activity of OGT 2115
was achieved by downregulating MCL-1 expression, both
transcriptionally and post-transcriptionally. However, the specific
underlying mechanism of OGT 2115-induced degradation of MCL-1
requires further study.
HPSE is a β-glucuronidase that regulates the
structure and function of HSPGs and remodels the cell surface and
ECM by cleaving HS (25). A HSPG is
formed by the polymerization of a core protein and one or more HS
chains, in which the HS chain is the key active site (26). In normal human tissues, HPSE is
mainly distributed in immune tissues, such as the placenta and
lymphoid organs, but it is also widely distributed in tumors,
particularly malignant tumor tissues, including prostate cancer
(27). Typically, HPSE is
associated with the tumor microenvironment (22). Previous studies have also
demonstrated that HPSE increases the autophagy of tumor cells,
which thereby increases their resistance to chemotherapy (28,29).
HPSE upregulation promotes tumor growth, metastasis and
angiogenesis (30), whereas the
downregulation of HPSE inhibits tumor proliferation and metastasis
(31). Therefore, HPSE inhibitors
may serve as antitumor therapeutics (32).
The molecular mechanism of OGT 2115 in promoting
apoptosis in prostate cancer cells was explored in the present
study. It was determined that the induction of apoptosis in
prostate cancer cells by OGT 2115 was associated with MCL-1. The
downregulation of MCL-1 expression levels in PC-3 and DU-145 cells
promoted apoptosis following treatment with OGT 2115. MCL-1, a
member of the Bcl-2 family of apoptosis-regulating genes, serves an
antiapoptotic role via dimerizing BAK and Bax and binding to the
Bcl-2 homology 3 (BH3) domain of the BH3-only protein (33). Furthermore, the MCL-1 protein is
involved in the occurrence and development of tumors. It has been
reported that amplification of the MCL-1 gene and an increase in
MCL-1 protein expression levels are common in various types of
tumor cells, such as breast, prostate and lung cancer cells
(34–38). In addition, high MCL-1 expression
levels lead to the resistance of tumor cells to chemotherapeutic
drugs (39). Inhibiting the
expression of MCL-1 or increasing its degradation promotes tumor
cell apoptosis, which suggests that MCL-1 may be a potential
therapeutic target (40). In the
present study, immunohistochemistry demonstrated that the
expression of MCL-1 in prostate cancer tissues was markedly higher
than in adjacent normal tissues. In addition, western blotting
demonstrated that OGT 2115 markedly reduced MCL-1 protein
expression levels and markedly increased the protein expression
levels of other apoptosis-related proteins, Bax and cleaved
caspase-3, in prostate cancer cells. RT-qPCR demonstrated that OGT
2115 significantly downregulated the mRNA expression levels of
MCL-1 in PC-3 and DU-145 cells. Furthermore, in vivo
tumorigenic experiments in nude mice demonstrated that OGT 2115
significantly inhibited tumor proliferation and promoted
apoptosis.
In conclusion, the results of the present study
indicated that the HPSE inhibitor, OGT 2115, inhibited the
viability of prostate cancer cells by decreasing MCL-1 levels both
transcriptionally and post-transcriptionally. Furthermore, the
present study provided a novel therapeutic approach for the
treatment of prostate cancer. However, the specific underlying
mechanism of OGT 2115-induced degradation of MCL-1 requires further
study, and the antitumor effects of OGT 2115 should be validated in
clinical trials.
Acknowledgements
We thank Mr. Bo-Ze Wang (Department of Pharmacology,
Taizhou University, Taizhou, Zhejiang 318000, P.R. China) for their
assistance with the flow cytometry assay.
Funding
This study was funded by Zhejiang Provincial Natural Science
Foundation of China (grant nos. HDMY22H310084, LGF19H050004,
LGD21H090002 and LGD20H310001).
Availability of data and materials
The datasets used and/or analyzed during the current
study are available from the corresponding author on reasonable
request.
Authors' contributions
XL, LLX and GC conceived and designed the study; XL
and SCL confirmed the methods; XL, SCL, SJX, BJ, JC, HJL, HSL, SKZ
and XFD helped with the acquisition of data (such as providing
animals, acquiring and managing patients, and providing facilities)
and performed the experiments; XL, GC, and LLX contributed to the
analysis and interpretation of data (such as statistical analysis,
biostatistics, and computational analysis). All authors read and
approved the final manuscript. XL and GC confirm the authenticity
of all the raw data.
Ethics approval and consent to
participate
The studies involving human participants were
reviewed and approved by The Medical Ethics Committee of Taizhou
Central hospital (Taizhou, China; approval no. 2021-SC-076). The
patients/participants provided written informed consent to
participate in this study.
The animal study was reviewed and approved by The
Medical Ethics Committee of Taizhou University College of Medicine
(Taizhou, China; approval no. 2021-SX-015).
Patient consent for publication
Written informed consent for publication of clinical
details and cancer tissues was obtained from the patients.
Competing interests
The authors declare that they have no competing
interests.
References
|
1
|
Siegel RL, Miller KD, Fuchs HE and Jemal
A: Cancer statistics, 2021. CA Cancer J Clin. 71:7–33. 2021.
View Article : Google Scholar : PubMed/NCBI
|
|
2
|
Chen W, Zheng R, Baade PD, Zhang S, Zeng
H, Bray F, Jemal A, Yu XQ and He J: Cancer statistics in China,
2015. CA Cancer J Clin. 66:115–132. 2016. View Article : Google Scholar : PubMed/NCBI
|
|
3
|
Perlmutter MA and Lepor H: Androgen
deprivation therapy in the treatment of advanced prostate cancer.
Rev Urol. 9 (Suppl 1):S3–S8. 2007.PubMed/NCBI
|
|
4
|
Limberger T, Schlederer M, Trachtová K,
Garces de Los Fayos Alonso I, Yang J, Högler S, Sternberg C, Bystry
V, Oppelt J, Tichý B, et al: KMT2C methyltransferase domain
regulated INK4A expression suppresses prostate cancer metastasis.
Mol Cancer. 21:892022. View Article : Google Scholar : PubMed/NCBI
|
|
5
|
Smith MR, Saad F, Coleman R, Shore N,
Fizazi K, Tombal B, Miller K, Sieber P, Karsh L, Damião R, et al:
Denosumab and bone-metastasis-free survival in men with
castration-resistant prostate cancer: Results of a phase 3,
randomised, placebo-controlled trial. Lancet. 379:39–46. 2012.
View Article : Google Scholar : PubMed/NCBI
|
|
6
|
Vlodavsky I, Ilan N and Sanderson RD:
Forty years of basic and translational heparanase research. Adv Exp
Med Biol. 1221:3–59. 2020. View Article : Google Scholar : PubMed/NCBI
|
|
7
|
Reynolds MR, Singh I, Azad TD, Holmes BB,
Verghese PB, Dietrich HH, Diamond M, Bu G, Han BH and Zipfel GJ:
Heparan sulfate proteoglycans mediate Aβ-induced oxidative stress
and hypercontractility in cultured vascular smooth muscle cells.
Mol Neurodegener. 11:92016. View Article : Google Scholar : PubMed/NCBI
|
|
8
|
Koganti R, Suryawanshi R and Shukla D:
Heparanase, cell signaling, and viral infections. Cell Mol Life
Sci. 77:5059–5077. 2020. View Article : Google Scholar : PubMed/NCBI
|
|
9
|
Cohen-Kaplan V, Jrbashyan J, Yanir Y,
Naroditsky I, Ben-Izhak O, Ilan N, Doweck I and Vlodavsky I:
Heparanase induces signal transducer and activator of transcription
(STAT) protein phosphorylation: preclinical and clinical
significance in head and neck cancer. J Biol Chem. 287:6668–6678.
2012. View Article : Google Scholar : PubMed/NCBI
|
|
10
|
Mahtouk K, Hose D, Raynaud P, Hundemer M,
Jourdan M, Jourdan E, Pantesco V, Baudard M, De Vos J, Larroque M,
et al: Heparanase influences expression and shedding of syndecan-1,
and its expression by the bone marrow environment is a bad
prognostic factor in multiple myeloma. Blood. 109:4914–4923. 2007.
View Article : Google Scholar : PubMed/NCBI
|
|
11
|
Fletcher S: MCL-1 inhibitors-where are we
now (2019)? Expert Opin Ther Pat. 29:909–919. 2019. View Article : Google Scholar : PubMed/NCBI
|
|
12
|
Abdul Rahman SF, Azlan A, Lo KW, Azzam G
and Mohana-Kumaran N: Dual inhibition of anti-apoptotic proteins
BCL-XL and MCL-1 enhances cytotoxicity of Nasopharyngeal carcinoma
cells. Discov Oncol. 13:92022. View Article : Google Scholar : PubMed/NCBI
|
|
13
|
Wang B, Ni Z, Dai X, Qin L, Li X, Xu L,
Lian J and He F: The Bcl-2/xL inhibitor ABT-263 increases the
stability of Mcl-1 mRNA and protein in hepatocellular carcinoma
cells. Mol Cancer. 13:982014. View Article : Google Scholar : PubMed/NCBI
|
|
14
|
Carné Trécesson S, Souazé F, Basseville A,
Bernard AC, Pécot J, Lopez J, Bessou M, Sarosiek KA, Letai A,
Barillé-Nion S, et al: BCL-X(L) directly modulates RAS signalling
to favour cancer cell stemness. Nat Commun. 8:11232017. View Article : Google Scholar : PubMed/NCBI
|
|
15
|
Wei AH, Roberts AW, Spencer A, Rosenberg
AS, Siegel D, Walter RB, Caenepeel S, Hughes P, McIver Z, Mezzi K,
et al: Targeting MCL-1 in hematologic malignancies: Rationale and
progress. Blood Rev. 44:1006722020. View Article : Google Scholar : PubMed/NCBI
|
|
16
|
Yancey D, Nelson KC, Baiz D, Hassan S,
Flores A, Pullikuth A, Karpova Y, Axanova L, Moore V, Sui G and
Kulik G: BAD dephosphorylation and decreased expression of MCL-1
induce rapid apoptosis in prostate cancer cells. PLoS One.
8:e745612013. View Article : Google Scholar : PubMed/NCBI
|
|
17
|
Cancer Genome Atlas Research Network, .
The molecular taxonomy of primary prostate cancer. Cell.
4:1011–1025. 2015.
|
|
18
|
Chandrashekar DS, Karthikeyan SK, Korla
PK, Patel H, Shovon AR, Athar M, Netto GJ, Qin ZS, Kumar S, Manne
U, et al: UALCAN: An update to the integrated cancer data analysis
platform. Neoplasia. 25:18–27. 2022. View Article : Google Scholar : PubMed/NCBI
|
|
19
|
Chandrashekar DS, Bashel B, Balasubramanya
SAH, Creighton CJ, Rodriguez IP, Chakravarthi BVSK and Varambally
S: UALCAN: A portal for facilitating tumor subgroup gene expression
and survival analyses. Neoplasia. 8:649–658. 2017. View Article : Google Scholar : PubMed/NCBI
|
|
20
|
Epstein JI, Egevad L, Amin MB, Delahunt B,
Srigley JR, Humphrey PA and Grading Committee: The 2014
international society of urological pathology (ISUP) consensus
conference on gleason grading of prostatic carcinoma: Definition of
grading patterns and proposal for a new grading system. Am J Surg
Pathol. 2:244–252. 2016. View Article : Google Scholar
|
|
21
|
Livak KJ and Schmittgen TD: Analysis of
relative gene expression data using real-time quantitative PCR and
the 2(−Delta Delta C(T)) method. Methods. 25:402–408. 2001.
View Article : Google Scholar : PubMed/NCBI
|
|
22
|
MacArthur Clark JA and Sun D: Guidelines
for the ethical review of laboratory animal welfare people's
republic of China national standard GB/T 35892-2018 (Issued 6
February 2018 Effective from 1 September 2018). Animal Model Exp
Med. 3:103–113. 2020. View Article : Google Scholar : PubMed/NCBI
|
|
23
|
Jiao W, Chen Y, Song H, Li D, Mei H, Yang
F, Fang E, Wang X, Huang K, Zheng L and Tong Q: HPSE enhancer RNA
promotes cancer progression through driving chromatin looping and
regulating hnRNPU/p300/EGR1/HPSE axis. Oncogene. 20:2728–2745.
2018. View Article : Google Scholar : PubMed/NCBI
|
|
24
|
Wang H, Guo M, Wei H and Chen Y: Targeting
MCL-1 in cancer: current status and perspectives. J Hematol Oncol.
1:672021. View Article : Google Scholar
|
|
25
|
Sanderson RD, Elkin M, Rapraeger AC, Ilan
N and Vlodavsky I: Heparanase regulation of cancer, autophagy and
inflammation: New mechanisms and targets for therapy. FEBS J.
284:42–55. 2017. View Article : Google Scholar : PubMed/NCBI
|
|
26
|
Tumova S, Woods A and Couchman JR: Heparan
sulfate proteoglycans on the cell surface: versatile coordinators
of cellular functions. Int J Biochem Cell Biol. 32:269–288. 2000.
View Article : Google Scholar : PubMed/NCBI
|
|
27
|
Zhou Y, Song B, Qin WJ, Zhang G, Zhang R,
Luan Q, Pan TJ, Yang AG and Wang H: Heparanase promotes bone
destruction and invasiveness in prostate cancer. Cancer Lett.
268:252–259. 2008. View Article : Google Scholar : PubMed/NCBI
|
|
28
|
Li QW, Zhang GL, Hao CX, Ma YF, Sun X,
Zhang Y, Cao KX, Li BX, Yang GW and Wang XM: SANT, a novel Chinese
herbal monomer combination, decreasing tumor growth and
angiogenesis via modulating autophagy in heparanase overexpressed
triple-negative breast cancer. J Ethnopharmacol. 266:1134302021.
View Article : Google Scholar : PubMed/NCBI
|
|
29
|
Shteingauz A, Boyango I, Naroditsky I,
Hammond E, Gruber M, Doweck I, Ilan N and Vlodavsky I: Heparanase
enhances tumor growth and chemoresistance by promoting autophagy.
Cancer Res. 75:3946–3957. 2015. View Article : Google Scholar : PubMed/NCBI
|
|
30
|
Tatsumi Y, Miyake M, Shimada K, Fujii T,
Hori S, Morizawa Y, Nakai Y, Anai S, Tanaka N, Konishi N and
Fujimoto K: Inhibition of heparanase expression results in
suppression of invasion, migration and adhesion abilities of
bladder cancer cells. Int J Mol Sci. 21:37892020. View Article : Google Scholar : PubMed/NCBI
|
|
31
|
Vlodavsky I, Beckhove P, Lerner I, Pisano
C, Meirovitz A, Ilan N and Elkin M: Significance of heparanase in
cancer and inflammation. Cancer Microenviron. 5:115–132. 2012.
View Article : Google Scholar : PubMed/NCBI
|
|
32
|
Masola V, Zaza G, Onisto M, Lupo A and
Gambaro G: Impact of heparanase on renal fibrosis. J Transl Med.
13:1812015. View Article : Google Scholar : PubMed/NCBI
|
|
33
|
Morciano G, Giorgi C, Balestra D, Marchi
S, Perrone D, Pinotti M and Pinton P: Mcl-1 involvement in
mitochondrial dynamics is associated with apoptotic cell death. Mol
Biol Cell. 27:20–34. 2016. View Article : Google Scholar : PubMed/NCBI
|
|
34
|
Luo W, Nagaria TS, Sun H, Ma J, Lombardo
JL, Bassett R, Cao AC and Tan D: Expression and potential
prognostic value of SOX9, MCL-1 and SPOCK1 in gastric
adenocarcinoma. Pathol Oncol Res. 28:16102932022. View Article : Google Scholar : PubMed/NCBI
|
|
35
|
Vela L and Marzo I: Bcl-2 family of
proteins as drug targets for cancer chemotherapy: The long way of
BH3 mimetics from bench to bedside. Curr Opin Pharmacol. 23:74–81.
2015. View Article : Google Scholar : PubMed/NCBI
|
|
36
|
Bashari MH, Fan F, Vallet S, Sattler M,
Arn M, Luckner-Minden C, Schulze-Bergkamen H, Zörnig I, Marme F,
Schneeweiss A, et al: Mcl-1 confers protection of Her2-positive
breast cancer cells to hypoxia: Therapeutic implications. Breast
Cancer Res. 18:262016. View Article : Google Scholar : PubMed/NCBI
|
|
37
|
Omari S, Waters M, Naranian T, Kim K,
Perumalsamy AL, Chi M, Greenblatt E, Moley KH, Opferman JT and
Jurisicova A: Mcl-1 is a key regulator of the ovarian reserve. Cell
Death Dis. 6:e17552015. View Article : Google Scholar : PubMed/NCBI
|
|
38
|
Ma J, Zhao Z, Wu K, Xu Z and Liu K: MCL-1
is the key target of adjuvant chemotherapy to reverse the
cisplatin-resistance in NSCLC. Gene. 587:147–154. 2016. View Article : Google Scholar : PubMed/NCBI
|
|
39
|
Xiang W, Yang CY and Bai L: MCL-1
inhibition in cancer treatment. Onco Targets Ther. 11:7301–7314.
2018. View Article : Google Scholar : PubMed/NCBI
|
|
40
|
Leverson JD, Zhang H, Chen J, Tahir SK,
Phillips DC, Xue J, Nimmer P, Jin S, Smith M, Xiao Y, et al: Potent
and selective small-molecule MCL-1 inhibitors demonstrate on-target
cancer cell killing activity as single agents and in combination
with ABT-263 (navitoclax). Cell Death Dis. 6:e15902015. View Article : Google Scholar : PubMed/NCBI
|