Introduction
Liver cancer is still a primary global health
concern, and its incidence rate is rising worldwide (1). According to the GLOBOCAN report from
2018, more than 1 million people will be diagnosed with liver
cancer by 2025. The most prevalent form of liver cancer, known as
human hepatocellular carcinoma (HCC), makes up around 90% of all
cases that are detected (2).
Because of the difficulty in getting an early diagnosis and the
limited number of therapy options, the majority of patients with
advanced-stage HCC have poor treatment outcomes (3). In recent years, novel treatment
options for HCC have developed. Especially, many studies have
investigated the synergistic effects and enhanced antitumor
activity of combining locoregional and systemic therapies, based on
strong biological rationale (4–7).
Therefore, the creation of novel biomarkers and the creation of
gene expression profiles are essential for improving early
detection and precise prognosis as well as for offering a chance to
better match the most efficient medications with the molecular
characteristics of each patient (8).
A biomarker is defined as any substance, structure,
or function that can be detected in the body, which influences or
predicts the incidence of outcome or disease (9). This can be used to track early cancer
detection, assess the prognosis, or gauge the effectiveness of
therapy. The ideal biomarker is readily accessible, consistently
measurable, cost-effective, and extremely accurate (10). In cancer, several recent advances
have led to the diffusion of potential biomarkers, from genetic
materials (e.g., DNA, epigenetic changes, cell-free DNA, RNA,
mRNA), serum proteins, and circulating metabolites (11,12).
Although there are several identified biomarkers are available like
glypican 3 (GPC3), Golgi protein-73 (GP73), descarboxypro-thrombin
(DCP), glutamic pyruvic transaminase (GPT), gamma-glutamyl
carboxylase (GGCX), and osteopontin (OPN) as complementary
biomarkers for liver cancer diagnosis (13–16),
the early and specific diagnosis of liver cancer remains
challenging. Thus, it is crucial to identify more biomarkers
concerning liver cancer for better treatment and prognosis.
The molecular mechanism of liver cancer is now
better-understood thanks to the quick development of molecular
biology tools like high throughput sequencing, microarrays, and
different omics approaches. Epigenetics in particular has a
well-established function and is just as important as genetics
(17). Recent advances in the
knowledge of the molecular biomarkers involved in the onset and
progression of liver cancer as well as in the comprehensive mapping
of the disease's key mechanisms have been made possible by the use
of integrated multi-omics studies (18–20).
Transcriptomic analysis is a method that uses
bioinformatics tools to examine changed target genes and comprehend
the mechanism of action of a medicine after screening with an in
vitro model (21). To better
understand factors like particular pathways altered by a candidate
meditation, differential gene expression under drug-treated disease
conditions can be helpful (22).
Additionally, gene expression information gleaned from
transcriptome data can result in the discovery of new key genes
connected to a pathway (23).
Target identification with the use of natural products can
accelerate patient-specific treatment methods.
New therapeutic alternatives are required for liver
cancer patients. Using natural chemicals or nanotechnology could
offer improved therapy with less toxicity and fewer side effects
for patients, potentially leading to better prognoses (24). Scutellarein (SCU), a flavone present
in the perennial herb Scutellaria baicalensis, is the
aglycone of scutellarin with a free hydroxyl in 7 positions and has
a higher bioavailability than scutellarin (25). Numerous research has shown that SCU
may reduce the viability of human lung cancer cells and
fibrosarcoma cells (26,27). It also depicted an anti-tumor effect
in human colon cancer (28,29). In addition, our previous study
showed that SCU inhibited cell proliferation and metastasis by
upregulating PTEN in human hepatocellular carcinoma (30). First discovered as a tumor
suppressor, PTEN (phosphatase and tensin homolog deleted on
chromosome 10) is a highly targeted protein in a number of human
illnesses (31,32). PTEN activity and expression appear
to be regulated by a variety of intricate processes, which is
consistent with these perspectives. Among these mechanisms,
epigenetic silencing by hypermethylation of its promoter (33) or histone deacetylase activity
(34) strongly affects PTEN
expression. Even so, the mechanism of PTEN regulation remains
elusive.
Histone modifications have long been assumed that
they have a practical impact on the control of transcription
(35). Linker histone H1 (Histone
H1) is a chromatin structural component that aids in the
structuring and stability of higher-order condensed chromatin
structures (36). The higher
expression of histone H1 shows that the SCU induces anti-tumor
activity through histone H1 (37).
PTEN physically binds with histone H1 to maintain a condensed
chromatin structure, which is reflected by histone H1 chromatin
occupancy and hypoacetylation of histone H4, resulting in
suppression of overall gene activity (38). Knockdown of H1 in HCC1954 cells
promoted an increase in renewable cancer stem cells (37).
Overall, the main objective of this study was to use
a transcriptomic approach to find potential targets of SCU for
treating liver cancer. Additionally, the study aimed to gain a
deeper understanding of the connection between crucial targets that
regulate PTEN, which has previously been identified as an
anti-tumor agent for SCU (30).
Materials and methods
Cell culture
Human liver cancer HepG2 cell line was obtained from
the Korean Cell Line Bank (Seoul, Korea). HepG2 cells were cultured
in Dulbecco's modified Eagle's medium (DMEM) (Gibco; Thermo Fisher
Scientific, Inc.) containing 10% fetal bovine serum (FBS) (Gibco;
Thermo Fisher Scientific, Inc.), and 100 U/ml penicillin/100 µg/ml
streptomycin (P/S) (Gibco; Thermo Fisher Scientific, Inc.) at 37°C
of 5% CO2. Scutellarein (SCU) was purchased from Chengdu
Biopurify Phytochemicals Ltd. (Chengdu, Sichuan, China).
Isolation of RNA for sequencing
HepG2 cells were seeded into 6-well plates at
1.5×10⁵ cells per well and treated with 100 µM of SCU
for 48 h at 37°C of 5% CO2. After incubation, total RNAs
were extracted using TRIzol (Ambion, Thermo Scientific, Rockford,
IL, USA). The concentration of RNA was determined using a
spectrophotometer (BioTek, Winooski, VT, USA). Isolated total RNA
was then subjected to sequencing to obtain expression data.
Library preparation and
sequencing
The mRNA sequencing was prepared by Theragenbio
(Seongnam-si, Gyeonggi-do) using the following protocol (Table I). The libraries were prepared for
151bp paired-end sequencing using TruSeq stranded mRNA Sample
Preparation Kit (Illumina, CA, USA). Utilizing oligo (dT) magnetic
beads, mRNA molecules were specifically isolated and fragmented
from 1 µg of total RNA. The fragmented mRNAs were synthesized as
single-stranded cDNAs through random hexamer priming.
Double-stranded cDNA was created by using this as a template for
second-strand synthesis. After the sequential process of end
repair, A-tailing, and adapter ligation, cDNA libraries were
amplified with PCR (Polymerase Chain Reaction). The quality of
these cDNA libraries was evaluated with the Agilent 2100
BioAnalyzer (Agilent, CA, USA). According to the manufacturer's
library quantification methodology, they were measured using the
KAPA library quantification kit (Kapa Biosystems, MA, USA).
Following cluster amplification of denatured templates, sequencing
was progressed as paired-end (2×151 bp) using Illumina NovaSeq6000
(Illumina, CA, USA).
 | Table I.Sequencing statistics data. |
Table I.
Sequencing statistics data.
| No. | Name | Type | Reads, n (%) | Bases, n (%) | Bases, Gb | GC, n (%) | N, n (%) | Q30a, n (%) |
|---|
| 1 | Control | Raw | 45,235,978 | 6,830,632,678 | 6.83 | 3,408,682,904 | 13,280 | 6,416,713,568 |
|
|
|
| (100.0%) | (100.0%) |
| (49.9%) | (0.0%) | (93.94%) |
| 1 | Control | Clean | 44,943,094 | 6,622,233,019 | 6.62 | 3,292,325,453 | 12,364 | 6,246,152,632 |
|
|
|
| (99.35%) | (96.95%) |
| (49.72%) | (0.0%) | (94.32%) |
| 2 | Test | Raw | 41,769,186 | 6,307,147,086 | 6.31 | 3,307,569,595 | 12,607 | 5,872,870,702 |
|
|
|
| (100.0%) | (100.0%) |
| (52.44%) | (0.0%) | (93.11%) |
| 2 | Test | Clean | 41,372,112 | 6,061,914,152 | 6.06 | 3,173,001,276 | 11,591 | 5,674,328,197 |
|
|
|
| (99.05%) | (96.11%) |
| (52.34%) | (0.0%) | (93.61%) |
Transcriptome data analysis
Filtering
The adapter sequences and ends of the reads less
than Phred quality score 20 were trimmed and simultaneously the
reads shorter than 50 bp were removed by using cutadapt v.2.8
(39).
Sequence alignment
Using the aligner STAR v.2.7.1a (40) and the ‘quantMode TranscriptomeSAM’
option for estimating transcriptome expression level, filtered
reads were mapped to the reference genome associated with the
species using ENCODE standard parameters (see to ‘Alignment’ of
‘Help’ section of the HTML report).
Gene expression estimation
By using the ‘strandedness’ option in RSEM v.1.3.1
(41) and taking into account the
reads' direction in relation to the library technique, gene
expression was estimated. The ‘estimate-rspd’ option was used to
increase measurement accuracy. The default settings were used for
all other options. FPKM (Fragments Per Kilobase Million) and TPM
(Transcripts Per Kilobase Million) values were generated to
standardize sequencing depth among samples.
Differentially expressed genes (DEG)
analysis
The R package TCC v.1.26.0 was used to identify DEG
based on the projected read counts from the preceding stage
(42). TCC program compares tag
count data using effective normalizing techniques. With the use of
the iterative DESeq2 (43)/edgeR
(44) approach, normalization
factors were computed. Using the p.adjust function of the R package
with the default parameter settings, the q-value was
determined based on the P-value. Based on the q-value
criterion of less than 0.05 for correcting mistakes brought on by
multiple testing, the DEG were found.
Drug and disease association
analyses
To predict drug and disease associations for
candidate genes, our analysis was carried out in a functional
database that was suggested (i.e., Drug Bank) by WEB-based GEne SeT
AnaLysis (WebGestalt). Drug Bank and drug were chosen as the
functional database and enrichment category, respectively, to
predict the most important drugs for our target genes. The gene
count was set at ≥ 5, and a P-value with a false discovery rate
(FDR) adjusted of less than 0.05 was considered statistically
significant. The WebGestalt derives significance results by
clustering sets of genes using the Jaccard index as a criterion of
similarity, prioritizing sets with significant P-value, and
automatically identifying a ‘model’ or representative for each
cluster (45).
miRNA-target enrichment analysis
Mienturnet (MicroRNA ENrichment TURned NETwork) is
used to predict the miRNA target related to differentially
regulated genes. 463 DEG was taken for prediction (both up and
down-regulated). Out of 665 entries, we chose the top 10 entries
based on the number of interactions.
Gene ontology (GO) analysis
GO database provides a set of hierarchical
controlled vocabulary classified into 3 categories: Biological
Process (BP), Cellular Component (CC), and Molecular Function (MF).
For functional characterization of the DEG, a GO-based trend test
was carried out using the R package called GOseq (46) through the Wallenius non-central
hypergeometric distribution. Selected genes of P-value <0.05
following the test were regarded as statistically significant.
Molecular docking analysis
Molecular docking of Erlotinib and PTEN were
performed using PyMol (The PyMOL Molecular Graphics System, Version
1.2r3pre, Schrödinger, LLC.) and USCF (47) chimera with the default parameters.
Molecular docking of histone H1 and PTEN were performed using HDOCK
server (http://hdock.phys.hust.edu.cn/) with the default
parameters. Analysis for molecular interaction between histone H1
and PTEN was conducted through Discovery Studio 2018 (BIOVIA, San
Diego, CA, USA).
STRING network analysis and pathway
enrichment on the identifiable targets
The protein-protein interaction for up-regulated and
down-regulated genes was performed using an online tool, Search
Tool for the Retrieval of Interacting Genes/Proteins (STRING)
(Accessed on 24, Jun 2021). Up-regulated gene interaction showed
about 61 nodes, whereas the expected number of nodes was 57
(P-value; 1×10¹⁶). Down-regulated gene interaction
showed about 26 nodes, whereas the expected number of nodes was 2
(P-value; 7.47×10¹¹). Thus, the interaction was more
significant than expected. In up-regulated genes, the significant
pathways enriched were chosen based on KEGG, Wiki, and Reactome
pathway analyses.
Western blot analysis
HepG2 cells were treated with indicated
concentrations of SCU (0, 25, and 100) µM and lysed using
radioimmunoprecipitation assay (RIPA) buffer (iNtRON Biotechnology,
Seoul, Korea) containing phosphatase and protease inhibitor
cocktail (Thermo Scientific, Rockford, IL, USA). Protein
quantification were determined using a Pierce™ BCA assay (Thermo
Fisher Scientific, Rockford, IL, USA). An equal quantity of protein
(10 µg) from each sample was electrophoresed on (8–15)%
SDS-polyacrylamide gels and transferred to a polyvinylidene
difluoride (PVDF) membrane (ATTO Co., Ltd., Tokyo, Japan).
Membranes were blocked with 5% (bovine serum albumin (BSA) in
Tris-buffered saline containing 1% Tween 20 (TBS-T, pH 7.4) at room
temperature for 1 h, and incubated overnight at 4°C with primary
antibodies. The membranes were washed with TBS-T buffer for every
15 min in five times at room temperature, further they were
incubated with 1:5,000 dilution of HRP-conjugated secondary
antibody for 2–3 h at room temperature. The obtained proteins were
detected by an electrochemiluminescence (ECL) detection system
(Bio-Rad Laboratory, Hercules, CA, USA), and analyzed using the
Image Lab 4.1 (Bio-Rad) program. The densitometry readings of the
protein bands were normalized by comparison with the expression of
β-actin as control, using the ImageJ software program (U.S.
National Institutes of Health, Bethesda, MD, USA). Antibodies of
histone H1-4 (Cat. no. 41328S), PTPRC (Cat. no. 72787S), and
β-actin (Cat. no. 4970S) were purchased from Cell Signaling
Technology (Danvers, MA, USA). Horseradish peroxidase
(HRP)-conjugated secondary antibodies to anti-rabbit (cat. no.
A120-101P) and anti-mouse (cat. no. A90-116P) were obtained from
Bethyl Laboratories, Inc (Montgomery, USA).
Statistical analysis
Western blot experimental data were analyzed using
GraphPad Prism version 8.0.2 (GraphPad Software). The findings were
presented as the means ± standard deviation (SD) of triplicate
samples. The unpaired Student's t-test was used to analyze the
results, and a P-value of <0.05 was considered statistically
significant.
Results
Identification of DEG
In our previous study on scutellarein (SCU)
treatment in human liver cancer HepG2 cells, we revealed that SCU
could inhibit cell proliferation and metastasis through PTEN
activation in HepG2 cells (30).
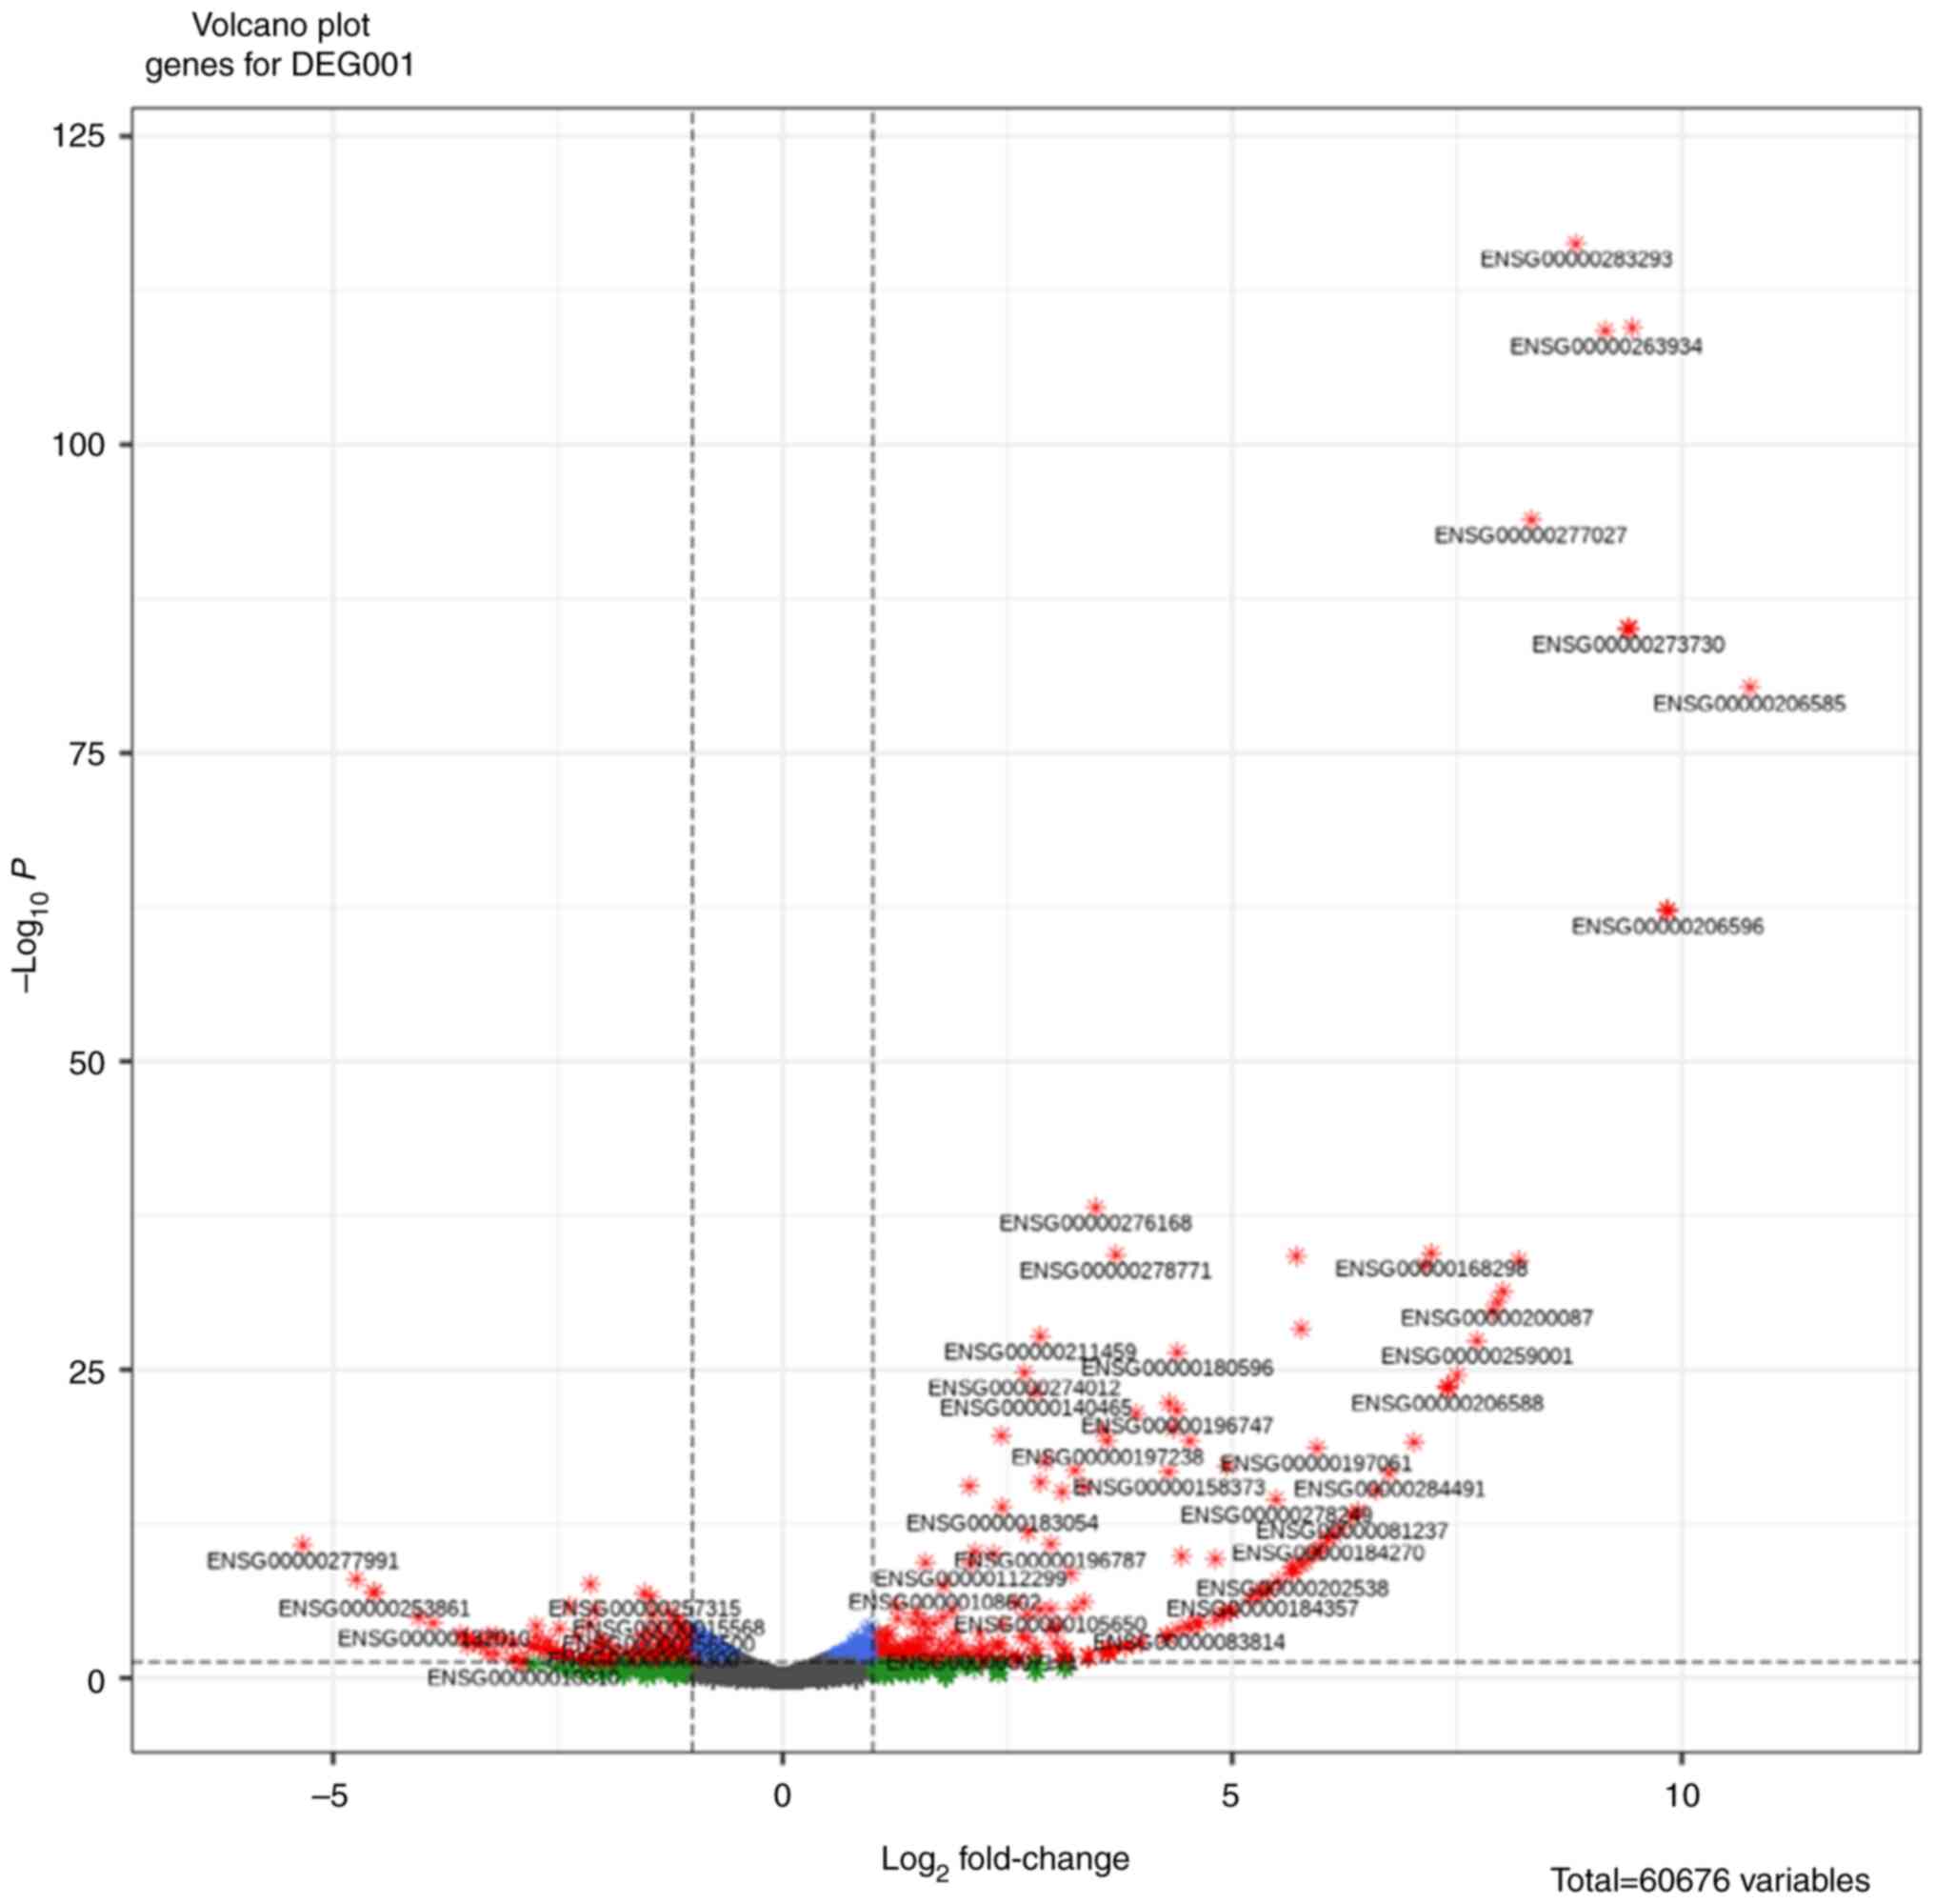
Herein, SCU-treated group were compared against the SCU-untreated
group which unraveled about total of 463 DEG (|log2
FC|>1.0 and P-value <0.05), including 288 up-regulated and
175 down-regulated DEG (Table II).
The DEG was represented as a volcano plot using an R-Bioconductor,
which consists of a total of 60,676 variables (Fig. 1).
| Table II.Differentially expressed genes. |
Table II.
Differentially expressed genes.
|
|
|
|
| Genes |
|---|
|
|
|
|
|
|
|---|
| No. | Controls | Cases | Sum | Up (controls <
cases) | Down (controls >
cases) |
|---|
| 1 | Control | Test | 463 | 288 | 175 |
Therapeutic drug association analysis
and molecular docking with PTEN
To identify the relationship between DEG and already
available drugs we performed a drug-disease association analysis.
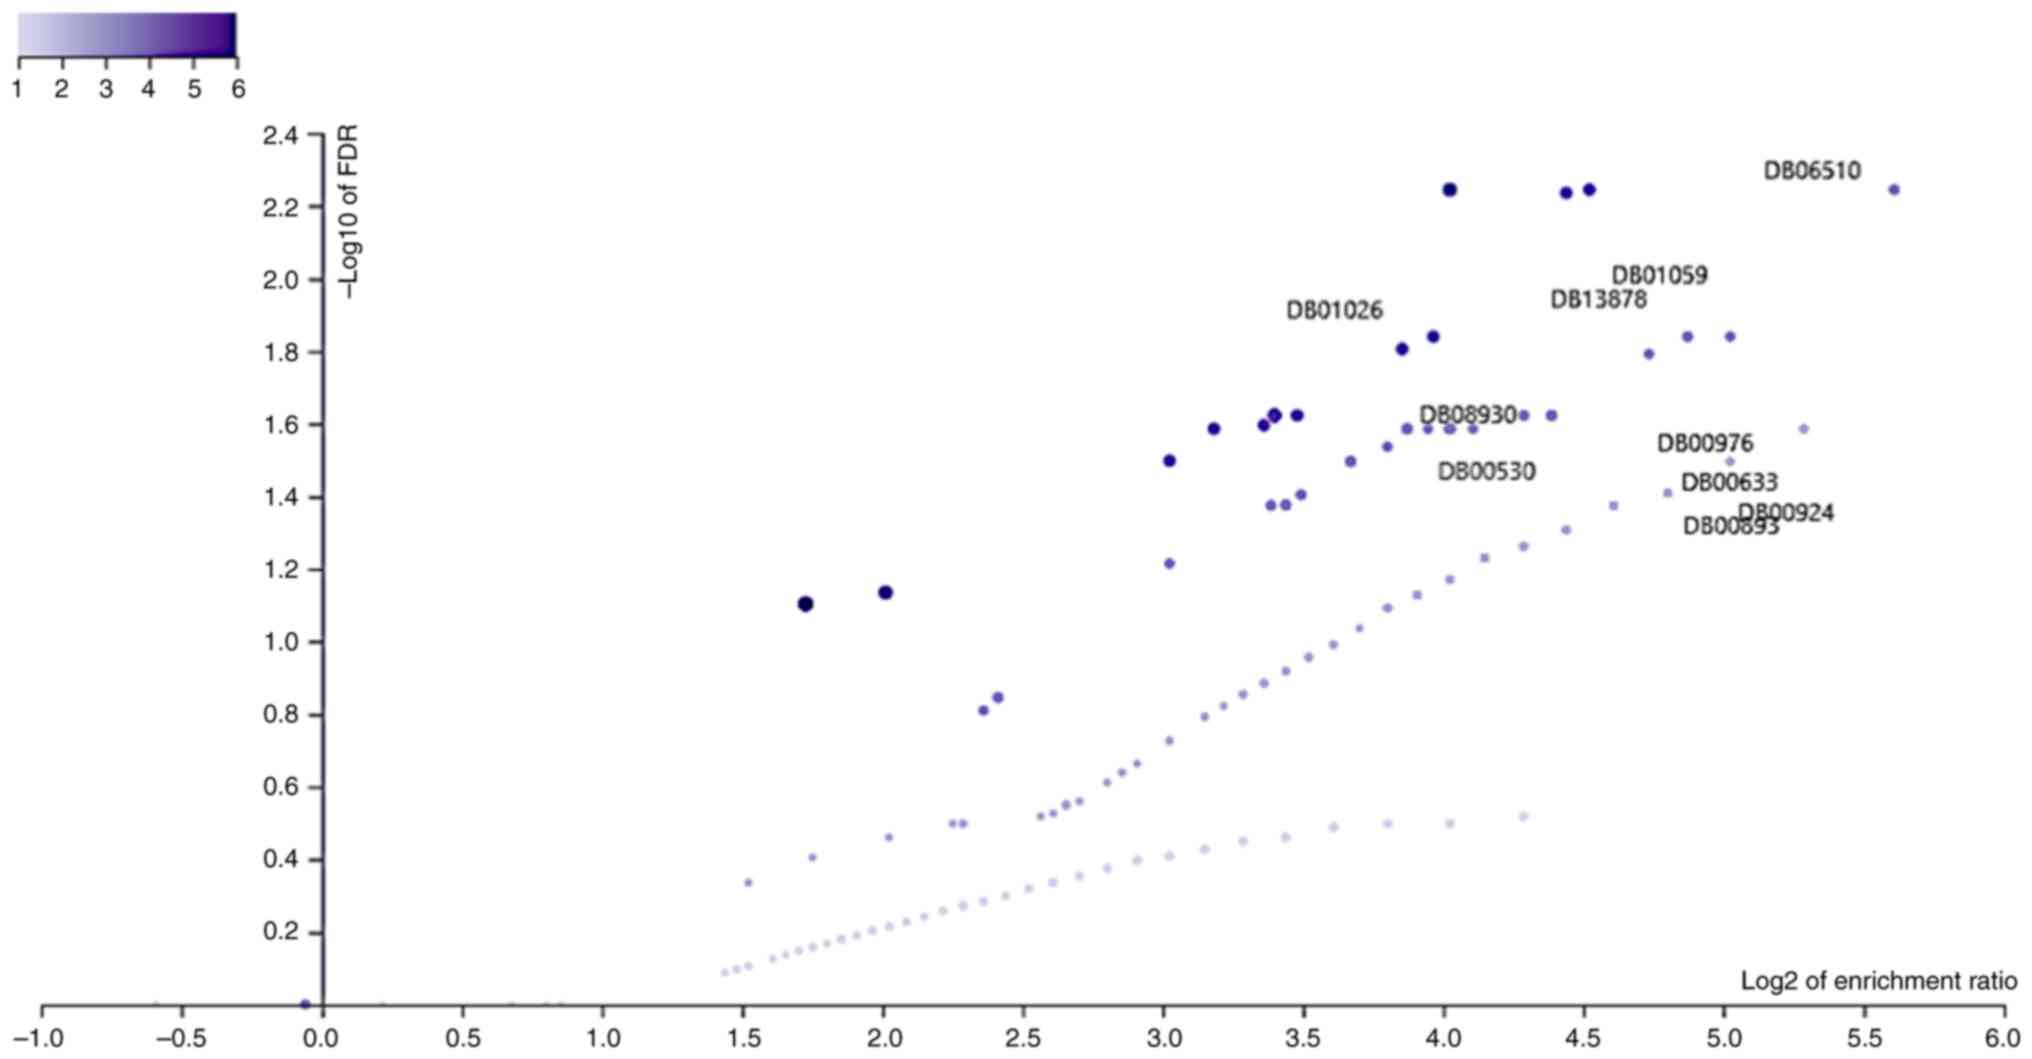
After drug and disease association analyses (Fig. 2, Table
III), we took the top 10 drugs which were significantly
associated with DEG (FDR <0.05, gene count was set at ≥5). Among
these drugs, the most effective cancer-specific drug is Erlotinib
and which is a PTEN regulatory target drug (48). Furthermore, Erlotinib is associated
with liver cancer, and it is used for the clinical treatment of
liver cancer patients as a sole treatment or combination treatment
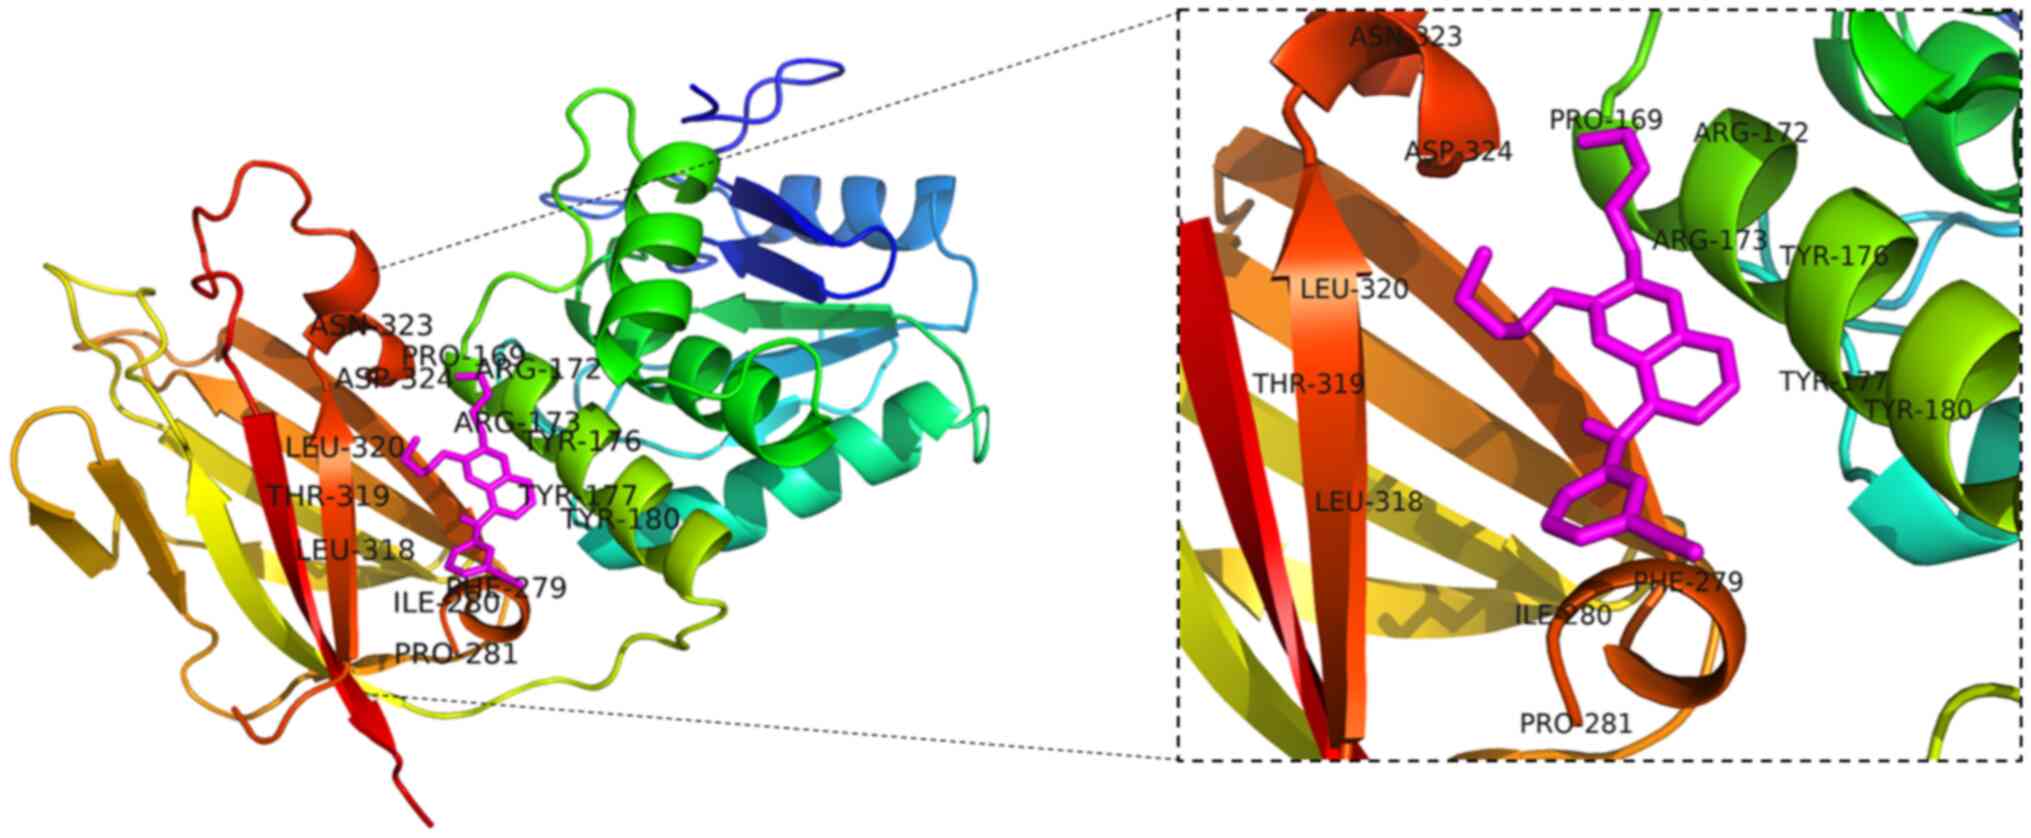
with Sorafenib (49). To confirm
the interaction of Erlotinib with PTEN, we performed drug and
protein molecular docking (Fig. 3).
UCSF Chimera software was used to validate the ligand-protein
structures of these molecules. According to molecular docking
studies, as shown in the image with the co-crystallized ligand, the
two ligands occupied the active site. It was also discovered that
many residues assisted in fitting the ligands into the binding
pocket. The interacting amino acid residues involved in the bound
complex of Erlotinib with PTEN were found to be PRO169, AGR172,
ARG173, TYR176, TYR177, TYR180, PHE279, ILE280, PRO281, LEU318,
THR319, LEU320, ASP324, and ASN323 (Table IV). The molecular dock scores
suggest that the compound demonstrated PyMOL final intramolecular
energy of −7.45 kcal/mol. In summary, SCU is associated with the
drug Erlotinib, which is used as a clinical drug to treat
PTEN-related diseases such as liver cancer. The development and use
of peptides or inhibitors that target PTEN-related kinases,
transcription factors, and cellular proteins could have a
significant therapeutic benefit in the treatment of PTEN-related
diseases (48). Therefore, we
strongly suggest a strong relationship between DEG and PTEN.
| Table III.Results of drug and disease
association analyses. |
Table III.
Results of drug and disease
association analyses.
| Gene set | Description | Size | Expect | Ratio | P-value | FDR |
|---|
| DB06510 | Muraglitazar | 6 | 0.061454 | 48.817 | 0.000019008 | 0.0056961 |
| DB01059 | Norfloxacin | 9 | 0.092182 | 32.544 | 0.000078191 | 0.014458 |
| DB13878 | Pibrentasvir | 10 | 0.10242 | 29.29 | 0.00011093 | 0.014458 |
| DB01026 | Ketoconazole | 27 | 0.27654 | 14.464 | 0.00013337 | 0.015644 |
| DB00530 | Erlotinib | 14 | 0.14339 | 20.921 | 0.00032728 | 0.023835 |
| DB08930 | Dolutegravir | 14 | 0.14339 | 20.921 | 0.00032728 | 0.023835 |
| DB00633 |
Dexmedetomidine | 5 | 0.051212 | 39.053 | 0.00099517 | 0.025941 |
| DB00893 | Iron Dextran | 5 | 0.051212 | 39.053 | 0.00099517 | 0.025941 |
| DB00924 |
Cyclobenzaprine | 5 | 0.051212 | 39.053 | 0.00099517 | 0.025941 |
| DB00976 | Telithromycin | 5 | 0.051212 | 39.053 | 0.00099517 | 0.025941 |
| Table IV.Molecular docking studies of selected
target drug with PTEN and their binding energies. |
Table IV.
Molecular docking studies of selected
target drug with PTEN and their binding energies.
| Drug-protein | Interacting amino
acid residues | Final
intermolecular energy, kcal/mol | Final total energy,
kcal/mol | Torsinal free
energy, kcal/mol | Unbound system's
energy, kcal/mol |
|---|
| Erlotinib | PRO169, AGR172,
ARG173, TYR176, TYR177, TYR180, PHE279, ILE280, PRO281, LEU318,
THR319, LEU320, ASP324, ASN323 | −7.45 | −1.33 | +2.98 | −1.33 |
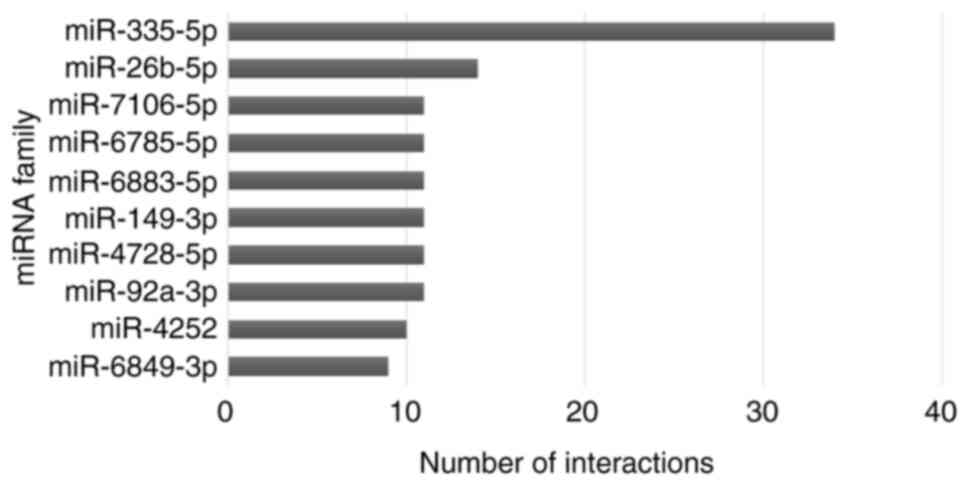
miRNA-DEG target prediction
Target identification of miRNA concerning DEG was
performed with the use of an online tool Mienturnet (MicroRNA
ENrichment TURned NETwork). Mienturnet predicts the target miRNA
based on statistical analysis, network-based visualization, and
analysis. Around 665 putative target miRNA were predicted
concerning 463 DEG. The top 10 miRNA targets were selected based on
the number of interactions and plotted in a graph. miR-335-5p and
miR-26b-5p showed a high number of target interactions which is
about 34 and 14 (Fig. 4).
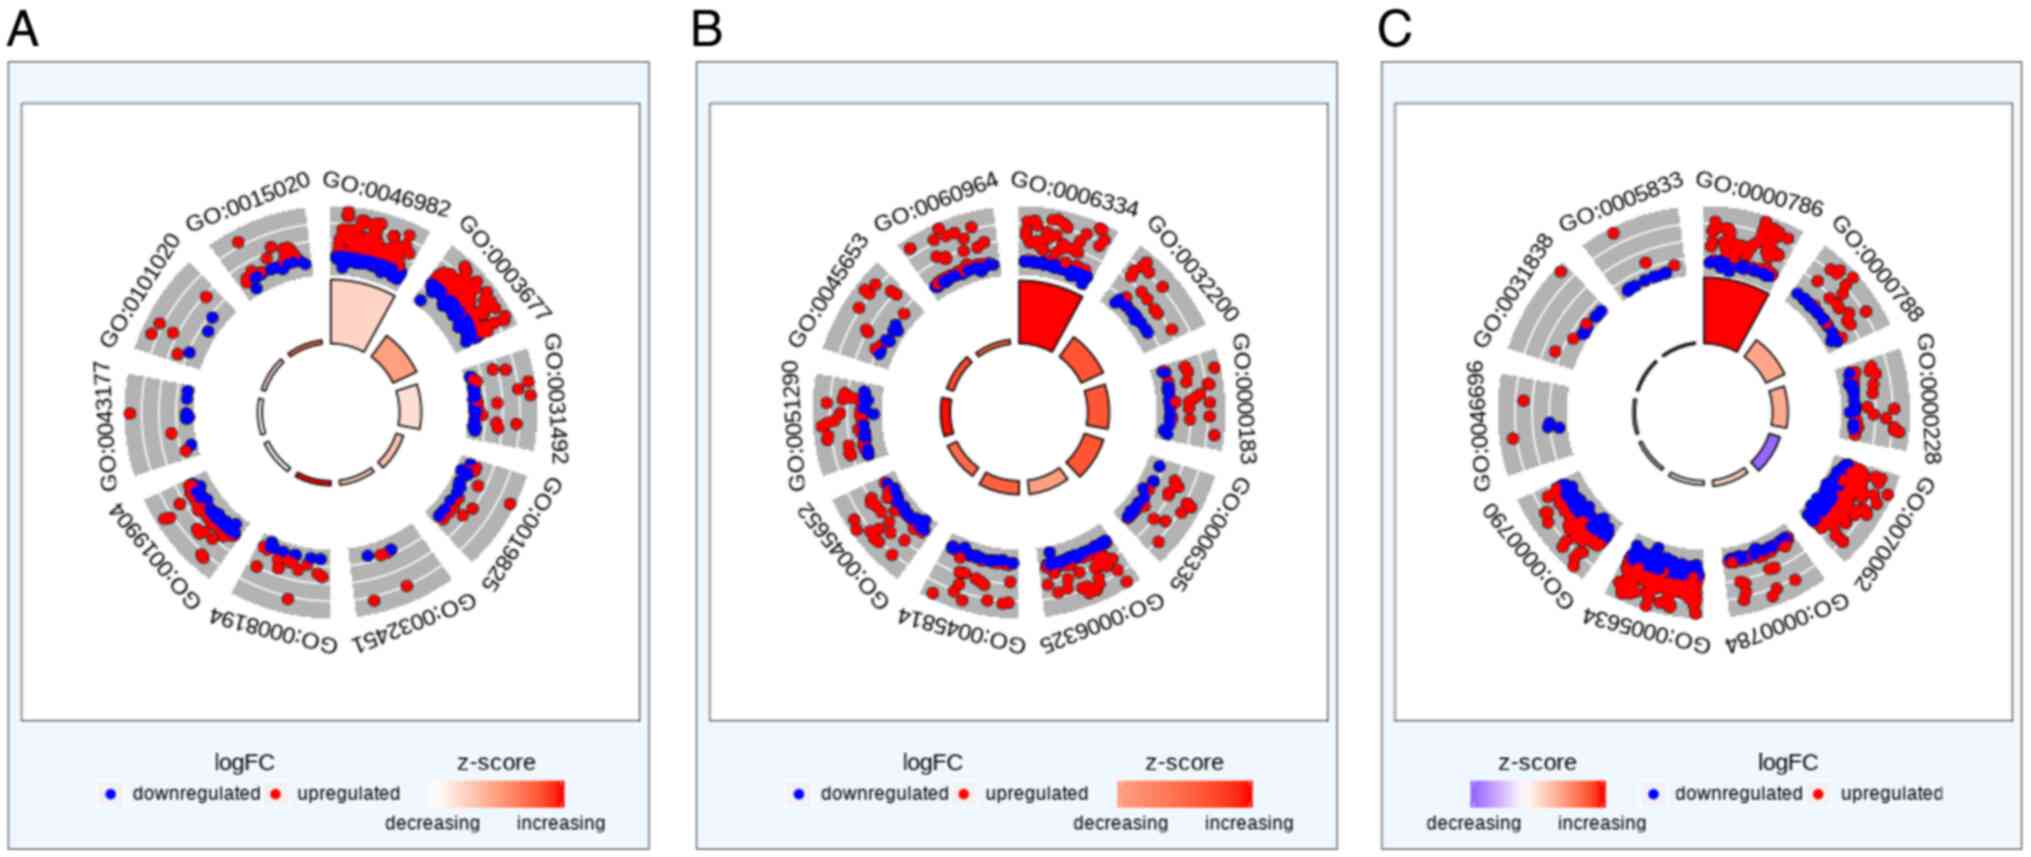
Functional and enrichment
analysis
Functional enrichment analysis is a method for
locating gene or protein classes that are disproportionately
represented in a big collection of genes or proteins that may be
associated with anti-tumor properties. When these hub genes were
subjected to enrichment analysis to identify significant gene
ontology (GO) terms, a list of up-regulated and down-regulated
genes involved in nucleosomes, cellular content, and molecular
function were shown in Fig. 5. The
highly expressed function in each category is listed in Table V. Additionally, Linker histone H1
(Histone H1) was involved in all obtained enriched functional
analyses.
| Table V.List of enriched GO in terms of (A)
molecular function, (B) biological process and (C) cellular
component. |
Table V.
List of enriched GO in terms of (A)
molecular function, (B) biological process and (C) cellular
component.
| A, Molecular
function |
|---|
|
|---|
| Gene ID | Term | Z-score |
|---|
| GO:0046982 | Protein
heterodimerization activity | 0.751 |
| GO:0003677 | DNA binding | 1.680 |
| GO:0031492 | Nucleosomal DNA
binding | 0.577 |
| GO:0019825 | Oxygen binding | 1.091 |
| GO:0032451 | Demethylase
activity | 0.816 |
| GO:0008194 |
UDP-glycosyltransferase activity | 3.357 |
| GO:0019904 | Protein domain
specific binding | −0.067 |
| GO:0043177 | Organic acid
binding | 0.000 |
| GO:0101020 | Estrogen
16-alpha-hydroxylase activity | 0.707 |
| GO:0015020 |
Glucuronosyltransferase activity | 2.400 |
|
| B, Biological
process |
|
| Gene ID | Term | Z-score |
|
| GO:0006334 | Nucleosome
assembly | 2.491 |
| GO:0032200 | Telomere
organization | 2.065 |
| GO:0000183 | Chromatin silencing
at Rdna | 2.043 |
| GO:0006335 | DNA
replication-dependent nucleosome assembly | 2.041 |
| GO:0006325 | Chromatin
organization | 1.237 |
| GO:0045814 | Negative regulation
of gene expression, epigenetic | 1.938 |
| GO:0045652 | Regulation of
megakaryocyte differentiation | 1.838 |
| GO:0051290 | Protein
heterotetramerization | 2.469 |
| GO:0045653 | Negative regulation
of megakaryocyte differentiation | 2.138 |
| GO:0060964 | Regulation of gene
silencing by miRNA | 1.886 |
|
| C, Cellular
component |
|
| Gene ID | Term | Z-score |
|
| GO:0000786 | Nucleosome | 5.501 |
| GO:0000788 | Nuclear
nucleosome | 2.558 |
| GO:0000228 | Nuclear
chromosome | 2.402 |
| GO:0070062 | Extracellular
exosome | −3.607 |
| GO:0000784 | Nuclear chromosome,
telomeric region | 1.460 |
| GO:0005634 | Nucleus | −0.667 |
| GO:0000790 | Nuclear
chromatin | −0.53 |
| GO:0046696 | Lipopolysaccharide
receptor complex | −0.447 |
| GO:0031838 |
Haptoglobin-hemoglobin complex | 0.816 |
| GO:0005833 | Hemoglobin
complex | 0.000 |
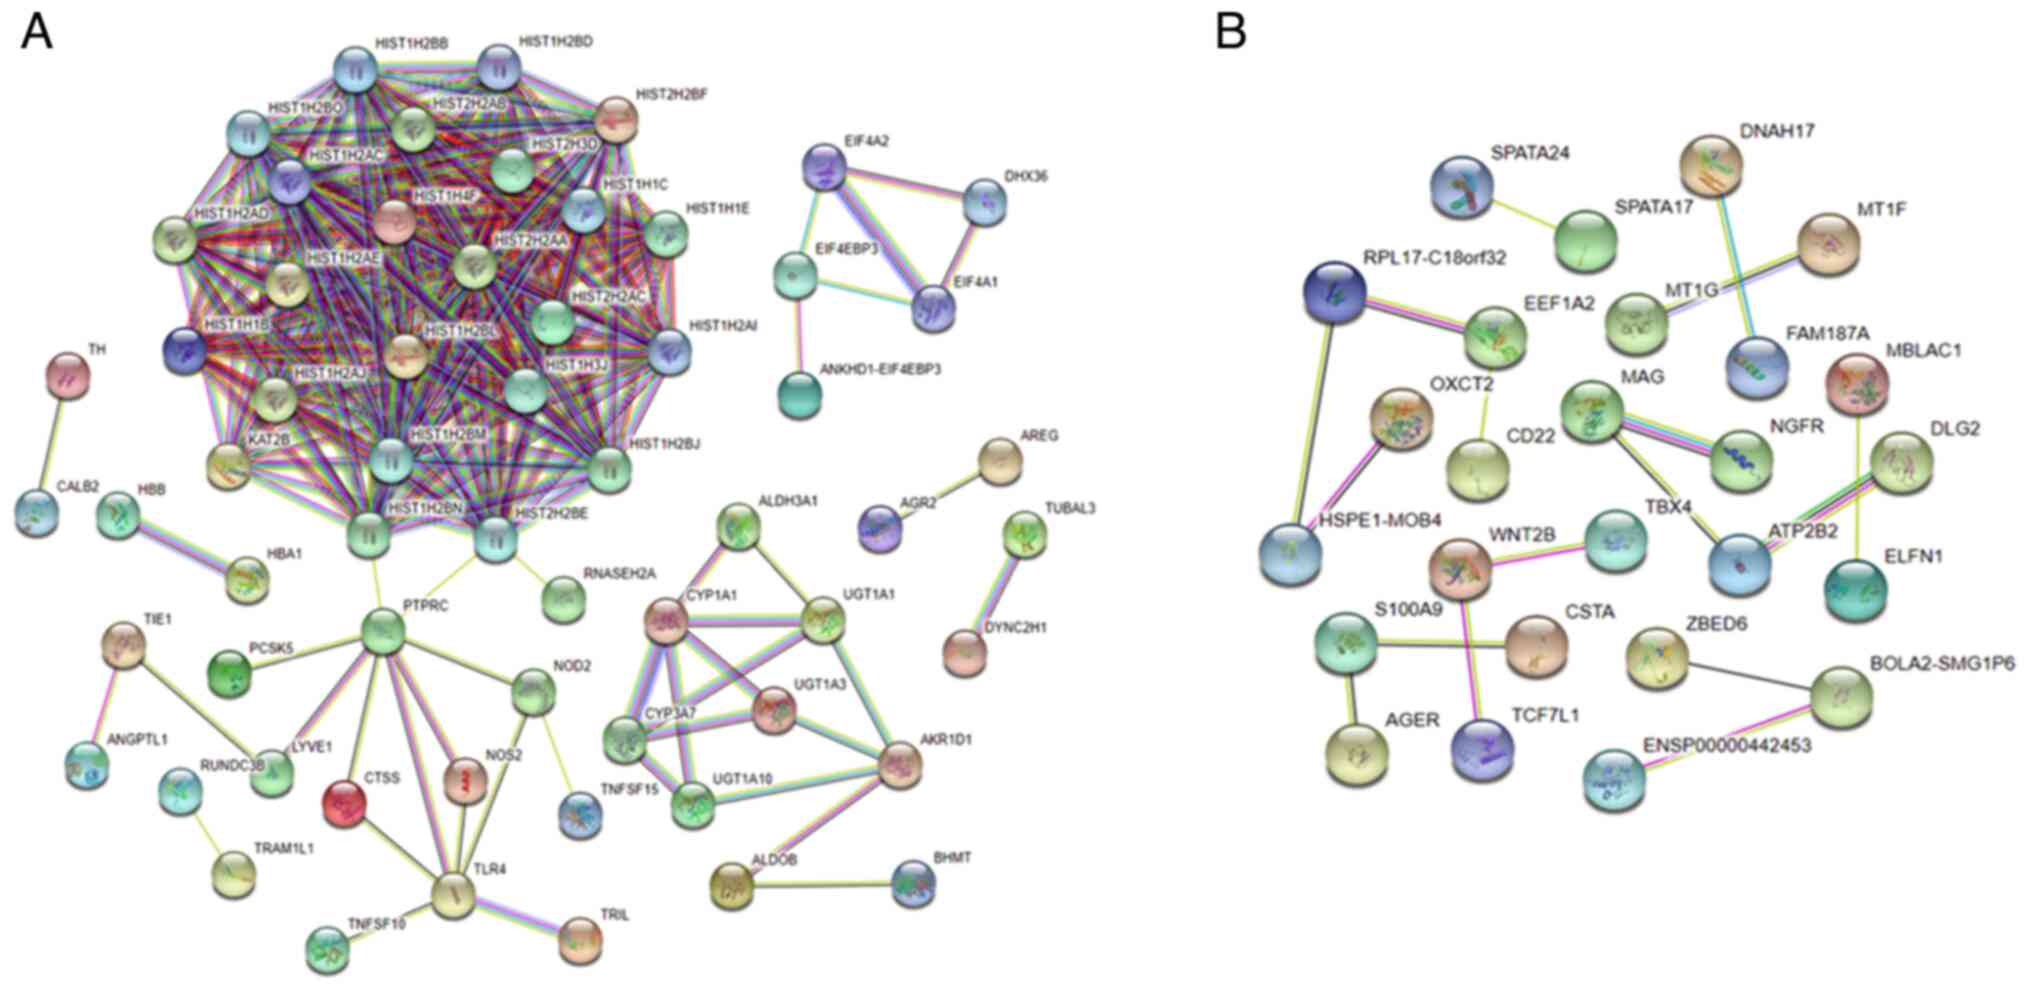
PPI network interaction and pathway
enrichment analysis
Fig. 6A and B show
the protein-protein interaction (PPI) network of up-regulated and
down-regulated genes. The histone has a higher degree of the
up-regulated PPI network, including 61 nodes and 293 edges. In
contrast, the down-regulated PPI network, including 26 nodes and 17
edges, shows no significant relations. The figure summarizes the
network of anticipated connections for a specific protein group.
The edges represent the anticipated functional connections based on
seven types of evidence: fusion evidence, neighborhood evidence,
concurrence evidence, experimental evidence, text mining evidence,
database evidence, and co-expression evidence. In addition, the
pathway enrichment analysis of the potential targets were
identified using different database (Table VI). Table VI lists the results of the
screening. The KEGG database were found to be necroptosis, drug
metabolism, pentose and glucuronate interconversions, porphyrin and
chlorophyll metabolism, and phagosome pathway. Wiki database was
found to be histone modifications, codeine and morphine metabolism,
tamoxifen metabolism, and translation factors pathway. Reactome
database shown to be HDACs deacetylate histones, DNA methylation,
PRC2 methylates histones and DNA, Transcriptional regulation by
small RNAs, deubiquitination, apoptosis induced DNA fragmentation,
and caspase activation via death receptors in the presence of
ligand pathway.
| Table VI.Pathway enrichment analysis of the
predicted targets of scutellarein. |
Table VI.
Pathway enrichment analysis of the
predicted targets of scutellarein.
| A, KEGG
pathways |
|---|
|
|---|
| Pathway ID | Description | Strength | FDR |
|---|
| Hsa04217 | Necroptosis | 1.33 |
4.86×10⁹ |
| Hsa00982 | Drug
metabolism-cytochrome P450 | 1.3 | 0.0022 |
| Hsa00040 | Pentose and
glucoronate interconversions | 1.46 | 0.0058 |
| Hsa00860 | Porphyrin and
chlorophyll metabolism | 1.37 | 0.0097 |
| Hsa04145 | Phagosome | 0.96 | 0.0285 |
|
| B, Wiki
pathways |
|
| Pathway
ID |
Description |
Strength | FDR |
|
| WP2369 | Histone
modifications | 1.34 | 0.0475 |
| WP1604 | Codeine and
morphine metabolism | 1.81 | 0.0076 |
| WP691 | Tamoxifen
metabolism | 1.66 | 0.0125 |
| WP107 | Translation
factors | 1.29 | 0.0480 |
|
| C, Reactome
Pathways |
|
| Pathway
ID |
Description |
Strength | FDR |
|
| Hsa3214815 | HDACs deacetylate
histones | 1.98 |
1.85×1026 |
| Hsa5334118 | DNA
methylation | 2.15 |
1.70×1024 |
| Hsa212300 | PRC2 methylates
histones and DNA | 2.06 |
1.37×10²³ |
| Hsa5578749 | Transcriptional
regulation by small RNAs | 1.8 |
9.69×10²¹ |
| Hsa5688426 |
Deubiquitination | 1.34 |
1.09×10¹⁸ |
| Hsa140342 | Apoptosis-induced
DNA fragmentation | 1.87 | 0.0003 |
| Hsa109581 | Apoptosis | 0.97 | 0.0048 |
| Hsa140534 | Caspase activation
via death receptors in the presence of ligand | 1.6 | 0.0278 |
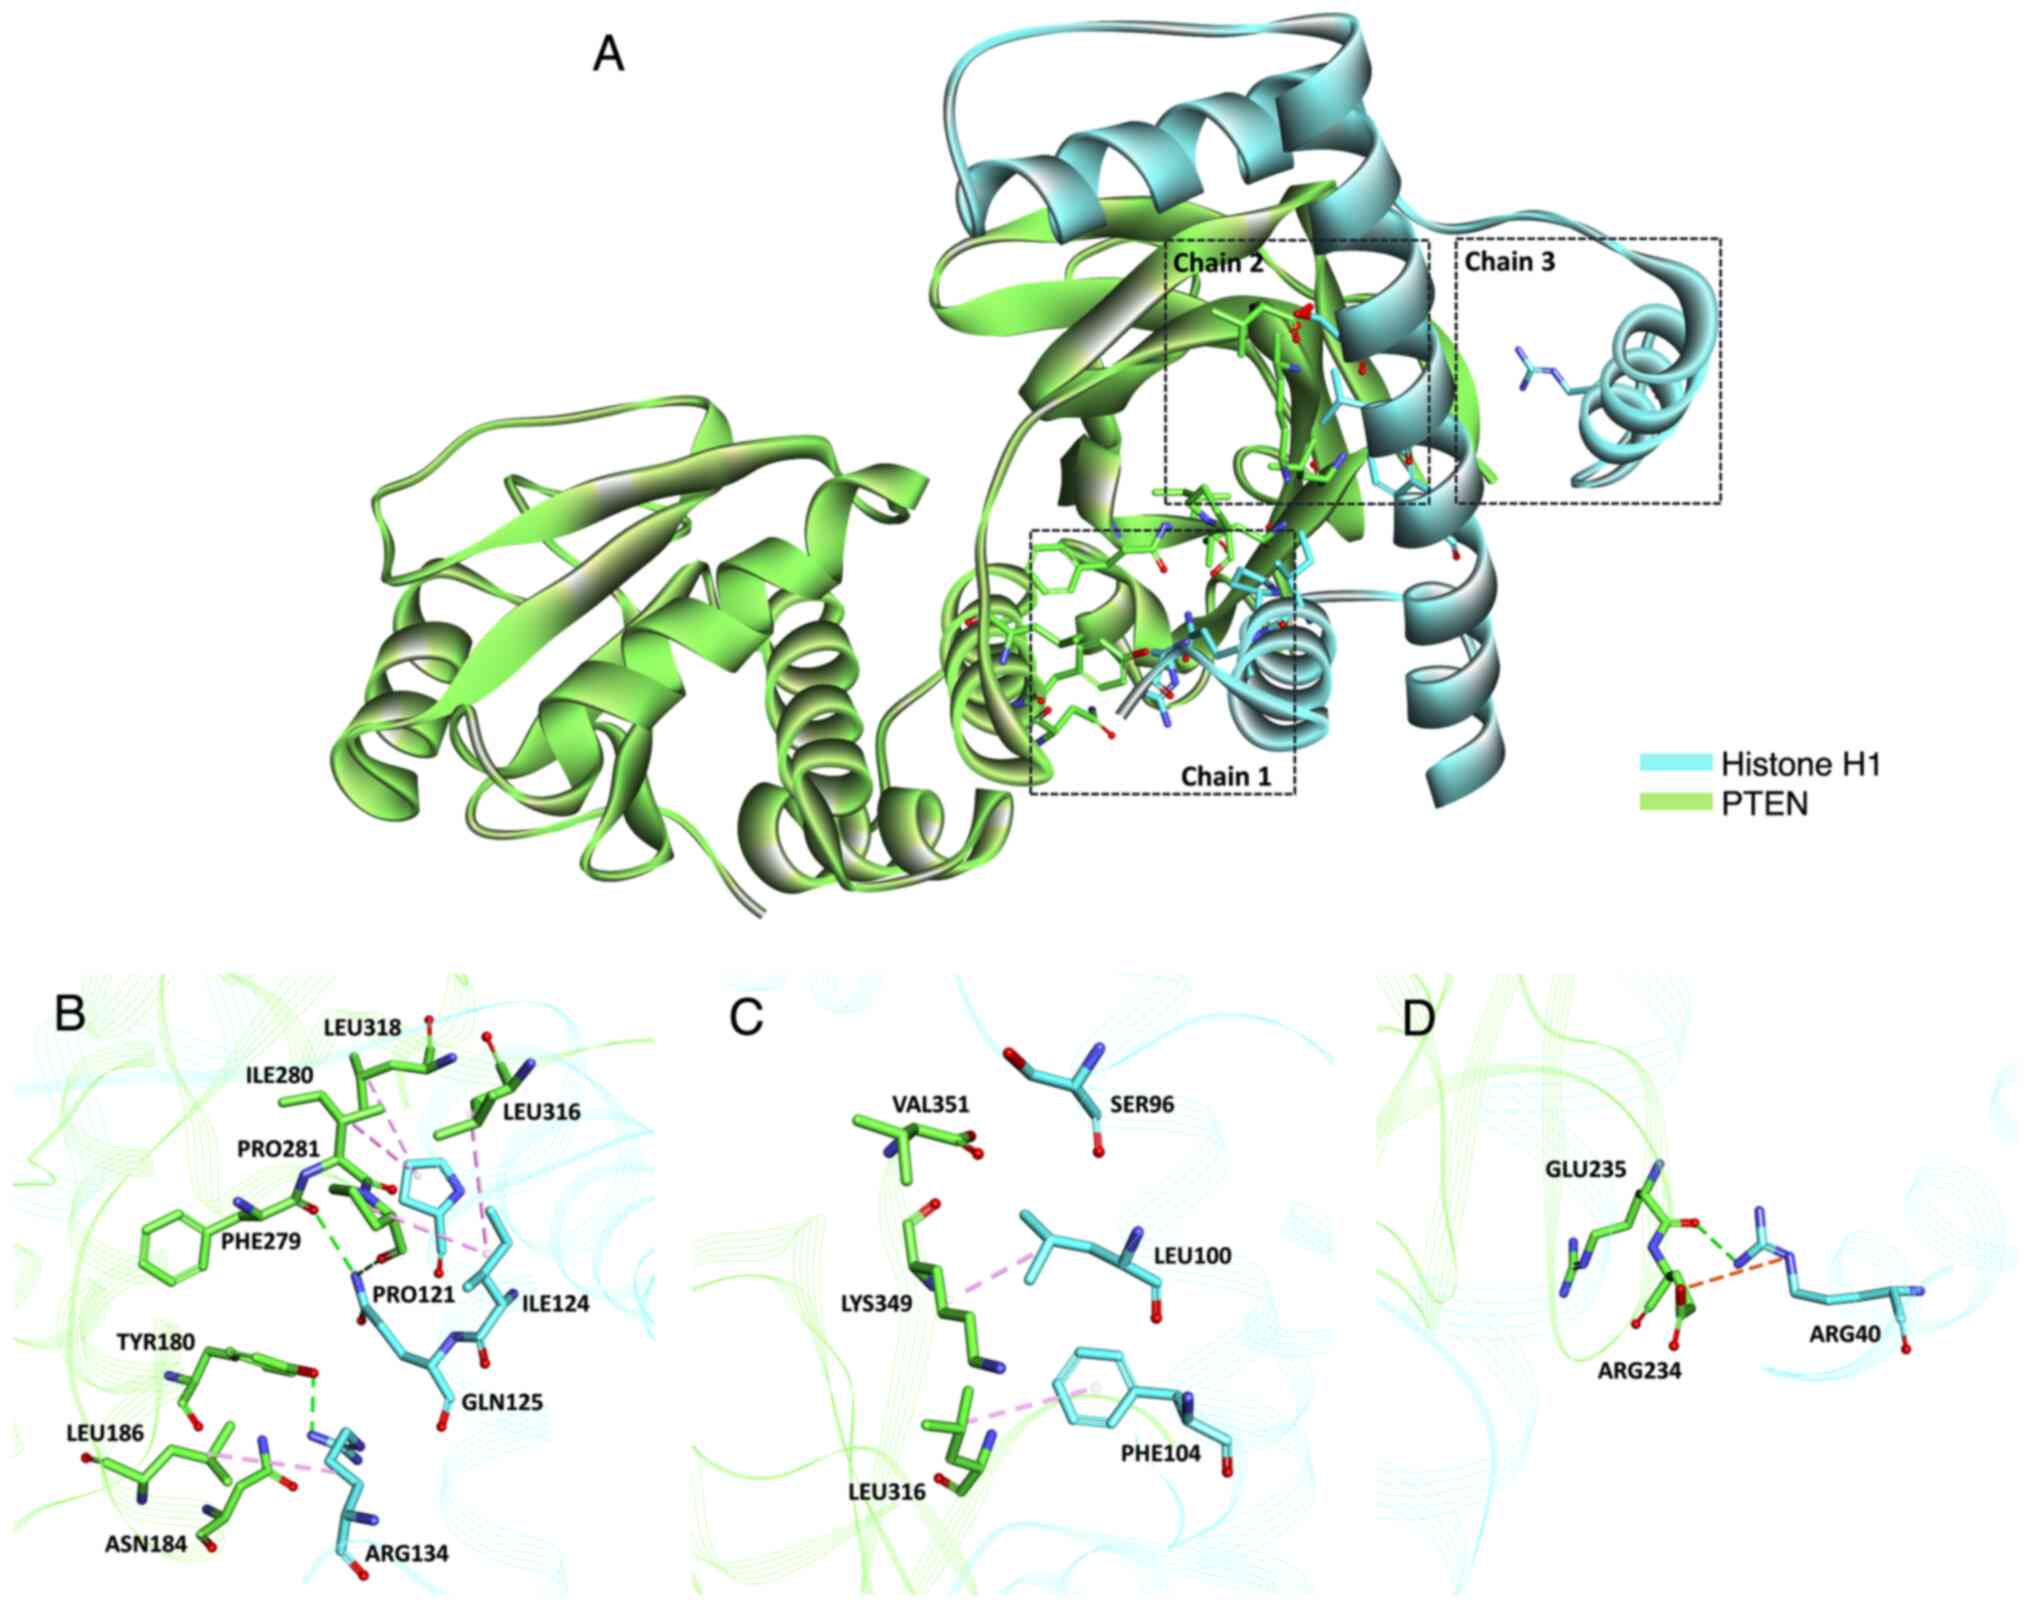
Crucial target molecular docking
The interactions among these three nodes and their
first adjacent nodes were used to construct the sub-network
(Fig. 7A-D). In our previous study,
we have shown that SCU anti-tumor activity is regulated by PTEN
(30), and transcriptomics analysis
showed the role of histone is evident. To unravel the interaction
between PTEN and histone H1, we performed molecular docking.
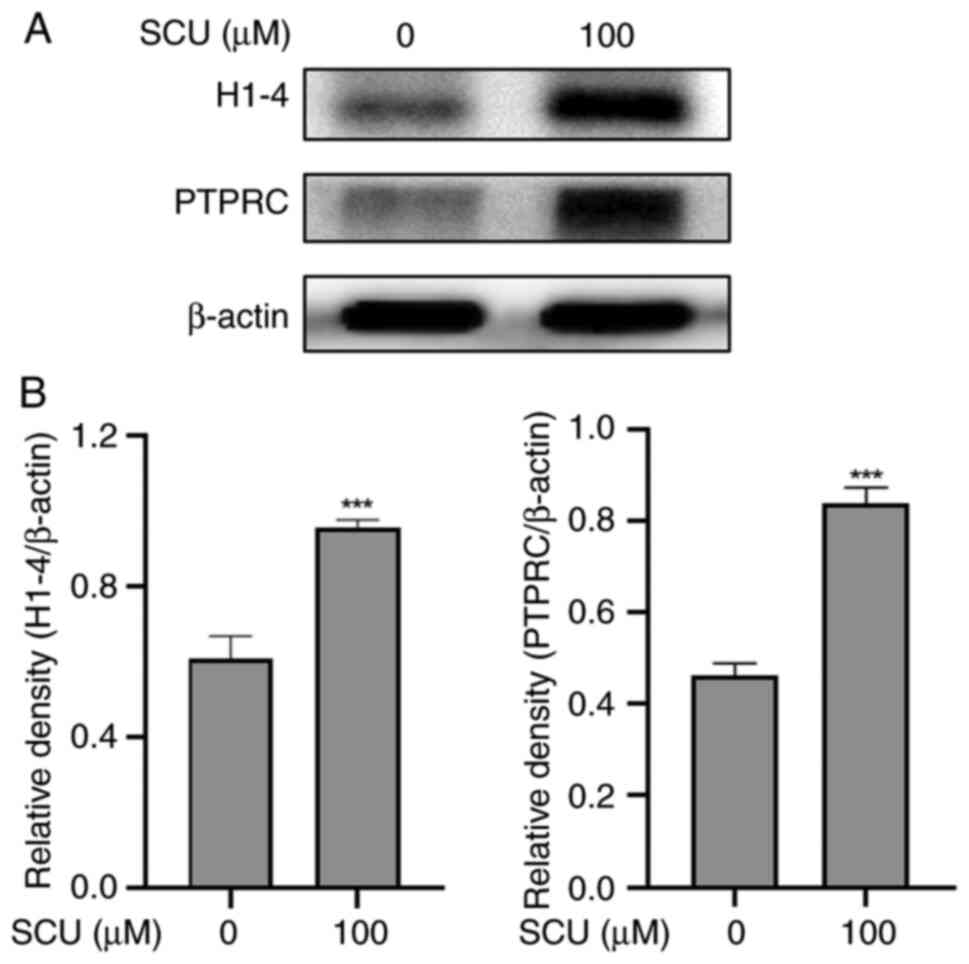
Validation of target protein
expression using western blot assay
After examining the STRING analysis, the two crucial
targets were validated by western analysis on SCU-treated HepG2
cells. These selected target proteins histone H1-4 (H1-4) and
protein tyrosine phosphatase receptor type C (PTPRC) upon treatment
with 100 µΜ of SCU in HepG2 cells. Fig.
8 shows that SCU up-regulated the expression of histone H1-4
(H1-4) and PTPRC respectively. These results further certify the
role of SCU in regulating the expression of crucial targets in
HepG2 cells.
Discussion
The development of RNA sequencing (RNA-seq)
technology has increased the potential of RNA-based biomolecules
for diagnostic, prognostic, and therapeutic applications in a
variety of disorders, including cancer and many infectious
diseases. (50). The complexity of
cancer is made up of many different transcriptional programs that
are widely linked with tumor cell populations. These
transcriptional programs are also thought to be the main causes of
therapy resistance, recurrence, and poor prognosis (51). Improved patient-specific treatment
options were made possible by the use of RNA-seq analysis to
identify gene expression and transcriptional changes in cancer
patients (52).
Hereby, we analyzed the anti-cancer regulatory genes
including anti-tumor, proliferation, and metastasis of scutellarein
(SCU) in HepG2 cells with the use of RNA-seq. We observed 60,676
variables of genes demonstrating differential expression compared
with the SCU-untreated group and SCU-treated group. The analysis
revealed a total of 463 significant differentially expressed genes
(DEG), 288 up-regulated and 175 down-regulated.
Based on the DEG data, drug and disease association
analyses were performed. The first 10 enriched drugs were sorted,
and among those on the top list, it was confirmed through previous
studies that Erlotinib was related to PTEN (48). The target of Erlotinib is the
epidermal growth factor receptor (EGFR), and it has been found that
there is a ‘PTEN loss contributes to Erloninib resistance’ effect.
The reference provider name used for the current patient is OSI
Pharmaceuticals US6900221 (53). In
our previous study, we revealed that SCU is a potent PTEN activator
(30). Therefore, these findings
suggest that SCU may have a similar function to Erlotinib, thus
consistent with our previous study.
The obtained DEG participates in various regulatory
networks. We conducted a gene ontology (GO) analysis to determine
their molecular function, biological process, and cellular
component. The results showed that genes related to histone and
linker histone were ranked high in all three terms. Protein
heterodimerization activity is highly enriched in the molecular
function that consists of 42 genes of DEG. Protein
heterodimerization is a highly conserved process and any
deregulation in this process might lead to several inflammatory
diseases. Histones function within the nucleus to package and
organize DNA (54). The great
degree of conservation of histones H3 and H4 throughout eukaryotic
evolution suggests that they are crucial for structural and
functional functions (55,56). These histones exist in chromatin in
a precise stoichiometry and wrap DNA to provide a crucial
architectural framework for the nucleosome (57). Histone H4 interacts with H3 via
their C-terminal histone fold domains to form heterodimers
(55). Interestingly, nucleosome
assembly is also highly enriched in a biological process that
consists of 28 genes of DEG.
Furthermore, the nucleosome assembly's synonym is
histone chaperone. When histones are deposited during nucleosome
formation or when histones are disassembled, histone chaperones are
involved (58). The nucleosome is
highly enriched in the cellular component that consists of 98 genes
of DEG. miRNA prediction also showed the highly enriched
miRNA-335-5p is related to histone (59). In addition, as a tumor suppressor in
human hepatocellular carcinoma (HCC), miRNA-335-5p inhibited the
growth, proliferation, and invasion of liver cancer cells (60). miRNA-26B-5P is associated with PTEN
(61). Thus, it regulates the
proliferation, angiogenesis, and apoptosis in liver cancer
(62).
In summary, all the results obtained from our study
indicate that they are associated with histone-related functions.
Our previous study showed that SCU regulates the PTEN-PI3K pathway.
Interestingly, RNA-seq analysis revealed a differential regulation
of genes related to histones. This discovery intrigued us to
investigate the relationship between PTEN and histones. Therefore,
we hypothesized that SCU regulates cell proliferation by
sequentially modulating the activity of histones and PTEN.
Protein-protein interaction (PPI) analysis using Search Tool for
the Retrieval of Interacting Genes/Proteins (STRING) confirmed that
the histone-related groups were highly interconnected. Among the
histone group, linker histone H1-4 (H1-4) which showed the highest
fold change value was taken to analyze the different associations
with PTEN. Many studies have shown that PTEN forms a complex with
histone H1 to promote a condensed chromatin structure, the presence
of histone H1 in chromatin, and hypoacetylation of histone H4 leads
to suppression of overall gene activity (38,63).
In addition, the molecular interaction of the histone H1 showed
active binding sites in all three chains with PTEN in docking
analysis. GO analysis of DEG showed many enriched genes associated
with the nucleosomes, like histones, emphasizing the PTEN-Histone
relation, which falls in line with our hypothesis. In a recent
study, Chen et al. showed that interaction between PTEN and histone
H1 decreased H4K16 acetylation (38). Thus, PTEN is responsible for
maintaining genomic integrity and preventing tumor growth.
Therefore, histone H1-4 (H1-4) has a crucial role in SCU-induced
anti-tumor activity. Accordingly, the closely linked protein
tyrosine phosphatase receptor type C (PTPRC) proteins, including
histone H1-4 (H1-4), were selected as important targets. PTPRC
correlates with colorectal cancer disease stage and outcome,
according to research (64). To
support the prior research, we performed protein expression
analysis for specific genes. The protein expression level of these
two crucial targets matched our transcriptomic results.
Taken together, the analysis results of DEG and GO
data provide insight into anti-cancer treatment in SCU-treated
HepG2 cells. In this present study, we found that SCU induces
upregulation of histone H1, histone H1 forms a complex with PTEN
and regulates the crucial target gene, PTPRC. Consistent with our
previous study, the current results support that SCU inhibits the
proliferation of HepG2 cells by its molecular action with the
PTEN-PI3K pathway. Targeting the pathway can be an attractive
strategy for cancer treatment, and SCU can be used as a target drug
to inhibit PI3K/Akt signaling, a downstream pathway, by activating
PTEN. It has been demonstrated that targeted therapy can be
attributed to aberrant expression of signal transduction pathways
such PTEN/PI3K/Akt (65). This
study focuses in-depth on PTEN/PI3K/Akt-related gene changes as the
cause of this pathway's dysregulated expression. The expression of
this pathway can be controlled to enhance cancer treatment.
Therefore, it suggests that SCU, a natural product known to have
few side effects, can be considered as a potential treatment for
liver cancer.
As a result of this study, further preclinical and
clinical trials are needed to implement a treatment strategy, but
it can be used to provide basic data for the development of new
drugs derived from natural products and for mechanism research.
Acknowledgements
Not applicable.
Funding
This study was supported by the National Research Foundation of
Korea funded by the Ministry of Science and ICT (grant nos.
2022R1A6A3A01086899 and RS-2023-0024337661382).
Availability of data and materials
The datasets used and analyzed during the current
study are available from the GEO database (accession no. GSE232800;
http://www.ncbi.nlm.nih.gov/geo/query/acc.cgi?&acc=GSE232800).
The other datasets used and/or analyzed during the current study
are available from the corresponding author on reasonable
request.
Author's contributions
SEH conceptualized the study. AP designed the
methodology. SEH and AP performed the analysis of data, and wrote
and prepared the original draft. SEH and AP confirmed the
authenticity of all the raw data. SEH wrote, reviewed, and edited
the manuscript. HHK and PBB performed the interpretation of data
and revised the final manuscript. MYP and AA performed some
experiments and validation of data. JDH and WSL contributed to the
study conception and design. GSK conceptualized and supervised the
study. All authors read and approved the final version of the
manuscript.
Ethics approval and consent to
participate
Not applicable.
Patient consent for publication
Not applicable.
Competing interests
The authors declare that they have no competing
interests.
References
|
1
|
Llovet JM, Zucman-Rossi J, Pikarsky E,
Sangro B, Schwartz M, Sherman M and Gores G: Hepatocellular
carcinoma. Nat Rev Dis Primers. 2:160182016. View Article : Google Scholar : PubMed/NCBI
|
|
2
|
Di Bisceglie AM, Rustgi VK, Hoofnagle JH,
Dusheiko GM and Lotze MT: NIH conference. Hepatocellular carcinoma.
Ann Intern Med. 108:390–401. 1988. View Article : Google Scholar : PubMed/NCBI
|
|
3
|
Villanueva A and Llovet JM: Targeted
therapies for hepatocellular carcinoma. Gastroenterology.
140:1410–1426. 2011. View Article : Google Scholar : PubMed/NCBI
|
|
4
|
Rizzo A, Ricci AD and Brandi G: Systemic
adjuvant treatment in hepatocellular carcinoma: Tempted to do
something rather than nothing. Future Oncol. 16:2587–2589. 2020.
View Article : Google Scholar : PubMed/NCBI
|
|
5
|
Santoni M, Rizzo A, Mollica V, Matrana MR,
Rosellini M, Faloppi L, Marchetti A, Battelli N and Massari F: The
impact of gender on The efficacy of immune checkpoint inhibitors in
cancer patients: The MOUSEION-01 study. Crit Rev Oncol Hematol.
170:1035962022. View Article : Google Scholar : PubMed/NCBI
|
|
6
|
Rizzo A, Ricci AD and Brandi G:
Trans-arterial chemoembolization plus systemic treatments for
hepatocellular carcinoma: An update. J Pers Med. 12:17882022.
View Article : Google Scholar : PubMed/NCBI
|
|
7
|
Rizzo A, Ricci AD and Brandi G:
Atezolizumab in advanced hepatocellular carcinoma: Good things come
to those who wait. Immunotherapy. 13:637–644. 2021. View Article : Google Scholar : PubMed/NCBI
|
|
8
|
Bazzichetto C, Conciatori F, Pallocca M,
Falcone I, Fanciulli M, Cognetti F, Milella M and Ciuffreda L: PTEN
as a Prognostic/Predictive biomarker in cancer: An unfulfilled
promise? Cancers (Basel). 11:4352019. View Article : Google Scholar : PubMed/NCBI
|
|
9
|
Sengupta S and Parikh ND: Biomarker
development for hepatocellular carcinoma early detection: Current
and future perspectives. Hepat Oncol. 4:111–122. 2017. View Article : Google Scholar : PubMed/NCBI
|
|
10
|
Ptolemy AS and Rifai N: What is a
biomarker? Research investments and lack of clinical integration
necessitate a review of biomarker terminology and validation
schema. Scand J Clin Lab Invest. 242:6–14. 2010. View Article : Google Scholar : PubMed/NCBI
|
|
11
|
Tovar V, Cornella H, Moeini A, Vidal S,
Hoshida Y, Sia D, Peix J, Cabellos L, Alsinet C, Torrecilla S, et
al: Tumour initiating cells and IGF/FGF signalling contribute to
sorafenib resistance in hepatocellular carcinoma. Gut. 66:530–540.
2017. View Article : Google Scholar : PubMed/NCBI
|
|
12
|
Sia D, Villanueva A, Friedman SL and
Llovet JM: Liver cancer cell of origin, molecular class, and
effects on patient prognosis. Gastroenterology. 152:745–761. 2017.
View Article : Google Scholar : PubMed/NCBI
|
|
13
|
Jing JS, Ye W, Jiang YK, Ma J, Zhu MQ, Ma
JM, Zhou H, Yu LQ, Yang YF and Wang SC: The value of GPC3 and GP73
in clinical diagnosis of hepatocellular carcinoma. Clin Lab.
63:1903–1909. 2017. View Article : Google Scholar : PubMed/NCBI
|
|
14
|
Wongjarupong N, Negron-Ocasio GM,
Chaiteerakij R, Addissie BD, Mohamed EA, Mara KC, Harmsen WS,
Theobald JP, Peters BE, Balsanek JG, et al: Model combining
pre-transplant tumor biomarkers and tumor size shows more utility
in predicting hepatocellular carcinoma recurrence and survival than
the BALAD models. World J Gastroenterol. 24:1321–1331. 2018.
View Article : Google Scholar : PubMed/NCBI
|
|
15
|
Ono K, Kokubu S, Hidaka H, Watanabe M,
Nakazawa T and Saigenji K: Risk factors of delay in restoration of
hepatic reserve capacity and local recurrence after radiofrequency
ablation therapy for hepatocellular carcinoma (HCC). Hepatol Res.
31:172–177. 2005. View Article : Google Scholar : PubMed/NCBI
|
|
16
|
Zhu M, Zheng J, Wu F, Kang B, Liang J,
Heskia F, Zhang X and Shan Y: OPN is a promising serological
biomarker for hepatocellular carcinoma diagnosis. J Med Virol.
92:3596–3603. 2020. View Article : Google Scholar : PubMed/NCBI
|
|
17
|
Luo XY, Wu KM and He XX: Advances in drug
development for hepatocellular carcinoma: Clinical trials and
potential therapeutic targets. J Exp Clin Cancer Res. 40:1722021.
View Article : Google Scholar : PubMed/NCBI
|
|
18
|
Cancer Genome Atlas Research Network, .
Electronic address: simplewheeler@bcm.edu; Cancer
Genome Atlas Research Network: Comprehensive and integrative
genomic characterization of hepatocellular carcinoma. Cell.
169:1327–1341. e13232017. View Article : Google Scholar : PubMed/NCBI
|
|
19
|
Schulze K, Imbeaud S, Letouze E,
Alexandrov LB, Calderaro J, Rebouissou S, Couchy G, Meiller C,
Shinde J, Soysouvanh F, et al: Exome sequencing of hepatocellular
carcinomas identifies new mutational signatures and potential
therapeutic targets. Nat Genet. 47:505–511. 2015. View Article : Google Scholar : PubMed/NCBI
|
|
20
|
Hardy T and Mann DA: Epigenetics in liver
disease: From biology to therapeutics. Gut. 65:1895–1905. 2016.
View Article : Google Scholar : PubMed/NCBI
|
|
21
|
Luo J, Dai X, Hu H, Chen J, Zhao L, Yang
C, Sun J, Zhang L, Wang Q, Xu S, et al: Fluzoparib increases
radiation sensitivity of non-small cell lung cancer (NSCLC) cells
without BRCA1/2 mutation, a novel PARP1 inhibitor undergoing
clinical trials. J Cancer Res Clin Oncol. 146:721–737. 2020.
View Article : Google Scholar : PubMed/NCBI
|
|
22
|
Wang D, Zhao L, Wang D, Liu J, Yu X, Wei Y
and Ouyang Z: Transcriptome analysis and identification of key
genes involved in 1-deoxynojirimycin biosynthesis of mulberry
(Morus alba L.). PeerJ. 6:e54432018. View Article : Google Scholar : PubMed/NCBI
|
|
23
|
Zhang Y, Kang Z, Lv D, Zhang X, Liao Y, Li
Y, Liu R, Li P, Tong M, Tian J, et al: Longitudinal whole-genome
sequencing reveals the evolution of MPAL. Cancer Genet. 240:59–65.
2020. View Article : Google Scholar : PubMed/NCBI
|
|
24
|
Anwanwan D, Singh SK, Singh S, Saikam V
and Singh R: Challenges in liver cancer and possible treatment
approaches. Biochim Biophys Acta Rev Cancer. 1873:1883142020.
View Article : Google Scholar : PubMed/NCBI
|
|
25
|
Shi X, Chen G and Liu X, Qiu Y, Yang S,
Zhang Y, Fang X, Zhang C and Liu X: Scutellarein inhibits cancer
cell metastasis in vitro and attenuates the development of
fibrosarcoma in vivo. Int J Mol Med. 35:31–38. 2015.
View Article : Google Scholar : PubMed/NCBI
|
|
26
|
Cheng CY, Hu CC, Yang HJ, Lee MC and Kao
ES: Inhibitory effects of scutellarein on proliferation of human
lung cancer A549 cells through ERK and NFkappaB mediated by the
EGFR pathway. Chin J Physiol. 57:182–187. 2014. View Article : Google Scholar : PubMed/NCBI
|
|
27
|
Parajuli P, Joshee N, Rimando AM, Mittal S
and Yadav AK: In vitro antitumor mechanisms of various Scutellaria
extracts and constituent flavonoids. Planta Med. 75:41–48. 2009.
View Article : Google Scholar : PubMed/NCBI
|
|
28
|
Guo F, Yang F and Zhu YH: Scutellarein
from Scutellaria barbata induces apoptosis of human colon cancer
HCT116 cells through the ROS-mediated mitochondria-dependent
pathway. Nat Prod Res. 33:2372–2375. 2019. View Article : Google Scholar : PubMed/NCBI
|
|
29
|
Goh D, Lee YH and Ong ES: Inhibitory
effects of a chemically standardized extract from Scutellaria
barbata in human colon cancer cell lines, LoVo. J Agric Food Chem.
53:8197–8204. 2005. View Article : Google Scholar : PubMed/NCBI
|
|
30
|
Ha SE, Kim SM, Vetrivel P, Kim HH, Bhosale
PB, Heo JD, Lee HJ and Kim GS: Inhibition of cell proliferation and
metastasis by scutellarein regulating PI3K/Akt/NF-kappaB signaling
through PTEN activation in hepatocellular carcinoma. Int J Mol Sci.
22:88412021. View Article : Google Scholar : PubMed/NCBI
|
|
31
|
Wiencke JK, Zheng S, Jelluma N, Tihan T,
Vandenberg S, Tamgüney T, Baumber R, Parsons R, Lamborn KR, Berger
MS, et al: Methylation of the PTEN promoter defines low-grade
gliomas and secondary glioblastoma. Neuro Oncol. 9:271–279. 2007.
View Article : Google Scholar : PubMed/NCBI
|
|
32
|
Tamguney T and Stokoe D: New insights into
PTEN. J Cell Sci. 120:4071–4079. 2007. View Article : Google Scholar : PubMed/NCBI
|
|
33
|
Wang L, Wang WL, Zhang Y, Guo SP, Zhang J
and Li QL: Epigenetic and genetic alterations of PTEN in
hepatocellular carcinoma. Hepatol Res. 37:389–396. 2007. View Article : Google Scholar : PubMed/NCBI
|
|
34
|
Pan L, Lu J, Wang X, Han L, Zhang Y, Han S
and Huang B: Histone deacetylase inhibitor trichostatin a
potentiates doxorubicin-induced apoptosis by up-regulating PTEN
expression. Cancer. 109:1676–1688. 2007. View Article : Google Scholar : PubMed/NCBI
|
|
35
|
Kondo Y: Targeting histone
methyltransferase EZH2 as cancer treatment. J Biochem. 156:249–257.
2014. View Article : Google Scholar : PubMed/NCBI
|
|
36
|
Marino-Ramirez L, Kann MG, Shoemaker BA
and Landsman D: Histone structure and nucleosome stability. Expert
Rev Proteomics. 2:719–729. 2005. View Article : Google Scholar : PubMed/NCBI
|
|
37
|
Medrzycki M, Zhang Y, McDonald JF and Fan
Y: Profiling of linker histone variants in ovarian cancer. Front
Biosci (Landmrk Ed). 17:396–406. 2012. View
Article : Google Scholar : PubMed/NCBI
|
|
38
|
Chen ZH, Zhu M, Yang J, Liang H, He J, He
S, Wang P, Kang X, McNutt MA, Yin Y and Shen WH: PTEN interacts
with histone H1 and controls chromatin condensation. Cell Rep.
8:2003–2014. 2014. View Article : Google Scholar : PubMed/NCBI
|
|
39
|
Martin M: CUTADAPT removes adapter
sequences from high-throughput sequencing reads. EMBnet J.
17:10–12. 2011. View Article : Google Scholar
|
|
40
|
Dobin A, Davis CA, Schlesinger F, Drenkow
J, Zaleski C, Jha S, Batut P, Chaisson M and Gingeras TR: STAR:
Ultrafast universal RNA-seq aligner. Bioinformatics. 29:15–21.
2013. View Article : Google Scholar : PubMed/NCBI
|
|
41
|
Li B and Dewey CN: RSEM: Accurate
transcript quantification from RNA-Seq data with or without a
reference genome. BMC Bioinformatics. 12:3232011. View Article : Google Scholar : PubMed/NCBI
|
|
42
|
Sun J, Nishiyama T, Shimizu K and Kadota
K: TCC: An R package for comparing tag count data with robust
normalization strategies. BMC Bioinformatics. 14:2192013.
View Article : Google Scholar : PubMed/NCBI
|
|
43
|
Love MI, Huber W and Anders S: Moderated
estimation of fold change and dispersion for RNA-seq data with
DESeq2. Genome Biol. 15:5502014. View Article : Google Scholar : PubMed/NCBI
|
|
44
|
Robinson MD, McCarthy DJ and Smyth GK:
edgeR: A Bioconductor package for differential expression analysis
of digital gene expression data. Bioinformatics. 26:139–140. 2010.
View Article : Google Scholar : PubMed/NCBI
|
|
45
|
Liao Y, Wang J, Jaehnig EJ, Shi Z and
Zhang B: WebGestalt 2019: Gene set analysis toolkit with revamped
UIs and APIs. Nucleic Acids Res. 47:W199–W205. 2019. View Article : Google Scholar : PubMed/NCBI
|
|
46
|
Young MD, Wakefield MJ, Smyth GK and
Oshlack A: Gene ontology analysis for RNA-seq: Accounting for
selection bias. Genome Biol. 11:R142010. View Article : Google Scholar : PubMed/NCBI
|
|
47
|
Pettersen EF, Goddard TD, Huang CC, Couch
GS, Greenblatt DM, Meng EC and Ferrin TE: UCSF Chimera-a
visualization system for exploratory research and analysis. J
Comput Chem. 25:1605–1612. 2004. View Article : Google Scholar : PubMed/NCBI
|
|
48
|
Boosani CS and Agrawal DK: PTEN
modulators: A patent review. Expert Opin Ther Pat. 23:569–580.
2013. View Article : Google Scholar : PubMed/NCBI
|
|
49
|
Zhu AX, Rosmorduc O, Evans TR, Ross PJ,
Santoro A, Carrilho FJ, Bruix J, Qin S, Thuluvath PJ, Llovet JM, et
al: SEARCH: A phase III, randomized, double-blind,
placebo-controlled trial of sorafenib plus erlotinib in patients
with advanced hepatocellular carcinoma. J Clin Oncol. 33:559–566.
2015. View Article : Google Scholar : PubMed/NCBI
|
|
50
|
Byron SA, Van Keuren-Jensen KR,
Engelthaler DM, Carpten JD and Craig DW: Translating RNA sequencing
into clinical diagnostics: opportunities and challenges. Nat Rev
Genet. 17:257–271. 2016. View Article : Google Scholar : PubMed/NCBI
|
|
51
|
Garber ME, Troyanskaya OG, Schluens K,
Petersen S, Thaesler Z, Pacyna-Gengelbach M, van de Rijn M, Rosen
GD, Perou CM, Whyte RI, et al: Diversity of gene expression in
adenocarcinoma of the lung. Proc Natl Acad Sci USA. 98:13784–13789.
2001. View Article : Google Scholar : PubMed/NCBI
|
|
52
|
Cajigas-Du Ross CK, Martinez SR,
Woods-Burnham L, Durán AM, Roy S, Basu A, Ramirez JA,
Ortiz-Hernández GL, Ríos-Colón L, Chirshev E, et al: RNA sequencing
reveals upregulation of a transcriptomic program associated with
stemness in metastatic prostate cancer cells selected for taxane
resistance. Oncotarget. 9:30363–30384. 2018. View Article : Google Scholar : PubMed/NCBI
|
|
53
|
Sos ML, Koker M, Weir BA, Heynck S,
Rabinovsky R, Zander T, Seeger JM, Weiss J, Fischer F, Frommolt P,
et al: PTEN loss contributes to erlotinib resistance in EGFR-mutant
lung cancer by activation of Akt and EGFR. Cancer Res.
69:3256–3261. 2009. View Article : Google Scholar : PubMed/NCBI
|
|
54
|
Martire S and Banaszynski LA: The roles of
histone variants in fine-tuning chromatin organization and
function. Nat Rev Mol Cell Biol. 21:522–541. 2020. View Article : Google Scholar : PubMed/NCBI
|
|
55
|
Malik HS and Henikoff S: Phylogenomics of
the nucleosome. Nat Struct Biol. 10:882–891. 2003. View Article : Google Scholar : PubMed/NCBI
|
|
56
|
Thatcher TH and Gorovsky MA: Phylogenetic
analysis of the core histones H2A, H2B, H3, and H4. Nucleic Acids
Res. 22:174–179. 1994. View Article : Google Scholar : PubMed/NCBI
|
|
57
|
Freeman L, Kurumizaka H and Wolffe AP:
Functional domains for assembly of histones H3 and H4 into the
chromatin of Xenopus embryos. Proc Natl Acad Sci USA.
93:12780–12785. 1996. View Article : Google Scholar : PubMed/NCBI
|
|
58
|
Liu Z, Zhu Y, Gao J, Yu F, Dong A and Shen
WH: Molecular and reverse genetic characterization of NUCLEOSOME
ASSEMBLY PROTEIN1 (NAP1) genes unravels their function in
transcription and nucleotide excision repair in Arabidopsis
thaliana. Plant J. 59:27–38. 2009. View Article : Google Scholar : PubMed/NCBI
|
|
59
|
Ong J, van den Berg A, Faiz A, Boudewijn
IM, Timens W, Vermeulen CJ, Oliver BG, Kok K, Terpstra MM, van den
Berge M, et al: Current smoking is associated with decreased
expression of miR-335-5p in parenchymal lung fibroblasts. Int J Mol
Sci. 20:51762019. View Article : Google Scholar : PubMed/NCBI
|
|
60
|
Li LM, Liu ZX and Cheng QY: Exosome plays
an important role in the development of hepatocellular carcinoma.
Pathol Res Pract. 215:1524682019. View Article : Google Scholar : PubMed/NCBI
|
|
61
|
Xiao Y, Zheng S, Duan N, Li X and Wen J:
MicroRNA-26b-5p alleviates cerebral ischemia-reperfusion injury in
rats via inhibiting the N-myc/PTEN axis by downregulating KLF10
expression. Hum Exp Toxicol. 40:1250–1262. 2021. View Article : Google Scholar : PubMed/NCBI
|
|
62
|
Wang Y, Sun B, Sun H, Zhao X, Wang X, Zhao
N, Zhang Y, Li Y, Gu Q, Liu F, et al: Regulation of proliferation,
angiogenesis and apoptosis in hepatocellular carcinoma by
miR-26b-5p. Tumour Biol. 37:10965–10979. 2016. View Article : Google Scholar : PubMed/NCBI
|
|
63
|
Fan X, Kraynak J, Knisely JPS, Formenti SC
and Shen WH: PTEN as a guardian of the genome: Pathways and
targets. Cold Spring Harb Perspect Med. 10:a0361942020. View Article : Google Scholar : PubMed/NCBI
|
|
64
|
Chew A, Salama P, Robbshaw A, Klopcic B,
Zeps N, Platell C and Lawrance IC: SPARC, FOXP3, CD8 and CD45
correlation with disease recurrence and long-term disease-free
survival in colorectal cancer. PLoS One. 6:e220472011. View Article : Google Scholar : PubMed/NCBI
|
|
65
|
Hafsi S, Pezzino FM, Candido S, Ligresti
G, Spandidos DA, Soua Z, McCubrey JA, Travali S and Libra M: Gene
alterations in the PI3K/PTEN/AKT pathway as a mechanism of
drug--resistance (review). Int J Oncol. 40:639–644. 2012.PubMed/NCBI
|