Introduction
Cancer stem cells (CSCs) have the ability to
self-renew and generate heterogeneous lineages of cancer cells in a
tumor. In contrast to other cell populations in a tumor, this small
fraction of cells is highly tumorigenic. CSCs can survive
chemotherapy and radiotherapy via efficient DNA repair and various
drug-pumping mechanisms (1).
Therefore, elimination of these rapidly replicating cancer cells is
important to ensure successful cancer treatment. Failure of primary
treatments to kill a sufficient number of CSCs can lead to relapse
and metastasis, often with chemoresistance (2). In ovarian cancer (OvC), the third most
common gynecological malignancy, primary cytoreductive surgery in
combination with chemotherapy is initially effective. However, most
patients develop drug resistance and eventually relapse within 18
months of treatment (3). Due to
relapse and metastasis and the potential involvement of CSCs, the
5-year survival rate of patients with OvC continues to be <30%
and their comprehensive mortality is the highest among all
gynecological malignant tumors.
Ovarian cancer stem cells (OVCSCs) were first
isolated and characterized after the discovery of CSCs in leukemia
(4). Since then, techniques such as
isolation of side population (SP) through flow cytometry and in
vitro culture of ovarian multiple cellular spheroids that
contain potential CSCs defined by morphology have been established
to analyze the characteristics of OVCSCs. Although the Notch
signaling pathway has been implicated in the development of
chemoresistance in OVCSCs (5,6), small
molecules targeting OVCSCs have not yet been screened. The
development of such OVCSC-specific therapies may hold the key to
preventing relapse and successfully treating patients who have
aggressive, non-resectable OvC.
In cancer research, differentially expressed genes
have been identified by comparing samples with and without CSCs by
high-throughput technologies such as microarrays. Gene Ontology
analysis of these differentially expressed genes may provide
ontology terms to describe attributes in 3 biological domains,
cellular component, molecular function and biological process, to
interpret microarray data (7). The
Kyoto Encyclopedia of Genes and Genomes (KEGG) pathway query can
systemically connect differentially expressed genes with other
known information on the molecular interaction networks, especially
in signaling pathways (8). Also,
the Connectivity Map (CMAP), a massive repository of gene
expression data, provides information on changes in gene expression
in several cell lines when treated with >1,000 bioactive
compounds (9,10). With these differentially expressed
genes as query signatures of CSCs, the CMAP provides a novel
resource to systematically screen for small molecules targeting
CSC-specific genes.
In the present study, we used the CMAP to conduct a
comprehensive analysis of multiple samples derived from the
National Center for Biotechnology Information (NCBI) Gene
Expression Omnibus (GEO) database to reveal several key pathways
and OVCSC signature genes. Data on signature genes were then used
to perform an OVCSC-specific drug prescreening based on
co-expression extrapolation and predicted several small molecules
with potential anti-OVCSC pharmacological properties, which may aid
the development of OVCSC-specific drugs.
Materials and methods
Sources of whole-genome expression
profiles of ovarian cancer
In the present study, we reanalyzed previously
published raw data (Table I).
Expression profiles of normal ovarian surface epithelium cells and
ovarian cancer cells from patients with advanced disease were
compared. The original CEL files by Rizzo et al (11) (GSE25191), Vathipadiekal et al
(12)(GSE33874) and Wang et
al (13) (GSE28799) were
retrieved from the NCBI GEO database for OVCSC analysis. In brief,
SPs of OvC were isolated from the serous epithelial OvC cell line
IGROV1 and patient-derived ascites. Multiple cellular spheroids
were isolated from the OVCAR-3 cell line on the basis of
morphologic characteristics. RNA was extracted from all specimens
that had OVCSC features and from non-stemness controls. Extracted
RNA was pre-amplified, conjugated with fluorescent markers or
biotin-labeled markers, and hybridized to an expression microarray
chip. Raw data from Bonome et al (14) (GSE26712) were used to calibrate the
OVCSC signature for drug prescreening. Serous epithelial OvC
specimens were obtained independently by optimal debulking surgery
from patients with previously untreated late-stage (III–IV)
high-grade (2,3) OvC. Normal ovarian surface epithelium
cells were obtained by cytobrushing and RNA from these cells was
independently analyzed by microarrays.
 | Table IGroup designations for data
derivation and input into the GeneSifter microarray analysis
platform for differential expression analysis. |
Table I
Group designations for data
derivation and input into the GeneSifter microarray analysis
platform for differential expression analysis.
| Name | | Control | Experimental
group | Series and
platform | Refs. |
|---|
| Groups to identify
stemness features | SDC | 3 specimens of
OVCAR-3 cells | 3 specimens of
OVCAR-3-derived multi-cellular spheroids | GSE28799a; HG-U133_Plus_2 | (13) |
| SP1 | 3 specimens of
IGROV1-derived non-side population cells | 3 specimens of
IGROV1-derived side population cells | GSE25191a; HG-U133_Plus_2 | (11) |
| SP2 | 10 specimens of
patient ascites-derived total ovarian cancer cells | 10 specimens of
patient ascites-derived side population cells | GSE33874a; HG-U133_Plus_2 | (12) |
| Calibration group
for drug screening | OVC | 8 specimens of
normal ovarian surface epithelium | 8 specimens of
ovarian cancer cells derived from patients with advanced
disease | GSE26712b; HG-U133A | (14) |
Preprocessing and normalization of array
data
Four groups of raw data were normalized to probe
level by using the RMA algorithm for background correction.
Quantile normalization and multi-chip model mid-value fitting were
performed. The final normalized data were output to the GeneSifter
microarray analysis platform (http://www.geospiza.com/Products/AnalysisEdition.shtml;
Geospiza, Inc., Seattle, WA, USA) by groups after logarithmic
transformation.
Analysis of differentially expressed
genes
In the pair wise mode, normalized microarray data
were analyzed to obtain differentially expressed probes by groups
and probes were then assigned to genes. The following analysis
parameters were used: statistics (t-test); correction (Benjamini
and Hochberg); fold-change (lower, 1.5; upper, none); and quality
options (one group must pass). The Exclude Control Probes option
was chosen to output both upregulated and downregulated genes with
P<0.05.
Analysis of biological significance
Differentially expressed genes previously identified
in the SDC, SP1 and SP2 groups were output to the Gene Ontology
(GO) tool to determine their significance with respect to their
biological processes, molecular functions and cellular components.
These genes were also output to the KEGG pathway mapping tool to
determine commonly enriched pathways. The Z score was used to test
enrichment of GO terms and KEGG pathways in the differentially
expressed gene list. A Z score of >2 or <-2 was considered
statistically significant.
CMAP drug screening with cancer stem cell
signature
To converge differentially expressed genes with
ovarian cancer stem cell characteristics, analysis was performed by
integrating upregulated and downregulated probes from each OVCSC
group (SDC, SP1 and SP2) calibrated with the OvC group in the Venny
tool, commonly upregulated and downregulated genes in OVCSC groups
were identified in the following combinations: OVC/SDC + OVC/SP1 +
OVC/SP2 + OVC/SDC/SP1 + OVC/SDC/SP2 + OVC/SP1/SP2 +
OVC/SDC/SP1/SP2.
Calibration groups were introduced for drug
prescreening for necessity and sufficiency:
Necessity
The CMAP database was constructed by using thousands
of HG-U133A (low-density array) expression data, but in the present
study all OVCSC-related signatures were derived from HG-U133_Plus_2
(high-density array). If a low-density-based filtering is not
performed, the OVCSC signature will not be compatible for CMAP
querying. In addition, this filtering may reduce the accuracy or
significance of differentially expressed signatures for cancer
stemness groups compared with that for non-stemness controls, but
there were almost no intentional bias between these groups.
Sufficiency
If a calibration group with differentially expressed
genes for normal ovarian surface epithelium with respect to OVCSCs
containing ovarian cancer cells derived from patients with advanced
disease is not introduced, the query signature will only represent
massively proliferating non-stemness cancer cells over CSCs in the
CAMP screening. As the small molecules with the potential of
reversing the expression signature may activate CSCs by turning
them into highly proliferating cancer cells, this calibration group
was introduced.
CMAP drug screening by the COXEN method
with the ovarian cancer stem cell signature
By using the input of OVCSC-specific query signature
genes, a preliminary list of anti-OVCSC small molecules was
obtained. To further screen the potential drugs targeting OVCSCs,
more stringent criteria were applied by restricting the number of
repeat experiments to >3 times, selecting molecules with
negative enrichment score (representing the potential
effectiveness), using P<0.01 for statistical tests, and setting
the proportion of effective rate to >50%.
Results
Differentially expressed genes in OVCSC
cells
By using the GeneSifter software, differentially
expressed genes with a fold-change >1.5 compared with
non-stemness controls and P<0.05 was identified for each OVCSC
group. Compared with non-stemness controls, there were 6,495 (3,252
upregulated and 3,243 downregulated), 1,347 (765 upregulated and
582 downregulated) and 509 (44 upregulated and 465 downregulated)
differentially expressed genes in the SDC, SP1 and SP2 groups,
respectively. NAB1 (NGFI-A binding protein 1) and NPIPL1 (nuclear
pore complex interacting protein-like 1) were commonly upregulated
in SDC and SP1. PROS1 (protein S α), GREB1 (growth regulation by
estrogen in breast cancer 1), PLCL1 (phospholipase C-like 1), MTUS1
(mitochondrial tumor suppressor 1), PPM1D (protein phosphatase 1D
magnesium-dependent), CDC42EP3 (CDC42 effector protein Rho GTPase
binding 3) and AMPD (adenosine monophosphate deaminase isoform E)
were commonly downregulated in all OVCSC groups.
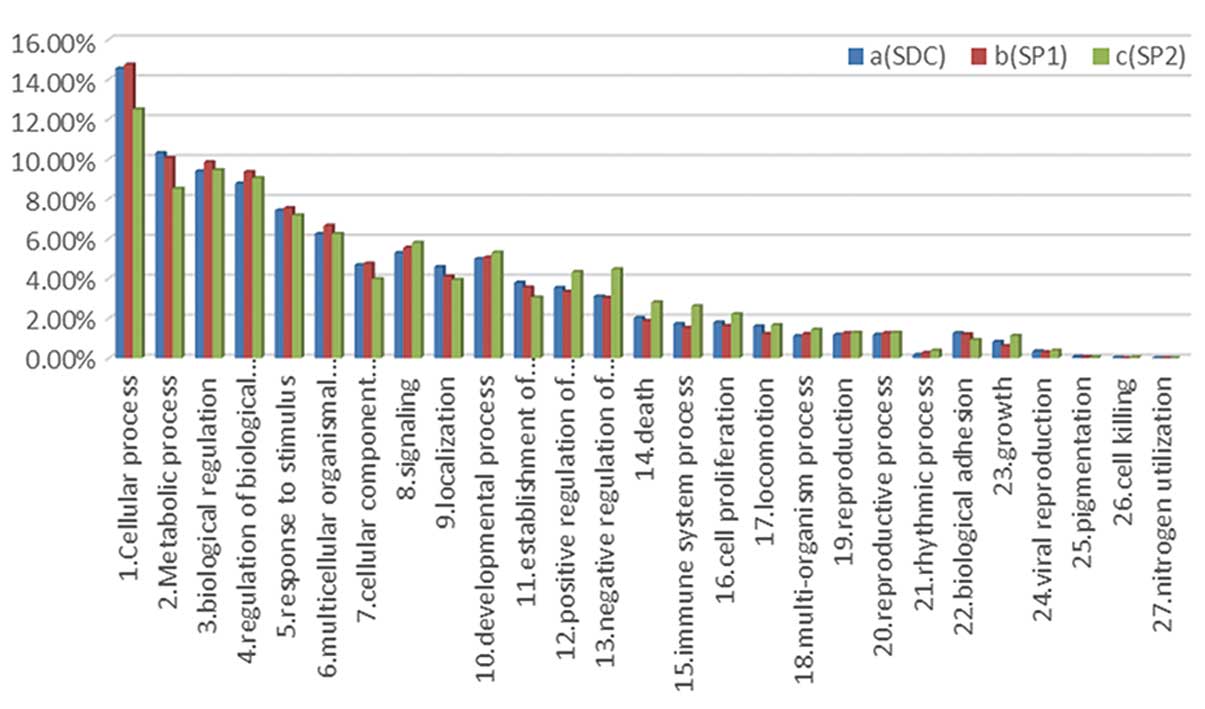
Analysis of biological significance
Enrichment analysis of differentially expressed
genes revealed that 2,052, 1,005 and 1,581 biological processes
were enriched in cells from SDC, SP1 and SP2 groups, respectively,
as compared with non-stemness controls. Some biological processes
were enriched in all OVCSC groups, such as tolerance induction,
cell cycle regulation, stemness maintenance and anti-apoptosis
(Table II). Distribution patterns
of the involved biological processes, cellular components, and
molecular functions were similar among the 3 groups (Fig. 1).
| Table IIEnriched and shared biological
processes from commonly upregulated or downregulated genes by 2 or
3 stemness groups. |
Table II
Enriched and shared biological
processes from commonly upregulated or downregulated genes by 2 or
3 stemness groups.
| Biological
process | SDC | SP1 | SP2 |
|---|
| Enriched by
upregulated genes |
| Histone H3-K27
demethylation | 4.12 | 4.31 | |
| Histone H4-K20
demethylation | 4.12 | 4.31 | |
| Regulation of
phosphatidylinositol 3-kinase activity | 4.02 | 2 | |
| Histone H3-K9
demethylation | 3.64 | 4.09 | |
| Negative
regulation of insulin-like growth factor receptor signaling
pathway | 3.61 | 2.51 | |
| Tolerance
induction | 3.04 | 3.56 | |
| Negative
regulation of BMP signaling pathway by extracellular sequestering
of BMP | 2.92 | 6.26 | |
| Positive
regulation of tolerance induction | 2.79 | 2 | |
| Regulation of
tolerance induction | 2.79 | 2 | |
| Organ
formation | 2.74 | 2.2 | |
| Response to growth
factor stimulus | 2.73 | 2.28 | |
| Histone lysine
demethylation | 2.2 | 2.83 | |
| Myoblast cell fate
commitment | 2.15 | 2.51 | |
| Histone H3-K36
demethylation | 2.15 | 2.51 | |
| Positive
regulation of T-cell tolerance induction | 2.15 | 2.51 | |
| Smooth muscle
tissue development | 2.04 | 2.7 | |
| Bone
development | 2.96 | | 2.86 |
| Regulation of fat
cell differentiation | 2.88 | | 5.73 |
| Regulation of Wnt
receptor signaling pathway | 2.51 | | 3.58 |
| Negative
regulation of response to stimulus | 2.14 | | 3.39 |
| Regulation of
canonical Wnt receptor signaling pathway | 2.1 | | 2.06 |
| Regulation of BMP
signaling pathway | | 3.12 | 3.39 |
| Negative
regulation of BMP signaling pathway | | 2.96 | 4.26 |
| BMP signaling
pathway | | 2.54 | 2.39 |
| Interphase | | 2.37 | 2.98 |
| Regulation of
transforming growth factor β receptor signaling pathway | | 2.16 | 2.67 |
| Interphase of
mitotic cell cycle | | 2.11 | 3.03 |
| Enriched by
downregulated genes |
| Embryo
development | 2.13 | 2.29 | 2.72 |
| Negative
regulation of transferase activity | 5.37 | 2 | 2.41 |
| Positive
regulation of gene expression | 2.5 | 2.21 | 3.53 |
| Progesterone
receptor signaling pathway | 3.66 | 3.17 | 2.98 |
| Regulation of
toll-like receptor 3 signaling pathway | 3.21 | 4.24 | 4.01 |
| Regulation of
transcription | 2.12 | 2.21 | 5.16 |
| Regulation of
transcription from RNA polymerase II promoter | 2.37 | 3.05 | 5.07 |
| RNA polymerase II
transcriptional preinitiation complex assembly | 2.84 | 2.58 | 2.42 |
| Epithelial cell
maturation | 4.14 | 4.48 | |
| Endodermal
digestive tract morphogenesis | 2.95 | 7.61 | |
| Negative
regulation of tyrosine phosphorylation of STAT protein | 2.19 | 3.17 | |
| Hippo signaling
cascade | 4.64 | | 3.27 |
| Membranous septum
morphogenesis | 4.18 | | 5.01 |
| Tolerance
induction to lipopolysaccharide | 2.95 | | 7.22 |
| Transmembrane
receptor protein tyrosine kinase signaling pathway | 2.84 | | 3.44 |
| Cell
differentiation | 5.54 | | 4.86 |
| Canonical Wnt
receptor signaling pathway | 5.37 | | 3.07 |
| Cellular
developmental process | 5.37 | | 4.64 |
| Cell
development | 5.27 | | 3.7 |
| Regulation of Wnt
receptor signaling pathway | 5.26 | | 3.02 |
| Positive
regulation of canonical Wnt receptor signaling pathway | 5.22 | | 4.52 |
| Epithelial cell
maturation involved in prostate gland development | 5.12 | | 4.01 |
| Epithelial cell
differentiation involved in prostate gland development | 4.83 | | 6.2 |
| Wnt receptor
signaling pathway | 4.76 | | 3.03 |
| Chemotaxis | 4.62 | | 2.16 |
| Positive
regulation of Wnt receptor signaling pathway | 4.42 | | 4.79 |
| Inactivation of
MAPK activity | 4.24 | | 3.73 |
| Apoptosis in bone
marrow | 4.18 | | 5.01 |
| Regulation of
apoptosis in bone marrow | 4.18 | | 5.01 |
| Positive
regulation of cell proliferation | 3.99 | | 3.52 |
| Negative
regulation of MAP kinase activity | 3.96 | | 3.09 |
| Negative
regulation of protein serine/threonine kinase activity | 3.93 | | 3.29 |
| Cellular response
to stimulus | 3.7 | | 5.21 |
| Positive
regulation of cell cycle | 3.34 | | 3.17 |
| Cell motility | 3.22 | | 3.37 |
| Regulation of
response to stimulus | 3.2 | | 5.12 |
| Positive
regulation of response to stimulus | 3.17 | | 4.8 |
| Apoptotic
mitochondrial changes | 3.16 | | 2.67 |
| Cell-cell
adhesion | 3.13 | | 3.05 |
| Regulation of
developmental process | 3.09 | | 5.22 |
| Positive
regulation of release of cytochrome c from mitochondria | 3.09 | | 4.22 |
| Epithelial cell
differentiation | 3.08 | | 3.1 |
| Release of
cytochrome c from mitochondria | 3.07 | | 3.36 |
| Urogenital system
development | 3.05 | | 3.09 |
| Positive
regulation of mitotic cell cycle | 3.05 | | 2.33 |
| Fibroblast growth
factor receptor signaling pathway involved in positive regulation
of cell proliferation | 2.95 | | 7.22 |
| Negative
regulation of CD40 signaling pathway | 2.95 | | 7.22 |
| Negative
regulation of toll-like receptor 3 signaling pathway | 2.95 | | 7.22 |
| Regulation of CD40
signaling pathway | 2.95 | | 7.22 |
| Regulation of
release of cytochrome c from mitochondria | 2.94 | | 3.27 |
| Response to
stimulus | 2.91 | | 3.91 |
| Response to
external stimulus | 2.87 | | 4.43 |
| Glandular
epithelial cell differentiation | 2.84 | | 5.2 |
| Regulation of MAP
kinase activity | 2.79 | | 2.93 |
| Response to
chemical stimulus | 2.73 | | 3.41 |
| Epithelial cell
development | 2.63 | | 2.67 |
| Fibroblast
migration | 2.61 | | 3.4 |
| Regulation of S
phase | 2.5 | | 2.41 |
| Apoptosis | 2.49 | | 6.55 |
| Cell
proliferation | 2.44 | | 4.93 |
| Regulation of cell
proliferation | 2.43 | | 5.55 |
| Epithelium
development | 2.41 | | 2.43 |
| Programmed cell
death | 2.39 | | 6.5 |
| Regulation of cell
differentiation | 2.34 | | 4.12 |
| Cell death | 2.32 | | 5.8 |
| Regulation of
binding | 2.31 | | 4.01 |
| Cell-cell adhesion
mediated by integrin | 2.28 | | 2.04 |
| MAPKKK
cascade | 2.23 | | 3.8 |
| Regulation of cell
migration | 2.21 | | 4.07 |
| Morphogenesis of
an epithelium | 2.13 | | 3.31 |
| Regulation of cell
motility | 2.13 | | 4.02 |
| Epithelial cell
differentiation involved in mammary gland alveolus development | | 4.24 | 4.01 |
| Negative
regulation of cell growth | | 3.23 | 2.93 |
| Developmental
maturation | | 3.23 | 2.2 |
| Erythrocyte
differentiation | | 3.16 | 3.89 |
| Regulation of
toll-like receptor 4 signaling pathway | | 2.84 | 5.67 |
| Positive
regulation of focal adhesion assembly | | 2.84 | 2.67 |
| Positive
regulation of macrophage differentiation | | 2.84 | 2.67 |
| Cellular response
to transforming growth factor β stimulus | | 2.58 | 2.42 |
| Regulation of
histone modification | | 2.44 | 2.44 |
| Cell
maturation | | 2.44 | 2.21 |
| Response to
transforming growth factor β stimulus | | 2.37 | 2.21 |
| Regulation of
epithelial to mesenchymal transition | | 2.23 | 3.44 |
| Lymph vessel
development | | 2.19 | 2.04 |
| Regulation of
histone methylation | | 2.19 | 4.49 |
| Regulation of
myeloid cell differentiation | | 2.18 | 3.56 |
| Response to growth
factor stimulus | | 2.16 | 2.95 |
| Negative
regulation of histone modification | | 2.03 | 4.22 |
Enrichment analysis also revealed that 218, 137 and
99 cellular components were enriched in SDC, SP1 and SP2 groups,
respectively. Cellular components such as membrane structures of
drug resistance components, cell division components, and cell
adhesion structures were enriched in all 3 groups (Table III).
| Table IIIEnriched and shared cellular
components from significantly upregulated or downregulated genes by
2 or 3 stemness groups. |
Table III
Enriched and shared cellular
components from significantly upregulated or downregulated genes by
2 or 3 stemness groups.
| Cellular
component | SDC | SP1 | SP2 |
|---|
| Enriched by
upregulated genes |
| Coated
membrane | 3.41 | 2.11 | |
| Membrane coat | 3.41 | 2.11 | |
| Plasma
membrane-enriched fraction | 3.21 | 2.37 | |
|
1-Phosphatidylinositol-4-phosphate
3-kinase, class IA complex | 2.96 | 6.57 | |
| Basal lamina | 2.77 | 2.75 | |
| Polar
microtubule | 2.62 | 3.06 | |
| Centrosome | | 3.15 | 2.33 |
| Nuclear
envelope | | 2.04 | 2.22 |
| Enriched by
downregulated genes |
| Apicolateral
plasma membrane | 5.04 | 2.03 | 2.7 |
| Apical junction
complex | 4.45 | 2.09 | 2.76 |
| Occluding
junction | 4.43 | 2.41 | 3.13 |
| Tight
junction | 4.43 | 2.41 | 3.13 |
| Intracellular | 4.65 | | 2.09 |
| Intracellular
part | 4.46 | | 2.03 |
| Nucleus | 4.4 | | 4.04 |
| Ruffle | 3.91 | | 2.67 |
| mRNA cap binding
complex | 3.4 | | 2.06 |
| RNA cap binding
complex | 3.4 | | 2.06 |
| Plasma
membrane | 2.94 | | 2.09 |
| Ruffle
membrane | 2.85 | | 4.04 |
| Receptor
complex | 2.77 | | 3.6 |
| Leading edge
membrane | 2.57 | | 2.54 |
| Plasma membrane
part | 2.45 | | 2.02 |
| Junctional
sarcoplasmic reticulum membrane | 2.21 | | 3.01 |
| Excitatory
synapse | 2.21 | | 3.01 |
| I-κβ/NF-κβ
complex | 2.21 | | 3.01 |
| Nuclear lumen | 2.19 | | 2.4 |
| Basolateral plasma
membrane | 2.12 | | 3.19 |
| Neuromuscular
junction | 2.08 | | 2.14 |
| Synaptobrevin
2-SNAP-25-syntaxin-1a-complexin I complex | | 5.21 | 5.05 |
| Synaptobrevin
2-SNAP-25-syntaxin-1a complex | | 4.18 | 4.04 |
| Viral capsid | | 4.18 | 4.04 |
| Virion | | 3.55 | 3.43 |
| Virion part | | 3.55 | 3.43 |
| Apical part of
cell | | 2.73 | 2.03 |
| Golgi lumen | | 2.46 | 2.35 |
In total, 597, 315 and 253 molecular functions were
enriched in cells from SDC, SP1 and SP2 groups, respectively.
Commonly enriched molecular functions in OVCSC cells included
chemorepellent activity, growth factor receptor activity,
epigenetic molecular functions and kinase activity (Table IV).
| Table IVEnriched and shared molecular
functions from significantly upregulated or downregulated genes by
2 or 3 stemness groups. |
Table IV
Enriched and shared molecular
functions from significantly upregulated or downregulated genes by
2 or 3 stemness groups.
| Molecular
function | SDC | SP1 | SP2 |
|---|
| Enriched by
upregulated genes |
| Inositol
1,4,5-trisphosphate-sensitive calcium-release channel activity | 5.12 | 3.49 | |
| Dioxygenase
activity | 4.41 | 4.48 | |
| Oxidoreductase
activity, acting on single donors with incorporation of molecular
oxygen | 4.41 | 4.48 | |
| Oxidoreductase
activity, acting on single donors with incorporation of molecular
oxygen, incorporation of 2 | 4.41 | 4.48 | |
|
Inositol-1,4,5-trisphosphate receptor
activity | 4.26 | 2.94 | |
| Androsterone
dehydrogenase activity | 4.26 | 2.94 | |
|
trans-1,2-dihydrobenzene-1,2-diol
dehydrogenase activity | 4.26 | 2.94 | |
| Androsterone
dehydrogenase (A-specific) activity | 4.18 | 4.38 | |
| Glutaminase
activity | 4.18 | 4.38 | |
| Histone
demethylase activity (H3-K27 specific) | 4.18 | 4.38 | |
| Histone
demethylase activity (H4-K20 specific) | 4.18 | 4.38 | |
| Oxidoreductase
activity, acting on paired donors, with incorporation or reduction
of molecular oxygen, 2-oxogl | 3.9 | 3.33 | |
| Histone
demethylase activity (H3-K9 specific) | 3.66 | 2.56 | |
| Metal ion
binding | 3.57 | 2.09 | |
| L-ascorbic acid
binding | 3.48 | 2.12 | |
| Protein
binding | 3.13 | 2.66 | |
| Calcium-dependent
cysteine-type endopeptidase inhibitor activity | 2.95 | 6.36 | |
| Poly(G) RNA
binding | 2.95 | 6.36 | |
| Poly-glutamine
tract binding | 2.95 | 6.36 | |
| Chemorepellent
activity | 2.61 | 2.94 | |
| Insulin
binding | 2.61 | 2.94 | |
| S100 β
binding | 2.61 | 2.94 | |
| Protein tyrosine
kinase activity | 2.24 | 3.18 | |
| Bile acid
binding | 2.19 | 2.56 | |
| Platelet-derived
growth factor receptor binding | 2.09 | 4.44 | |
| Transmembrane
receptor protein kinase activity | 4.45 | | 2.13 |
| Transmembrane
receptor protein tyrosine kinase activity | 3.33 | | 2.5 |
| Virion
binding | | 2.27 | 9.32 |
| Receptor tyrosine
kinase binding | | 2.04 | 4.72 |
| Enriched by
downregulated genes |
| Fibroblast growth
factor receptor activity | 3.67 | 3.14 | 3 |
| Protein
anchor | 3.22 | 4.21 | 4.03 |
| Thiamine
transmembrane transporter activity | 4.19 | 5.25 | |
| Thiamine uptake
transmembrane transporter activity | 4.19 | 5.25 | |
| Uptake
transmembrane transporter activity | 4.19 | 5.25 | |
| Reduced folate
carrier activity | 2.62 | 3.58 | |
| General
transcriptional repressor activity | 2.29 | 4.73 | |
| Protein
serine/threonine phosphatase inhibitor activity | 2.19 | 3.14 | |
| Phosphatidylserine
binding | 2.06 | 2.01 | |
| Heparan sulfate
proteoglycan binding | 2.06 | 2.01 | |
| Interleukin-1,
type II, blocking receptor activity | 4.19 | | 5.03 |
| Epidermal growth
factor receptor activity | 3.22 | | 4.03 |
| Oncostatin-m
receptor activity | 3.22 | | 4.03 |
| Epinephrine
binding | 3.21 | | 2.68 |
| β2-adrenergic
receptor activity | 2.96 | | 7.25 |
| Calcium-dependent
protein kinase c activity | 2.96 | | 7.25 |
| Calcium-dependent
protein serine/threonine kinase activity | 2.96 | | 7.25 |
| Cytoskeletal
regulatory protein binding | 2.96 | | 7.25 |
| Endoribonuclease
activity, cleaving siRNA-paired mRNA | 2.96 | | 7.25 |
| GTP cyclohydrolase
activity | 2.96 | | 7.25 |
| GTP cyclohydrolase
i activity | 2.96 | | 7.25 |
| Protein channel
activity | 2.96 | | 7.25 |
| Interleukin-1
binding | 2.86 | | 4 |
| Interleukin-1
receptor activity | 2.85 | | 5.22 |
| RNA polymerase II
transcription factor binding | 2.85 | | 2.43 |
| Sodium channel
regulator activity | 2.85 | | 2.43 |
| Actin filament
binding | 2.84 | | 2.97 |
| Protein tyrosine
kinase activity | 2.82 | | 2.19 |
| Adenylate cyclase
binding | 2.62 | | 3.42 |
| Norepinephrine
binding | 2.62 | | 3.42 |
| Insulin receptor
binding | 2.58 | | 2.07 |
| Transmembrane
receptor protein tyrosine kinase activity | 2.54 | | 2.53 |
| Co-SMAD
binding | 2.54 | | 2.22 |
| RNA cap
binding | 2.54 | | 2.22 |
| Small conjugating
protein ligase activity | 2.51 | | 2.81 |
| Map kinase
tyrosine/serine/threonine phosphatase activity | 2.44 | | 3.6 |
| Protein
dimerization activity | 2.41 | | 3.03 |
| Growth factor
binding | 2.4 | | 3.47 |
| Ubiquitin
thiolesterase activity | 2.37 | | 2.68 |
| Acid-amino acid
ligase activity | 2.35 | | 2.38 |
| Transcription
activator activity | 2.32 | | 2.31 |
| Transmembrane
receptor protein kinase activity | 2.31 | | 2.78 |
| Adrenergic
receptor activity | 2.29 | | 2.05 |
| Map kinase
phosphatase activity | 2.26 | | 3.44 |
| Ligase activity,
forming carbon-nitrogen bonds | 2.21 | | 2.01 |
| Cyclohydrolase
activity | 2.19 | | 3 |
| Prostaglandin e
receptor activity | 2.19 | | 3 |
| Protein
serine/threonine kinase activator activity | 2.19 | | 3 |
| Transforming
growth factor β receptor, pathway-specific cytoplasmic mediator
activity | 2.19 | | 3 |
| Ubiquitin-protein
ligase activity | 2.01 | | 3.03 |
| A1 adenosine
receptor binding | | 5.25 | 5.03 |
| Retinoic acid
binding | | 4.73 | 2.05 |
| AMP deaminase
activity | | 4.21 | 4.03 |
|
Phosphatidylinositol-4-phosphate 3-kinase
activity | | 4.21 | 4.03 |
| Adenosine receptor
binding | | 3.14 | 3 |
|
N-acetylglucosamine
6-O-sulfotransferase activity | | 3.14 | 3 |
| Wnt-protein
binding | | 2.57 | 2.42 |
| Thyroid hormone
receptor activity | | 2.56 | 2.43 |
| Transcription
regulator activity | | 2.4 | 5 |
| Cation:chloride
symporter activity | | 2.35 | 4.84 |
| Monovalent
cation:hydrogen antiporter activity | | 2.35 | 2.22 |
| Syntaxin
binding | | 2.34 | 2.2 |
| Transcription
repressor activity | | 2.3 | 4.66 |
| Steroid hormone
receptor activity | | 2.29 | 4.2 |
| Prostaglandin
receptor activity | | 2.17 | 2.05 |
| Ligand-dependent
nuclear receptor activity | | 2.17 | 5.03 |
With regard to signaling pathways, 57, 31 and 33
KEGG pathways were enriched in cells from SDC, SP1 and SP2 groups,
respectively. Key KEGG pathways such as the ErbB pathway,
ECM-receptor pathway, endocytosis pathway and adherens junction
pathway were enriched in all 3 groups (Table V).
| Table VThe shared KEGG pathways of
differentially expressed genes in ovarian cancer stemness
groups. |
Table V
The shared KEGG pathways of
differentially expressed genes in ovarian cancer stemness
groups.
| SDC, SP1 and
SP2 | SDC and SP1 | SDC and SP2 | SP1 and SP2 |
|---|
| ErbB signaling
pathway | Metabolic
pathways | Pathways in
cancer | T-cell receptor
signaling pathway |
| Prostate
cancer | Focal adhesion | Endocytosis | Amoebiasis |
| ECM-receptor
interaction | MAPK signaling
pathway | NOD-like receptor
signaling pathway |
| Dilated
cardiomyopathy | Adherens
junction | Dorso-ventral axis
formation |
| Hypertrophic
cardiomyopathy | Epithelial cell
signaling in Helicobacter pylori infection | Lysine
biosynthesis |
| Small-cell lung
cancer | B-cell-receptor
signaling pathway | |
| Arrhythmogenic
right ventricular cardiomyopathy | Hedgehog signaling
pathway | |
| Peroxisome | Pathogenic
Escherichia coli infection | |
| Systemic lupus
erythematosus | | |
| Glycosaminoglycan
biosynthesis-keratan sulfate | | |
|
Glycosylphosphatidylinositol (GPI)-anchor
biosynthesis | | |
| D-Glutamine and
D-glutamate metabolism | | |
Cancer stem cell signature-specific drug
prescreening
The list of differentially expressed genes
identified does not necessarily represent the cancerous features of
OVCSCs. CSCs are highly quiescent whereas differentiated cancer
cells are highly proliferative. Genes responsible for the quiescent
state were also included in the above lists; however, they may not
be ideal targets for therapy, as reversion of the quiescent state
of OVCSCs may translate to the massive production of cancerous
cells, which is undesirable. Therefore, it is necessary to focus on
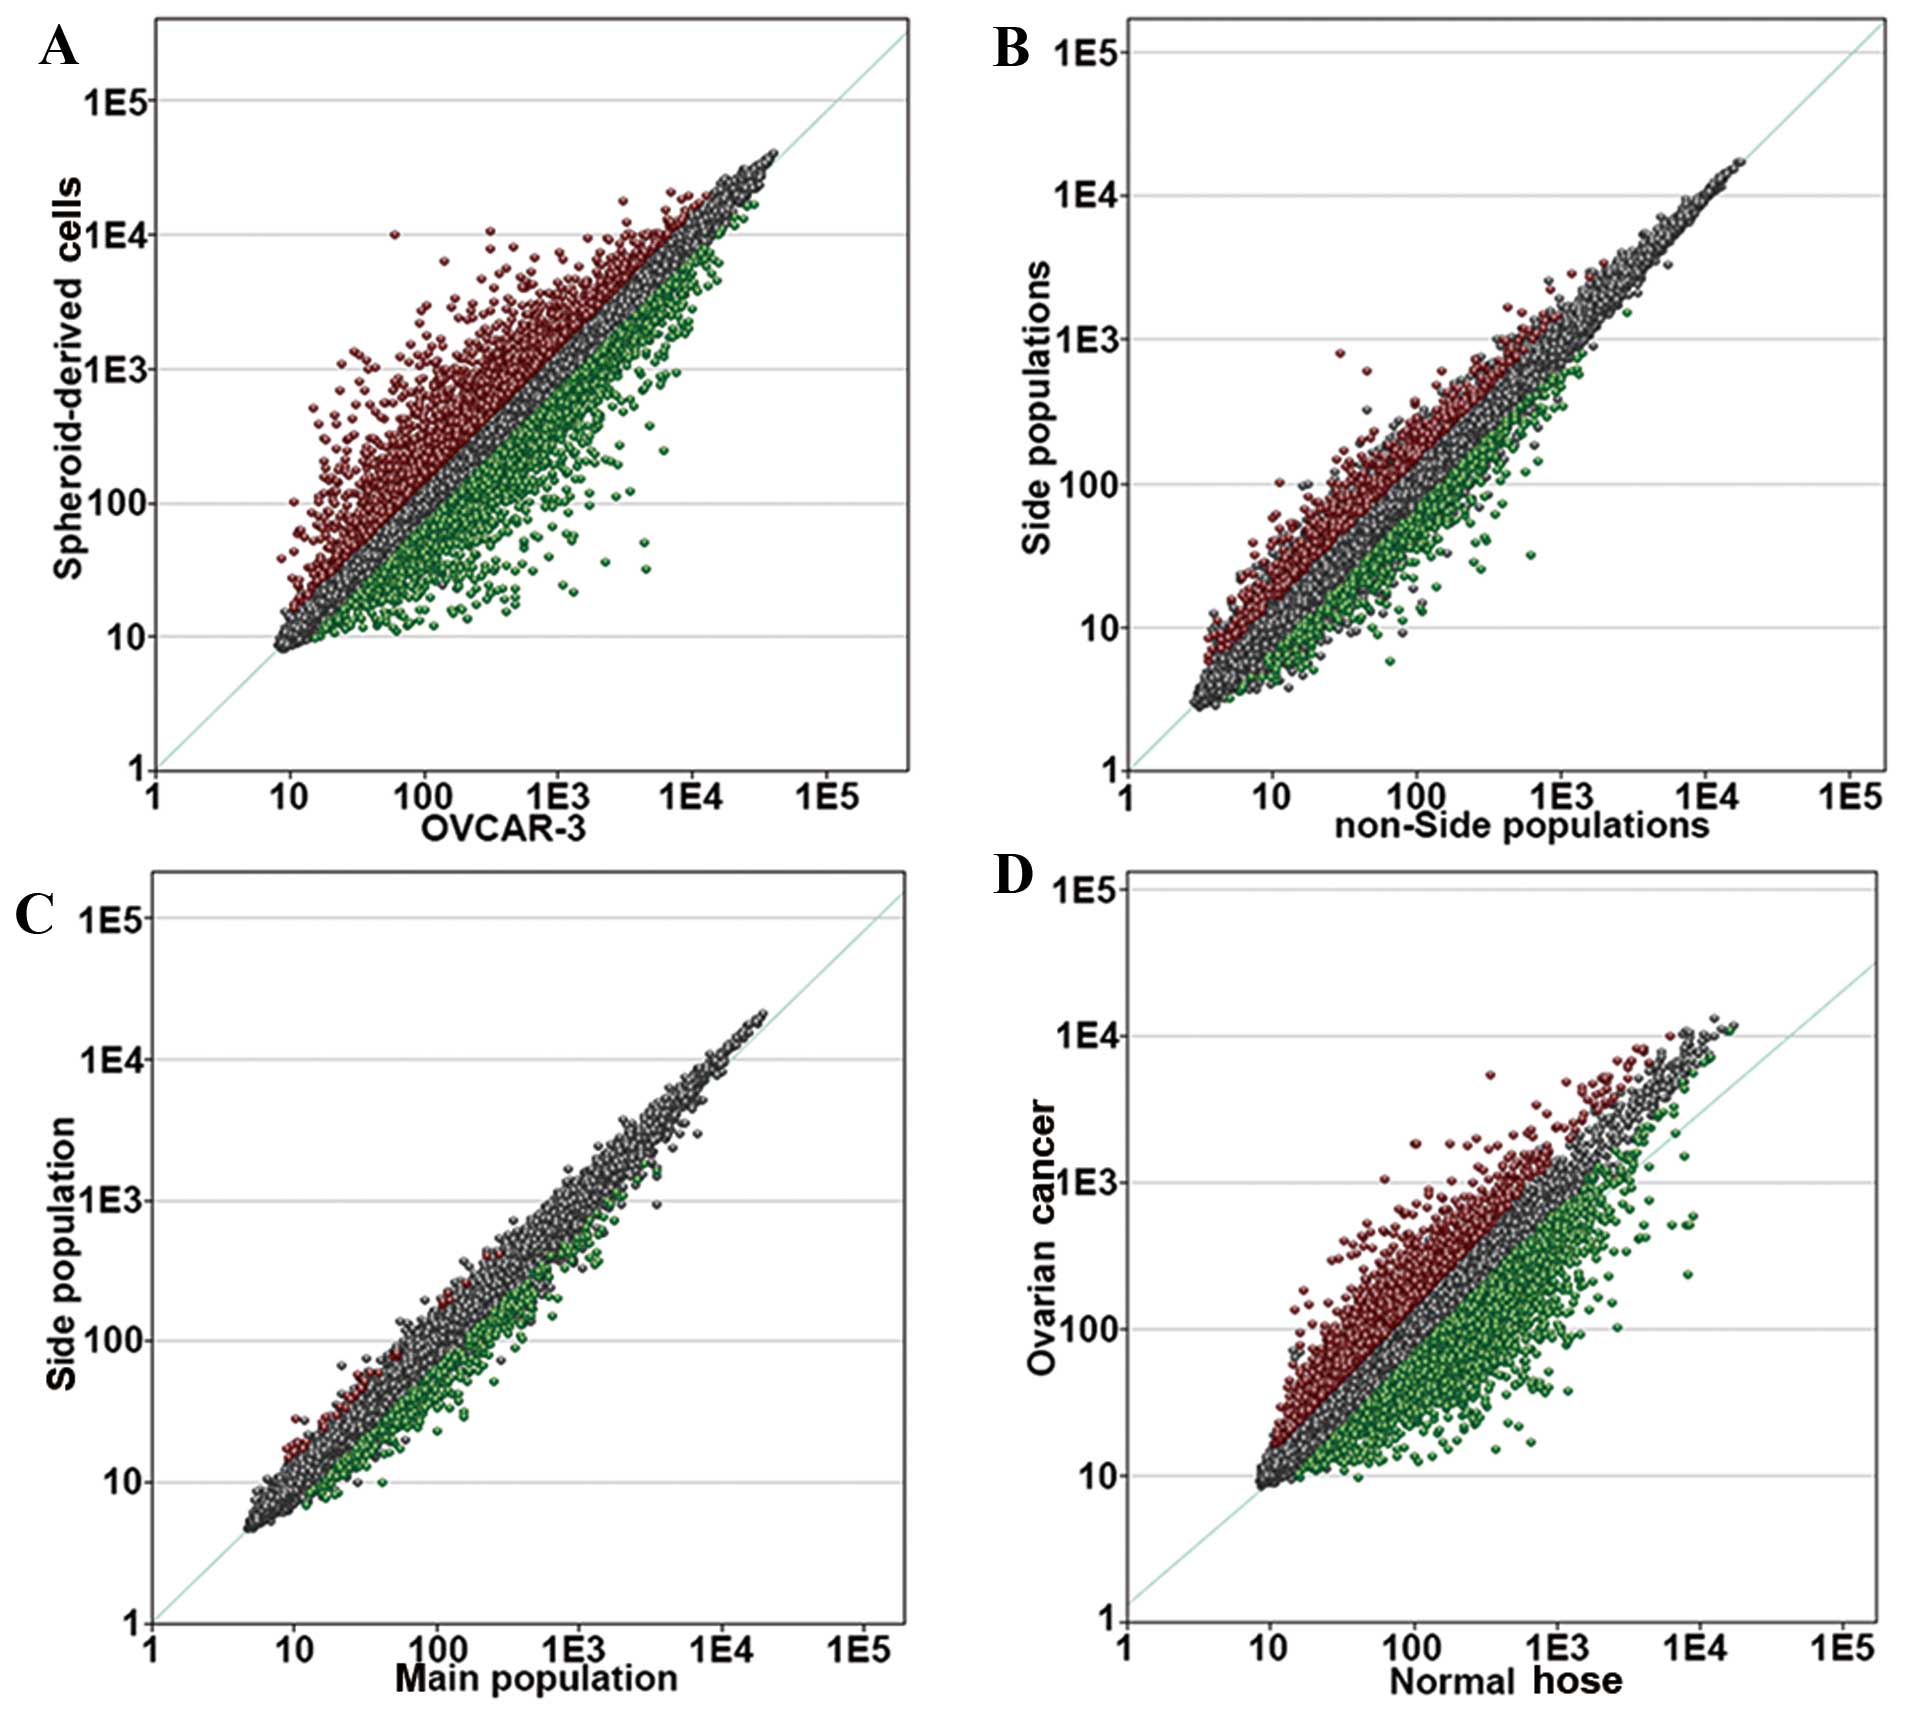
the cancerous features of OVCSCs. Compared with the normal ovarian
surface epithelium, there were 2,669 upregulated and 3,384
downregulated genes in cells derived from patients with advanced
OvC (Fig. 2). This set of genes
represented cancerous features, and these genes were considered
candidates for the OVCSC signature. With this calibration set,
genes unrelated to the cancerous features of OVCSCs, such as those
responsible for the quiescent state, were removed from the list of
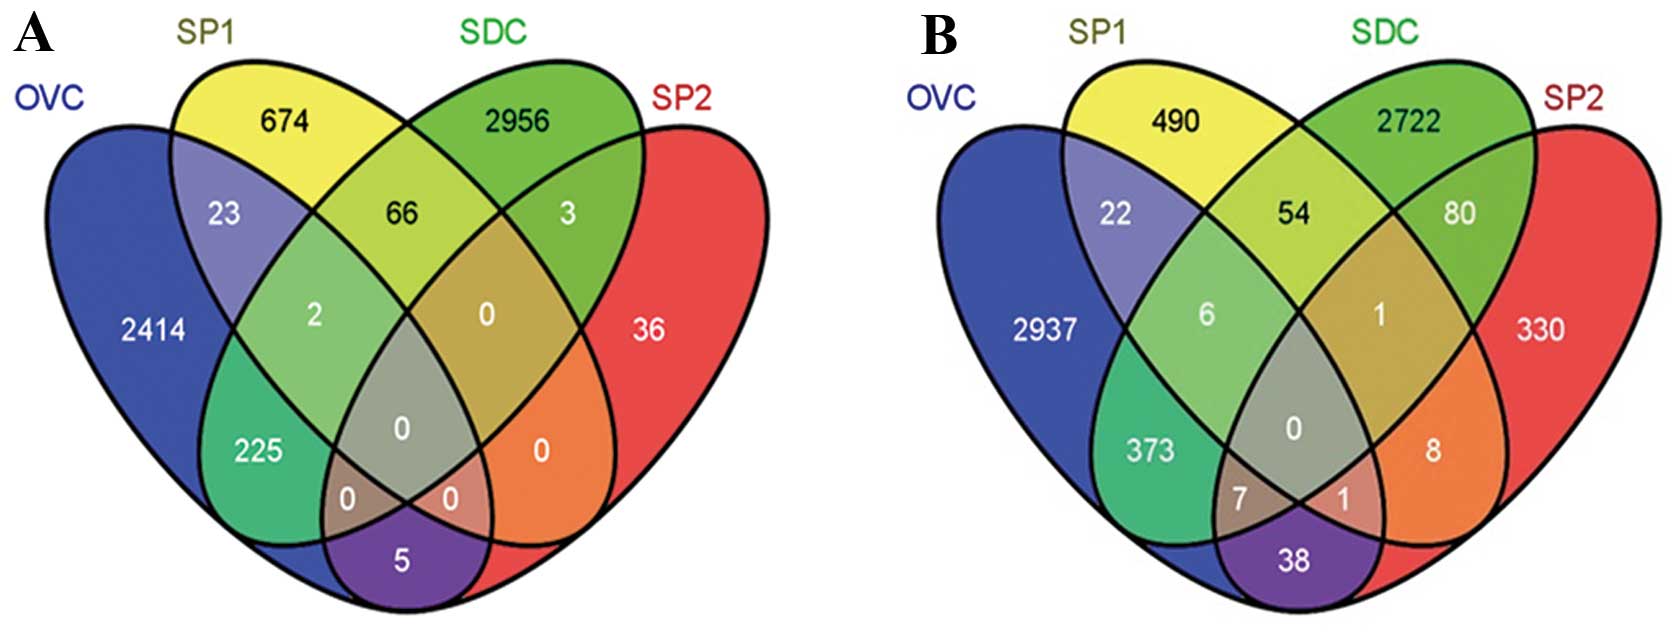
differentially expressed genes. Compared with non-stemness
controls, there were 225 upregulated and 373 downregulated probes
in the SDC group, 23 upregulated and 22 downregulated probes in the
SP1 group and 5 upregulated and 38 downregulated probes in the SP2
group. There were 2 shared upregulated probes and 6 shared
downregulated probes between cells from SP1 and SDC groups; 7
shared downregulated probes between cells from the SDC and SP2
groups, and 1 commonly downregulated probe between cells from the
SP1 and SP2 groups compared with non-stemness controls (Fig. 3; Table
VI). An OVCSC signature was generated by combining the 255
upregulated tags (23+2+225+5) and the 447 downregulated tags
(22+6+373+7+38+1).
| Table VIThe probes from shared upregulated
and downregulated genes in ovarian cancer stem cell groups and the
calibration group. |
Table VI
The probes from shared upregulated
and downregulated genes in ovarian cancer stem cell groups and the
calibration group.
| Group | Probe | Gene name | Direction | SDC ratio
(P-value) | SP1 ratio
(P-value) | SP2 ratio
(P-value) | OVC ratio
(P-value) |
|---|
| SDC, SP1 and
OVC | 211139_s_at | NGFI-A binding
protein 1 (EGR1 binding protein 1) NAB1 | Up | 1.6
(0.000524207987825496) | 2.19
(0.00487987405631332) | | 1.79
(0.000889300306837179) |
| 215921_at | Nuclear pore
complex interacting protein-like 1 | Up | 1.58
(0.00945304058490303) | 2.09
(0.0202576342575334) | | 1.61
(0.0014333481542029) |
| 207808_s_at | Protein S (α) | Down | 7.84
(0.0000735247070136605) | 1.76
(0.00346916670529939) | | 12.32
(1.44641461217268E-08) |
| 205862_at | GREB1 protein | Down | 3.22
(0.000988605674703398) | 2.53
(0.0137390333141558) | | 4.36
(0.0000851847027384107) |
| 213931_at | Inhibitor of DNA
binding 2, dominant negative helix-loop-helix protein | Down | 2.85
(0.000472661276918831) | 3.32
(0.00185745595436645) | | 3.17
(0.000972847067933643) |
| 203543_s_at | Kruppel-like factor
9 | Down | 4.98
(4.04319757064431E-07) | 1.58
(0.0229481071140268) | | 1.92
(2.24515014734723E-06) |
| 201566_x_at | Inhibitor of DNA
binding 2, dominant negative helix-loop-helix protein | Down | 7.24
(0.0000951288294734348) | 2.05
(0.0411757137373141) | | 1.8
(0.0095330740950358) |
| 205934_at | Phospholipase
C-like 1 | Down | 1.54
(0.00586645102487323) | 2.14
(0.0491165384831927) | | 1.55
(0.00197953042446589) |
| SDC, SP2 and
OVC | 212096_s_at | Mitochondrial tumor
suppressor 1 | Down | 2.44
(6.10988330229413E-06) | | 1.68
(0.0291768466561271) | 6.61
(2.61683134224164E-06) |
| 209288_s_at | CDC42 effector
protein (Rho GTPase binding) 3 | Down | 2.05
(0.000033372563900896) | | 2.33
(0.027635397819083) | 5.37
(5.86407256617617E-06) |
| 204224_s_at | GTP cyclohydrolase
1 | Down | 1.55
(0.000854582086891518) | | 1.84
(0.0394499654614312) | 2.54
(0.0324455426569389) |
| 204566_at | Protein phosphatase
1D magnesium-dependent, δ isoform | Down | 1.61
(0.00187102894792315) | | 1.72
(0.0472030826782719) | 2.44
(5.76098014017778E-06) |
| 218182_s_at | Claudin 1 | Down | 4.85
(0.0000344349818731975) | | 1.55
(0.0482489441482889) | 1.87
(0.00689245472667143) |
| 209286_at | CDC42 effector
protein (Rho GTPase binding) 3 | Down | 1.9
(0.0133367282355993) | | 1.94
(0.0158631362361945) | 1.66
(0.00733852668541466) |
| 205659_at | Histone deacetylase
9 | Down | 1.88
(9.57664107206817E-06) | | 2.2
(0.0335751161813233) | 1.5
(0.00774593390013839) |
| SP1, SP2, and
OVC | 207992_s_at | Adenosine
monophosphate deaminase (isoform E) | Down | | 1.94
(0.0304265496975559) | 2.23
(0.0288974231347468) | 2.02
(0.0000150036714772332) |
OVCSC signatures of 255 upregulated probes and 447
downregulated probes were analyzed by the CMAP for a drug
prescreening. Of the 6,100 proceeded instances, it was predicted
that 1,500 had the potential to promote the OVCSC signature, as
indicated by their positive enrichment scores, whereas 1,419 could
have anti-OVCSC effects, as reflected by their negative enrichment
scores. By further filtering the 1,419 molecules with negative
scores with the described criteria, 18 remained as the most
promising therapeutic small-molecule candidates to target OVCSCs,
for example SC-560, disulfiram (DS), thapsigargin, esculetin,
cinchonine, alvespimycin and tanespimycin (Table VII).
| Table VIIEighteen therapeutic small-molecule
drugs with potential OVCSC-specific targeting abilities in ovarian
cancer. |
Table VII
Eighteen therapeutic small-molecule
drugs with potential OVCSC-specific targeting abilities in ovarian
cancer.
| Connectivity Map
name | Mean | N | Enrichment | P-value | Specificity | % Non-null | Category |
|---|
| Sc-560 | −0.52 | 3 | −0.927 | 0.00062 | 0.0121 | 100 | COX-1
inhibitor |
| Prestwick-1082 | −0.43 | 3 | −0.899 | 0.00192 | 0.0246 | 100 | |
| Puromycin | −0.48 | 4 | −0.865 | 0.00062 | 0.0373 | 100 | Protein synthesis
inhibitor |
| Doxylamine | −0.47 | 5 | −0.854 | 0.00016 | 0.016 | 100 | Antihistamines |
| Pralidoxime | −0.36 | 4 | −0.848 | 0.00097 | 0 | 100 | Cholinesterase
reactivator |
| Disulfiram | −0.4 | 5 | −0.846 | 0.00024 | 0.0072 | 100 | Proteasome
inhibitor |
| Thapsigargin | −0.34 | 3 | −0.841 | 0.00809 | 0.1161 | 100 | Non-competitive
SERCA inhibitor |
| Esculetin | −0.32 | 3 | −0.836 | 0.00877 | 0 | 100 | |
| Phenazone | −0.39 | 3 | −0.833 | 0.00931 | 0.0231 | 100 | Analgesic and
antipyretic |
| Cinchonine | −0.51 | 4 | −0.787 | 0.00416 | 0.0617 | 100 | Alkaloid |
| Lycorine | −0.29 | 5 | −0.762 | 0.00144 | 0.08 | 80 | Protein synthesis
inhibitor |
| Benzthiazide | −0.17 | 4 | −0.756 | 0.00716 | 0.0204 | 50 | Diuretic and
antihypertensive |
| Naltrexone | −0.22 | 5 | −0.735 | 0.0027 | 0.0225 | 60 | Opioid receptor
antagonist |
| Atropine oxide | −0.21 | 5 | −0.714 | 0.00417 | 0.0062 | 60 | |
| Pyrimethamine | −0.28 | 5 | −0.703 | 0.00505 | 0.02 | 80 | DHFR inhibitor |
|
Diethylstilbestrol | −0.27 | 6 | −0.641 | 0.00612 | 0.0164 | 83 | Synthetic
nonsteroidal estrogen |
| Alvespimycin | −0.24 | 12 | −0.501 | 0.00255 | 0.0797 | 58 | Hsp90
inhibitor |
| Tanespimycin | −0.19 | 62 | −0.482 | 0 | 0.0672 | 53 | Hsp90
inhibitor |
Discussion
OvC has the highest mortality rates of all
gynecological malignancies and the 5-year survival rates of
patients with OvC remain poor (15). CSC theory can consistently
illustrate many clinical and pathological features of OvC, and they
have been well supported by the isolation and identification of
CSCs in side populations, multi-cellular spheroids from tumor bulk
(16) and OvC cell lines (4). CSCs, which often consist of a low
fraction, have been established to have a general connection to OvC
progression, such as relapse, migration and drug resistance.
Efforts have been made to study the characteristics of CSCs in
detail and to effectively eliminate them.
By comparing the genome-wide expression profiles of
OVCSC-specific clinical and experimental specimens from the GEO
database, we identified the differentially expressed genes shared
by 3 OVCSC groups. Most of the OVCSC signature genes were closely
related with respect to CSC properties and OvC progression. NGFI-A
binding protein 1 has been reported to be upregulated in several
OVCSC groups (17). By inhibiting
the transcription factor EGR-1, NAB1 downregulates the
transcription of aminolevulinic acid synthase 1 (ALAS1), leading to
increase in the intracellular level of heme via feedback regulation
(17). High levels of heme,
together with iron-mediated oxidative stress and inflammation in
patients with endometriosis, can accelerate the progression of OvC
(18). In the present study, genes
that were downregulated in all OVCSC groups included PROS1 (protein
S α), GREB1, KLF9 (Kruppel like factor 9), MTUS1 (mitochondrial
tumor suppressor 1), PPM1D (protein phosphatase 1D
magnesium-dependent) and inhibitor of DNA binding 2 (ID2). The
downregulation of gene PROS1, a member of the HNF4α tumor
suppressor network, can promote cell proliferation and finally
leads to tumor progression (19).
In breast cancer, estrogen-receptor-negative cancer cells with low
levels of GREB1 expression (20)
have more stem cell features than other cancer cells (21). Overexpression of KLF9, a
differentiation-related transcription factor, promoted
differentiation of malignant glioma stem cell spheres and inhibited
their proliferation in vivo in a xenotransplantation model
(22). The downregulation of KLF9
in OVCSCs suggests that its absence may be required to maintain
stemness. We also confirmed downregulation of the potential tumor
suppressor gene MTUS1 in OVCSCs, which is consistent with a
previous study showing that downregulation of MTUS1 and Claudin-1
(CL-1) in various human tumors is related to active proliferation,
poor differentiation and poor clinical outcomes (23). PPM1D, a highly expressed oncogene in
various human tumors, can inactivate CHK1 and p53 via
dephosphorylation, leading to cisplatin resistance in cancer cells.
Therefore, this gene is a potential target for treatment of OvC
(24,25). ID2 is a new drug target, as high
expression of ID2 can maintain the pluripotency of neural stem cell
spheroids by direct inhibition of p53 (26). However, both PPM1D and ID2 were
downregulated in the OVCSC groups, which may be due to the
concealment and quiescence of CSCs, but this requires further
investigation.
To identify the CSC features shared by 3 OVCSC
groups, detailed Gene Ontology analysis was performed by using the
GeneSifter software using domains of biological processes, cellular
components and molecular functions. Differentially expressed genes
were significantly enriched in biological features such as
tolerance induction, cell cycle regulation, stemness maintenance
and anti-apoptosis (all processes involved in OvC progression),
which can easily distinguish OVCSCs from other OvC cells. By
analyzing the enriched signaling pathways involving differentially
expressed genes, we found that OVCSCs were different from other OvC
cells in the ECM-receptor pathway, focal adhesion pathway and
adherens junction signaling pathway. This finding is consistent
with findings from other studies showing a strong correlation
between these signaling pathways and epithelial stem cell
proliferation, cancer invasion and migration and staged tumor
progression (27,28). Moreover, some of these pathways have
important functions in CSCs. The ErbB signaling pathway mediates
epithelial-mesenchymal transitions in breast cancer, and is
enriched in CD44+/CD24− breast CSCs (29–31).
During Helicobacter pylori infection, normal
gastrointestinal stem cells are disrupted through epithelial cell
signaling and the downstream STAT and WNT signaling pathways,
leading to the genesis and progression of gastrointestinal tumors
(32). These signaling pathways may
also cooperate in colonic glands epithelial tumor stem cells.
Pathogenic Escherichia coli infection correlates with the
formation and progression of an epithelial colonic tumor,
indicating that the same pathway is also active in OVCSCs (33). Endocytosis-related pathways are
enriched in OVCSCs and represent endocytosis mediated by
OVCSC-specific surface markers such as CD133 and CD44 (34).
Following characterization of signature genes in
OVCSCs, co-expression extrapolation was performed with the CMAP,
and small-molecule compounds with potential anti-OVCSC
pharmacological properties were identified. Notably, some of these
compounds [such as SC-560, disulfiram (DS), thapsigargin,
esculetin, cinchonine, alvespimycin and tanespimycin] have been
tested in other tumors. As a selective inhibitor of
cyclooxygenase-1, SC-560 significantly inhibits cell proliferation
and arrests cells in the G0/G1 phase. SC-560 can induce autophagy
of colon cancer cells in vitro (35) and SC-560 effectively suppresses
tumor growth in animals xenografted with the ovarian cancer cell
line SKOV-3 by inhibiting cell proliferation and promoting
apoptosis (36). Taken together,
our results and those from previous studies on OVCSCs suggest that
SC-560 is a promising target for OvC treatment. The presence of the
recently identified CSC marker aldehyde dehydrogenase (ALDH) has
been validated in many solid tumors, including breast, colon cancer
and OvC (37). Disulfiram (DS), an
ALDH protease inhibitor, might suppress the migration of glioma
stem cells and be used as adjuvant treatment after resection and
chemotherapy (38). A recent study
confirmed that DS effectively inhibits the formation of breast
cancer stem cell spheres while promoting the cytotoxic effect of
taxol on breast cancer cell lines by simultaneously inducing
reactive oxygen species and inhibiting the NF-κB signaling pathway.
Thapsigargin has been tested in clinical trials for its high
efficacy in targeting CSC-specific signaling pathways (39). The natural compound esculetin
effectively inhibits Ras/ERK1/2-mediated in vitro
proliferation of colon cancer cells (40). In vivo studies also indicate
that esculetin can significantly enhance the chemotherapy effects
of cisplatin by regulating the expression of p53/Akt/phosphatase
while reducing side-effects such as induced nephrotoxicity and
acute leucopenia (41). The
alkaloid cinchonine may reverse multi-drug resistance (MDR), which
is an important mechanism for chemotherapy failure. In 2001,
Furusawa et al (42) found
that cinchonine enhances doxorubicin-induced apoptosis in
multi-drug-resistant P388 leukemia cells. A recent study on
cervical cancer confirmed that cinchonine not only reverses the
multi-drug-resistant properties of tumor cells but also has
synergistic effects on taxol-induced apoptosis (43). Therefore, cinchonine may also help
overcome MDR in OVCSCs. It has recently been shown that the opioid
antagonist naltrexone (NTX) effectively inhibits the proliferation
of OvC in vitro and in xenograft tumor models. NTX can
significantly enhance the efficacy of cisplatin and effectively
inhibit tumor progression while alleviating the cytotoxic effects
of chemotherapy (44). The heat
shock protein 90 (Hsp90) inhibitors alvespimycin and tanespimycin
have synergistic and sensitizing effects with cisplatin and other
chemotherapy drugs used to treat breast, bladder cancer, and
nervous gliomas via their specific anti-CSC effects (45–47).
In clinical trials, several Hsp90 inhibitors have been effective in
promoting targeted therapies of OvC. The above compounds provide
new options to avoiding chemotherapy failure by specifically
targeting CSCs (48). In the
present study, we compared gene expression profiles from several
OVCSC samples with their non-stemness cancer controls. Our study
revealed that OVCSCs related differentially expressed genes,
enriched Gene Ontology properties and key signaling pathways, and
generated an OVCSC-specific signature for screening the
small-molecule compounds with potential anti-OVCSC pharmacological
properties. Thus, this approach may provide new insights into
developing specific drugs that target OVCSCs.
Acknowledgements
The present study was supported by the Youth Program
of Tianjin Nature Science Foundation (no. 13JCQNJC10700), the
Tianjin Technology Support Program of International Science and
Technology Cooperation (09ZCZDSF03800) and the 973 Program (Grant
2009CB918903).
References
|
1
|
Dingli D and Michor F: Successful therapy
must eradicate cancer stem cells. Stem Cells. 24:2603–2610. 2006.
View Article : Google Scholar : PubMed/NCBI
|
|
2
|
Frank NY, Schatton T and Frank MH: The
therapeutic promise of the cancer stem cell concept. J Clin Invest.
120:41–50. 2010. View
Article : Google Scholar : PubMed/NCBI
|
|
3
|
Clarke-Pearson DL: Clinical practice.
Screening for ovarian cancer. N Engl J Med. 361:170–177. 2009.
View Article : Google Scholar : PubMed/NCBI
|
|
4
|
Zhang S, Balch C, Chan MW, et al:
Identification and characterization of ovarian cancer-initiating
cells from primary human tumors. Cancer Res. 68:4311–4320. 2008.
View Article : Google Scholar : PubMed/NCBI
|
|
5
|
Rahman MT, Nakayama K, Rahman M, et al:
Notch3 overexpression as potential therapeutic target in advanced
stage chemoresistant ovarian cancer. Am J Clin Pathol. 138:535–544.
2012. View Article : Google Scholar : PubMed/NCBI
|
|
6
|
McAuliffe SM, Morgan SL, Wyant GA, et al:
Targeting Notch, a key pathway for ovarian cancer stem cells,
sensitizes tumors to platinum therapy. Proc Natl Acad Sci USA.
109:E2939–E2948. 2012. View Article : Google Scholar : PubMed/NCBI
|
|
7
|
Gene Ontology Consortium. The Gene
Ontology project in 2008. Nucleic Acids Res. 36:D440–D444.
2008.PubMed/NCBI
|
|
8
|
Kanehisa M, Goto S, Kawashima S, Okuno Y
and Hattori M: The KEGG resource for deciphering the genome.
Nucleic Acids Res. 32:D277–D280. 2004.PubMed/NCBI
|
|
9
|
Lamb J, Crawford ED, Peck D, et al: The
Connectivity Map: using gene-expression signatures to connect small
molecules, genes, and disease. Science. 313:1929–1935. 2006.
View Article : Google Scholar
|
|
10
|
Lee JK, Havaleshko DM, Cho H, et al: A
strategy for predicting the chemosensitivity of human cancers and
its application to drug discovery. Proc Natl Acad Sci USA.
104:13086–13091. 2007. View Article : Google Scholar : PubMed/NCBI
|
|
11
|
Rizzo S, Hersey JM, Mellor P, et al:
Ovarian cancer stem cell-like side populations are enriched
following chemotherapy and overexpress EZH2. Mol Cancer Ther.
10:325–335. 2011. View Article : Google Scholar : PubMed/NCBI
|
|
12
|
Vathipadiekal V, Saxena D, Mok SC,
Hauschka PV, Ozbun L and Birrer MJ: Identification of a potential
ovarian cancer stem cell gene expression profile from advanced
stage papillary serous ovarian cancer. PLoS One. 7:e290792012.
View Article : Google Scholar : PubMed/NCBI
|
|
13
|
Wang L, Mezencev R, Bowen NJ, Matyunina LV
and McDonald JF: Isolation and characterization of stem-like cells
from a human ovarian cancer cell line. Mol Cell Biochem.
363:257–268. 2012. View Article : Google Scholar : PubMed/NCBI
|
|
14
|
Bonome T, Levine DA, Shih J, et al: A gene
signature predicting for survival in suboptimally debulked patients
with ovarian cancer. Cancer Res. 68:5478–5486. 2008. View Article : Google Scholar : PubMed/NCBI
|
|
15
|
Ozols RF: Treatment goals in ovarian
cancer. Int J Gynecol Cancer. 15(Suppl 1): 3–11. 2005. View Article : Google Scholar : PubMed/NCBI
|
|
16
|
Bapat SA, Mali AM, Koppikar CB and Kurrey
NK: Stem and progenitor-like cells contribute to the aggressive
behavior of human epithelial ovarian cancer. Cancer Res.
65:3025–3029. 2005.PubMed/NCBI
|
|
17
|
Gotoh S, Nakamura T, Kataoka T and
Taketani S: Egr-1 regulates the transcriptional repression of mouse
δ-aminolevulinic acid synthase 1 by heme. Gene. 472:28–36.
2011.
|
|
18
|
Munksgaard PS and Blaakaer J: The
association between endometriosis and ovarian cancer: a review of
histological, genetic and molecular alterations. Gynecol Oncol.
124:164–169. 2012. View Article : Google Scholar : PubMed/NCBI
|
|
19
|
Grigo K, Wirsing A, Lucas B, Klein-Hitpass
L and Ryffel GU: HNF4α orchestrates a set of 14 genes to
down-regulate cell proliferation in kidney cells. Biol Chem.
389:179–187. 2008.
|
|
20
|
Hnatyszyn HJ, Liu M, Hilger A, et al:
Correlation of GREB1 mRNA with protein expression in breast cancer:
validation of a novel GREB1 monoclonal antibody. Breast Cancer Res
Treat. 122:371–380. 2010. View Article : Google Scholar : PubMed/NCBI
|
|
21
|
Sahab ZJ, Man YG, Byers SW and Sang QX:
Putative biomarkers and targets of estrogen receptor negative human
breast cancer. Int J Mol Sci. 12:4504–4521. 2011. View Article : Google Scholar : PubMed/NCBI
|
|
22
|
Ying M, Sang Y, Li Y, et al: Kruppel-like
family of transcription factor 9, a differentiation-associated
transcription factor, suppresses Notch1 signaling and inhibits
glioblastoma-initiating stem cells. Stem Cells. 29:20–31. 2011.
View Article : Google Scholar
|
|
23
|
Ding X, Zhang N, Cai Y, et al:
Down-regulation of tumor suppressor MTUS1/ATIP is associated with
enhanced proliferation, poor differentiation and poor prognosis in
oral tongue squamous cell carcinoma. Mol Oncol. 6:73–80. 2012.
View Article : Google Scholar : PubMed/NCBI
|
|
24
|
Tan DS, Lambros MB, Rayter S, et al: PPM1D
is a potential therapeutic target in ovarian clear cell carcinomas.
Clin Cancer Res. 15:2269–2280. 2009. View Article : Google Scholar : PubMed/NCBI
|
|
25
|
Ali AY, Abedini MR and Tsang BK: The
oncogenic phosphatase PPM1D confers cisplatin resistance in ovarian
carcinoma cells by attenuating checkpoint kinase 1 and p53
activation. Oncogene. 31:2175–2186. 2012. View Article : Google Scholar : PubMed/NCBI
|
|
26
|
Paolella BR, Havrda MC, Mantani A, Wray
CM, Zhang Z and Israel MA: p53 directly represses Id2 to inhibit
the proliferation of neural progenitor cells. Stem Cells.
29:1090–1101. 2011. View
Article : Google Scholar : PubMed/NCBI
|
|
27
|
Krupp M, Maass T, Marquardt JU, et al: The
functional cancer map: a systems-level synopsis of genetic
deregulation in cancer. BMC Med Genomics. 4:532011. View Article : Google Scholar : PubMed/NCBI
|
|
28
|
Lane D, Goncharenko-Khaider N, Rancourt C
and Piche A: Ovarian cancer ascites protects from TRAIL-induced
cell death through αvβ5 integrin-mediated focal adhesion kinase and
Akt activation. Oncogene. 29:3519–3531. 2010.
|
|
29
|
Nakanishi T, Chumsri S, Khakpour N, et al:
Side-population cells in luminal-type breast cancer have
tumour-initiating cell properties, and are regulated by HER2
expression and signalling. Br J Cancer. 102:815–826. 2010.
View Article : Google Scholar : PubMed/NCBI
|
|
30
|
Hardy KM, Booth BW, Hendrix MJ, Salomon DS
and Strizzi L: ErbB/EGF signaling and EMT in mammary development
and breast cancer. J Mammary Gland Biol Neoplasia. 15:191–199.
2010. View Article : Google Scholar : PubMed/NCBI
|
|
31
|
Wang KH, Kao AP, Chang CC, et al:
Increasing CD44+/CD24− tumor stem cells, and
upregulation of COX-2 and HDAC6, as major functions of HER2 in
breast tumorigenesis. Mol Cancer. 9:2882010.
|
|
32
|
Katoh M and Katoh M: STAT3-induced WNT5A
signaling loop in embryonic stem cells, adult normal tissues,
chronic persistent inflammation, rheumatoid arthritis and cancer
(Review). Int J Mol Med. 19:273–278. 2007.PubMed/NCBI
|
|
33
|
Bronowski C, Smith SL, Yokota K, et al: A
subset of mucosa-associated Escherichia coli isolates from
patients with colon cancer, but not Crohn’s disease, share
pathogenicity islands with urinary pathogenic E. coli.
Microbiology. 154:571–583. 2008.PubMed/NCBI
|
|
34
|
Bourseau-Guilmain E, Griveau A, Benoit JP
and Garcion E: The importance of the stem cell marker
prominin-1/CD133 in the uptake of transferrin and in iron
metabolism in human colon cancer Caco-2 cells. PLoS One.
6:e255152011. View Article : Google Scholar : PubMed/NCBI
|
|
35
|
Wu WK, Sung JJ, Wu YC, et al: Inhibition
of cyclooxygenase-1 lowers proliferation and induces macroautophagy
in colon cancer cells. Biochem Biophys Res Commun. 382:79–84. 2009.
View Article : Google Scholar : PubMed/NCBI
|
|
36
|
Li W, Wang J, Jiang HR, et al: Combined
effects of cyclooxygenase-1 and cyclooxygenase-2 selective
inhibitors on ovarian carcinoma in vivo. Int J Mol Sci.
12:668–681. 2011. View Article : Google Scholar : PubMed/NCBI
|
|
37
|
Silva IA, Bai S, McLean K, et al: Aldehyde
dehydrogenase in combination with CD133 defines angiogenic ovarian
cancer stem cells that portend poor patient survival. Cancer Res.
71:3991–4001. 2011. View Article : Google Scholar : PubMed/NCBI
|
|
38
|
Kast RE and Belda-Iniesta C: Suppressing
glioblastoma stem cell function by aldehyde dehydrogenase
inhibition with chloramphenicol or disulfiram as a new treatment
adjunct: an hypothesis. Curr Stem Cell Res Ther. 4:314–317. 2009.
View Article : Google Scholar : PubMed/NCBI
|
|
39
|
Ghantous A, Gali-Muhtasib H, Vuorela H,
Saliba NA and Darwiche N: What made sesquiterpene lactones reach
cancer clinical trials? Drug Discov Today. 15:668–678. 2010.
View Article : Google Scholar : PubMed/NCBI
|
|
40
|
Park SS, Park SK, Lim JH, Choi YH, Kim WJ
and Moon SK: Esculetin inhibits cell proliferation through the
Ras/ERK1/2 pathway in human colon cancer cells. Oncol Rep.
25:223–230. 2011.PubMed/NCBI
|
|
41
|
Nakamura Y: Retracted: Modulation of
p53/Akt/phosphatase and tensin homolog expression by esculetin
potentiates the anticancer activity of cisplatin and prevents its
nephrotoxicity. Cancer Sci. 103:1542012. View Article : Google Scholar : PubMed/NCBI
|
|
42
|
Furusawa S, Nakano S, Wu J, et al:
Apoptosis induced by doxorubicin and cinchonine in P388
multidrug-resistant cells. J Pharm Pharmacol. 53:1029–1039. 2001.
View Article : Google Scholar : PubMed/NCBI
|
|
43
|
Lee SY, Rhee YH, Jeong SJ, et al:
Hydrocinchonine, cinchonine, and quinidine potentiate
paclitaxel-induced cytotoxicity and apoptosis via multidrug
resistance reversal in MES-SA/DX5 uterine sarcoma cells. Environ
Toxicol. 26:424–431. 2011. View Article : Google Scholar
|
|
44
|
Donahue RN, McLaughlin PJ and Zagon IS:
Low-dose naltrexone suppresses ovarian cancer and exhibits enhanced
inhibition in combination with cisplatin. Exp Biol Med (Maywood).
236:883–895. 2011. View Article : Google Scholar : PubMed/NCBI
|
|
45
|
Wright MH, Calcagno AM, Salcido CD,
Carlson MD, Ambudkar SV and Varticovski L: Brca1 breast
tumors contain distinct CD44+/CD24− and
CD133+ cells with cancer stem cell characteristics.
Breast Cancer Res. 10:R102008. View Article : Google Scholar
|
|
46
|
Sauvageot CM, Weatherbee JL, Kesari S, et
al: Efficacy of the HSP90 inhibitor 17-AAG in human glioma cell
lines and tumorigenic glioma stem cells. Neuro Oncol. 11:109–121.
2009. View Article : Google Scholar : PubMed/NCBI
|
|
47
|
Tatokoro M, Koga F, Yoshida S, et al:
Potential role of Hsp90 inhibitors in overcoming cisplatin
resistance of bladder cancer-initiating cells. Int J Cancer.
131:987–996. 2012. View Article : Google Scholar : PubMed/NCBI
|
|
48
|
Yip NC, Fombon IS, Liu P, et al:
Disulfiram modulated ROS-MAPK and NFκB pathways and targeted breast
cancer cells with cancer stem cell-like properties. Br J Cancer.
104:1564–1574. 2011.PubMed/NCBI
|