Introduction
Glioblastoma multiforme (GBM) is the most malignant
type of human glioma and has a poor prognosis. Despite advances in
diagnosis and treatment, the median survival rate of patients with
GBM remains ~15 months (1–3). GBM is one of the most intractable
types of refractory tumor. Surgery and radiotherapy have been the
predominant forms of therapy for GBM, however, the curative effect
is poor (4). Gene treatment offers
possible approaches in the treatment of GBM, however, it retains
shortcomings, including the lack of special target genes and
high-efficiency carriers (5). For
decades, how to treat GBM has remained a focus and difficulty in
investigations and clinical treatment.
There has been substantial progress in the use of
microarrays for investigating the molecular mechanisms of brain
gliomas. Microarrays are valuable for identifying the important
genes involved in the occurrence, development and targeted therapy
of gliomas (6). Microarrays have
been used to screen genes associated with GBM (3,7,8), and
bioinformatics analysis has revealed that these genes, screened
using a microarray, are closely associated with cell signal
transduction, cell metabolization, cytoskeleton and motility,
immunity, the cell cycle and apoptosis (7). However, the specific molecular
mechanisms underlying human GBM are not yet fully understood.
In the present study, the transcriptional profile of
GSE30563 was downloaded and the differentially expressed genes
(DEGs) between GBM and healthy brain tissues were identified. In
addition, a co-expression network of DEGs was constructed, and Gene
Ontology (GO) functional and Kyoto Encyclopedia of Genes and
Genomes (KEGG) pathway analyses were performed to identify the
target genes for the diagnosis and treatment of GBM. Finally, the
interactions between DEGs and transcription factors were assessed
for further evaluation at the molecular level. The findings of
these investigations may contribute to improvements in the
understanding and diagnosis of GBM, and the design of
target-specific drugs.
Materials and methods
Microarray data
The transcriptional profile of GSE30563 was
downloaded from Gene Expression Omnibus (GEO) (http://www.ncbi.nlm.nih.gov/geo/), which was
based on the platform of the Affymetrix Human Genome U133 Plus 2.0
array. This dataset (http://www.ncbi.nlm.nih.gov/geo/query/acc.cgi?acc=GSE30563)
was deposited by Lee et al (Ajou University School of
Medicine, Suwon, South Korea). To identify DEGs, human brain tumor
samples and normal brain samples were collected from patients with
a brain tumor, for subsequent RNA extraction and hybridization on
Affymetrix microarrays. A total of six genechips (GSM758396,
GSM758397, GSM758398, GSM758399, GSM758400 and GSM758401) were
available for further analysis, including three genechips of brain
tumor samples and three genechips of normal brain samples.
Data pre-processing and analysis of
differential expression
The probe-level data in the raw data files were
converted into expression measures, according to the function of
log2 (9). The expression values of
all the probes were matched to the genes and the empty probes were
reduced. The LIMMA package in R (http://www.bioconductor.org/packages/release/bioc/html/limma.html)
(10) was used to identify the
DEGs in the brain tumor samples compared with the healthy controls.
The present study selected a cut-off criteria of P≤0.01 and
|log2fold change|>1 to identify the DEGs.
Comparison of differential expression in
different samples
The expression values of the DEGs in each sample
were extracted from the expression value files, according to the
information of the probes corresponding to the DEGs. Based on these
expression values, the pheatmap package in R was used for
hierarchical clustering (11),
through Euclidean distance (12),
and a heat map was constructed.
Searching for the co-expression network
of DEGs
COXPRESdb (http://coxpresdb.hgc.jp) is a database of co-expressed
gene networks and can assist in elucidating the function and
regulation network of genes in a wide range of mammals (13). Based on the hypothesis that genes,
which are regulated by the same transcription factor, are
co-expressed, and that co-expressed genes may be associated in
function (14), the DEGs were
divided into either upregulated or downregulated genes, and
co-expression networks of the DEGs were constructed, using the
information obtained from COXPRESdb. The gene pairs with a
co-expression coefficient >0.6 were selected, and the network
was visualized using Cytoscape software (http://www.cytoscape.org/) (15).
GO and pathway analyses of the DEGs
The Database for Annotation, Visualization and
Integrated Discovery (DAVID) is a web-accessible program, which
clusters distinct genes by the pathways in which they are involved,
producing intuitive graphical summaries (16). The DEGs in the co-expression
networks in the present study were analyzed using DAVID to identify
which biological process the genes in the networks were involved
in. To circumvent the problem of multi-testing, which may induce
too many false positive results, the Benjamini and Hochberg method
(17) was used to adjust the raw
P-values into false discovery rate (FDR). FDR<0.05 was used as
the cut-off criterion. The DEGs were analyzed using KEGG, and the
biological pathways, which were mapped significantly by the DEGs
were identified (18,19).
Interactions between DEGs and
transcription factors
The gene sequence can inhibit or enhance the
expression of a gene by covalently binding to the transcription
factor DNA binding domain (20).
In the present study, based on text mining using PubChem Bioassay
neighboring analysis (http://pubchem.ncbi.nlm.nih.gov/) (21), the interactions between the genes
and transcription factors were extracted using the online tool,
EpiTect ChIP qPCR Primers (http://www.sabiosciences.com/chipqpcrsearch.php?app=TFBS).
Results
Screening for DEGs
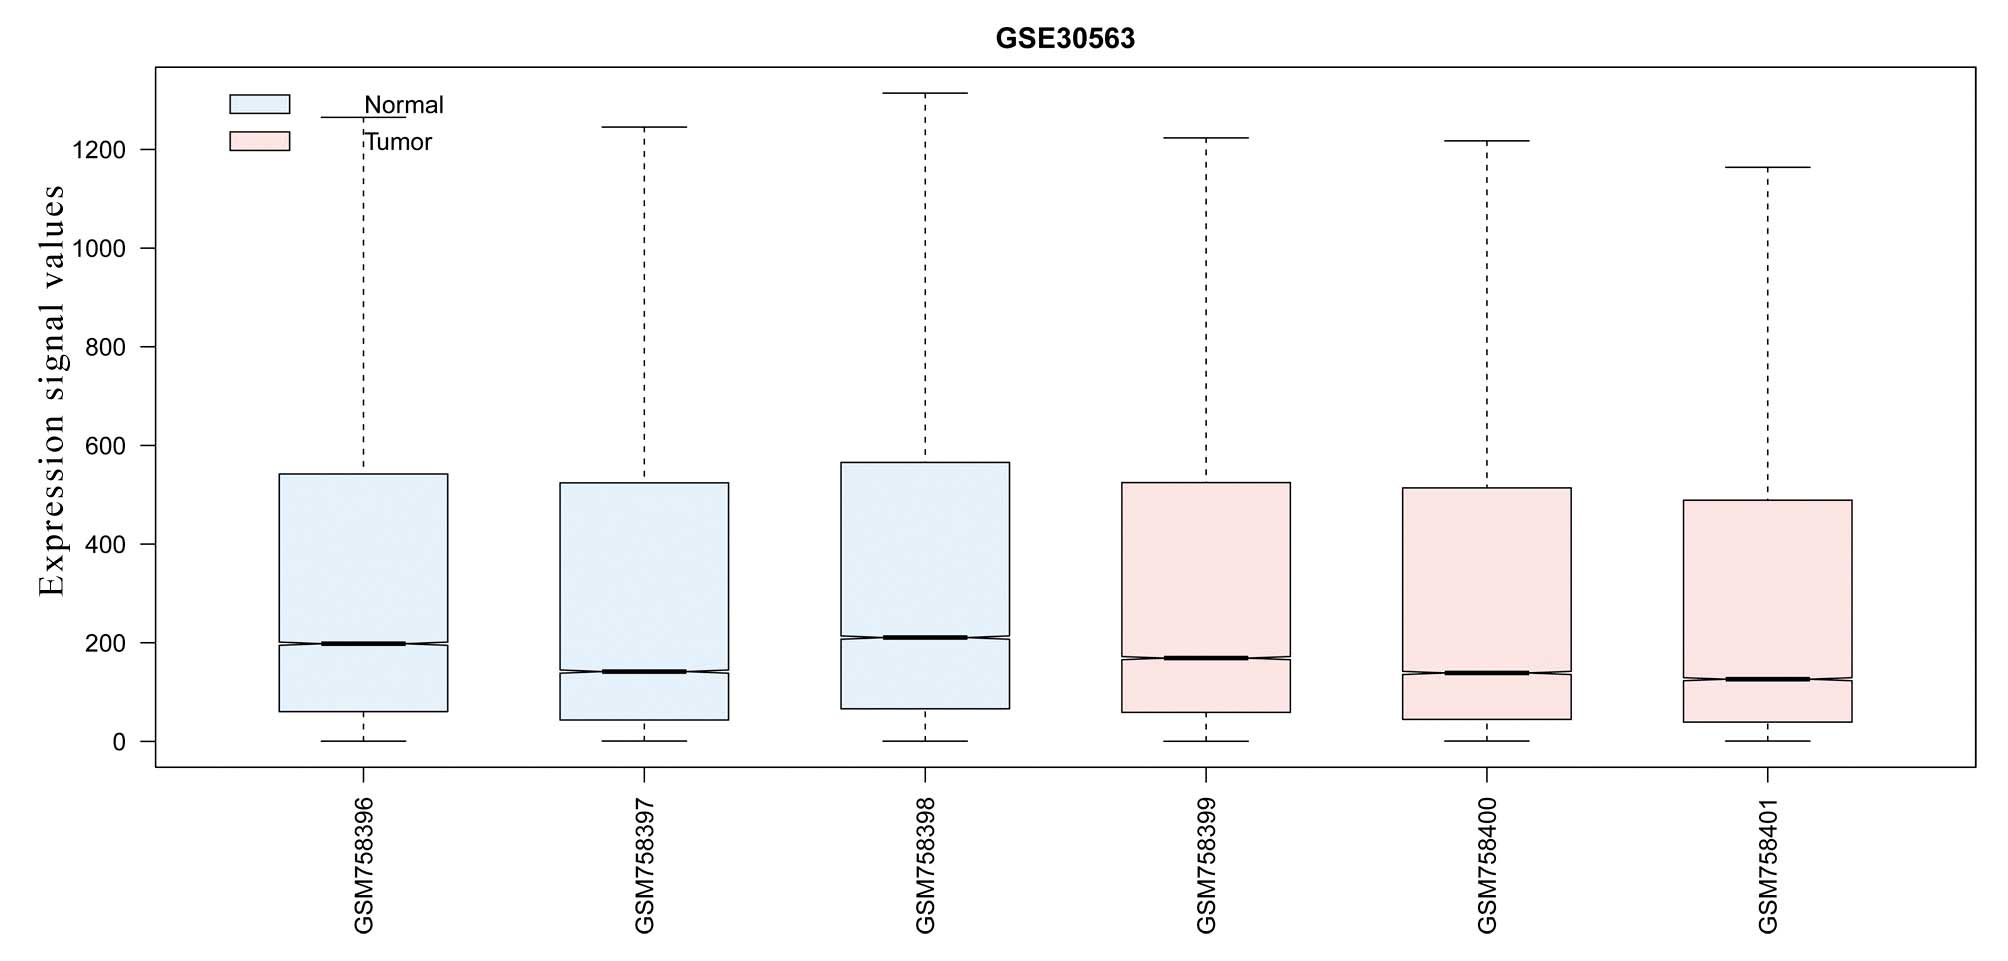
Following data preprocessing, the expression values
with high standardization were analyzed through comparison of the
differences (Fig. 1). A total of
1,006 DEGs, exhibiting a cut-off criteria P<0.01 and
|logFC|>1, were selected, including 638 downregulated and 368
upregu-lated DEGs.
Hierarchical clustering analysis of
DEGs
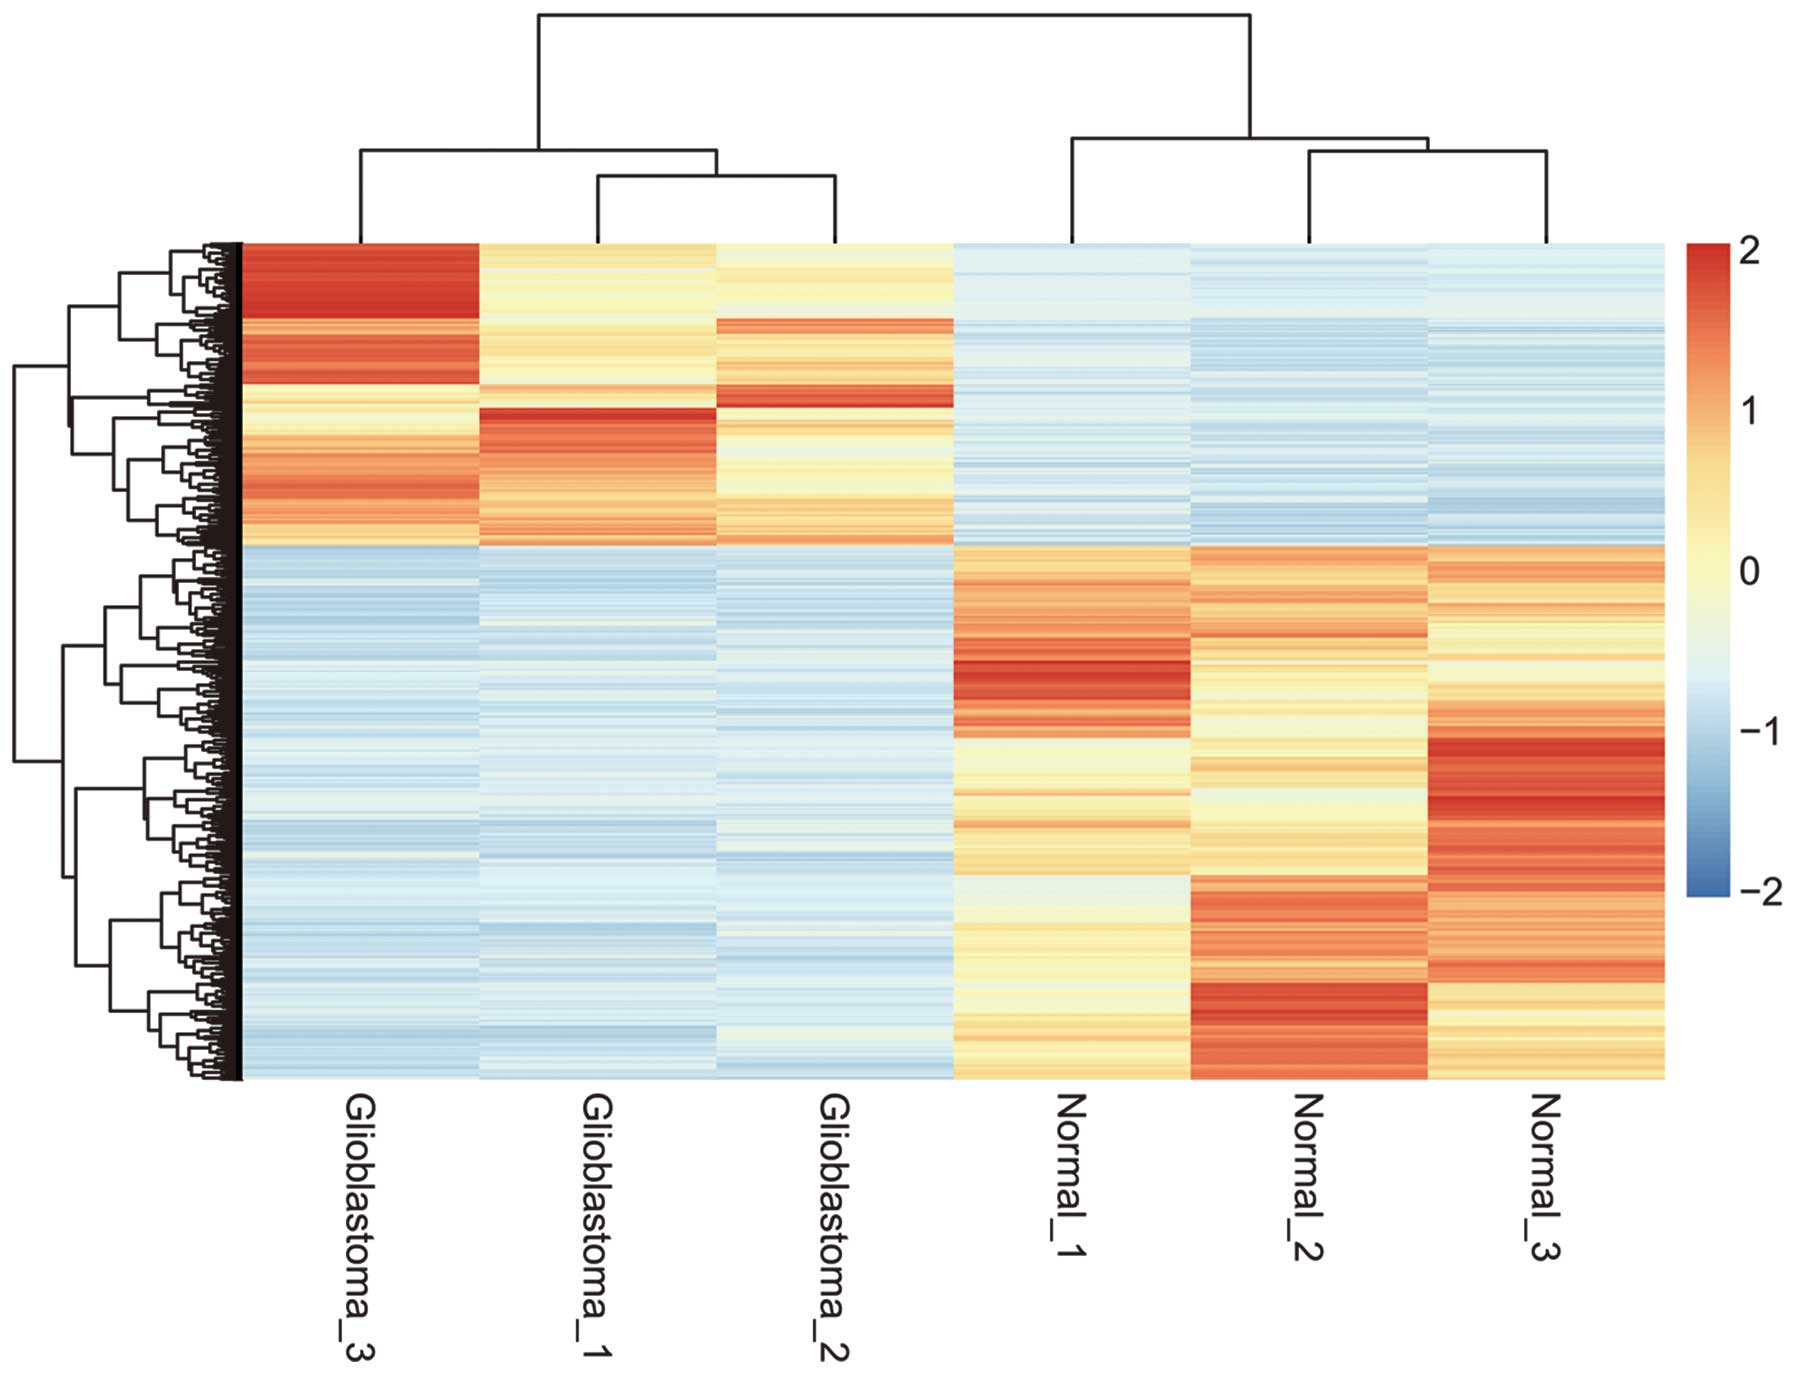
Hierarchical clustering revealed systematic
variations in the expression levels of genes between the brain
tumor samples and the healthy control samples (Fig. 2). The results revealed that these
differential probes were able to distinguish these two groups from
the whole samples.
Searching for the co-expression networks
of DEGs
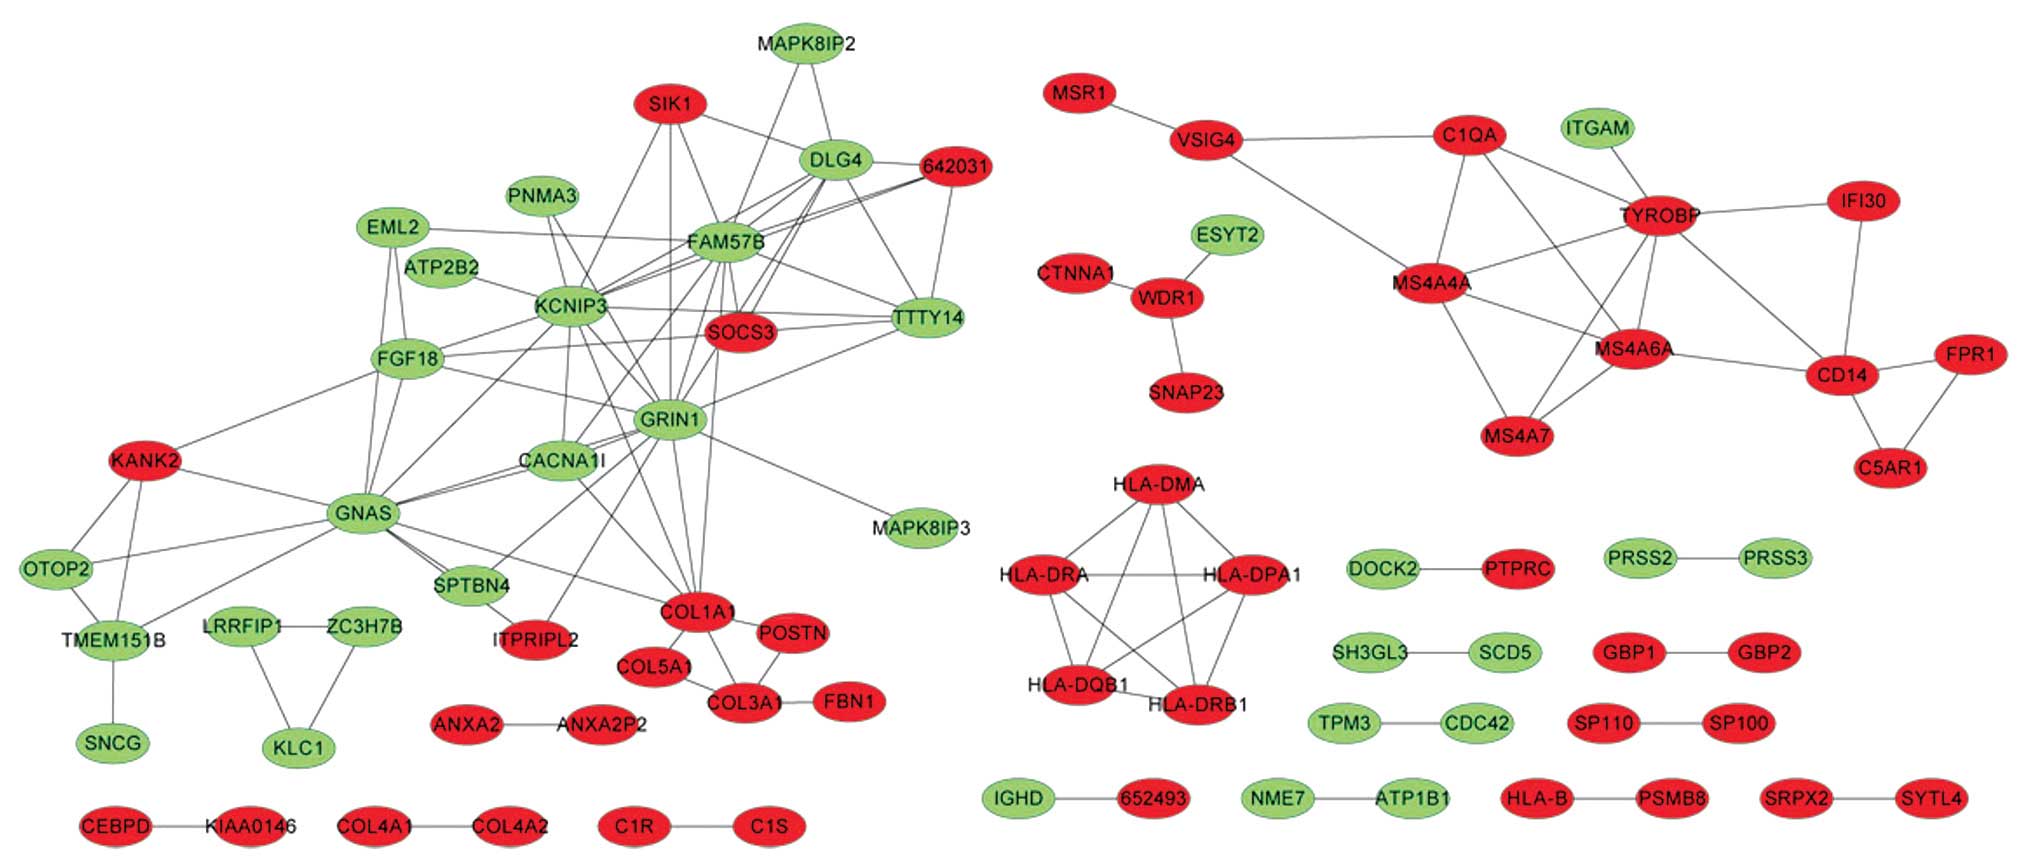
COXPRESdb was used to construct a co-expression
network of the resulting DEGs, following which a total of 113 gene
pairs with a co-expressed coefficient >0.6 were identified.
These were subsequently visualized using Cytoscape (Fig. 3) and, among them, the ANXA2 and
ANXA2P2 gene pairs were selected as exhibiting the highest
co-expression coefficient of 0.94.
GO functional and pathway analyses of the
DEGs
Based on the co-expression network, GO functional
enrichment analysis of the DEGs was performed using DAVID software,
with FDR<0.05. The results indicated that 59 DEGs were
significantly increased in seven GO terms (Table I). The most significant functional
term was associated with the immune response, and the genes
enriched in this term included major histocompatibility complex
(MHC) class II, DQβ1 (HLA-DQB1), MHC class II, DRβ1 (HLA-DRB1), MHC
class IB (HLA-B), MHC class II, DMα (HLA-DMA), MHC class II, DPα1
(HLA-DPA1) and MHC class II, DRα (HLA-DRA). The KEGG pathway
analysis identified six pathways (Table II), which had an FDR<0.05. The
most significant pathway was associated with allograft rejection,
and the genes enriched in this pathway were HLA-DQB1, HLA-DRB1,
HLA-DPA1, HLA-B, HLA-DMA and HLA-DRA.
 | Table IResults of GO functional enrichment
analysis for differentially expressed genes. |
Table I
Results of GO functional enrichment
analysis for differentially expressed genes.
| Term | Name | Count | FDR |
|---|
| GO:0006955 | Immune response | 18 |
9.03E−06 |
| GO:0019882 | Antigen processing
and presentation | 8 |
1.33E−04 |
| GO:0002504 | Polysaccharide
antigen via MHC class II | 6 |
5.35E−04 |
| GO:0030198 | Extracellular matrix
organization | 7 | 0.011087 |
| GO:0030199 | Collagen fibril
organization | 5 | 0.012866 |
| GO:0043062 | Extracellular
structure organization | 8 | 0.012897 |
| GO:0002252 | Immune effector
process | 7 | 0.04723 |
| Table IIResults of differentially expressed
genes in KEGG pathway enrichment analysis. |
Table II
Results of differentially expressed
genes in KEGG pathway enrichment analysis.
| Term | KEGG | FDR |
|---|
| hsa05330 | Allograft
rejection | 0.008554 |
| hsa05322 | Systemic lupus
erythematosus | 0.011522 |
| hsa05332 | Graft-versus-host
disease | 0.012834 |
| hsa04940 | Type I diabetes
mellitus | 0.018628 |
| hsa04612 | Antigen processing
and presentation | 0.046172 |
| hsa05320 | Autoimmune thyroid
disease | 0.048764 |
Transcription factors of important
DEGs
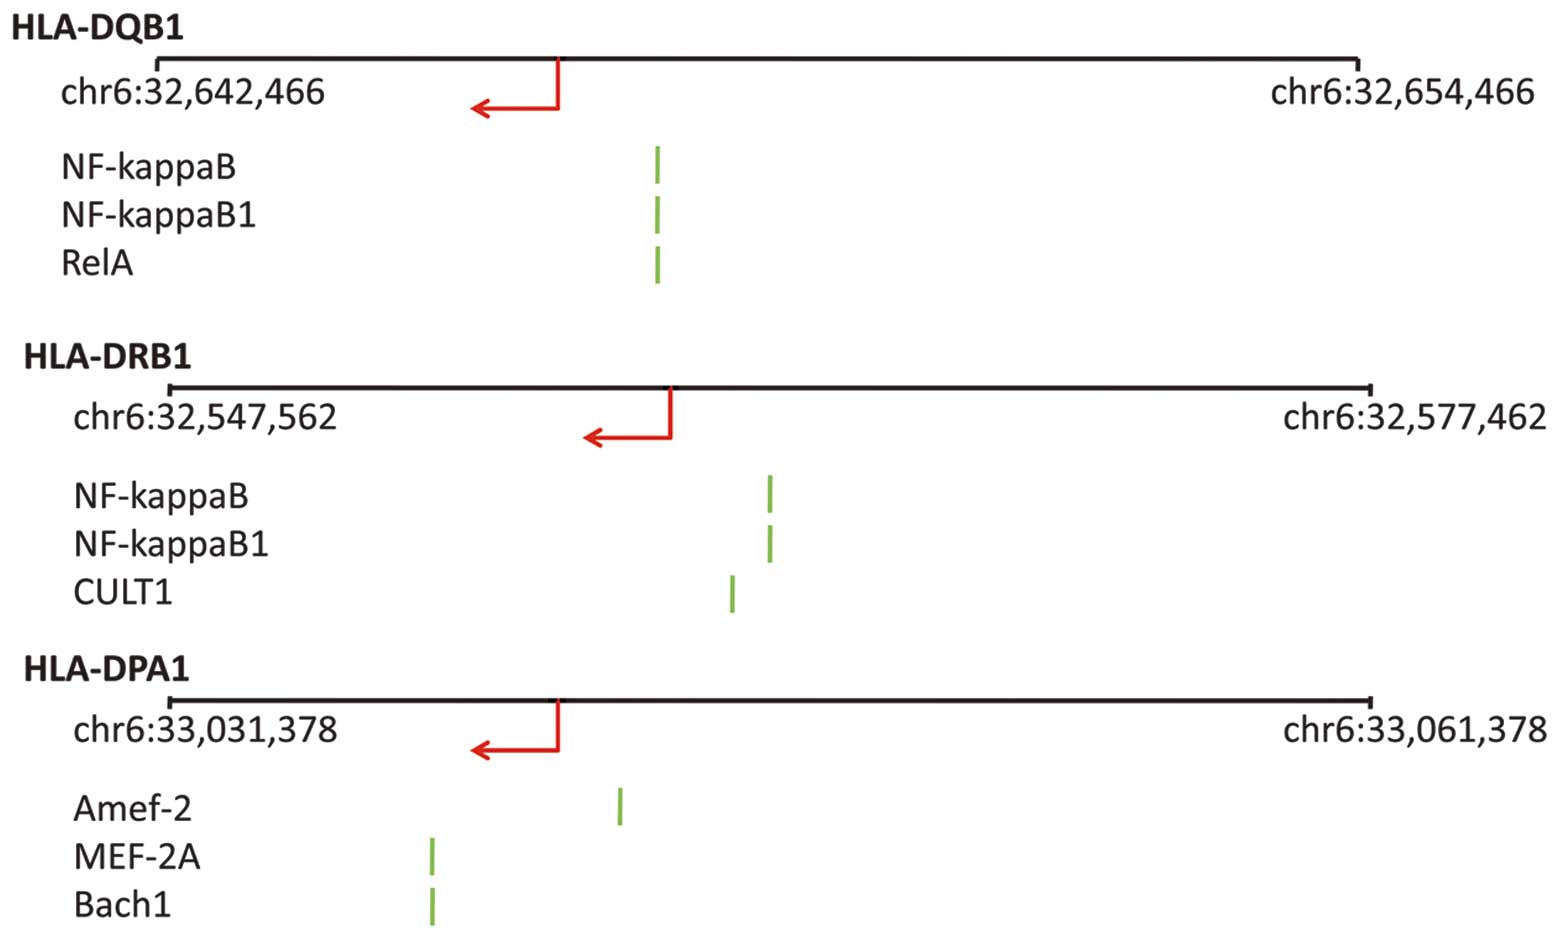
Based on the comparison of the most significant
biological process and KEGG pathway, six genes, including HLA-DQB1,
HLA-DRB1, HLA-DPA1, HLA-B, HLA-DMA and HLA-DRA, were differentially
expressed in two lists at the same time, located on the short arm
of chromosome 6 (Fig. 4). A total
of 17 transcription factors, including nuclear factor (NF)-κB,
NF-κB1 and their binding sites, were identified with these six
important DEGs.
Discussion
GBM is one of the most frequent types of human brain
cancer and it develops from either a lower grade astrocytic tumor
or primary GBM (22). However,
neither chemotherapy nor radiotherapy have been effective in
treating this type of cancer (23). Biochip technology has emerged as an
efficient, rapid and multi-parameter technology, which provides a
useful strategy for diagnosis, classification and therapy against
the development of human GBM.
The present study identified 1,006 DEGs, including
638 upregulated and 368 downregulated DEGs, from the gene
expression profile of GSE30563. Following this, a co-expression
network of DEGs was constructed and GO functional and KEGG pathway
analyses were performed. Functional analysis of the DEGs
demonstrated a close correlation with the immune response.
Additionally, allograft rejection was the most significantly
enriched pathway, and the genes involved in these processes were
HLA-DQB1, HLA-DRB1, HLA-DPA1, HLA-B, HLA-DMA and HLA-DRA.
These genes belong to the human leukocyte antigen
(HLA) gene family. The HLA genes encode numerous molecules,
including HLA class I and II, and are known to be associated with
the majority of autoimmune diseases (24). Human HLA molecules are important in
eliminating tumor cells with cellular and humoral immunity
(25,26). The HLA-DRA, HLA-DRB1, HLA-DQB1,
HLA-DPA1 genes belong to the HLA class II β chain paralogs. They
bind peptides derived from antigens, which access the endocytic
route of antigen presenting cells (APCs) and present them on the
cell surface for recognition by CD4 T-cells (27). The HLA-DMA gene belongs to the HLA
class II α chain paralogues. It is involved in the peptide loading
of MHC class II molecules, by assisting in the release of the class
II-associated invariant chain peptide molecule from the peptide
binding site (28). The HLA-B gene
belongs to the HLA class I heavy chain paralogues. Class I
molecules are important in the immune system by presenting peptides
derived from the endoplasmic reticulum lumen (29). GBM function profoundly impairs the
immune response by inhibiting the proliferation and activation of
T-cells, inducing regulator T-cells and triggering apoptosis
(30). In addition, it has been
reported that the expression of HLA is positively associated with
patients with GBM. For example, compared with the control
population, HLA-B*27 exhibits a 2.7-fold increase and
HLA-DRB1*15 exhibits a 2.2-fold increase in the risk of
glioma occurrence (31),
suggesting that the HLA family may be used as a specific
therapeutic molecular target in the treatment of GBM.
Allograft rejection includes a coordinated response
of the innate and adaptive immune systems of the host (32). The mechanism for allograft
rejection in the immune response may be similar to this (33), in that the innate immune system is
involved in the early phase of the allograft response by chemokines
and cell adhesion, which are essential for leukocyte migration into
the graft and T-cell trafficking between lymph nodes and the
transplant. The T cells and other cells from the innate immune
system act synergistically to reject the allograft through
nonexclusive pathways, including the cytotoxicity of
contact-dependent T cells, the activation of granulocyte and
natural killer cells and the production of alloantibody. GBM is
closely associated with the immune response, suggesting that
allograft rejection is possibly involved in the processes of GBM.
However, further investigations are required to confirm this
hypothesis.
In conclusion, the present study demonstrated that
HLA-DQB1, HLA-DRB1, HLA-DPA1, HLA-B, HLA-DMA, HLA-DRA are
associated with GBM. In addition, the pathogenesis of GBM was
closely associated with the immune response and pathways, including
allograft rejection. These findings may offer novel targets for the
diagnosis and treatment of GBM.
Acknowledgments
The authors would like to thank to all the authors
who contributed to this study.
References
|
1
|
Buckner JC: Factors influencing survival
in high-grade gliomas. Seminars in oncology. Elsevier; pp. 10–14.
2003, View Article : Google Scholar
|
|
2
|
Dubrow R, Darefsky AS, Jacobs DI, et al:
Time trends in glioblastoma multiforme survival: the role of
temozolomide. Neuro Oncol. 15:1750–1761. 2013. View Article : Google Scholar : PubMed/NCBI
|
|
3
|
Liu Z, Niu Y, Xie M, Bu Y, Yao Z and Gao
C: Gene expression profiling analysis reveals that DLG3 is
down-regulated in glioblastoma. J Neurooncol. 116:465–476. 2014.
View Article : Google Scholar : PubMed/NCBI
|
|
4
|
Saggioro FP, Neder L, Stávale JN, et al:
Fas, FasL and cleaved caspases 8 and 3 in glioblastomas: a tissue
microarray-based study. Pathol Res Pract. 210:267–273. 2014.
View Article : Google Scholar : PubMed/NCBI
|
|
5
|
Aghi M and Chiocca EA: Gene therapy for
glioblastoma. Neurosurg Focus. 20:E18. 2006.PubMed/NCBI
|
|
6
|
Mischel PS, Cloughesy TF and Nelson SF:
DNA-microarray analysis of brain cancer: molecular classification
for therapy. Nat Rev Neurosci. 5:782–792. 2004. View Article : Google Scholar : PubMed/NCBI
|
|
7
|
Chen JX, Lu YC, Luo C, et al: Expression
and function of differentially expressed genes in glioblastoma by
using cDNA microarray. AJSMMU. 25:498–502. 2004.
|
|
8
|
Zhao Z, Lu Y, Chen J, Hou L-j, Hu G-h and
Luo C: Using Bioinformatics Method to Investigate the Genes Related
to Chemosensitivity in Human Glioblastoma. Prog Mod Biomed.
19:0032011.
|
|
9
|
Fujita A, Sato JR, Rodrigues LO, Ferreira
CE and Sogayar MC: Evaluating different methods of microarray data
normalization. BMC Bioinformatics. 7:4692006. View Article : Google Scholar : PubMed/NCBI
|
|
10
|
Gentleman R, Carey V, Huber W, Irizarry RA
and Dudoit S: Bioinformatics and computational biology solutions
using R and Bioconductor. Springe. 2005. View Article : Google Scholar
|
|
11
|
Szekely GJ and Rizzo ML: Hierarchical
clustering via joint between-within distances: Extending Ward’s
minimum variance method. J Classif. 22:151–183. 2005. View Article : Google Scholar
|
|
12
|
Deza MM and Deza E: Encyclopedia of
distances. Springer; 2009, View Article : Google Scholar
|
|
13
|
Obayashi T, Hayashi S, Shibaoka M, Saeki
M, Ohta H and Kinoshita K: COXPRESdb: a database of coexpressed
gene networks in mammals. Nucleic Acids Res. 36:D77–D82. 2008.
View Article : Google Scholar :
|
|
14
|
Janaki C and Joshi RR: Motif detection in
Arabidopsis: Correlation with gene expression data. In Silico Biol.
4:149–161. 2004.PubMed/NCBI
|
|
15
|
Smoot ME, Ono K, Ruscheinski J, Wang PL
and Ideker T: Cytoscape 2.8: new features for data integration and
network visualization. Bioinformatics. 27:431–432. 2011. View Article : Google Scholar :
|
|
16
|
Huang da W, Sherman BT and Lempicki RA:
Systematic and integrative analysis of large gene lists using DAVID
bioinfor-matics resources. Nat Protoc. 4:44–57. 2009. View Article : Google Scholar
|
|
17
|
Dudoit S, Shaffer JP and Boldrick JC:
Multiple hypothesis testing in microarray experiments. Stat Sci.
18:71–103. 2003. View Article : Google Scholar
|
|
18
|
Kanehisa M, Goto S, Hattori M, et al: From
genomics to chemical genomics: new developments in KEGG. Nucleic
Acids Res. 34:D354–D357. 2006. View Article : Google Scholar :
|
|
19
|
Kanehisa M, Goto S, Kawashima S, Okuno Y
and Hattori M: The KEGG resource for deciphering the genome.
Nucleic Acids Res. 32:D277–D280. 2004. View Article : Google Scholar :
|
|
20
|
Stower H: Gene regulation: Resolving
transcription factor binding. Nat Rev Genet. 13:71. 2011.PubMed/NCBI
|
|
21
|
Han L, Suzek TO, Wang Y and Bryant SH: The
text-mining based PubChem bioassay neighboring analysis. BMC
Bioinformatics. 11:5492010. View Article : Google Scholar : PubMed/NCBI
|
|
22
|
Ohgaki H and Kleihues P: Epidemiology and
etiology of gliomas. Acta Neuropathol. 109:93–108. 2005. View Article : Google Scholar : PubMed/NCBI
|
|
23
|
Wechsler-Reya R and Scott MP: The
developmental biology of brain tumors. Annu Rev Neurosci.
24:385–428. 2001. View Article : Google Scholar : PubMed/NCBI
|
|
24
|
Shiina T, Inoko H and Kulski J: An update
of the HLA genomic region, locus information and disease
associations: 2004. Tissue Antigens. 64:631–649. 2004. View Article : Google Scholar : PubMed/NCBI
|
|
25
|
Jäger E, Chen YT, Drijfhout JW, et al:
Simultaneous humoral and cellular immune response against
cancer-testis antigen NY-ESO-1: Definition of human
histocompatibility leukocyte antigen (HLA)-A2-binding peptide
epitopes. J Exp Med. 187:265–270. 1998. View Article : Google Scholar : PubMed/NCBI
|
|
26
|
Palucka K, Ueno H and Banchereau J: Recent
developments in cancer vaccines. J Immunol. 186:1325–1331. 2011.
View Article : Google Scholar : PubMed/NCBI
|
|
27
|
Neefjes J, Jongsma ML, Paul P and Bakke O:
Towards a systems understanding of MHC class I and MHC class II
antigen presentation. Nat Rev Immunol. 11:823–836. 2011.PubMed/NCBI
|
|
28
|
Boudjema A, Petit-Teixeira E, Cornelis F
and Benhamamouch S: HLA-DMA and DMB genes in rheumatoid arthritis.
Tissue Antigens. 79:155–156. 2012. View Article : Google Scholar : PubMed/NCBI
|
|
29
|
Kiepiela P, Leslie AJ, Honeyborne I, et
al: Dominant influence of HLA-B in mediating the potential
co-evolution of HIV and HLA. Nature. 432:769–775. 2004. View Article : Google Scholar : PubMed/NCBI
|
|
30
|
Wei J, Barr J, Kong LY, et al:
Glioma-associated cancer-initiating cells induce immunosuppression.
Clin Cancer Res. 16:461–473. 2010. View Article : Google Scholar : PubMed/NCBI
|
|
31
|
Machulla HK, Steinborn F, Schaaf A,
Heidecke V and Rainov NG: Brain glioma and human leukocyte antigens
(HLA)-is there an association. J Neurooncol. 52:253–261. 2001.
View Article : Google Scholar : PubMed/NCBI
|
|
32
|
Moreau A, Varey E, Anegon I and Cuturi MC:
Effector mechanisms of rejection. Cold Spring Harb Perspect Med.
3:a0154612013. View Article : Google Scholar : PubMed/NCBI
|
|
33
|
Le Moine A, Goldman M and Abramowicz D:
Multiple pathways to allograft rejection. Transplantation.
73:1373–1381. 2002. View Article : Google Scholar : PubMed/NCBI
|