Introduction
Plectranthus excisus and other tea-leaves of
the Labiatae family are Isodons, which are widely distributed
throughout northeast China. Diterpenoids, which are a typical
component of Isodons, exhibit antitumor, antibacterial,
anti-inflammatory and antioxidant effects, and provide
cardiovascular protection (1–4).
Diterpenoid B (DB) is synthesized by Plectranthus excisus.
Previous studies have demonstrated that a number of Isodons contain
extractable diterpenoids. In China, Isodon plants are currently
used as raw materials to produce medicines, including tablet-based
rubescens and anticancer drugs (5,6).
This present study aimed to provide a theoretical basis for the
development of caudate lobe Isodon plants, and investigate whether
DB is able to inhibit the proliferation and progression of
melanoma. This was with the aim to establish a theoretical basis
for the anti-tumor effect of traditional Chinese medicine.
Materials and methods
Reagents
The DB used in the present study was obtained from
China-Japan Union Hospital chemical laboratory and
3-(4,5-dimethylthiazol-2-yl)-2,5-diphenyltetrazolium bromide (MTT)
was purchased from Sigma-Aldrich (St. Louis, MO, USA). RPMI-1640
medium was purchased from Gibco Life Technologies (Carlsbad, CA,
USA) and fetal bovine serum was purchased from HyClone Corp.
(Logan, UT, USA). The following antibodies were purchased from
Santa Cruz Biotechnology, Inc. (Dallas, TX, USA): Rabbit polyclonal
cyclin-dependent kinase 2 (Cdk2; sc-163; 1:200), mouse monoclonal
transformation related protein 53 (p53; sc-126; 1:200), rabbit
polyclonal cyclin-dependent kinase inhibitor 1A (p21; sc-397;
1:200) and rabbit polyclonal checkpoint kinase 1 (Chk1; sc-7898;
1:200). Goat anti-mouse (sc-2005) and anti-rabbit (sc-2054)
immunoglobulin G horseradish peroxidase-conjugated secondary
antibodies were used (1:1,000; Santa Cruz Biotechnology, Inc.). The
anti-β-actin antibody was purchased from Promega Corporation
(Madison, WI, USA).
Cell culture
The B16 mouse melanoma cell line was maintained in
RPMI-1640 medium, containing 10% fetal bovine serum, in an
incubator with 5% CO2 at 37°C. Trypsin (0.25%) was used
to digest the cells.
MTT assay
B16 cells in the logarithmic growth phase were
seeded into 96-well plates at ~5×10⁴ cells/ml. Following
incubation for 24 h at 37°C, the cells were exposed to 0.5, 1.0,
2.0, 4.0, 8.0, 16.0 and 32.0 µg/ml of DB (the experimental
groups) or remained untreated (control), with four wells for each
group. The cells were further divided into 24 and 48 h treatment
groups. Every 24 h, MTT (20 µl of a 5 µg/ml solution)
was added to the wells containing the cultured cells, which were
then incubated for 4 h. Following incubation at 37°C, the culture
medium was removed and 150 µl dimethyl sulfoxide was added.
The absorbance (A) was measured using a microplate reader (Bio-Rad
550; Bio-Rad Laboratories, Inc., Hercules, CA, USA) at 490 nm, and
the rate of the inhibition of cell growth was calculated using the
following formula: Cell growth inhibition rate (%) = (1 −
Aexperimental group / Acontrol group) × 100.
Analysis of cell morphology
B16 cells in the logarithmic growth phase were
digested with trypsin and seeded into 96-well plates with 100
µl/well suspension containing ~5×10⁴ cells/ml.
Following culture for 24 h, the media was discarded. The doses of
DB and the incubation durations were as described for the MTT assay
above. The morphology of the cells was observed using an inverted
phase contrast microscope (BX41-PHD-P11; Olympus, Numazu-shi,
Japan).
Reverse transcription-quantitative
polymerase chain reaction (RT-qPCR)
The mRNA expression was measured in the B16 cells in
the logarithmic growth phase following treatment with DB (0.5, 1.0
and 2.0 µg/ml) for 24 or 48 h. The cells were digested with
0.25% trypsin and pelleted by centrifugation at 2,000 × g for 5 min
at 37°C. The total RNA was extracted with TRIzol (Invitrogen Life
Technologies, Carlsbad, CA, USA) and the concentration and purity
of the RNA samples were determined by measuring the A260 and A280
optical density values using an ultraviolet (UV) spectrophotometer
(UV-2401PC; Bayer AG, Leverkusen, Germany). The cDNA (100 ng) was
obtained by RT of 1 µg mRNA with SMART® MMLV
Reverse Transcriptase (639523; Takara Bio, Inc., Otsu, Japan). The
PCR kit used was 2XEasyTaq PCR SuperMix (AS111-02; Beijing TransGen
Biotech Co., Ltd., Beijing, China). The primer sequences, which
were obtained from Sangon Biotech, Co., Ltd. (Shanghai, China),
were as follows: p53, upstream 5′-CATGGACGATCTGTTGCTG-3′ and
downstream 5′-TCGGGTGGCTCATAAGGT-3′; p21, upstream
5′-AGCTCAATGGACTGGAAGGG-3′ and downstream
5′-GAGCTGGAAGGTGTTTGGGG-3′; Cdk2, upstream
5′-GTTGACGGGAGAAGTTGTGG-3′ and downstream
5′-GAAGGACACGGTGAGAATGG-3′; Chk1, upstream
5′-CTTTGGGAGAAGGTGCCTAT-3′ and downstream 5′-ATGCCGAAATACCGTTGC-3′.
β-actin was used as an internal control to assess the quality of
the cDNA templates. The sequences of the β-actin primers were as
follows: Upstream 5′-GTAAAGACCTCTATGCCAACACA-3′ and downstream
5′-GGACTCATCGTACTCCTGCTTG-3′. The sizes of the amplified fragments
for p53, p21, Cdk2, Chk1 and β-actin were 543, 485, 302, 431 and
226 bp, respectively. The conditions used for qPCR of the p53, p21,
Cdk2, and Chk1 genes were as follows: 95°C for 5 min; 30 cycles of
94°C for 30 sec, 55°C for 30 sec, 72°C for 45 sec and 72°C for 5
min. The qPCR products were visualized using a camera and a digital
gel imaging system (GIS; Tanon 2500R; Tanon Science &
Technology Co., Ltd., Shanghai, China). GIS was used to determine
the grayscale values of the electrophoretic bands for p53, p21,
Cdk2 and Chk1. The expression levels of these genes were expressed
as a relative ratio of mRNA against the mRNA of β-actin.
Western blotting
Western blotting was used to determine the protein
expression levels in the B16 cells in the logarithmic growth phase
following exposure to DB (0.5, 1.0 or 2.0 µg/ml) for 24 or
48 h. Following treatment with DB, the cells were washed with
phosphate-buffered saline (PBS) and centrifuged at 2,000 × g for 5
min. Following centrifugation, protein homogenization buffer (100
µl), β-mercaptoethanol (1.2 µl) and 200 mmol/l
phenylmethylsulfonyl fluoride (0.3 µl) were added to the
resuspended cells. The cells were ruptured using an ultrasonic
homogenizer, and the protein concentrations were determined using a
microplate reader. Protein (40 µg) from each sample was
electrophoresed and the proteins were transferred from the 12%
SDS-PAGE gel (Beijing Solarbio Science & Technology Co., Ltd.,
Shanghai, China) onto a polyvinylidene fluoride membrane (EMD
Millipore, Billerica, MA, USA). The membranes were blocked with 5%
non-fat milk prior to being incubated at 4°C overnight with
antibodies directed against p53, p21, Cdk2 and Chk1. Following
incubation with secondary antibodies for 1 h at room temperature,
the membranes were processed and analyzed. The expression levels of
p53, p21, Cdk2 and Chk1 were quantified using a color image
analysis system (Tanon 4100; Tanon Science & Technology Co.,
Ltd.).
Flow cytometry
The B16 cells were incubated with DB for 24 or 48 h,
digested with EDTA (Sangon Biotech, Co., Ltd.), harvested and
incubated in 70% ethanol at 4°C for 24 h. A total of
~1×10⁶ cells were resuspended in 100 µl PBS.
Subsequently, 5 µl propidium iodide (PI) was added and the
cells were incubated in PI for 30 min at room temperature in the
dark. The cell cycle status was then assessed using flow cytometry
(FACSCalibur; BD Biosciences, San Jose, CA, USA).
Statistical analysis
The data are expressed as the mean ± standard
deviation. One-way analysis of variance was used to determine
whether differences were present between the groups. All analyses
were performed using SPSS 11.5 statistical software (SPSS, Inc.,
Chicago, IL, USA). P<0.05 was considered to indicate a
statistically significant difference.
Results
Effects of DB treatment on the
proliferation of B16 cells
The effects of different concentrations of DB on the
B16 cells was determined by incubating the cells with DB for 24 or
48 h. The results of this analysis are presented in Tables I and II, and Fig.
1. Following 24 or 48 h treatment with DB, proliferation was
significantly more inhibited in the cells treated with 0.5
µg/m, compared with the cells of the control groups (24 h,
P<0.05; 48 h, P<0.01). Following 24 h exposure to DB, the
proliferation of the cells treated with 0.5, 1.0, 2.0, 4.0, 8.0,
16.0 and 32.0 µg/ml were inhibited by 11.06, 24.95, 39.23,
63.28, 68.90, 78.54 and 79.87%, respectively (Table I). Following 48 h exposure to DB,
the proliferation of cells treated with 0.5, 1.0, 2.0, 4.0 and 8.0
µg/ml groups were inhibited by 38.53, 51.87, 68.32, 80.84
and 86.11%, respectively (Table
II). These findings indicated that inhibition of the
proliferation of B16 cells by DB is time- and dose-dependent
(Tables I and II).
 | Table IInhibition of the proliferation of B16
cells following treatment with DB for 24 h. |
Table I
Inhibition of the proliferation of B16
cells following treatment with DB for 24 h.
| DM (µg/ml) | OD value | Inhibitory rate
(%) |
|---|
| 0 (control) | 0.637±0.038 | 0 |
| 0.5 | 0.567±0.042 | 11.06a |
| 1.0 | 0.478±0.013 | 24.95b |
| 2.0 | 0.387±0.047 | 39.23b |
| 4.0 | 0.234±0.037 | 63.28b |
| 8.0 | 0.198±0.027 | 68.90b |
| 16.0 | 0.137±0.011 | 78.54b |
| 32.0 | 0.128±0.012 | 79.87b |
| Table IIInhibition of the proliferation of B16
cells treated with DB for 48 h. |
Table II
Inhibition of the proliferation of B16
cells treated with DB for 48 h.
| DM (µg/ml) | OD value | Inhibitory rate
(%) |
|---|
| 0 (control) | 1.0245±0.100 | 0 |
| 0.5 | 0.630±0.051 | 38.53a |
| 1.0 | 0.493±0.021 | 51.87a |
| 2.0 | 0.325±0.010 | 68.32a |
| 4.0 | 0.196±0.021 | 80.84a |
| 8.0 | 0.142±0.004 | 86.11a |
| 16.0 | 0.140±0.019 | 86.35a |
| 32.0 | 0.137±0.010 | 86.60a |
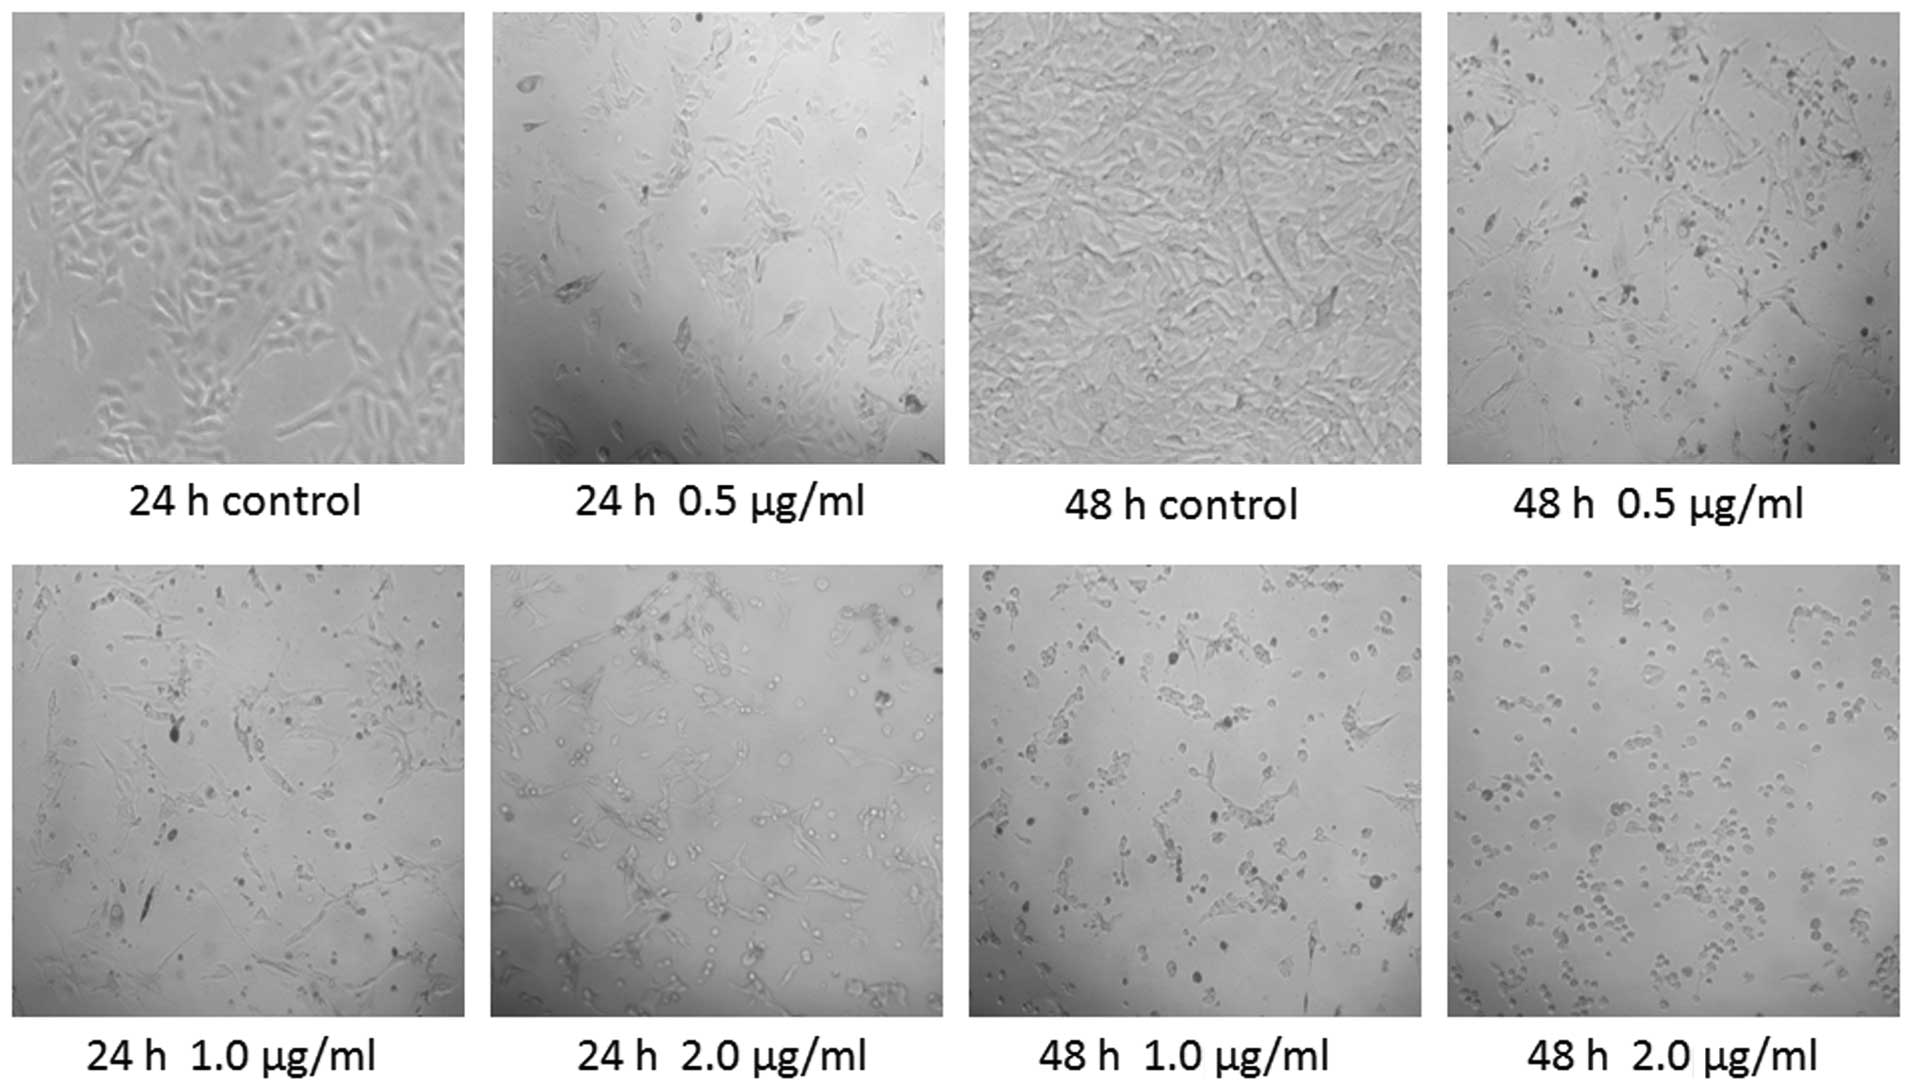
Effects of treatment with DB on the
morphology of B16 cells
The B16 cells were incubated with different doses of
DB, following which their morphology was assessed using an inverted
phase contrast microscope. The results revealed that the adherent
control cells grew well and were transparent, with good refractive
indices and smooth, clear boundaries. In addition, proliferation of
the control cells was robust. The effects of treatment with DB on
cell morphology manifested slowly. A small number of cells became
round and smaller in size following treatment with 1 µg/ml
DB for 24 h, and a number of dead, floating cells were observed.
Pronounced changes in cell morphology were increasingly apparent
with increased doses of DB. Following treatment with 2 µg/ml
DB for 48 h, a marked increase in cell death was observed. The
viable cells lost their shape and their surfaces were no longer
smooth. Visible cell debris was also present (Fig. 1).
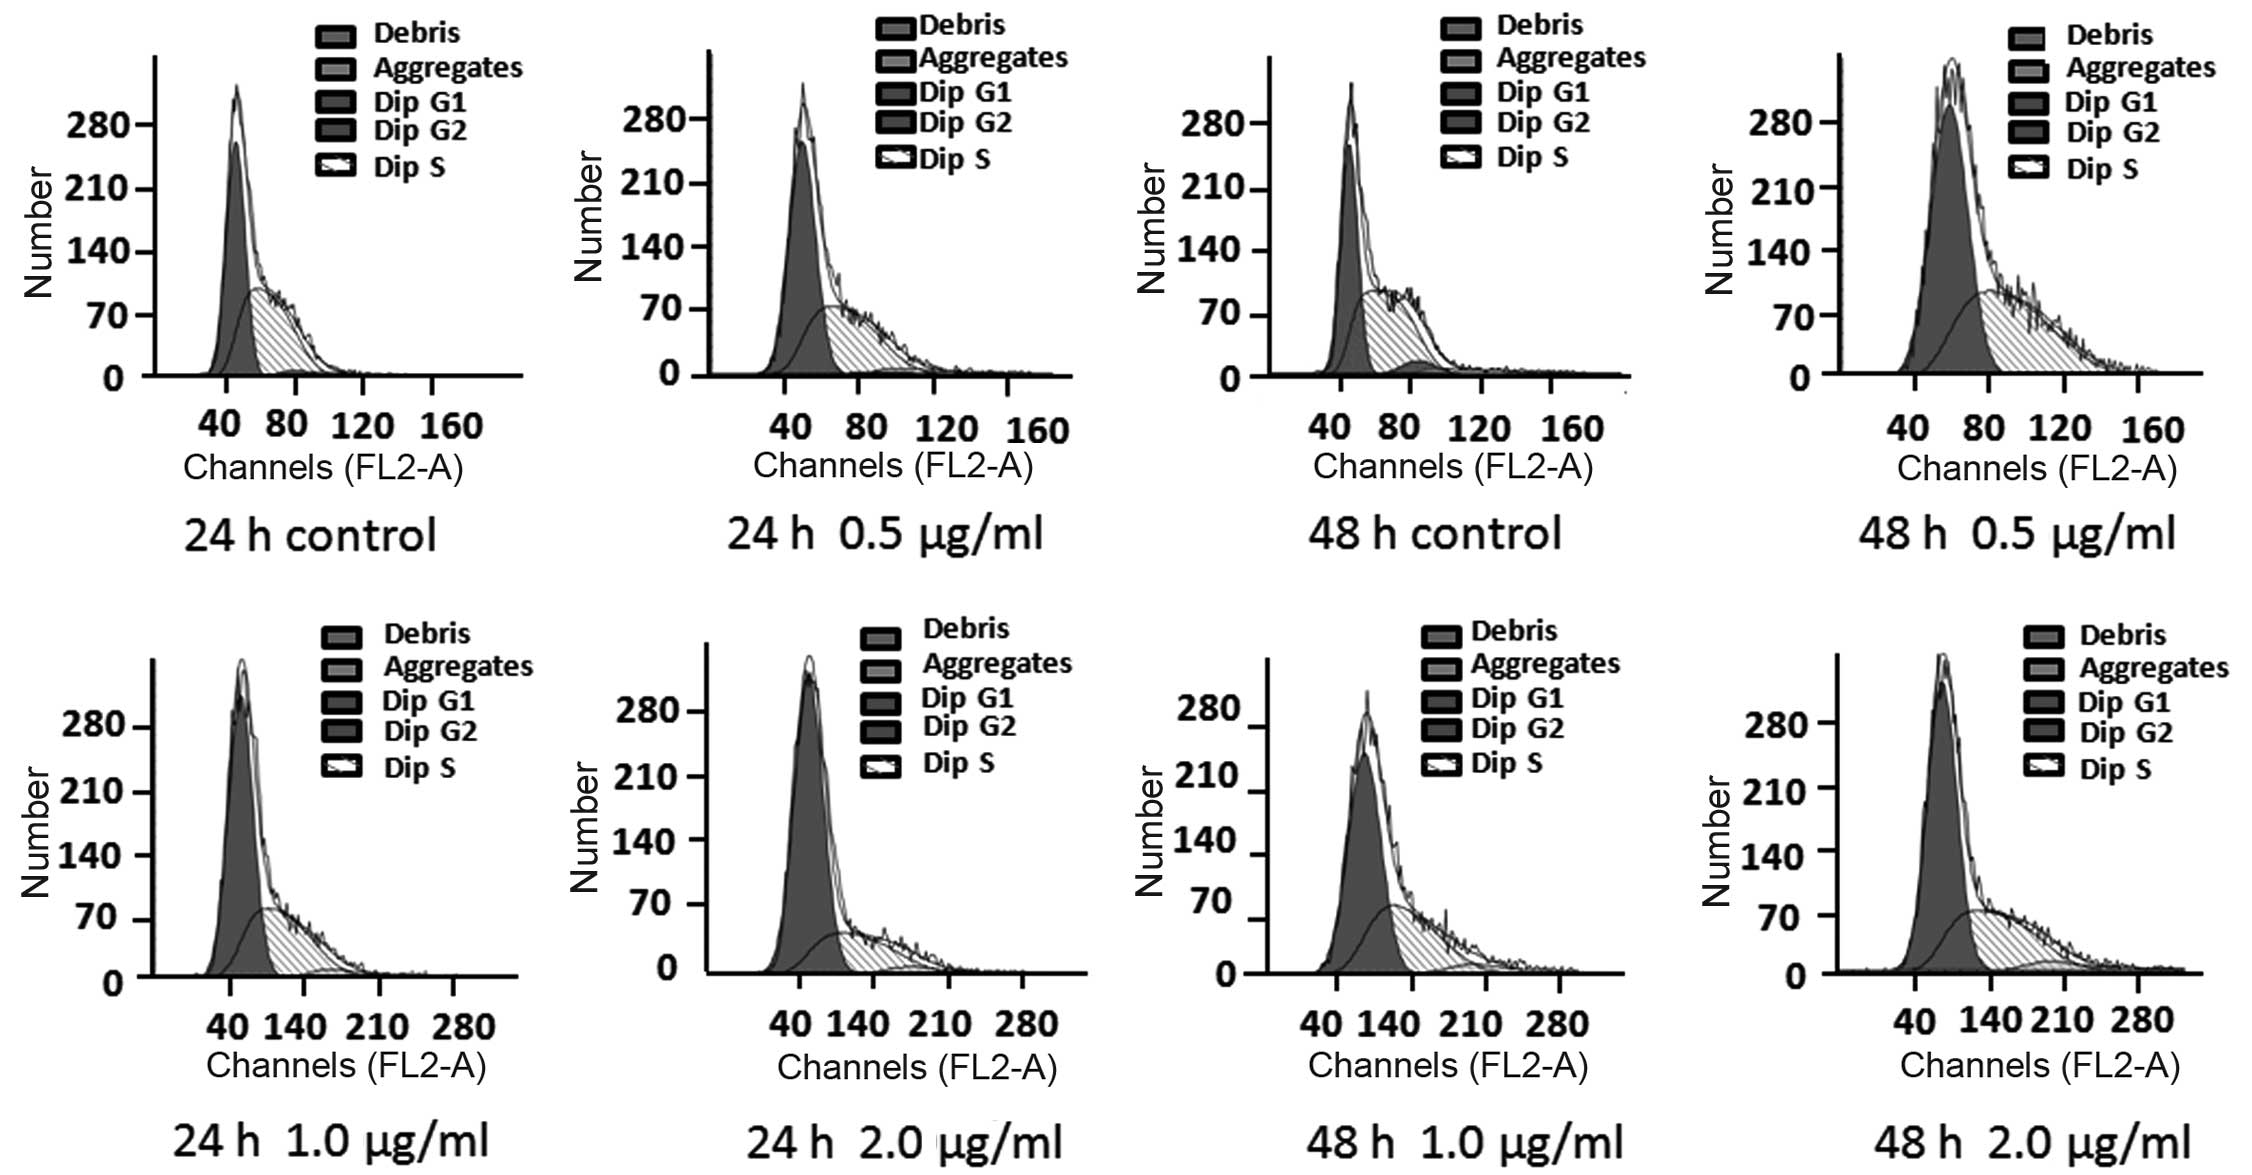
Effects of treatment with DB on the
proliferation of B16 cells
The results of the analysis of the cell cycle using
flow cytometry are shown in Fig.
2. The area in front of the red peak represents the G0-G1
phases, the area following the red square represents the G2-M
phases and the blue diagonal peaks represent the S phase. No cell
cycle arrest was observed in the cells in the blank control group
during any phase of the cell cycle. However, the cells exposed to
DB exhibited arrest, predominantly in the G1 phase. The number of
B16 cells arrested in the G1 phase following exposure to 0.5, 1.0
or 2.0 µg/ml DB for 24 or 48 h was dose-dependent (Fig. 2 and Table III).
| Table IIIAnalysis of the cell cycle
distribution of the cells treated with DB for 24 or 48 h, assessed
using flow cytometry. |
Table III
Analysis of the cell cycle
distribution of the cells treated with DB for 24 or 48 h, assessed
using flow cytometry.
| DM (µg/ml) | G1 phase (%) | G2 phase (%) | S phase (%) |
|---|
| 24 h |
| 0 (control) | 48.34±1.05 | 3.81±0.90 | 48.40±0.57 |
| 0.5 | 57.54±1.71a | 1.78±0.60a | 41.73±1.06a |
| 1.0 | 62.57±1.21a | 0.94±0.08a | 36.49±1.24a |
| 2.0 | 73.45±1.09a | 1.00±0.54a | 25.66±1.35a |
| 48 h |
| 0 (control) | 45.39±2.64 | 4.57±0.45 | 45.95±0.48 |
| 0.5 | 57.40±0.87a | 1.62±0.37a | 43.06±0.94a |
| 1.0 | 61.44±1.07a | 1.09±0.21a | 39.30±0.74a |
| 2.0 | 64.30±0.72a | 0.47±0.23a | 36.46±1.12a |
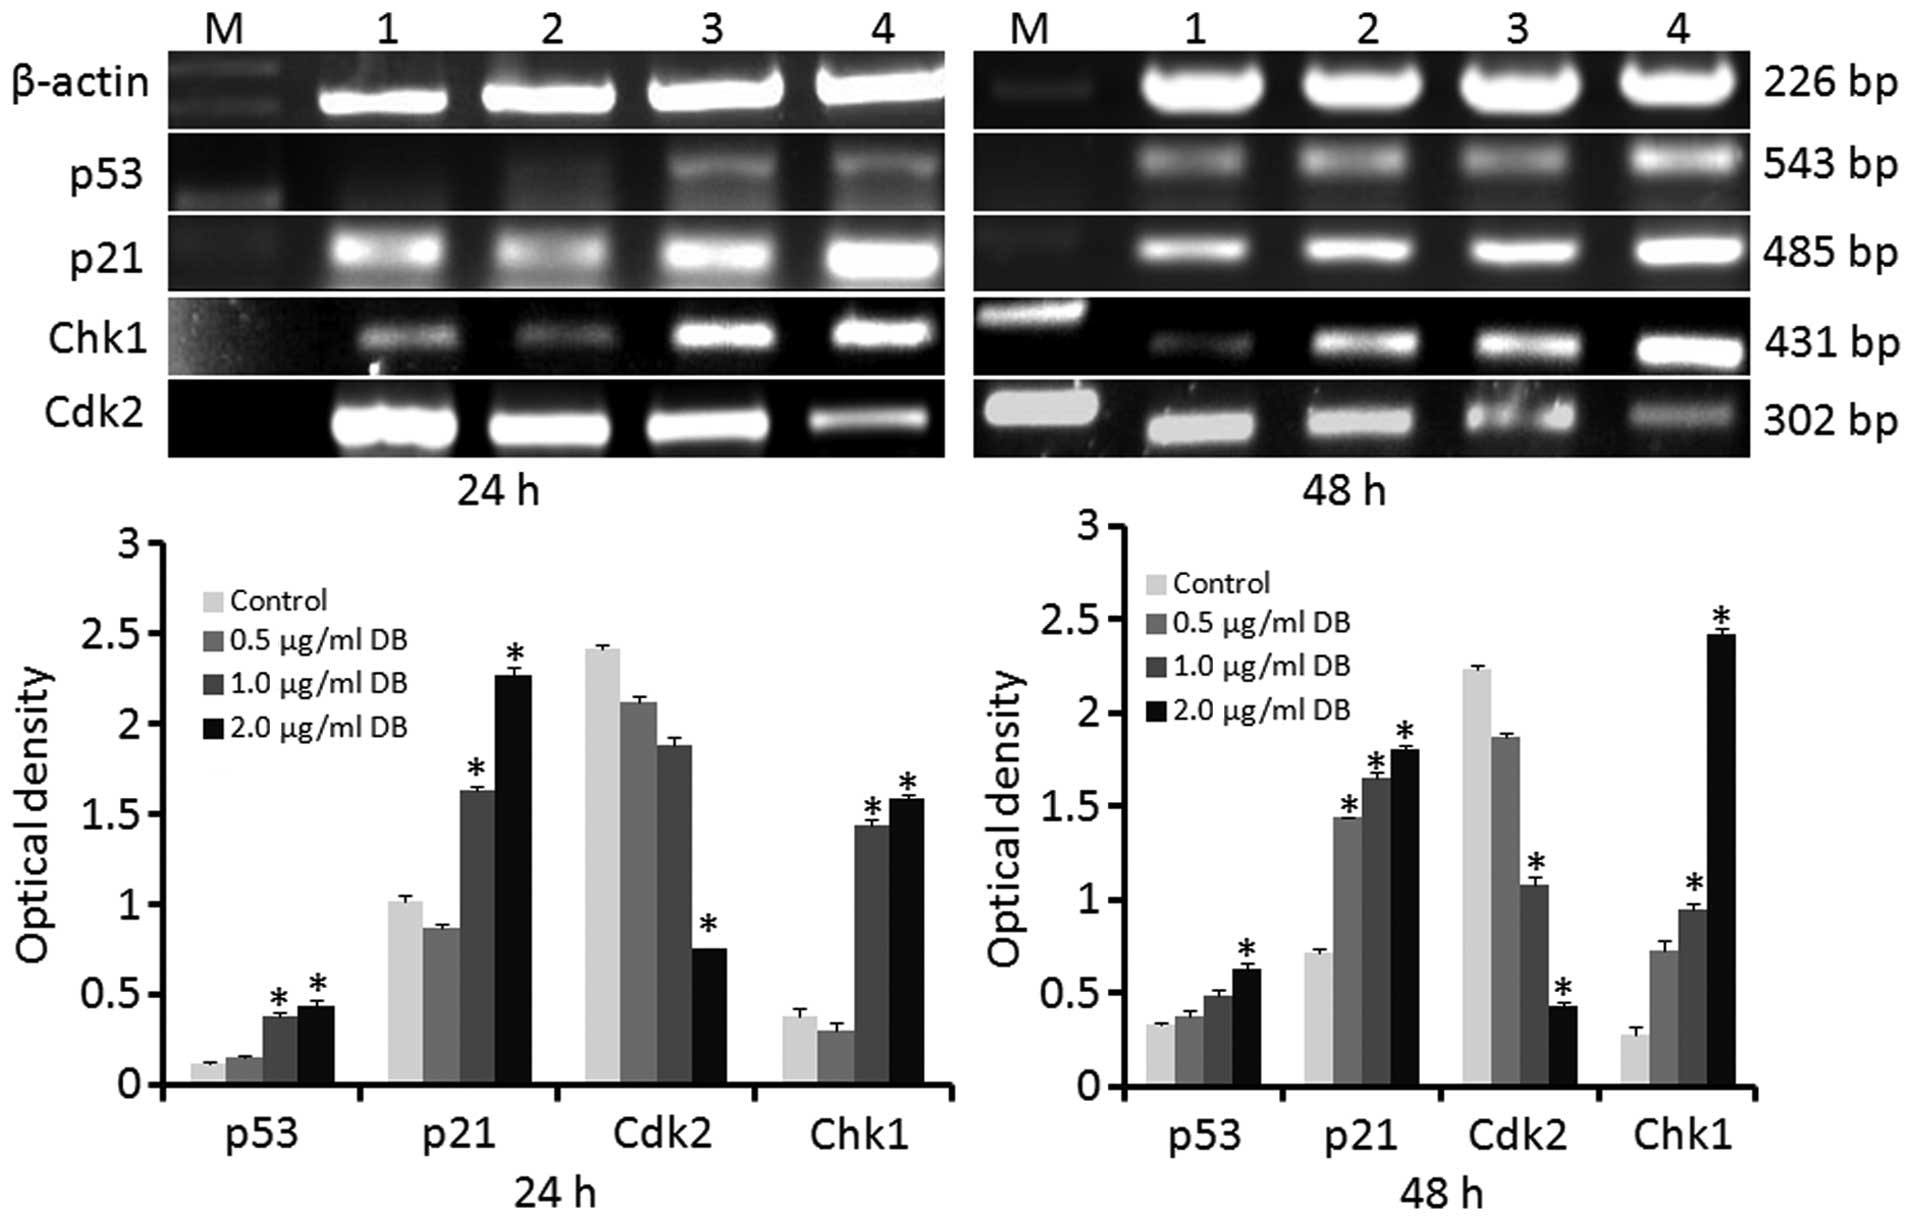
Determination of the mRNA expression
levels of p53, p21, Cdk2, and Chk1 using RT-qPCR
The effects of treatment with 0.5, 1.0 or 2.0
µg/ml DB on gene expression in the B16 cells was analyzed
subsequent to 24 and 48 h exposure. Following treatment for 24 h,
the mRNA expression levels of p53, p21 and Chk1 were significantly
increased in the cells treated with 1.0 or 2.0 µg/ml DB,
compared with the control cells (P<0.05). Following 48 h
exposure, the mRNA expression levels of p53 were significantly
increased only in cells treated with 2.0 µg/ml DB, while the
mRNA expression levels of p21 and Chk1 were significantly increased
in cells treated with all three doses of DB (P<0.05; Fig. 3). By contrast, the mRNA expression
levels of Cdk2 were significantly decreased in the cells treated
with 2.0 µg/ml DB for 24 h and in the cells treated with 1.0
µg/ml or 2.0 µg/ml DB for 48 h (P<0.05; Fig. 3).
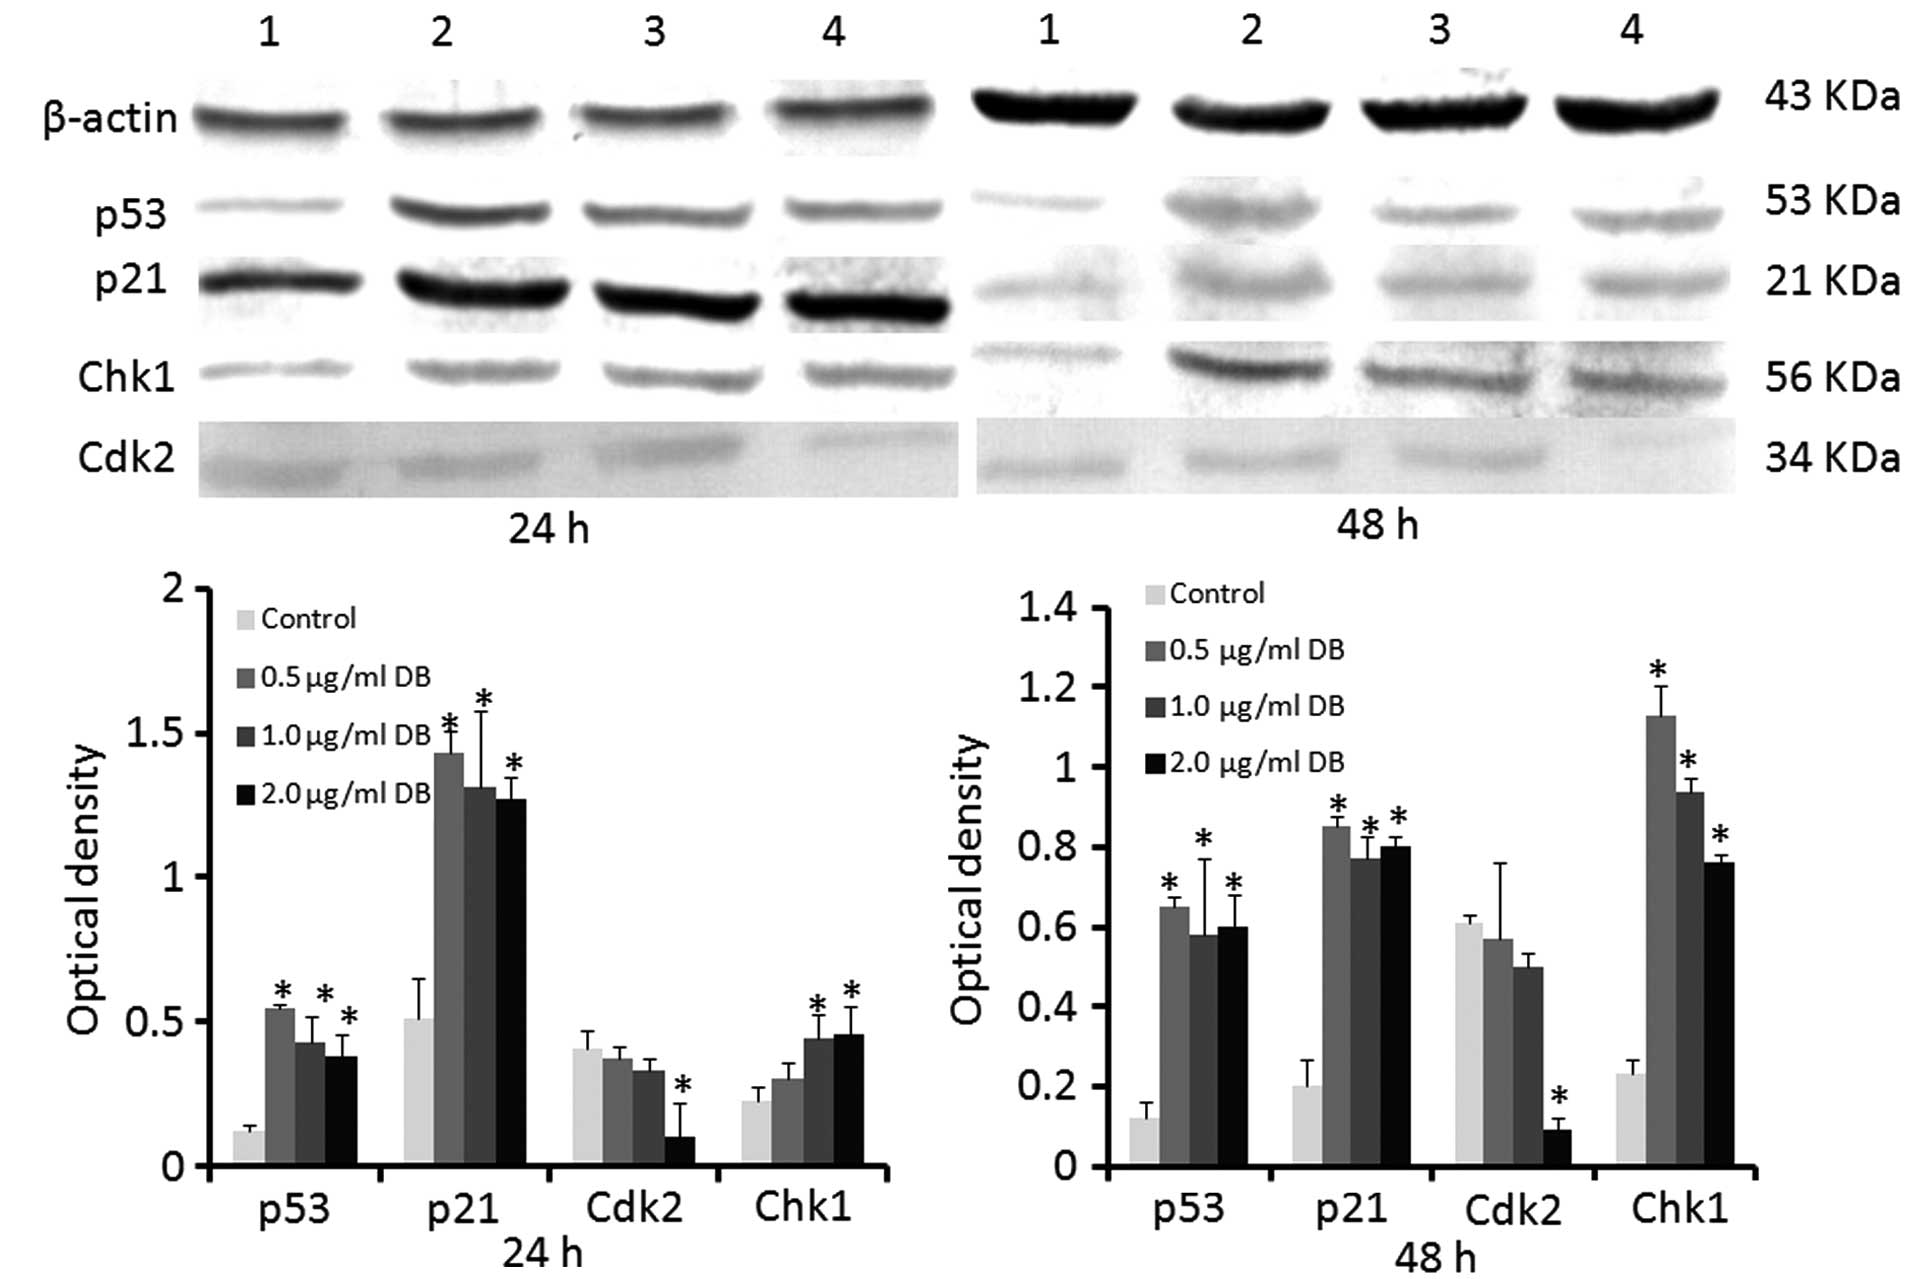
Determination of the protein expression
levels of p53, p21, Cdk2 and Chk1 using western blot analysis
The effects of treatment with 0.5, 1.0 or 2.0
µg/ml DB on the B16 cells were analyzed following 24 or 48 h
exposure. The protein expression levels of p53, p21 and Chk1 were
significantly increased in the cells treated with DB, compared with
the control cells (All P<0.05), with the exception of Chk1 in
the cells treated with 0.5 µg/ml DB for 24 h. The protein
expression of Cdk2 in the cells treated with 2.0 µg/ml DB
for 24 or 48 h was decreased significantly, compared with that
observed in the control cells (Fig.
4).
Discussion
Melanoma is a highly malignant, melanin-producing
tumor. A study in the United States reported that during the past
two decades, the incidence of melanoma has increased annually, and
of the 76,250 patients with newly diagnosed melanoma, 9,180
succumbed to mortality (7).
A predilection for left-sided skin cancer in the
United States is considered to be associated with exposure to UV
light whilst driving (8). The
disease has a poor prognosis and mortality rates due to skin cancer
account for >50% of the total mortality (9). Therefore, identifying novel
treatments is essential.
The root cause of tumor formation is cell cycle
disorder, caused by unrestricted cell proliferation, and cell
cycle-associated genes are important in this process. Cdk2 is a
cyclin-dependent kinase, which binds to the regulatory proteins
Cyclin E and Cyclin A. Activation of the Cyclin E-Cdk2 complex
promotes the progression of the cell cycle through the G1/S phase
restriction point into the S phase of the cell cycle. Following
entry into the S phase, Cdk2 forms a complex with Cyclin A to
regulate DNA and centrosome replication, and remaining at the G2/M
phase checkpoint during the conversion process may promote the
occurrence of mitosis (10–12).
p53 is an important regulator of the cell cycle. In
mammalian cells, wild-type p53 is important in the G1/S phase
transition (13) by binding to and
activating the regulatory region of p21. The formation of p53-p21
complexes prevents the cells from progressing between the G1 phase
and the S phase. In addition, the activation of p21 inhibits the
activity of Cdks. This inhibition arrests the cell cycle at the
G0/G1 phase transition and inhibits proliferation.
Chk1 is a DNA damage-induced cell cycle checkpoint
mediator, which is important in the G2 phase. The activation of
Chk1 via phosphorylation, by cell division cycle 25C, arrests cells
at the G2/M phase transition (14–16).
Previous studies have demonstrated that G2-phase arrest ensures the
integrity and stability of chromosomes, and prevents cells with
abnormal chromosomes from undergoing mitosis (17–19).
Accordingly, tumor cells with functional Chk1 remain in the G2
phase and fail to divide.
In conclusion, the present study demonstrated that
caudate Isodon DB, synthesized by Plectranthus excisus,
inhibited the proliferation of B16 cells. Treatment with DB
increased the mRNA and protein expression levels of p53, p21 and
Chk1, and decreased the mRNA and protein expression levels of Cdk2.
These findings indicated that DB affected the proliferation in B16
cells by activating the expression levels of p53 and p21.
Increasing the expression levels of these two genes inhibited the
activity of Cdk2 and arrested the cells in the G1 phase. Cdk2 is
also regulated by Chk1 at the G2/M phase transition (20). This regulation maintains the cells
in the G2 phase and prevents them from dividing. Therefore, the
results of the present study demonstrated that DB can inhibit cell
cycle progression and, thus offer potential as a beneficial
antitumor drug.
Acknowledgments
This study was supported by the Research Fund for
the Scientific and Technological Development Plan Project in Jilin
Province (grant. no. 20120727), the National Natural Science
Foundation of China (grant. no. 81000271), the Natural Science
Foundation of Jilin Province (grant. no. 201115115) and the
''12th Five-Year-Program'' Science and Technology
Research Plan of the Ministry of Education of Jilin Province.
References
|
1
|
Li D, Wu LJ, Tashiro SI, Onodera S and
Ikejima T: Oridonin-induced A431 cell apoptosis partially through
blockage of the Ras/Raf/ERK signal pathway. J Pharmacol Sci.
103:56–66. 2007. View Article : Google Scholar : PubMed/NCBI
|
|
2
|
Huang J, Wu L, Tashiro S, Onodera S and
Ikejima T: A comparison of the signal pathways between the TNF
alpha- and oridonin-induced murine L929 fibrosarcoma cell death.
Acta Med Okayama. 59:261–270. 2005.
|
|
3
|
Bai NS, He K, Zhou Z, et al: Flavonoids
from Rabdosia rubescens exert anti-inflammatory and growth
inhibitory effect against human leukemia HL-60 cells. Food Chem.
122:831–835. 2010. View Article : Google Scholar
|
|
4
|
Gui MY, Aoyagi Y, Jin YR, Li XW, Hasuda T
and Takeya K: Excisanin H, a novel cytotoxic
14,20-epoxy-ent-kaurene diterpenoid and three new ent-kaurene
diterpenoids from Rabdosia excisa. J Nat Prod. 67:373–376. 2004.
View Article : Google Scholar : PubMed/NCBI
|
|
5
|
Huang ZY, Huang B, Xiao CJ, Dong X and
Jiang B: Two new labdane diterpenoids from the rhizomes of Isodon
yuennanensis. Nat Prod Res. 29:628–632. 2015. View Article : Google Scholar
|
|
6
|
Wu HY, Wang WG, Jiang HY, Du X, Li XN, Pu
JX and Sun HD: Cytotoxic and anti-inflammatory ent-kaurane
diterpenoids from Isodon wikstroemioides. Fitoterapia. 98:192–198.
2014. View Article : Google Scholar : PubMed/NCBI
|
|
7
|
Siegel R, Naishadham D and Jemal A: Cancer
statistics, 2013. Ca-Cancer J Clin. 63:11–30. 2013. View Article : Google Scholar : PubMed/NCBI
|
|
8
|
Dores GM, Huycke MM and Devesa SS:
Melanoma of the skin and laterality. J Am Acad Dermatol.
64:193–195. 2011. View Article : Google Scholar
|
|
9
|
Ahmed I: Malignant melanoma: Prognostic
indicators. Mayo Clin Proc. 72:356–361. 1997. View Article : Google Scholar : PubMed/NCBI
|
|
10
|
Minhajat R, Mori D, Yamasaki F, Sugita Y,
Satoh T and Tokunaga O: Endoglin (CD105) expression in angiogenesis
of colon cancer: Analysis using tissue microarrays and comparison
with other endothelial markers. Virchows Arch. 448:127–134. 2006.
View Article : Google Scholar
|
|
11
|
Uneda S, Toi H, Tsujie T, Tsujie M, Harada
N, Tsai H and Seon BK: Anti-endoglin monoclonal antibodies are
effective for suppressing metastasis and the primary tumors by
targeting tumor vasculature. Int J Cancer. 125:1446–1453. 2009.
View Article : Google Scholar : PubMed/NCBI
|
|
12
|
Lee SY, Hong YD, Felipe PM, Pyun MS and
Choi SJ: Radiolabeling of monoclonal anti-CD105 with (177) Lu for
potential use in radioimmunotherapy. Appl Radiat Isot.
67:1366–1369. 2009. View Article : Google Scholar : PubMed/NCBI
|
|
13
|
Ozaki T and Nakagawara A: Role of p53 in
cell death and human cancers. Cancers (Basel). 3:994–1013. 2011.
View Article : Google Scholar
|
|
14
|
Bartek J and Lukas J: Chk1 and Chk2
kinases in checkpoint control and cancer. Cancer cell. 3:421–429.
2003. View Article : Google Scholar : PubMed/NCBI
|
|
15
|
Senderowicz AM: Novel direct and indirect
cyclin-dependent kinase modulators for the prevention and treatment
of human neoplasms. Cancer Chemother Pharmacol. 52:S61–S73. 2003.
View Article : Google Scholar : PubMed/NCBI
|
|
16
|
Chen Y and Sanchez Y: Chk1 in the DNA
damage response: conserved roles from yeasts to mammals. DNA
Repair. 3:1025–1032. 2004. View Article : Google Scholar : PubMed/NCBI
|
|
17
|
Pawlik TM and Keyomarsi K: Role of cell
cycle in mediating sensitivity to radiotherapy. Int J Radiat Oncol
Biol Phys. 59:928–942. 2004. View Article : Google Scholar : PubMed/NCBI
|
|
18
|
Carpi S, Fogli S, Romanini A, Pellegrino
M, Adinolfi B, Podestà A, Costa B, Da Pozzo E, Martini C, Breschi
MC and Nieri P: AM251 induces apoptosis and G2/M cell cycle arrest
in A375 human melanoma cells. Anticancer Drugs. May 12–2015.Epub
ahead of print. View Article : Google Scholar : PubMed/NCBI
|
|
19
|
Peng ZG, Yao YB, Yang J, Tang YL and Huang
X: Mangiferin induces cell cycle arrest at G2/M phase through
ATR-Chk1 pathway in HL-60 leukemia cells. Genet Mol Res.
14:4989–5002. 2015. View Article : Google Scholar : PubMed/NCBI
|
|
20
|
Qi W, Xie C, Li C, Caldwell JT, Edwards H,
Taub JW, Wang Y, Lin H and Ge Y: CHK1 plays a critical role in the
anti-leukemic activity of the wee1 inhibitor MK-1775 in acute
myeloid leukemia cells. J Hematol Oncol. 7:532014. View Article : Google Scholar : PubMed/NCBI
|