Introduction
Prostate cancer (PCa) is the second most frequently
diagnosed malignancy and the sixth leading cause of
cancer-associated mortality in men worldwide (1). It develops mainly in the peripheral
zone and involves multiple genetic and molecular alterations
(2). Prostate-specific antigen
(PSA) remains the only diagnostic biomarker and indicator for the
management of PCa. Inclusion of PSA evaluation into clinical
assessments has achieved a significant reduction in PCa-associated
mortality (3). Although highly
tissue-specific, PSA is not disease-specific (4). As a consequence, PSA routine
screening has led to overdiagnosis and overtreatment, and
controversies have risen regarding the increasing number of
negative, potentially unnecessary prostate biopsies performed in
order to identify a patient with a lethal prostate tumor (5).
Considerable research efforts have been made with
the aim of discovering novel molecular markers for improving PCa
detection and monitoring (6).
MicroRNAs (miRNAs) have emerged as promising diagnostic biomarkers
and as therapeutic targets for a diversity of tumor types. Specific
miRNAs have been found to have key regulatory roles in a variety of
oncogenic processes, including angiogenesis (7), response to hypoxia (8), epithelial-mesenchymal transition
(9) and metastasis (10,11).
Of note, a variety of studies have described the deregulation of
several miRNAs during the genesis and progression of PCa (12). For example, miR-15a, miR-16-1,
miR-101, the miR-200 family, miR-205, and the miR-99 family haven
been shown to have tumor suppressor roles, while miR-21,
miR-221/222, miR-106b-25-93 and miR-125b have been validated to
have oncogenic functions (12). In
addition, profiling studies of tissue samples have identified
PCa-specific miRNA signatures, which permit the differentiation of
malignant and benign conditions (13,14).
It is of great interest to develop diagnostic
strategies that are less invasive while being affordable. In this
context, it is desirable to detect biomarkers in bodily fluids.
miRNAs are relatively stable molecules and can be secreted into the
extracellular space (15), which
renders them useful biomarkers, readily detectable in bodily
fluids. It has been shown that blood (16,17),
saliva (18) and urine (19–22)
contain miRNAs that can be quantified using methods such as
reverse-transcription quantitative polymerase chain reaction
(RT-qPCR). The most successful example is the case of the
urine-based method for detecting and measuring levels of the
non-coding transcript PCA3 for the diagnosis of PCa (23). In the present study, a
high-throughput analysis of miRNAs in urine samples from men with
PCa and benign prostate hyperplasia (BPH) was performed. A miRNA
signature characteristic for PCa was identified and its clinical
applicability for predicting the biopsy outcome of patients with
suspected PCa was assessed.
Materials and methods
Patient cohort
A total of 143 male Mexican patients, who visited
the Hospital General Dr. Manuel Gea Gonzalez (Mexico City, Mexico)
between July 2012 and February 2013, were enrolled in the present
study. Written informed consent was obtained from all patients. The
protocol of the present study was approved by the ethics committee
of Hospital General Dr. Manuel Gea Gonzalez. All patients presented
with palpable nodules or induration of the prostate [suspicious
digital rectal examination (DRE)] and blood levels of PSA >2.5
ng/ml. Following diagnosis, patients where scheduled for a 12-core
transrectal ultrasound-guided prostate biopsy. Subsequently, an
experienced pathologist assessed the cores to determine whether the
biopsy specimens were malignant. For those samples pathologically
diagnosed as PCa, Gleason scoring was performed by careful
examination of the microscopic pattern of the cancer foci. The PCa
group included 73 patients with significant PCa diagnosis (Gleason
score ≥7). The control group comprised 70 patients with BPH, whose
biopsy specimens contained benign glands and normal prostate cells
only. Patients with previous diagnosis of PCa or a family history
record of PCa were excluded. Patients with symptoms of urinary
tract infection, immunodeficiency disorders, harboring high-grade
prostatic intraepithelial neoplasia or atypic cellular
proliferation, or who were under medical treatment for prostate
hyperplasia, were also excluded. The clinical and pathological data
of the patients were collected and are listed in Table I.
 | Table IClinical features of patients. |
Table I
Clinical features of patients.
| Variable | Total | PCa | BPH |
|---|
| Patients, n
(%) | 143 (100.0) | 73 (51.1) | 70 (48.9) |
| Age at diagnosis,
mean (range) in years PSA | 66 (50–87) | 68 (51–87) | 65 (50–82) |
| Total, mean
(range) in ng/ml | 12.8
(0.9–72.4) | 15.7 (5–72.4) | 9.8 (0.9–36) |
| Free PSA, mean
(range) in % | 14.4 (5–38) | 12.5 (5–28) | 16 (5–38) |
| <4 ng/ml, n
(%) | 2 (1.4) | 0 (0.0) | 2 (1.4) |
| >4, <10
ng/ml, n (%) | 77 (53.8) | 31 (21.7) | 46 (32.2) |
| >10 ng/ml, n
(%) | 66 (46.2) | 42 (29.4) | 22 (15.4) |
| Gleason score, n
(%) | | | |
| 7 | | 28 (19.6) | |
| 8 | | 33 (23.1) | |
| 9 | | 2 (1.4) | |
| 10 | | 10 (7.0) | |
| Suspicious DRE
result, n (%) | | | |
| Yes | 68 (47.6) | 47 (32.9) | 21 (14.7) |
| No | 75 (52.4) | 26 (18.2) | 49 (34.3) |
| Lymph node
metastasis, n (%) | | | |
| N0 | | 63 (44.0) | |
| N1 | | 3 (2.1) | |
| Unknown | | 7 (4.9) | |
Urine sample processing and RNA
extraction
First-catch urine (30 ml) was collected following a
prostate massage to stimulate the release of prostate fluid into
the urine, as described in a previous study (24). The collected urine and prostate
fluid mixture was mixed with 5 ml RNAlater buffer (Qiagen, Hilden,
Germany) as an RNA stabilizing agent. All samples were stored at
−80°C for one week. For further processing, samples were defrosted
on ice and then centrifuged at 5,000 × g. Once the supernatant was
discarded, the urine sediment was washed twice with
phosphate-buffered saline at pH 7.2 and RNA extraction was
performed using the RNeasy Mini kit (Qiagen, Inc.) according to the
manufacturer's guidelines. RNA was re-suspended in 15 µl
RNAase-free water and quantified spectrophotometrically using a
NanoDrop ND-1000 system (Thermo Fisher Scientific, Inc., Waltham,
MA, USA).
cDNA preparation, pre-amplification and
RT-qPCR analysis
For the screening study, RT was performed for each
sample using the TaqMan® MicroRNA reverse transcription
kit and the Megaplex™ RT primers, human pool A v2.0 (Thermo Fisher
Scientific, Inc.). Subsequently, the newly synthesized
complementary DNA was subjected to a pre-amplification step using
the 2X Preamp Master Mix and the Megaplex 10X preamp primer mix
(Thermo Fisher Scientific, Inc.). The product was then loaded onto
a Human MicroRNA TaqMan Low Density Array (TLDA) set card A v.2.1
(Thermo Fisher Scientific, Inc.) and qPCR was performed using a
7900HT Fast Real-Time PCR system (Thermo Fisher Scientific, Inc.).
RT, pre-amplification and qPCR reactions were performed according
to manufacturer's instructions.
For the validation study and time course analysis,
RT, pre-amplification and qPCR reactions were performed. The
expression of let-7c, miR-193b, miR-100, miR-200b, miR-200c,
miR-20a, miR-204, miR-195, miR-150, miR-16, miR-21 and let-7b was
measured using TaqMan® MicroRNA Assays (cat. no.
4427975; Thermo Fisher Scientific, Inc.). For measurement of GAPDH
and KLK3 mRNA expression levels, Single Tube TaqMan®
Gene Expression Assays (cat. no. 4331182; Thermo Fisher Scientific,
Inc.) were used.
Time-course analysis
After thawing, six samples of urine, including three
PCa and three BPH, were randomly selected from the entire cohort,
and 10 ml from each sample were pooled. The pool was maintained at
25°C and aliquots were removed in triplicate at 0, 1, 2, 4, 6, 12
and 24 h and placed at 4°C. Once this time-series had been
completed, RNA extraction, RT and pre-amplification reactions were
performed for all aliquots. Quantification of miR-15a, miR-21, KLK3
and GAPDH was performed by qPCR, as described above. Comparisons
between raw Ct distributions were assessed performed using the
Friedman test. P<0.05 was considered statistically
significant.
Evaluation of human miRNA TLDA and
RT-qPCR data
In order to avoid group bias, the cycle threshold
(Ct) distributions for all PCa and BPH samples were determined and
a filtering procedure was applied to classify the miRNAs according
to their level of detectability. A Ct value of 35 was set
arbitrarily; miRNAs with Ct<35 were considered as detected and
those with Ct>35 were considered undetected. miRNAs that were
undetected in >2 samples for each group were removed from the
analysis. Filtered raw Ct data were normalized using a
rank-invariant set normalization procedure. Briefly, this
normalization computes all rank-invariant sets of features between
pair-wise comparisons of each samples against a pseudo-mean. The
rank-invariant features were used as a reference for generating a
smoothing curve, which was then applied to the entire sample.
Differential expression of miRNAs was assessed using a Mann-Whitney
U test with consideration of two different distributions for BPH
and CaP groups and a Benjamini Hochberg test was applied to control
the rate of false-positive results. miRNAs with a fold change >2
and a false discovery rate (FDR) adjusted to P<0.05 were
considered to be statistically significant. For individual assays,
the comparative Ct method was used to determine the differential
expression of miRNAs (25).
P<0.05 as assessed by a Mann-Whitney U test was considered to
indicate a statistically significant difference. For miR-100 and
miR-200b scores, the geometric mean of raw Ct values were
calculated and the geometric mean of MammU6 and RNU48 was
subtracted.
Statistical analysis
Univariable logistic regression was performed to
assess the contribution of age, PSA, % of free PSA, DRE and
miR-100/200b score as individual predictors of PCa on biopsy
results. Odds ratios (ORs) and corresponding 95% confidence
intervals (95% CI) were computed for each predictor. Multivariable
logistic regression was used to build a base model including the
variables age, PSA, % of free PSA and DRE, as well as a second
combined model composed of the variables age, PSA, % of free PSA,
DRE and miR-100/200b score. ORs and 95% CI were also computed for
each model. For evaluating the diagnostic performance of the
individual variables, and the base and combined models,
receiver-operating characteristic (ROC) curve analysis was carried
out, and the areas under the curve (AUC) and corresponding 95% CI
were computed using the DeLong method. A χ2 test was
applied to assess significant differences in the predictive value
between ROC curves. To assess the clinical benefit of the models
tested, a decision curve analysis (DCA) was performed, which
illustrates the net benefit of a clinical intervention at various
threshold probabilities, the minimum expected probability of a PCa
diagnosis at which the physician in consultation with the patient
opts for a biopsy. In brief, DCA assigns weight to the relative
value of the benefits (true positives) versus the false positives.
Data processing and statistical analyses were performed using
utility packages from Bioconductor in R and GraphPad Prism V 5.0
(GraphPad, Inc., La Jolla, CA, USA).
Results
miRNAs are stable molecules which can be
robustly measured in urine samples
As a proof of principle for the robustness of the
approach of evaluating miRNAs as biomarkers in urine, the
degradation pattern of selected miRNAs was determined. A time
course RT-qPCR analysis of miRNAs in urine was performed at 37°C.
The levels of miR-16 and miR-21, two readily detectable miRNAs,
were assessed in a variety of urine samples over 24 h.
Simultaneously, the levels of two mRNAs, GAPDH and KLK3, were
assessed, which showed a rapid decrease over 24 h. By contrast, the
levels of the two miRNAs remained relatively constant (Fig. 1A). To test the reproducibility of
the method for measuring miRNA levels, aliquots were taken in
duplicate from the urine samples of two PCa patients and one BPH
patient and the levels of miRNA expression were assessed by RT-qPCR
in triplicate. The Ct values obtained showed no significant
differences among replicates from the same sample donor and between
samples from different donors (Fig.
1B). These results indicated that miRNAs are stable molecules
in urine samples, which can be detected and robustly measured.
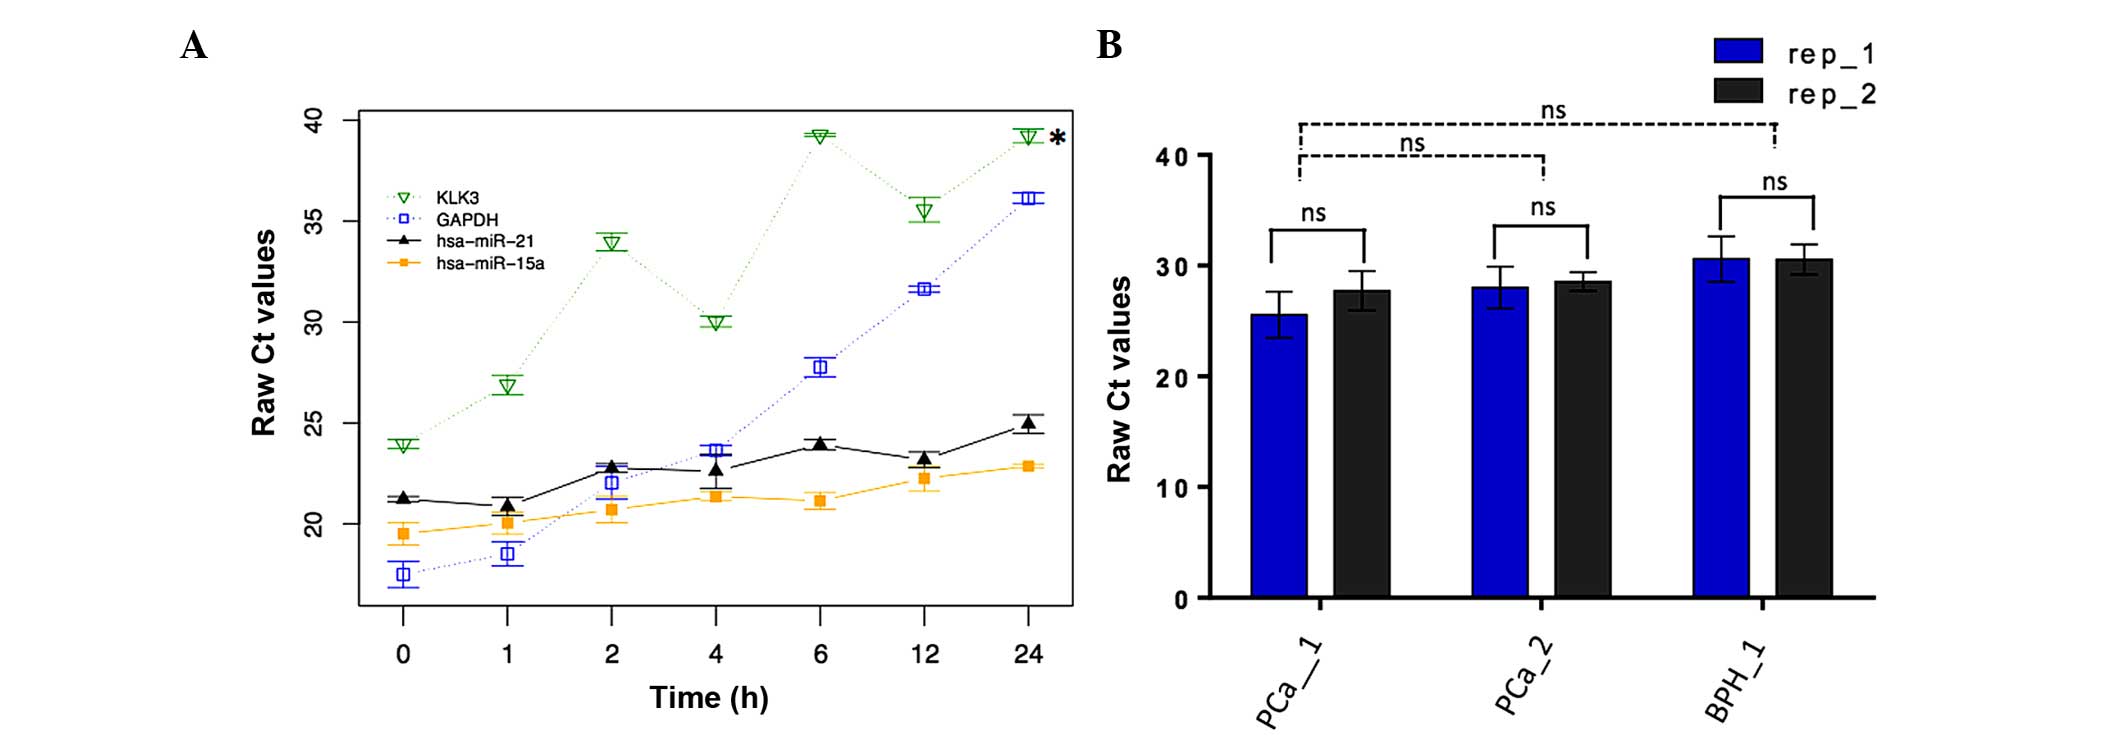 | Figure 1miRNA stability and reproducibility
of its quantification in urine samples. (A) Aliquots were removed
in triplicate from a pool consisting of 3 PCa and 3 BPH urine
samples at 0, 1, 2, 4, 6, 12 and 24 h. miR-15a, miR-21, and KLK3
and GAPDH mRNA, were measured by qPCR and Ct values were obtained.
Data are presented as the mean ± standard deviation of raw Ct
values (n=3). Comparisons between raw Ct distributions were
conducted using the Friedman test. *P<0.05 vs miR-21.
(B) Individual aliquots were removed in duplicate from three urine
samples (two PCa patients and one BPH). MiR-15a levels were
measured by RT-qPCR performed in triplicate. Data are presented as
the mean ± standard deviation of raw Ct values. miRNA, microRNA;
rep, replicate; Ct, cycle threshold. P<0.05 as assessed by the
Mann-Whitney U test was considered to indicate a statistically
significant difference. |
miRNA profile is significantly altered in
PCa
A PCR array was performed to determine the levels of
364 miRNAs in 8 urine samples from patients with PCa and 8 urine
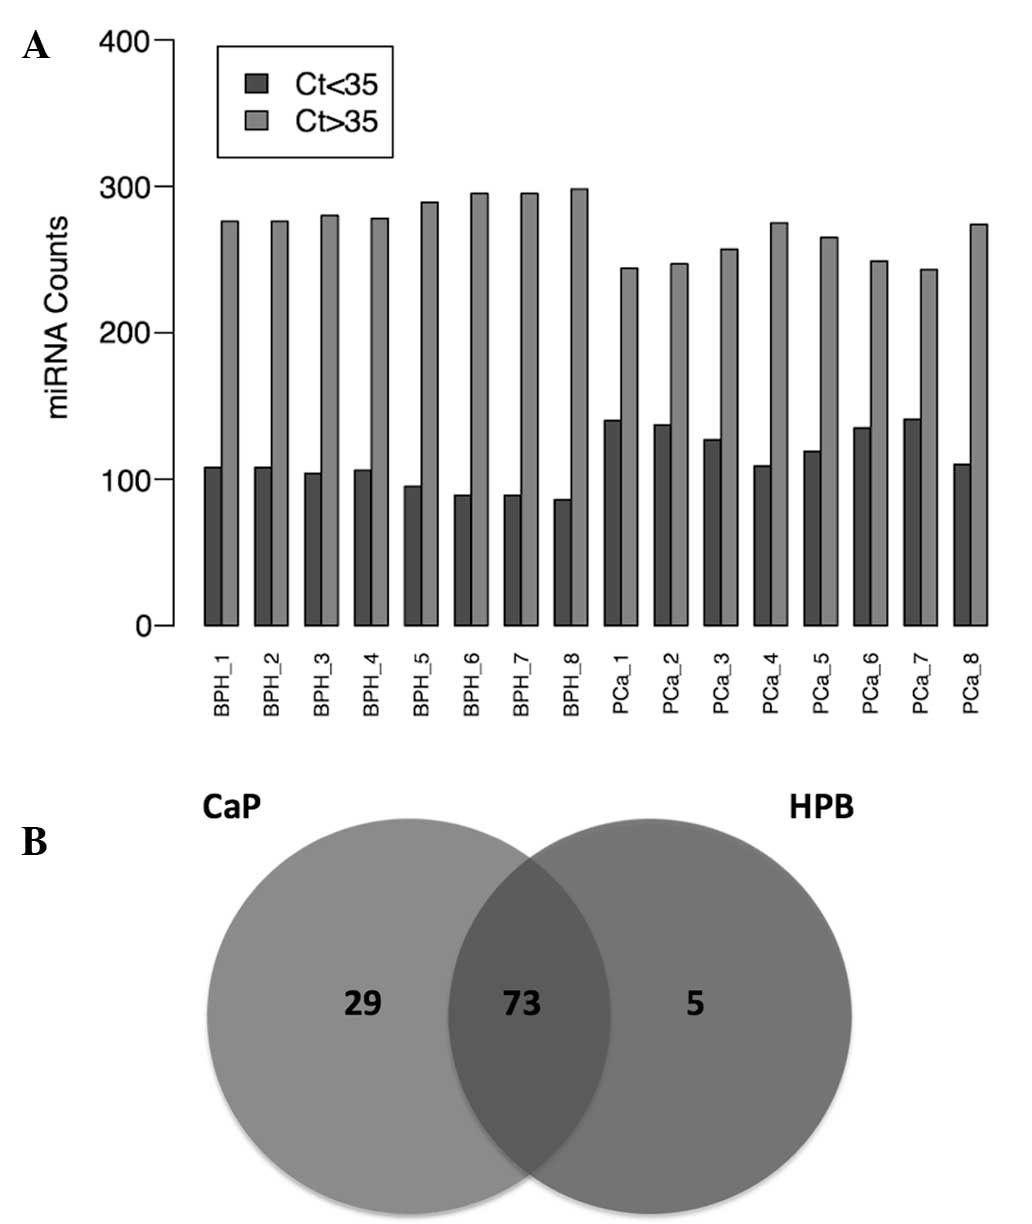
samples from patients with BPH. Notably, miRNA levels in the PCa
group were generally higher, as compared than those in the BPH
group (Fig. 2A). A total of 102
miRNAs were detected in the PCa group, whereas 78 miRNAs were
detected in the BPH group. Of these, 73 miRNAs were detected in
both groups (Fig. 2B). This
dataset was retained for subsequent processing and differential
expression analysis. As there is no standard method for
normalization of miRNA expression data in urine samples, various
normalization strategies were tested. Rank-invariant set
normalization was applied to raw Ct data, since this method
represented the best distribution adjustment to make the two groups
of samples comparable, with the exception of quantile
normalization. However, the quantile normalization method has been
reported to result in a loss of important biological differences
(26). Comparison of normalized
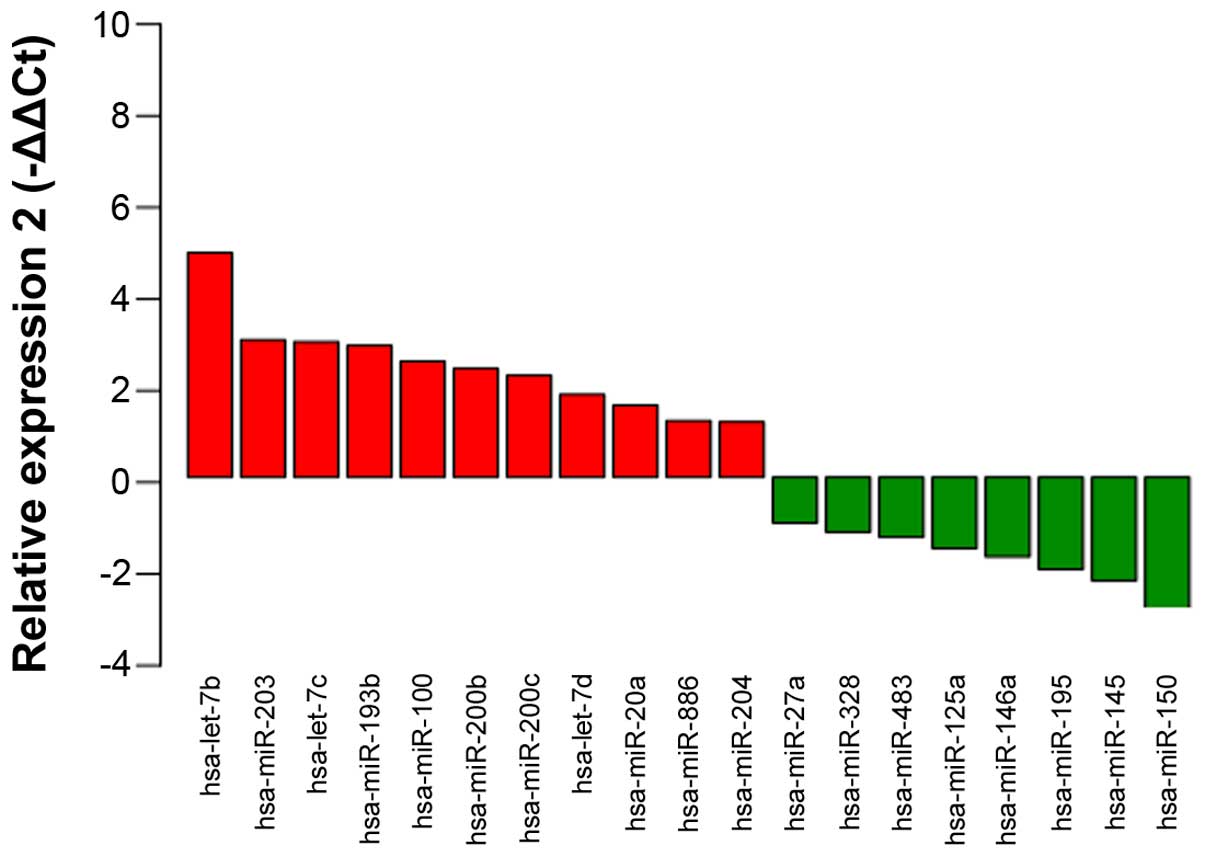
expression levels of miRNAs revealed a set of 19 miRNAs that showed
significant differences between the PCa and BPH groups (Fig. 3). From this set of miRNAs, 11 were
elevated, while 8 were reduced in the PCa group. The top ten
differentially expressed miRNAs were as follows: miR-100, miR-200b,
miR-200c, miR-150, miR-195, let-7b, let-7c, miR-20a, miR-193b and
miR-204. This set of miRNAs was selected for further validation in
73 urine samples from patients with PCa and 70 urine samples from
patients with BPH, including the samples used for the initial
screening. Significant aberrations were confirmed for miR-100,
miR-200b, miR-200c, miR-150, miR-195, let-7b, let-7c and miR-193b
(Table II).
| Table IIAveraged normalized levels of miRNAs
in the urine of patients with PCa and BPH and statistical
validation of significant differences. |
Table II
Averaged normalized levels of miRNAs
in the urine of patients with PCa and BPH and statistical
validation of significant differences.
| miRNA | ΔCt (PCa) | ΔCt (BPH) | ΔΔCt | Fold change
(2−ΔΔCt) | P-value |
|---|
| hsa-miR-100a | 4.2782 | 5.9839 | −1.7058 | 3.2620 |
5.52×10⁻⁵ |
|
hsa-miR-200ba | 2.2534 | 4.6239 | −2.3705 | 5.1713 |
2.94×10⁻⁴ |
|
hsa-miR-200ca | 2.7771 | 4.1767 | −1.3995 | 2.6382 |
4.60×10⁻⁴ |
| hsa-miR-150a | 6.6473 | 4.9470 | 1.7003 | 0.3077 |
1.43×10⁻² |
| hsa-miR-195a | 8.9949 | 7.6015 | 1.3934 | 0.3807 |
1.67×10⁻² |
| hsa-let-7ba | 2.6407 | 3.9059 | −1.2652 | 2.4035 |
2.26×10⁻² |
| hsa-let-7ca | 3.2002 | 4.2061 | −1.0058 | 2.0081 |
3.49×10⁻² |
| hsa-miR-20a | 5.5777 | 6.5679 | −0.9901 | 1.9864 |
7.53×10⁻² |
| hsa-miR-193b | 2.8863 | 3.9914 | −1.1051 | 2.1511 |
9.10×10⁻² |
| hsa-miR-204 | 5.6469 | 5.0981 | 0.5487 | 0.6836 |
3.69×10⁻¹ |
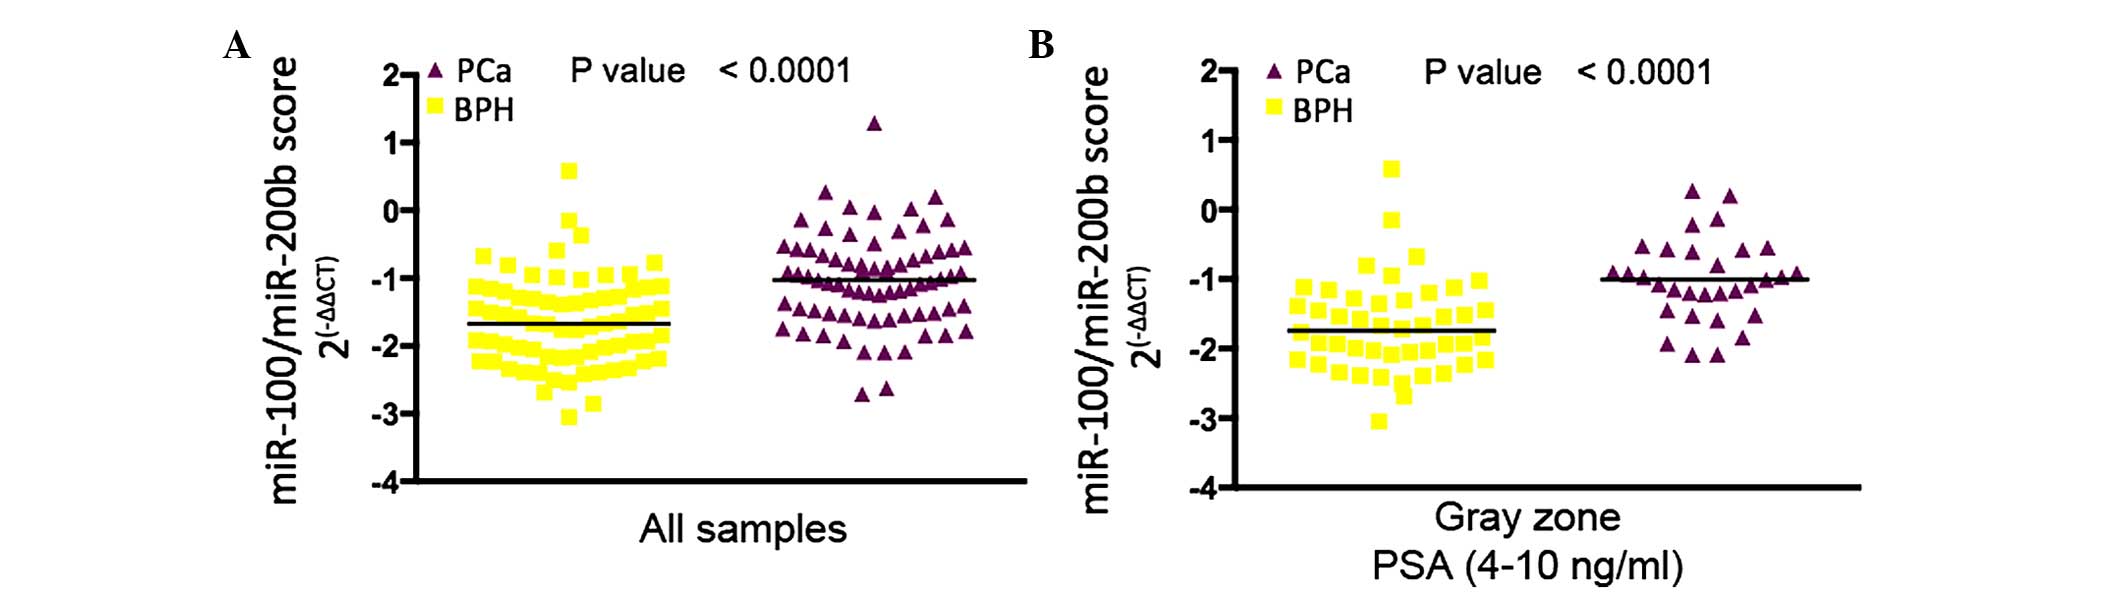
Urine levels of miR-100 and miR-200b can
be used for distinguishing between PCa and BPH
The urine levels of miR-100 and miR-200b were most
significantly increased in patients diagnosed with PCa compared
with patients diagnosed with BPH by subsequent biopsy. Since all
patients in the PCa group had a Gleason score of ≥7, the difference
between indolent and more aggressive PCa could not be assessed. A
significant positive correlation was found between the urine levels
of miR-100 and miR-200b (Spearman coefficient=0.18; P=0.0355) and a
unique miR-100/200b score was calculated for further analysis. In
the entire cohort, the miR-100/200b score was significantly higher
in patients diagnosed with PCa compared with that in patients
diagnosed with BPH by subsequent biopsy (Fig. 4A). The miR-100/200b score was then
compared among patients with suspicion of PCa with PSA levels in
the ʻgray areaʼ (4–10 ng/ml), revealing that the miR-100/200b score
was significantly higher in patients with PCa-positive biopsy
results compared with those in patients with BPH (Fig. 4B).
Inclusion of the urinary miR-100/200b
score enhances the predictive value regarding the prostate biopsy
outcome
Age, PSA, percentage of free PSA, DRE and
miR-100/200b score were evaluated by univariable and multivariable
logistic regression analysis to test their predictive value
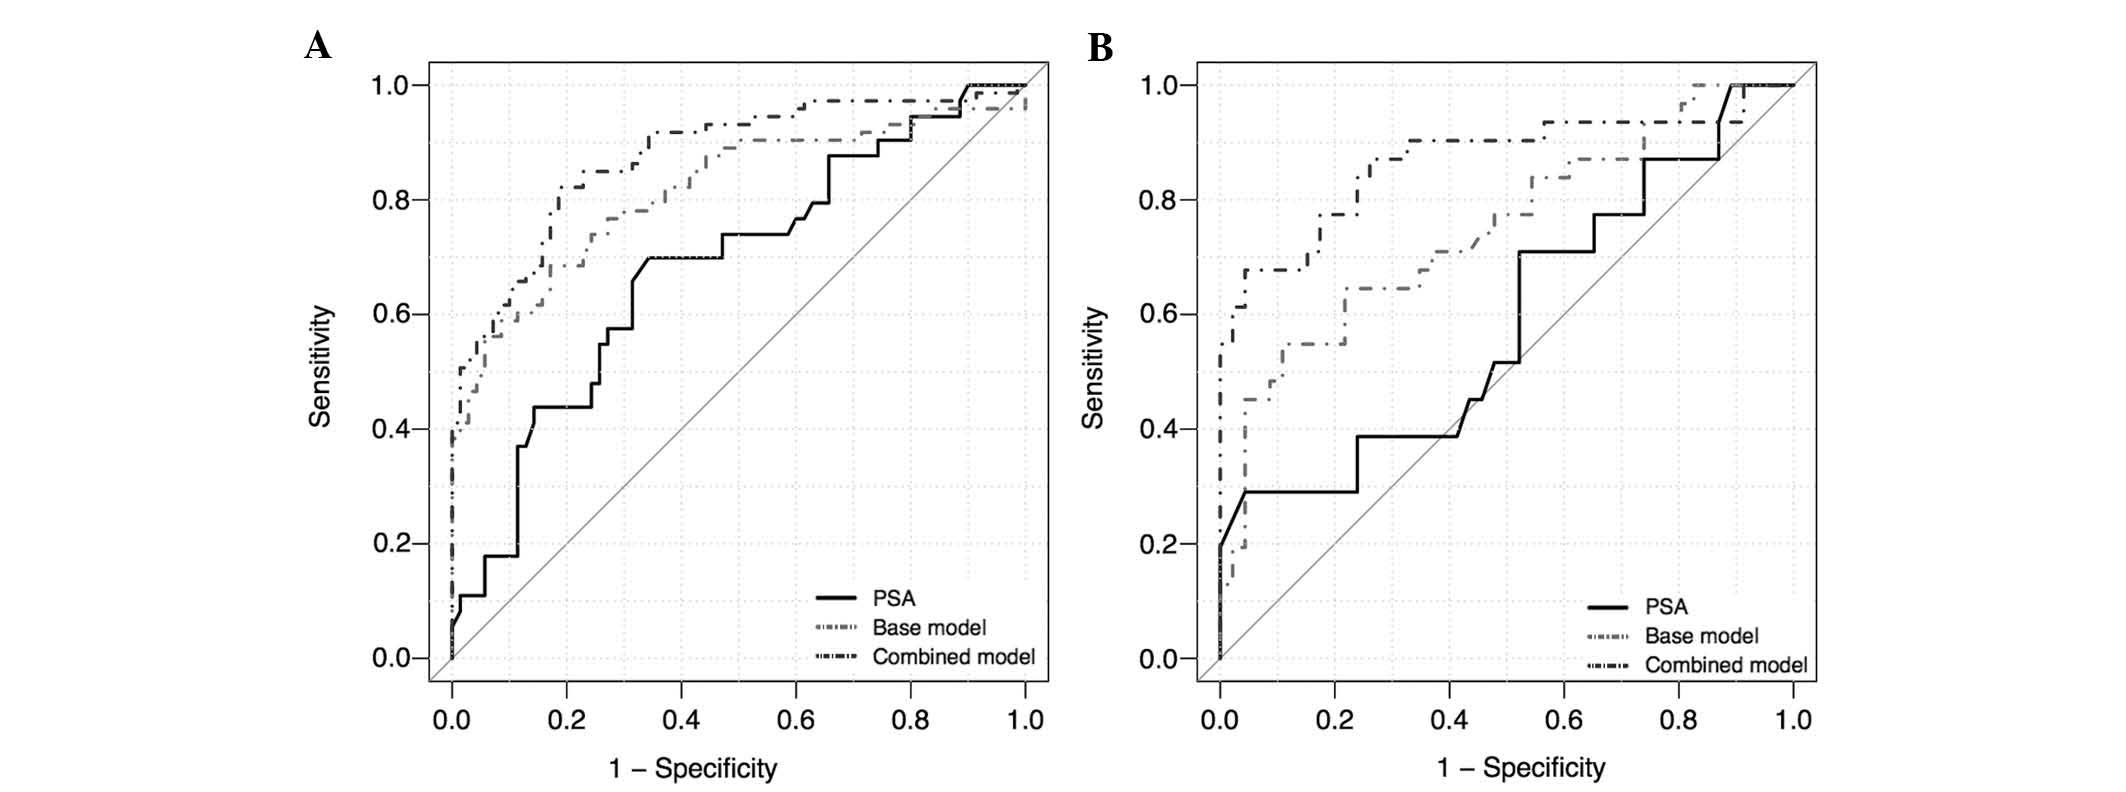
regarding PCa-associated biopsy results (Table III). For the entire cohort, all
variables were significant individual predictors of PCa according
to the univariable logistic regression model, with the miR-100/200b
score DRE having the highest prediction accuracy, followed by the
free PSA, PSA, DRE and age. Subsequently a multivariable logistic
regression model comprising age, PSA, percentage of free PSA and
DRE (base model) was generated to predict the presence of PCa.
Addition of the miR-100/200b score to the base model (combined
model) yielded a gain of 6.3% in prediction accuracy. ROC curve
analysis demonstrated that the combined model significantly
outperformed the capacity of PSA levels (sensitivity, 0.70;
specificity, 0.66; P<0.001) and the base model (sensitivity,
0.68; specificity, 0.83; P=0.01) for discriminating between PCa and
BPH patients, with enhanced sensitivity (0.822) and specificity
(0.814) at the optimal cutoff value of the estimated coefficients
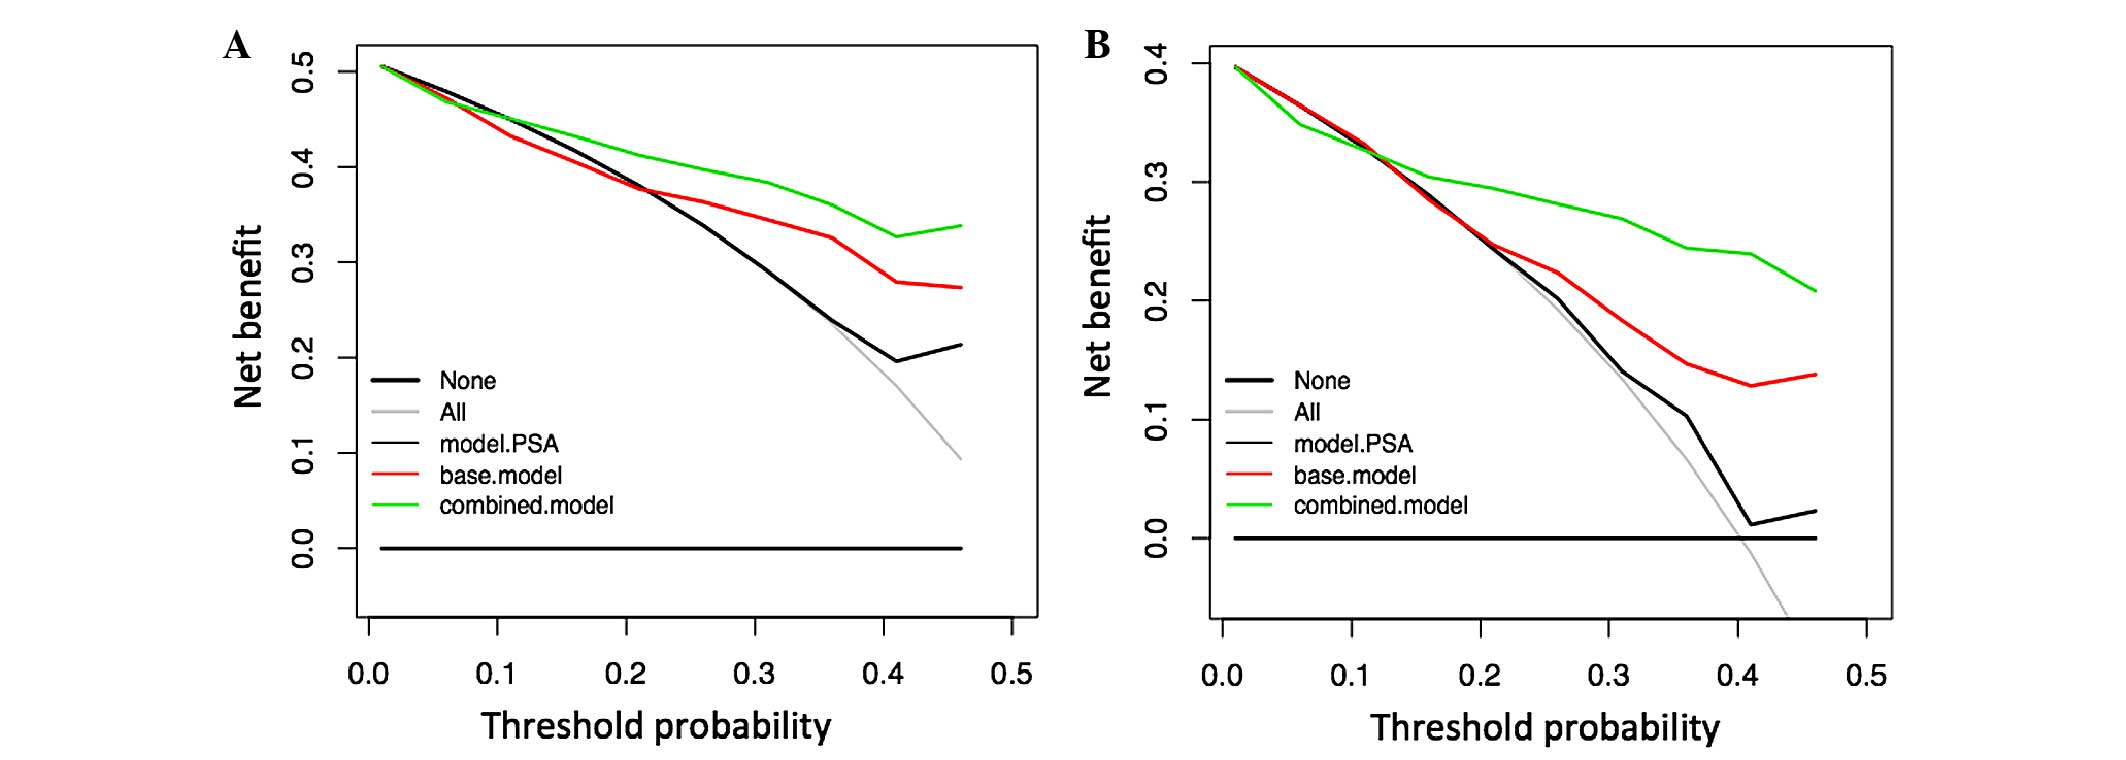
(Table III; Fig. 5). DCA showed that, across a range
of threshold probabilities of interest (10–50%), the highest net
benefit was achieved by using the combined model (Fig. 6). For example, at a threshold
probability of 26%, the combined model reached a net benefit of
0.40, which meant that performing a biopsy based on this model was
equivalent to a strategy aimed at identifying 40 cancers per 100
patients without performing any unnecessary biopsies, that is a
biopsies with a very high probability of being negative for the
presence of cancer cells. At this probability threshold, the
combined model produced the higher net reduction of 17 unnecessary
biopsies per 100 patients, in comparison with the decision based on
the PSA model, which had no net reduction, and the base model,
which only produced a net reduction of 7 biopsies. These results
suggested that adding the miR-100/200b score to the combined model
may reduce the number of biopsies with potentially negative
results.
| Table IIIAdjusted odds ratios and ROC results
for univariable and multivariable logistic regression models in the
entire cohort. |
Table III
Adjusted odds ratios and ROC results
for univariable and multivariable logistic regression models in the
entire cohort.
| Variable | OR | (95% CI) | P-value | Predictive
accuracy, % | AUC (CI) | Sensitivity | Specificity | P-value (vs.
PSA) |
|---|
| Univariable
logistic regression | | | | | | | | |
| Age | 1.056 | 1.01–1.11 | 0.001 | 59.4 | 0.613
(0.521–0.705) | 0.356 | 0.842 | 0.312 |
| PSA | 1.078 | 1.03–1.14 | 0.003 | 67.8 | 0.681
(0.593–0.769) | 0.698 | 0.657 | 1.000 |
| % free PSA | 0.884 | 0.823–0.942 | <0.001 | 68.5 | 0.710
(0.623–0.796) | 0.616 | 0.757 | 0.628 |
| DRE | 4.218 | 2.12–8.64 | <0.001 | 67.1 | 0.672
(0.595–0.749) | 0.643 | 0.700 | 0.164 |
| miR-100/200b | 1.621 | 1.32–2.05 | <0.001 | 75.5 | 0.738
(0.652–0.823) | 0.698 | 0.814 | 0.391 |
| Multivariable
logistic regression | | | | | | | | |
| Base model | | | | 75.5 | 0.816
(0.744–0.887) | 0.685 | 0.828 | 0.005 |
| Age | 1.09 | 1.032–1.153 | 0.002 | | | | | |
| PSA | 1.06 | 1.012–1.128 | 0.033 | | | | | |
| % free PSA | 0.876 | 0.809–0.942 | <0.001 | | | | | |
| DRE | 3.58 | 1.638–8.082 | 0.002 | | | | | |
| Base model +
miR-100/200b | | | | 81.8 | 0.876
(0.819–0.933) | 0.822 | 0.814 | <0.001 |
| Age | 1.097 | 1.036–1.170 | 0.002 | | | | | |
| PSA | 1.086 | 1.028–1.170 | 0.013 | | | | | |
| % free PSA | 0.886 | 0.817–0.951 | 0.002 | | | | | |
| DRE | 4.112 | 1.745–10.300 | 0.002 | | | | | |
| miR-100/200b | 1.814 | 1.400–2.460 | <0.001 | | | | | |
Inclusion of the urinary miR-100/200b
score enhances the predictive value regarding the prostate biopsy
outcome for patients with PSA levels in the gray zone
For the evaluation of the sub-group of patients with
PSA levels in the gray zone, age and miR-100/200b score were
independent prognostic factors of PCa, as determined by univariable
logistic regression analysis. Multivariable logistic regression
analysis showed that the combined model significantly improved the
prediction of PCa, compared to that using any of the variables
alone, and produced a gain in prediction accuracy of 9.1% compared
to that of the base model (Table
IV). ROC analysis indicated that specificity of the combined
model (0.956) was not superior to PSA levels (0.957). However, the
overall performance of the combined model was significantly
superior (sensitivity, 0.677; predictive accuracy, 84.4%), as
compared with PSA levels (sensitivity, 0.290; predictive accuracy,
68.8%; P<0.001) and the base model (sensitivity, 0.548;
predictive accuracy, 75.3%; P<0.001; Fig. 5).
| Table IVAdjusted odds ratios and ROC results
for univariable and multivariable logistic regression models in
diagnostic PSA gray zone. |
Table IV
Adjusted odds ratios and ROC results
for univariable and multivariable logistic regression models in
diagnostic PSA gray zone.
| Variable | OR | (95% CI) | P-value | Predictive
accuracy, % | AUC (CI) | Sensitivity | Specificity | P-value (vs.
PSA) |
|---|
| Univariable
logistic regression | | | | | | | | |
| Age | 1.071 | 1.011–1.140 | 0.038 | 68.8 | 0.642
(0.512–0.771) | 0.355 | 0.913 | 0.616 |
| PSA | 1.283 | 0.956–1.751 | 0.102 | 68.8 | 0.590
(0.456–0.724) | 0.290 | 0.957 | 1.000 |
| % free PSA | 0.917 | 0.832–0.997 | 0.058 | 74.0 | 0.691
(0.558–0.825) | 0.645 | 0.804 | 0.286 |
| DRE | 1.137 | 0.429–2.970 | 0.794 | 54.5 | 0.514
(0.405–0.624) | 0.355 | 0.674 | 0.427 |
| miR-100/200b | 2.606 | 1.720–4.451 | <0.001 | 80.5 | 0.827
(0.723–0.932) | 0.774 | 0.826 | 0.007 |
| Multivariable
logistic regression | | | | | | | | |
| Base model | | | | 75.3 | 0.749
(0.634–0.863) | 0.548 | 0.891 | 0.037 |
| Age | 1.117 | 1.039–1.210 | 0.005 | | | | | |
| PSA | 1.397 | 1.001–2.010 | 0.057 | | | | | |
| % free PSA | 0.890 | 0.800–0.974 | 0.019 | | | | | |
| DRE | 0.967 | 0.313–2.900 | 0.952 | | | | | |
| Base model +
miR-100/200b | | | | 84.4 | 0.868
(0.776–0.961) | 0.677 | 0.956 | <0.001 |
| Age | 1.087 | 0.998–1.201 | 0.066 | | | | | |
| PSA | 1.374 | 0.915–2.161 | 0.141 | | | | | |
| % free PSA | 0.919 | 0.815–1.021 | 0.125 | | | | | |
| DRE | 0.829 | 0.221–2.940 | 0.775 | | | | | |
| miR-100/200b | 2.464 | 1.580–4.400 | <0.001 | | | | | |
DCA analysis demonstrated that the combined model
produced a greater net benefit for patients with suspicious DRE
results who would opt for biopsy at a reasonable threshold
probability range of 10–50%, as compared with the use of PSA levels
alone or the base model (Fig. 6).
At a probability threshold of 26%, the use of the combined model
permits the identification 27 cancers per 100 patients, and reduces
the number of unnecessary biopsies by 26 per 100 patients. This is
in comparison with a decision based on the PSA levels or base
model, which produced a net reduction of only 2 and 8 biopsies,
respectively. These results indicate that the predictive
performance of the miR-100/200b score is similar for the sub-groups
of patients within the gray zone and for patients with abnormal DRE
results. However, using the miR-100/200b score is advantageous for
patients in the gray zone of PSA values.
Discussion
At present, abnormal PSA levels and suspicious DRE
results are the main criteria considered for decisions on
performing a prostate biopsy (27). In spite of being highly
tissue-specific, PSA is not PCa-specific and abnormal serum levels
of PSA may also be caused by indolent conditions such as BPH
(6). DRE is considered to be a
subjective parameter for identifying PCa (28) and almost 50% of prostate biopsies
performed to confirm a suspicion of PCa are negative and would thus
be unnecessary if more precise prediction tools were at hand.
Therefore, there is a requirement for novel methods to improve PCa
detection and to therefore minimize the rate of overdiagnosis.
Furthermore, it is desired to develop novel diagnostic tools with
minimal invasiveness to avoid the comorbidity associated with
prostate biopsy. While the risk of unrecognized PCa cannot be
completely ruled out (29), a
critical aspect of the present study was the identification of
patients with BPH by distinguishing them from patients with PCa
within a cohort with abnormal DRE results. For this set of BPH
patients, biopsy specimens were assessed and no evidence of cancer
was found. Of note, none of the patients from the BPH group had
high-grade prostatic intraepithelial neoplasia or atypical cellular
proliferation; therefore, no further biopsy was required. The goal
of the present study was to develop a non-invasive method to
identify the miRNA signature in the patients' urine to help to
distinguish clinically relevant PCa with a Gleason score of ≥7 from
indolent hyperplasia such as BPH.
Urine-based biomarkers are promising indicators of
PCa as they can be obtained by non-invasive methods and allow for
monitoring of tumors with heterogeneous foci (30). Recent studies paralleling the
present study have demonstrated the feasibility of measuring the
levels of miRNAs in urine from PCa patients and comparing them to
those of healthy controls or patients with BPH (19,20,24,31–33).
The present study confirmed that miRNAs can be readily detected in
urine from PCa and BPH patients. In a preliminary attempt, the
supernatant fraction remaining after a first centrifugation step
was used for miRNA analysis, according to the procedure of a
previous study (24). However, in
the present study, the RNA yield obtained by this procedure was
very low (<10 ng/µl). Instead, the use of the whole urine
sediment yielded higher RNA recovery and improved the detectability
of miRNAs by RT-qPCR. To reduce bias, urine specimens were
collected and processed as follows: i) Specimens were collected
immediately after prostate massage, ii) samples collected were a
minimum of 30 ml first-catch urine, iii) specimens with a dark,
inhomogeneous appearance and/or with a strong fetor were excluded
from the analysis and iv) RNA stabilization agent was added. After
establishment of the RT-qPCR detection method and verification of
its robustness, comprehensive miRNA profiling was performed with
the intention of identifying PCa-specific miRNAs in urine samples.
Notably, the overall abundance of miRNAs in urine samples from PCa
patients was higher, as compared with urine samples from BPH
patients. The reason for this is unclear and, after filtering out
miRNAs detected in PCa samples only, the global expression levels
of miRNAs in the Pca group were not significantly different, as
compared with the BPH group. Brase et al (17) assessed circulating miRNAs and made
a similar observation that various miRNAs were highly elevated in
the sera of patients with metastatic PCa in comparison to patients
with localized PCa. It is possible that a greater number of miRNA
molecules are secreted into the extracellular space with ongoing
progression of PCa. In fact, is increasing evidence suggested that
PCa cells actively secrete miRNAs and that the profile of the
miRNAs secreted dynamically changes as the disease progresses
(33,34). These findings further support the
use of miRNAs in urine as PCa-specific biomarkers.
The screening analysis of the present study revealed
a set of 18 miRNAs whose urine levels were significantly altered in
patients with PCa (FDR<0.05e). Among these miRNAs, miR-100 and
miR-200b were most significantly upregulated (P<0.05).
Furthermore, a positive correlation between miR-100 and miR-200b
was identified; therefore, the miRNA signature was described as the
miR-100/200b ratio. In order to measure the degree of correlation
between different variables and the outcome of prostate biopsy, an
unvariable logistic regression analysis was performed. The results
demonstrated that DRE, miR-100/200b score, age, PSA and % free PSA
were independent predictors of PCa. Two multivariable models were
then constructed: The base model, which comprised DRE, age, PSA and
% free PSA, and the combined model, which comprised all variables
in the base model plus the miR-100/200b score. The combined model
was a better predictor of the PCa diagnosis than the miRNA
signature alone or any individual clinical parameter. PSA levels
have a low predictive value in the diagnostic gray zone (4–10
ng/ml), and affected patients are currently subjected to prostate
biopsy, of which only an estimated 25% are then diagnosed with PCa
(35). Therefore, the use of more
specific biomarkers to distinguish patients with BPH from those
with PCa may spare them from unnecessary biopsies. Of note, the
results of the present study indicated that, for patients with
serum PSA values in the gray zone, the predictive accuracy and
performance of the miR-100/200b signature alone was similar to that
for the entire cohort. However, the combined model significantly
outperformed all other models, indicating that adding the
miR-100/200b signature to the base model increased the accuracy of
PCa detection within the gray zone, where the clinical decision on
whether or not to perform a biopsy remains controversial.
In addition to the assessment of the accuracy in
predicting PCa, the clinical benefit of the miRNA signature as part
of the combined model was assessed and compared with PSA alone and
the base model. For this purpose, DCA was performed, which provided
a method allowing for the qualification and identification of the
best prediction model to ensure that a biopsy is performed only in
patients with a reasonably high probability of positive PCa
diagnosis (36). The results
showed that the combined model provides a higher net benefit at
threshold probabilities of 10–50%, a reasonable range of
probabilities to perform a biopsy at the cost of the risk of
overtreatment. Of note, the reduction of unnecessary biopsies was
maximized within the same threshold probabilities. From a clinical
perspective, the performance of the combined model for
distinguishing PCa from BPH is more crucial in patients with PSA
levels in the gray zone. Here, the net benefit was also present
within the defined threshold probabilities and a substantial number
of potentially negative biopsies may be avoided, providing a
greater clinical benefit for this sub-group of patients.
Further molecular markers have been previously
evaluated for the diagnosis of PCa. The non-coding RNA PCA3 and the
TMPRSS2: ERG gene fusion transcript are the most representative
examples of urine biomarkers (37,38).
Although PCA3 has been proven to outperform PSA and free % PSA, the
most noteworthy benefit has only been demonstrated in patients who
have already undergone biopsies with a negative result (39). However, TMPRSS2: ERG, which can
also be detected in urine samples, has a positive predictive value
for PCa of as high as 94%. However, one important drawback in the
use of TMPRSS2: ERG is its variable frequency in different
populations (6). Despite the
efforts to increase the detection rate of PCa, even combining the
two transcripts, limitations regarding their sensitivity remain,
and their performance is far from being outstanding, particularly
at discriminating indolent from significant PCa. One important
feature that contributes to the robustness of the use of miRNAs in
urine samples as biomarkers is their relatively superior stability
for longer time periods in comparison to that of mRNAs (24). The present study was able to detect
mRNAs and measure their abundance in the urine samples. However,
there are some important limitations of using mRNAs as biomarkers:
First, the Ct values of mRNAs are higher and decay rapidly, as
compared with miRNAs; secondly, their Ct values exhibit a high
degree of variation, as was observed for KLK3 in the present study.
All of these factors may contribute to the lower reproducibility of
mRNAs in urine. Future experiments may be performed to compare the
predictive performance of PCA3 and TMPRSS2: ERG with that of the
miRNA signature identified in the present study, using the same
cohort of patients. In addition, it may be useful to assess the
predictive performance of a single model combining all of these
biomarkers, with the aim of further enhancing the specificity of
the diagnosis.
The present study demonstrated that the elevation of
miR-100 and miR-200b levels in urine samples is significantly
associated with the presence of advanced PCa. Consistent with this
observation, it has been reported that miR-100 is upregulated in
high-grade prostate intraepithelial neoplasia, as compared with
benign tissue, and remained elevated during the carcinogenic
process (40), and that its
overexpression was independently correlated with the biochemical
recurrence of PCa (41). In
contrast, downregulation of miR-100 has previously been described
for hormone-refractory PCa (14).
Regarding the presence of miR-100 in biological fluids, a recent
study found that miR-100 was upregulated in sera from patients with
metastatic castration resistant prostate cancer (mCRPC), as
compared with healthy controls. Although miR-100 was not further
validated as a predictor marker to mCRPC, the authors showed that
miR-100 was among nine miRNAs that were significantly elevated in
mCRPC (42). Supporting this
notion, Mitchell et al (43) reported an increase in miR-100
expression in the plasma of PCa patients. Furthermore, their
increased levels were correlated with poor prognosis. In addition,
it has been shown that members of the miR-99 family, including
miR-100, have a role in enhancing the sensitivity to radiation in
PCa cells (44), reinforcing the
value of miR-100 as a marker of PCa.
In conclusion, the present study discovered and
validated a urinary miRNA-based signature for enhancing the
accuracy of diagnosis of PCa, and to distinguish patients with
abnormal DRE results and BPH to spare them from unnecessary biopsy.
To the best of our knowledge, the present study was the first
describing the use of urinary miR100 and miR-200b levels in
combination with clinical parameters to detect the presence of PCa.
Similar to the validation process of other biomarkers, this
signature requires validation in an independent dataset in order to
better evaluate its clinical value.
Acknowledgments
The authors would like to thank Dr Ignacio Camacho
at the Chemistry School of The National Autonomous University of
Mexico for reviewing this paper and giving helpful suggestions, and
to Dr Sandra Romero-Cordoba at the Oncogenomics Laboratory of The
National Institute of Genomic Medicine for technical assistance.
The present study was supported by CONACYT (grant nos. 363368 and
177687). Dr Alberto Ivan Salido-Guadarrama wishes to thank the
Programa de Doctorado en Ciencias Biomédicas-UNAM for providing
academic support.
References
|
1
|
Torre LA, Bray F, Siegel RL, Ferlay J,
Lortet-Tieulent J and Jemal A: Global cancer statistics, 2012. CA
Cancer J Clin. 65:87–108. 2015. View Article : Google Scholar : PubMed/NCBI
|
|
2
|
De Marzo AM, DeWeese TL, Platz EA, Meeker
AK, Nakayama M, Epstein JI, Isaacs WB and Nelson WG: Pathological
and molecular mechanisms of prostate carcinogenesis: Implications
for diagnosis, detection, prevention, and treatment. J Cell
Biochem. 91:459–477. 2004. View Article : Google Scholar : PubMed/NCBI
|
|
3
|
Schröder FH, Hugosson J, Roobol MJ,
Tammela TL, Ciatto S, Nelen V, Kwiatkowski M, Lujan M, Lilja H,
Zappa M, et al: Screening and prostate-cancer mortality in a
randomized European study. N Engl J Med. 360:1320–1328. 2009.
View Article : Google Scholar : PubMed/NCBI
|
|
4
|
Shappell SB: Clinical utility of prostate
carcinoma molecular diagnostic tests. Rev Urol. 10:44–69.
2008.PubMed/NCBI
|
|
5
|
Dall'Era MA, Albertsen PC, Bangma C,
Carroll PR, Carter HB, Cooperberg MR, Freedland SJ, Klotz LH,
Parker C and Soloway MS: Active surveillance for prostate cancer: A
systematic review of the literature. Eur Urol. 62:976–983. 2012.
View Article : Google Scholar : PubMed/NCBI
|
|
6
|
Romero Otero J, Garcia Gomez B, Campos
Juanatey F and Touijer KA: Prostate cancer biomarkers: An update.
Urol Oncol. 32:252–260. 2014. View Article : Google Scholar : PubMed/NCBI
|
|
7
|
Mao G, Liu Y, Fang X, Liu Y, Fang L, Lin
L, Liu X and Wang N: Tumor-derived microRNA-494 promotes
angiogenesis in non-small cell lung cancer. Angiogenesis.
18:373–382. 2015. View Article : Google Scholar : PubMed/NCBI
|
|
8
|
Kulshreshtha R, Ferracin M, Wojcik SE,
Garzon R, Alder H, Agosto-Perez FJ, Davuluri R, Liu CG, Croce CM,
Negrini M, et al: A microRNA signature of hypoxia. Mol Cell Biol.
27:1859–1867. 2007. View Article : Google Scholar :
|
|
9
|
Katz B, Reis ST, Viana NI, Morais DR,
Moura CM, Dip N, Silva IA, Iscaife A, Srougi M and Leite KR:
Comprehensive study of gene and microRNA expression related to
epithelial-mesenchymal transition in prostate cancer. PLoS One.
9:e1137002014. View Article : Google Scholar : PubMed/NCBI
|
|
10
|
Wang Y, Kim S and Kim IM: Regulation of
Metastasis by microRNAs in Ovarian Cancer. Front Oncol. 4:1432014.
View Article : Google Scholar : PubMed/NCBI
|
|
11
|
Bouyssou JM, Manier S, Huynh D, Issa S,
Roccaro AM and Ghobrial IM: Regulation of microRNAs in cancer
metastasis. Biochim Biophys Acta. 1845:255–265. 2014.PubMed/NCBI
|
|
12
|
Fang YX and Gao WQ: Roles of microRNAs
during prostatic tumorigenesis and tumor progression. Oncogene.
33:135–147. 2014. View Article : Google Scholar
|
|
13
|
Ambs S, Prueitt RL, Yi M, Hudson RS, Howe
TM, Petrocca F, Wallace TA, Liu CG, Volinia S, Calin GA, et al:
Genomic profiling of microRNA and messenger RNA reveals deregulated
microRNA expression in prostate cancer. Cancer Res. 68:6162–6170.
2008. View Article : Google Scholar : PubMed/NCBI
|
|
14
|
Porkka KP, Pfeiffer MJ, Waltering KK,
Vessella RL, Tammela TL and Visakorpi T: MicroRNA expression
profiling in prostate cancer. Cancer Res. 67:6130–6135. 2007.
View Article : Google Scholar : PubMed/NCBI
|
|
15
|
Salido-Guadarrama I, Romero-Cordoba S,
Peralta-Zaragoza O, Hidalgo-Miranda A and Rodriguez-Dorantes M:
MicroRNAs transported by exosomes in body fluids as mediators of
intercellular communication in cancer. Onco Targets Ther.
7:1327–1338. 2014.PubMed/NCBI
|
|
16
|
Moltzahn F, Olshen AB, Baehner L, Peek A,
Fong L, Stöppler H, Simko J, Hilton JF, Carroll P and Blelloch R:
Microfluidic-based multiplex qRT-PCR identifies diagnostic and
prognostic microRNA signatures in the sera of prostate cancer
patients. Cancer Res. 71:550–560. 2011. View Article : Google Scholar :
|
|
17
|
Brase JC, Johannes M, Schlomm T, Fälth M,
Haese A, Steuber T, Beissbarth T, Kuner R and Sültmann H:
Circulating miRNAs are correlated with tumor progression in
prostate cancer. Int J Cancer. 128:608–616. 2011. View Article : Google Scholar
|
|
18
|
Park NJ, Zhou H, Elashoff D, Henson BS,
Kastratovic DA, Abemayor E and Wong DT: Salivary microRNA:
Discovery, characterization, and clinical utility for oral cancer
detection. Clin Cancer Res. 15:5473–5477. 2009. View Article : Google Scholar : PubMed/NCBI
|
|
19
|
Srivastava A, Goldberger H, Dimtchev A,
Ramalinga M, Chijioke J, Marian C, Oermann EK, Uhm S, Kim JS, Chen
LN, et al: MicroRNA profiling in prostate cancer-the diagnostic
potential of urinary miR-205 and miR-214. PLoS One. 8:e769942013.
View Article : Google Scholar
|
|
20
|
Sapre N, Hong MK, Macintyre G, Lewis H,
Kowalczyk A, Costello AJ, Corcoran NM and Hovens CM: Curated
microRNAs in urine and blood fail to validate as predictive
biomarkers for high-risk prostate cancer. PLoS One. 9:e917292014.
View Article : Google Scholar : PubMed/NCBI
|
|
21
|
Eissa S, Habib H, Ali E and Kotb Y:
Evaluation of urinary miRNA-96 as a potential biomarker for bladder
cancer diagnosis. Med Oncol. 32:4132015. View Article : Google Scholar
|
|
22
|
Haj-Ahmad TA, Abdalla MA and Haj-Ahmad Y:
Potential urinary miRNA biomarker candidates for the accurate
detection of prostate cancer among benign prostatic hyperplasia
patients. J Cancer. 5:182–191. 2014. View
Article : Google Scholar : PubMed/NCBI
|
|
23
|
Groskopf J, Aubin SM, Deras IL, Blase A,
Bodrug S, Clark C, Brentano S, Mathis J, Pham J, Meyer T, et al:
APTIMA PCA3 molecular urine test: Development of a method to aid in
the diagnosis of prostate cancer. Clin Chem. 52:1089–1095. 2006.
View Article : Google Scholar : PubMed/NCBI
|
|
24
|
Lewis H, Lance R, Troyer D, Beydoun H,
Hadley M, Orians J, Benzine T, Madric K, Semmes OJ, Drake R and
Esquela-Kerscher A: miR-888 is an expressed prostatic
secretions-derived microRNA that promotes prostate cell growth and
migration. Cell Cycle. 13:227–239. 2014. View Article : Google Scholar :
|
|
25
|
Livak KJ and Schmittgen TD: Analysis of
relative gene expression data using real-time quantitative PCR and
the 2(-Delta Delta C(T)) Method. Methods. 25:402–408. 2001.
View Article : Google Scholar
|
|
26
|
Suyundikov A, Stevens JR, Corcoran C,
Herrick J, Wolff RK and Slattery ML: Incorporation of subject-level
covariates in quantile normalization of miRNA data. BMC Genomics.
16:10452015. View Article : Google Scholar : PubMed/NCBI
|
|
27
|
Ukimura O, Coleman JA, de la Taille A,
Emberton M, Epstein JI, Freedland SJ, Giannarini G, Kibel AS,
Montironi R, Ploussard G, et al: Contemporary role of systematic
prostate biopsies: Indications, techniques, and implications for
patient care. Eur Urol. 63:214–230. 2013. View Article : Google Scholar
|
|
28
|
Loeb S, Han M, Roehl KA, Antenor JA and
Catalona WJ: Accuracy of prostate weight estimation by digital
rectal examination versus transrectal ultrasonography. J Urol.
173:63–65. 2005. View Article : Google Scholar
|
|
29
|
Levy DA and Jones JS: Management of rising
prostate-specific antigen after a negative biopsy. Curr Urol Rep.
12:197–202. 2011. View Article : Google Scholar : PubMed/NCBI
|
|
30
|
Jamaspishvili T, Kral M, Khomeriki I,
Student V, Kolar Z and Bouchal J: Urine markers in monitoring for
prostate cancer. Prostate Cancer Prostatic Dis. 13:12–19. 2010.
View Article : Google Scholar
|
|
31
|
Korzeniewski N, Tosev G, Pahernik S,
Hadaschik B, Hohenfellner M and Duensing S: Identification of
cell-free microRNAs in the urine of patients with prostate cancer.
Urol Oncol. 33:16.e17–e22. 2015. View Article : Google Scholar
|
|
32
|
Stephan C, Jung M, Rabenhorst S, Kilic E
and Jung K: Urinary miR-183 and miR-205 do not surpass PCA3 in
urine as predictive markers for prostate biopsy outcome despite
their highly dysregulated expression in prostate cancer tissue.
Clin Chem Lab Med. 53:1109–1118. 2015. View Article : Google Scholar : PubMed/NCBI
|
|
33
|
Kim J, Morley S, Le M, Bedoret D, Umetsu
DT, Di Vizio D and Freeman MR: Enhanced shedding of extracellular
vesicles from amoeboid prostate cancer cells: Potential effects on
the tumor microenvironment. Cancer Biol Ther. 15:409–418. 2014.
View Article : Google Scholar : PubMed/NCBI
|
|
34
|
Hessvik NP, Phuyal S, Brech A, Sandvig K
and Llorente A: Profiling of microRNAs in exosomes released from
PC-3 prostate cancer cells. Biochim Biophys Acta. 1819:1154–1163.
2012. View Article : Google Scholar : PubMed/NCBI
|
|
35
|
Schröder FH, Raaijmakers R, Postma R, van
der Kwast TH and Roobol MJ: 4-year prostate specific antigen
progression and diagnosis of prostate cancer in the European
randomized study of screening for prostate cancer, section
Rotterdam. J Urol. 174:489–494; discussion 493–494. 2005.
View Article : Google Scholar : PubMed/NCBI
|
|
36
|
Fitzgerald M, Saville BR and Lewis RJ:
Decision curve analysis. JAMA. 313:409–410. 2015. View Article : Google Scholar : PubMed/NCBI
|
|
37
|
Tomlins SA: Urine PCA3 and TMPRSS2: ERG
using cancer-specific markers to detect cancer. Eur Urol.
65:543–545. 2014. View Article : Google Scholar
|
|
38
|
Cornu JN, Cancel-Tassin G, Egrot C,
Gaffory C, Haab F and Cussenot O: Urine TMPRSS2: ERG fusion
transcript integrated with PCA3 score, genotyping, and biological
features are correlated to the results of prostatic biopsies in men
at risk of prostate cancer. Prostate. 73:242–249. 2013. View Article : Google Scholar
|
|
39
|
Roobol MJ, Schröder FH, van Leeuwen P,
Wolters T, van den Bergh RC, van Leenders GJ and Hessels D:
Performance of the prostate cancer antigen 3 (PCA3) gene and
prostate-specific antigen in prescreened men: Exploring the value
of PCA3 for a first-line diagnostic test. Eur Urol. 58:475–481.
2010. View Article : Google Scholar : PubMed/NCBI
|
|
40
|
Leite KR, Tomiyama A, Reis ST,
Sousa-Canavez JM, Sañudo A, Camara-Lopes LH and Srougi M: MicroRNA
expression profiles in the progression of prostate cancer - from
high-grade prostate intraepithelial neoplasia to metastasis. Urol
Oncol. 31:796–801. 2013. View Article : Google Scholar
|
|
41
|
Leite KR, Tomiyama A, Reis ST,
Sousa-Canavez JM, Sañudo A, Dall'Oglio MF, Camara-Lopes LH and
Srougi M: MicroRNA-100 expression is independently related to
biochemical recurrence of prostate cancer. J Urol. 185:1118–1122.
2011. View Article : Google Scholar : PubMed/NCBI
|
|
42
|
Cheng HH, Mitchell PS, Kroh EM, Dowell AE,
Chéry L, Siddiqui J, Nelson PS, Vessella RL, Knudsen BS, Chinnaiyan
AM, et al: Circulating microRNA profiling identifies a subset of
metastatic prostate cancer patients with evidence of
cancer-associated hypoxia. PLoS One. 8:e692392013. View Article : Google Scholar : PubMed/NCBI
|
|
43
|
Mitchell PS, Parkin RK, Kroh EM, Fritz BR,
Wyman SK, Pogosova-Agadjanyan EL, Peterson A, Noteboom J, O'Briant
KC, Allen A, et al: Circulating microRNAs as stable blood-based
markers for cancer detection. Proc Natl Acad Sci USA.
105:10513–10518. 2008. View Article : Google Scholar : PubMed/NCBI
|
|
44
|
Mueller AC, Sun D and Dutta A: The miR-99
family regulates the DNA damage response through its target SNF2H.
Oncogene. 32:1164–1172. 2013. View Article : Google Scholar
|