Introduction
Lung cancer is the leading cause of cancer-related
mortality in men and women, resulting in ~221,130 new cases and
156,940 deaths in the United States, and ~1.3 million deaths per
year worldwide. Non-small cell lung cancer (NSCLC) accounts for
~85% of all lung cancers, and the 5-year survival of patients with
metastatic NSCLC is <10% (1–3).
Brain metastasis (BM) is a frequent occurrence in
NSCLC patients. The BM incidence ranges from 17 to 54% as the first
site of recurrence in 15–40% of cases (4–6), and
this risk is >50% in patients with small cell lung cancer
(SCLC). Although most patients achieved some palliation, surgery,
and chemotherapy >50% of them succumbed due to intracranial
progression, and the median survival was 3–6 months (7–11). BM
is therefore a common and devastating event in NSCLC patients with
a poor outcome regardless of the treatment administered.
Biomarkers are critical to early diagnosis and
prediction and monitoring of progressive lesions. BM is the main
cause of treatment failure. If BM can be predicted at an early
stage, then effective prevention may be initiated and result in an
improvement in survival. Few studies have focused on the
correlation between biomarkers and BM, while none have been
routinely used clinically. It is, therefore, crucial to identify
more reliable and feasible novel biomarkers for BM of NSCLC. The
present study assessed the diagnostic and prognostic value of
cyclase-associated protein 1 (CAP1) to predict the risk of BM in
NSCLC in order to screen patients at high risk of BM for early
intervention.
Patients and methods
Ethical considerations
The study was reviewed and approved by the
Institutional Ethics Committee of the Shanghai Tenth People’s
Hospital of Tongji University and was conducted in compliance with
the Helsinki Declaration. Written informed consent was obtained
from all subjects.
Patients selection
Patients with NSCLC were considered eligible if they
had stable disease or better (i.e., complete or partial response)
after potentially curative therapy, defined as high-dose thoracic
radiation therapy (RT, >30 Gy) or surgery. Radiation was
administered with or without neoadjuvant, adjuvant, or concurrent
chemotherapy. Pre- or post-operative RT and/or chemotherapy were
acceptable. Therapy had to have been completed within 10 weeks of
study entry. Patients were restaged with computed tomography (CT)
scan of the chest and abdomen and magnetic resonance imaging (MRI)
of the brain and bone within 3 weeks of study entry.
Contrast-enhanced CT of the brain and bone was considered
acceptable if MRI was contraindicated and if performance for
pretreatment assessment was required for follow-up imaging.
Patients were not required to have evidence of
progressive intrathoracic disease, brain metastases, bone
metastases, or visceral metastases. Any acute or subacute grade ≥3
toxicities from previous therapy were required to have decreased to
grade ≤2 at the time of study entry.
Follow-up and database construction
The patients were stratified by age (≤65 and >65
years), Zubrod performance status (0 and >0), histology
(adenocarcinoma and non-adenocarcinoma), T-stage (T1, T2, T3 and
T4), N-stage (N0, N1, N2 and N3), tumor size (≤3 and >3 cm), and
therapy (surgery or none). Samples were collected from June, 2008
to December, 2009 at Shanghai Tenth People’s Hospital, and were
followed up until December 2013.
The patients were followed up regularly by
designated staff, who collected all the information in a central
database. The patients were followed 3–4 times a year in the first
2 years, and once every six months in the following 2 years. The
last follow-up visit was on December, 2013. The basic demographic
and clinical characteristics of initial and outcome patient
variables, including age, gender, Zubrod performance status,
histopathology, stage, tumor size and prior
chemotherapy/RT/surgery, are shown in Table I.
 | Table IThe basic demographic and clinical
characteristics of initial and outcome patient variables. |
Table I
The basic demographic and clinical
characteristics of initial and outcome patient variables.
| Initial patient
characteristics: 120 evaluable patients | Outcome patient
characteristic after 4-year follow-up |
|---|
|
|
|
|---|
| Variables | Patients (n) | Percentage (%) | Brain metastasis
(n=50), n (%) | Non-brain metastasis
(n=70), n (%) | P-value |
|---|
| Gender |
| Male | 77 | 64.17 | 32 (64.00) | 45 (64.30) | |
| Female | 43 | 35.83 | 18 (36.00) | 25 (35.70) | 0.974 |
| Age (years) |
| ≤65 | 80 | 66.67 | 31 (62.00) | 32 (45.70) | |
| >65 | 40 | 33.33 | 19 (38.00) | 38 (54.30) | 0.078 |
| Zubrod performance
status | | | | | NAa |
| 0 | 56 | 46.67 | 26 | 30 | |
| 1 | 54 | 45.0 | 17 | 37 | |
| 2 | 6 | 5 | 4 | 2 | |
| 3 | 1 | 0.83 | 1 | 0 | |
| Unknown | 3 | 2.5 | 2 | 1 | |
| 0 | 56 | 46.67 | 26 (52.00) | 30 (42.90) | |
| >0 | 64 | 53.33 | 24 (48.00) | 40 (57.10) | 0.322 |
| Histopathology | | | | | NAa |
| Adenocarcinoma | 49 | 40.83 | 24 | 25 | |
| Squamous cell
carcinoma | 25 | 20.83 | 10 | 15 | |
| Large-cell
undifferentiated | 15 | 12.5 | 6 | 9 | |
| Combined/mixed | 0 | 0 | 0 | 0 | |
| Non-small cell
carcinoma, NOS | 29 | 24.17 | 9 | 20 | |
| Other | 2 | 1.7 | 1 | 1 | |
| Adenocarcinoma | 49 | 40.83 | 24 (48.00) | 25 (35.70) | |
|
Non-adenocarcinoma | 71 | 59.17 | 26 (52.00) | 45 (64.30) | 0.177 |
| T-stage | | | | | NAa |
| T1 | 25 | 20.83 | 10 | 15 | |
| T2 | 35 | 29.17 | 11 | 24 | |
| T3 | 34 | 28.3 | 19 | 15 | |
| T4 | 26 | 21.7 | 10 | 16 | |
| N-stage | | | | | NAa |
| N0 | 51 | 42.5 | 17 | 34 | |
| N1 | 14 | 11.7 | 9 | 5 | |
| N2 | 43 | 35.8 | 18 | 25 | |
| N3 | 12 | 10 | 6 | 7 | |
| Tumor size (T)
(cm) |
| ≤3 | 66 | 55.0 | 24 (48.00) | 42 (60.00) | |
| >3 | 54 | 45.0 | 26 (52.00) | 28 (40.00) | 0.193 |
| Prior
chemotherapy/RT | | | | | NAa |
|
Chemotherapy/RT | 106 | 88.3 | 44 | 62 | |
| Chemotherapy
alone | 4 | 3.3 | 3 | 1 | |
| RT alone | 10 | 8.3 | 3 | 7 | |
| Prior surgery |
| No | 64 | 53.3 | 30 (60.00) | 33 (47.10) | |
| Yes | 56 | 46.7 | 20 (40.00) | 37 (52.90) | 0.164 |
| Entire prior
therapy regimen | | | | | NAa |
| RT and
chemotherapy | 58 | 48.3 | 28 | 30 | |
| RT only | 6 | 5 | 4 | 2 | |
| Surgery and
chemotherapy | 2 | 1.7 | 1 | 1 | |
| Surgery and
RT | 4 | 3.3 | 2 | 2 | |
| Surgery, RT and
chemotherapy | 50 | 41.7 | 15 | 35 | |
Pulmonary metastasis analysis and biopsy
specimen collection
Specimens of 39 brain metastasis, and 70
non-metastasis patients who underwent surgical resection for
neoplastic, at the Shanghai Tenth People’s Hospital (Shanghai,
China), were collected after follow up between 2009 and 2013.
Cancer types and stages were determined based on results from
laboratory tests, X-rays, as well as CT, brain and MRI scans.
Biopsy specimens were collected at surgery, snap-frozen in liquid
nitrogen and stored at −80°C until analysis.
H&E and immunohistochemical (IHC) SP
assay
H&E sections were examined under a microscope to
identify and mark the cancer nests. The formalin-fixed and
paraffin-embedded (FFPE) sections were dewaxed in xylene and
rehydrated in graded ethanol. Endogenous peroxidase activity was
blocked by soaking in 0.3% hydrogen peroxide. The sections were
then processed in 10 mmol/l citrate buffer (pH 6.0) and heated to
121°C in an autoclave for 20 min to retrieve the antigen. After
rinsing in phosphate-buffered saline (PBS) (pH 7.2), 10% goat serum
was applied for 1 h at room temperature to block any non-specific
reactions. The sections were then incubated overnight at 4°C with
anti-CAP1 (diluted at 1:500; mouse anti-human monoclonal antibodies
against CAP1 was provided by Dr Zhou, University of Pennsylvania
School of Medicine (Philadelphia, PA, USA). All the slides were
processed using the peroxidase-antiperoxidase method (Dako,
Hamburg, Germany). After rinsing with PBS, the peroxidase reaction
was visualized by incubating the sections with diaminobenzidine
tetrahydrochloride in 0.05 mol/l Tris buffer (pH 7.6) containing
0.03% H2O2. After rinsing in water, the
sections were counterstained with hematoxylin, dehydrated and
cover-slipped. Stained sections were observed under a microscope.
At least 10 high-power fields were randomly chosen, and ≥400
cells/field were counted.
Staining results were independently assessed by two
pathologists, who were blind to the specimens. The immunoreactive
intensity in the test tissue specimens was graded by the difference
against the intensity in endothelial cells in the positive control
group: 0, negative; 1 (weak), weaker than epithelial cells; 2
(moderate), the same as epithelial cells; 3 (strong), stronger than
epithelial cells. A staining score of 2 or 3 was considered
CAP1-positive.
Western blot analysis
Tissue samples were immediately homogenized in
buffer containing 1 M Tris-HCl (pH 7.5), 1% Triton X-100, 1% NP-40
(Nonidet P-40), 10% sodium dodecyl sulfate (SDS), 0.5% sodium
deoxycholate, 0.5 M EDTA, 10 mg/ml leupeptin, 10 mg/ml aprotinin
and 1 mM PMSF. The samples were centrifuged at 10,000 × g for 30
min to collect the supernatant. Proteins were mixed with loading
and DTT (4:5:1) twice, boiled in water for 5–10 min and cooled in
ice. Protein concentrations were determined using a Bio-Rad protein
assay (Bio-Rad, Hercules, CA, USA), and following total protein
quantification, the lysates were loaded onto 10% polyacrylamide-SDS
gels, separated by electrophoresis and blotted onto NC membrane
blots using a semi-dry transfer system. The blots were incubated
with a mouse anti-human CAP1 antibody and a mouse anti-human actin
antibody (both from Sigma, St. Louis, MO, USA) at 4°C overnight.
After washing, the blots were incubated with horseradish
peroxidase-conjugated secondary antibodies at room temperature for
45 min. The immunoreactive signals for CAP1 and actin were
visualized using the ECL system from GE Healthcare UK, Ltd. (Little
Chalfont, Buckinghamshire, UK) and subjected to densitometric
analyses using ImageJ software (National Institutes of Health,
Bethesda, MD, USA). Relative levels of CAP1 (after adjustment
against actin) were determined based on the densitometric data.
Quantitative PCR
Total RNA was isolated from biopsy specimens using
an RNA extraction kit from Isogen (Nippon Gene Co., Ltd., Toyama,
Japan). RNA samples were treated with DNase I (Promega Corp.,
Madison, WI, USA) to remove genomic DNA. First-strand cDNAs were
synthesized using a commercial First-Strand cDNA Synthesis kit as
per the manufacturer’s instructions. PCR amplifications of the test
gene CAP1 and the reference gene glyceraldehyde-3-phosphate
dehydrogenase (GAPDH) were performed using the primers,
forward: 5′-ACT CGC TGC TTG CTG GTC-3′ and reverse: 5′-ATG GGT GCC
AAC AAA TCG-3′, designed based on the human CAP1 mRNA sequence
(GenBank accession no. BT007152) and the primers, forward: 5′-GAA
GGT GAA GGT CGG AGTC-3′ and reverse: 5′-CCC GAA TCA CAT TCT CCA AGA
A-3′, designed based on the human GAPDH cDNA sequence (GenBank
access no. X01677). The reactions were carried out with the
SYBR-Green PCR Core Reagents kit (Perkin-Elmer Applied Biosystems,
Foster City, CA, USA). The PCR amplification parameters were: 50°C
for 2 min (one cycle), 95°C for 10 min (one cycle), 95°C for 15 sec
and 60°C for 1 min (40 cycles). The emission intensity of the
SYBR-Green fluorescence was measured as real-time using the ABI
PRISM 7700 Sequence Detector from Perkin-Elmer Applied Biosystems.
Relative quantification of CAP1 mRNA abundance was performed using
the DataAssist software (Life Technologies, Grand Island, NY,
USA).
Statistical analysis
Statistical analysis was performed using SPSS
version 20.0. Categorical data expressed as a percentage were
analyzed using the χ2 test. Multivariate Cox
proportional hazard and logistic regression analysis models were
utilized to determine the correlations between CAP1 expression and
various clinicopathological variables. The models were also
examined by the receiver operating characteristics (ROC) analysis.
For analysis of survival data, Kaplan-Meier curves were
constructed. Differences were considered significant when
P<0.05. The results are expressed as the mean ± standard error
(SE).
Results
Findings of previous and recent
studies
In a recent study, Tan et al (12) demonstrated that the relative CAP1
mRNA abundance, expressed as the CAP1/GAPDH ratio, was
significantly higher in neoplastic tissues than in control
specimens (P=0.028), and in metastatic than in non-metastatic lung
cancer specimens (P=0.016). A comparison performed between
histological types showed that squamous cell carcinoma (SCC)
specimens had slightly higher CAP1 mRNA abundance than
adenocarcinoma (AD) specimens, although the difference did not
reach a statistically significant level (P=0.227) (Fig. 1).
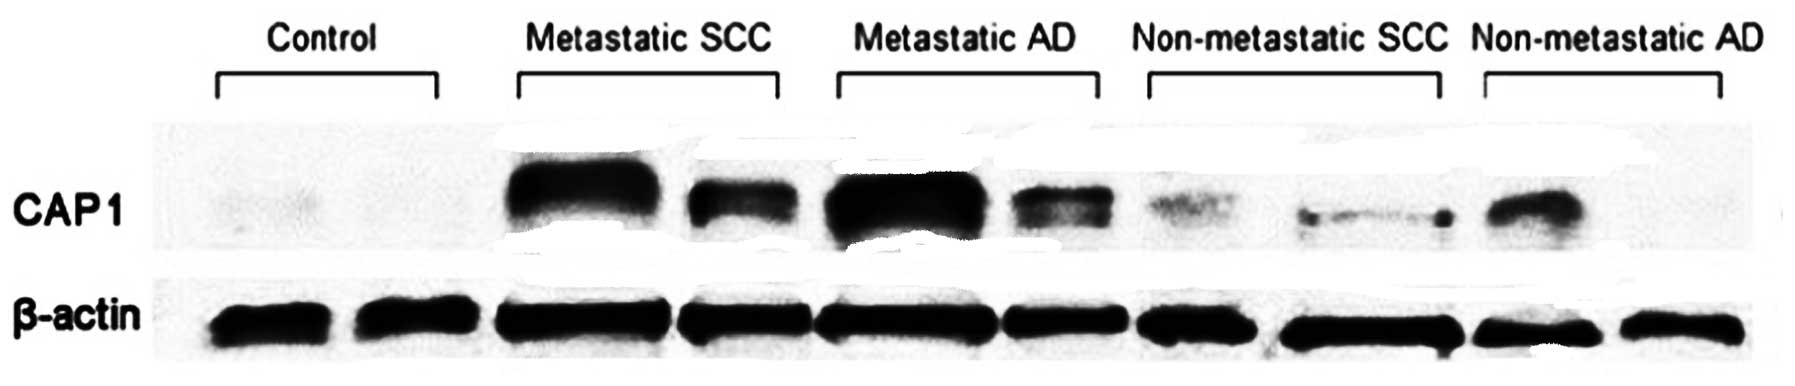
In addition, CAP1 protein levels in biopsy specimens
were determined by western blot analysis. The relative CAP1 protein
level was significantly elevated in lung cancer patients
(0.7527±0.2767) as compared to non-neoplastic control subjects
(0.3476±0.1713, P=0.002). It was also significantly elevated in
metastatic lung tumors (0.8941±0.1442) as compared to
non-metastatic lung tumors (0.4701±0.2647, P=0.002). The CAP1
protein level was slightly higher in SCC than in AD specimens
(0.7440±0.2911 vs. 0.7601±0.2757, P=0.891), although the difference
was not significant (P>0.05) (Fig.
2).
The results of western blot analysis were even more
apparent in brain metastasis of SCC and AD as compared to other
metastatic groups such as the bone- and visceral-meta-static groups
(Fig. 3). Therefore, experiments
were conducted to elucidate this phenomenon.
Demographic characteristics
Patient samples were collected from June, 2008 to
December, 2009, and patients were followed up until December 2013.
The patients were followed up 3–4 times a year in the first 2
years, and once every six months in the following 2 years. Of the
156 patients included in this study, 17 SCLC patients were
ineligible, 11 patients withdrew consent and the 128 patients
remaining were followed up for 4-years. Eight of the 128 patients
were lost to follow-up, while data from 120 cases of NSCLC patients
were analyzed. After the 4-year follow up, we analyzed outcome
patient characteristics including 50 cases with brain metastasis,
and 70 cases without brain metastasis (Fig. 4).
All the patients had complete resection of the tumor
and were staged according to UICC 1999. The patients included 77
males and 43 females, aged 63.24 (range, 30–85) years. Pathological
examination showed 49 cases of adenocarcinoma, and 71 cases of
non-adenocarcinoma. After the 4-year follow up, the 50 cases of
brain metastasis were designated as the brain metastasis group. The
remaining 70 cases with bone, visceral or without metastasis were
defined as the non-brain metastasis group. No statistically
significant difference was found between the brain metastasis and
non-brain metastasis groups in terms of clinical and pathological
factors (Table I).
Correlation between immunoreactive CAP1
signals and cancer metastasis
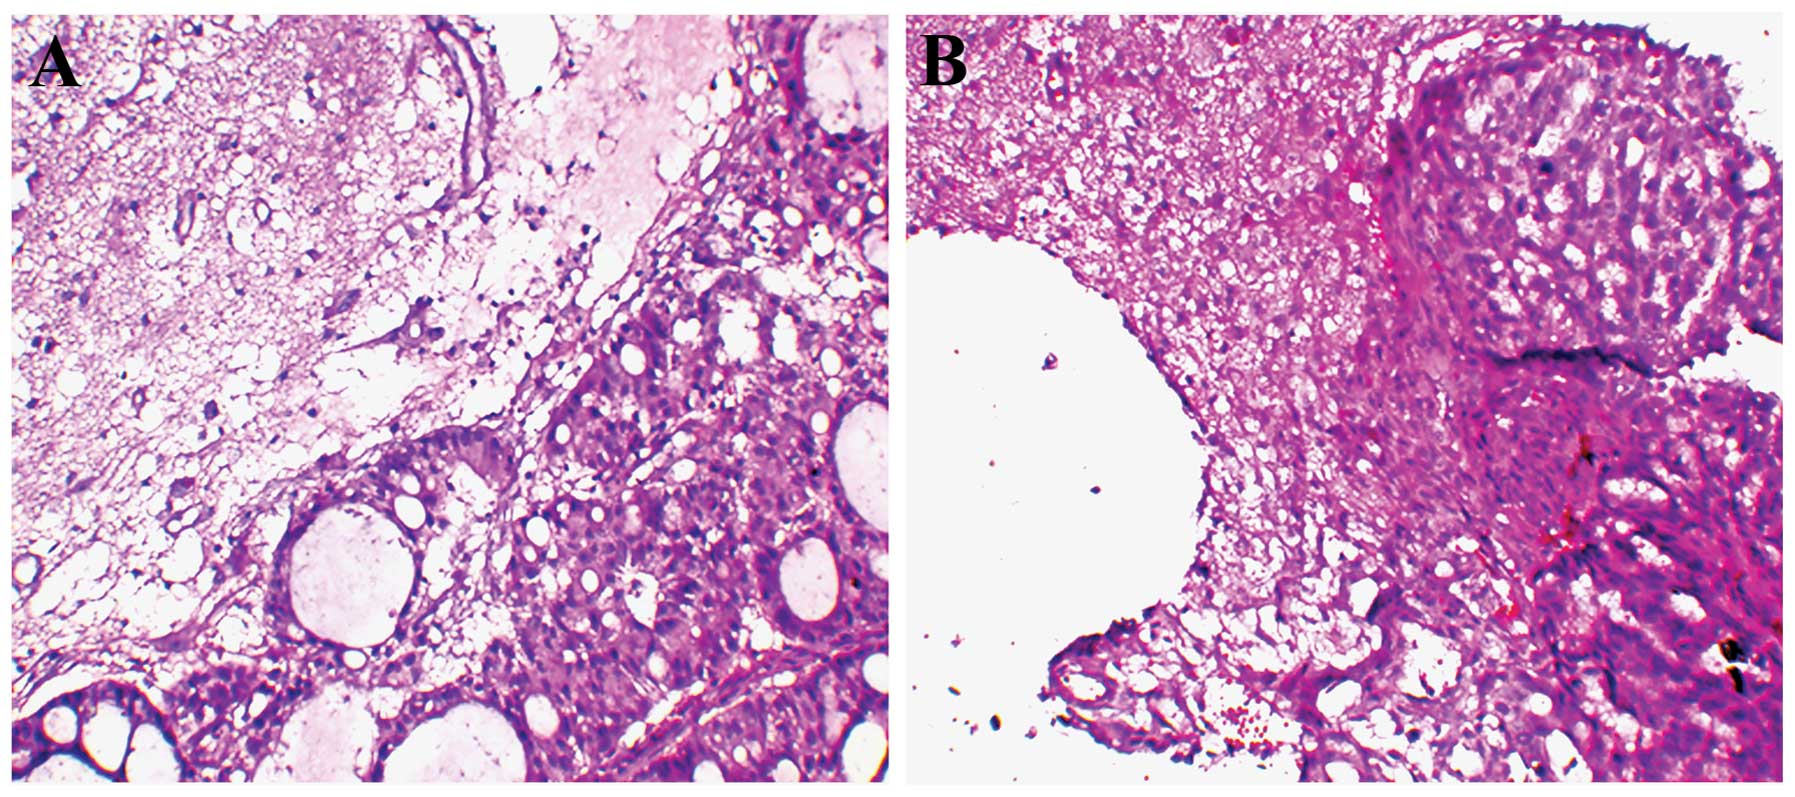
H&E sections were initially examined under a
microscope to identify and mark the cancer nest brain specimens
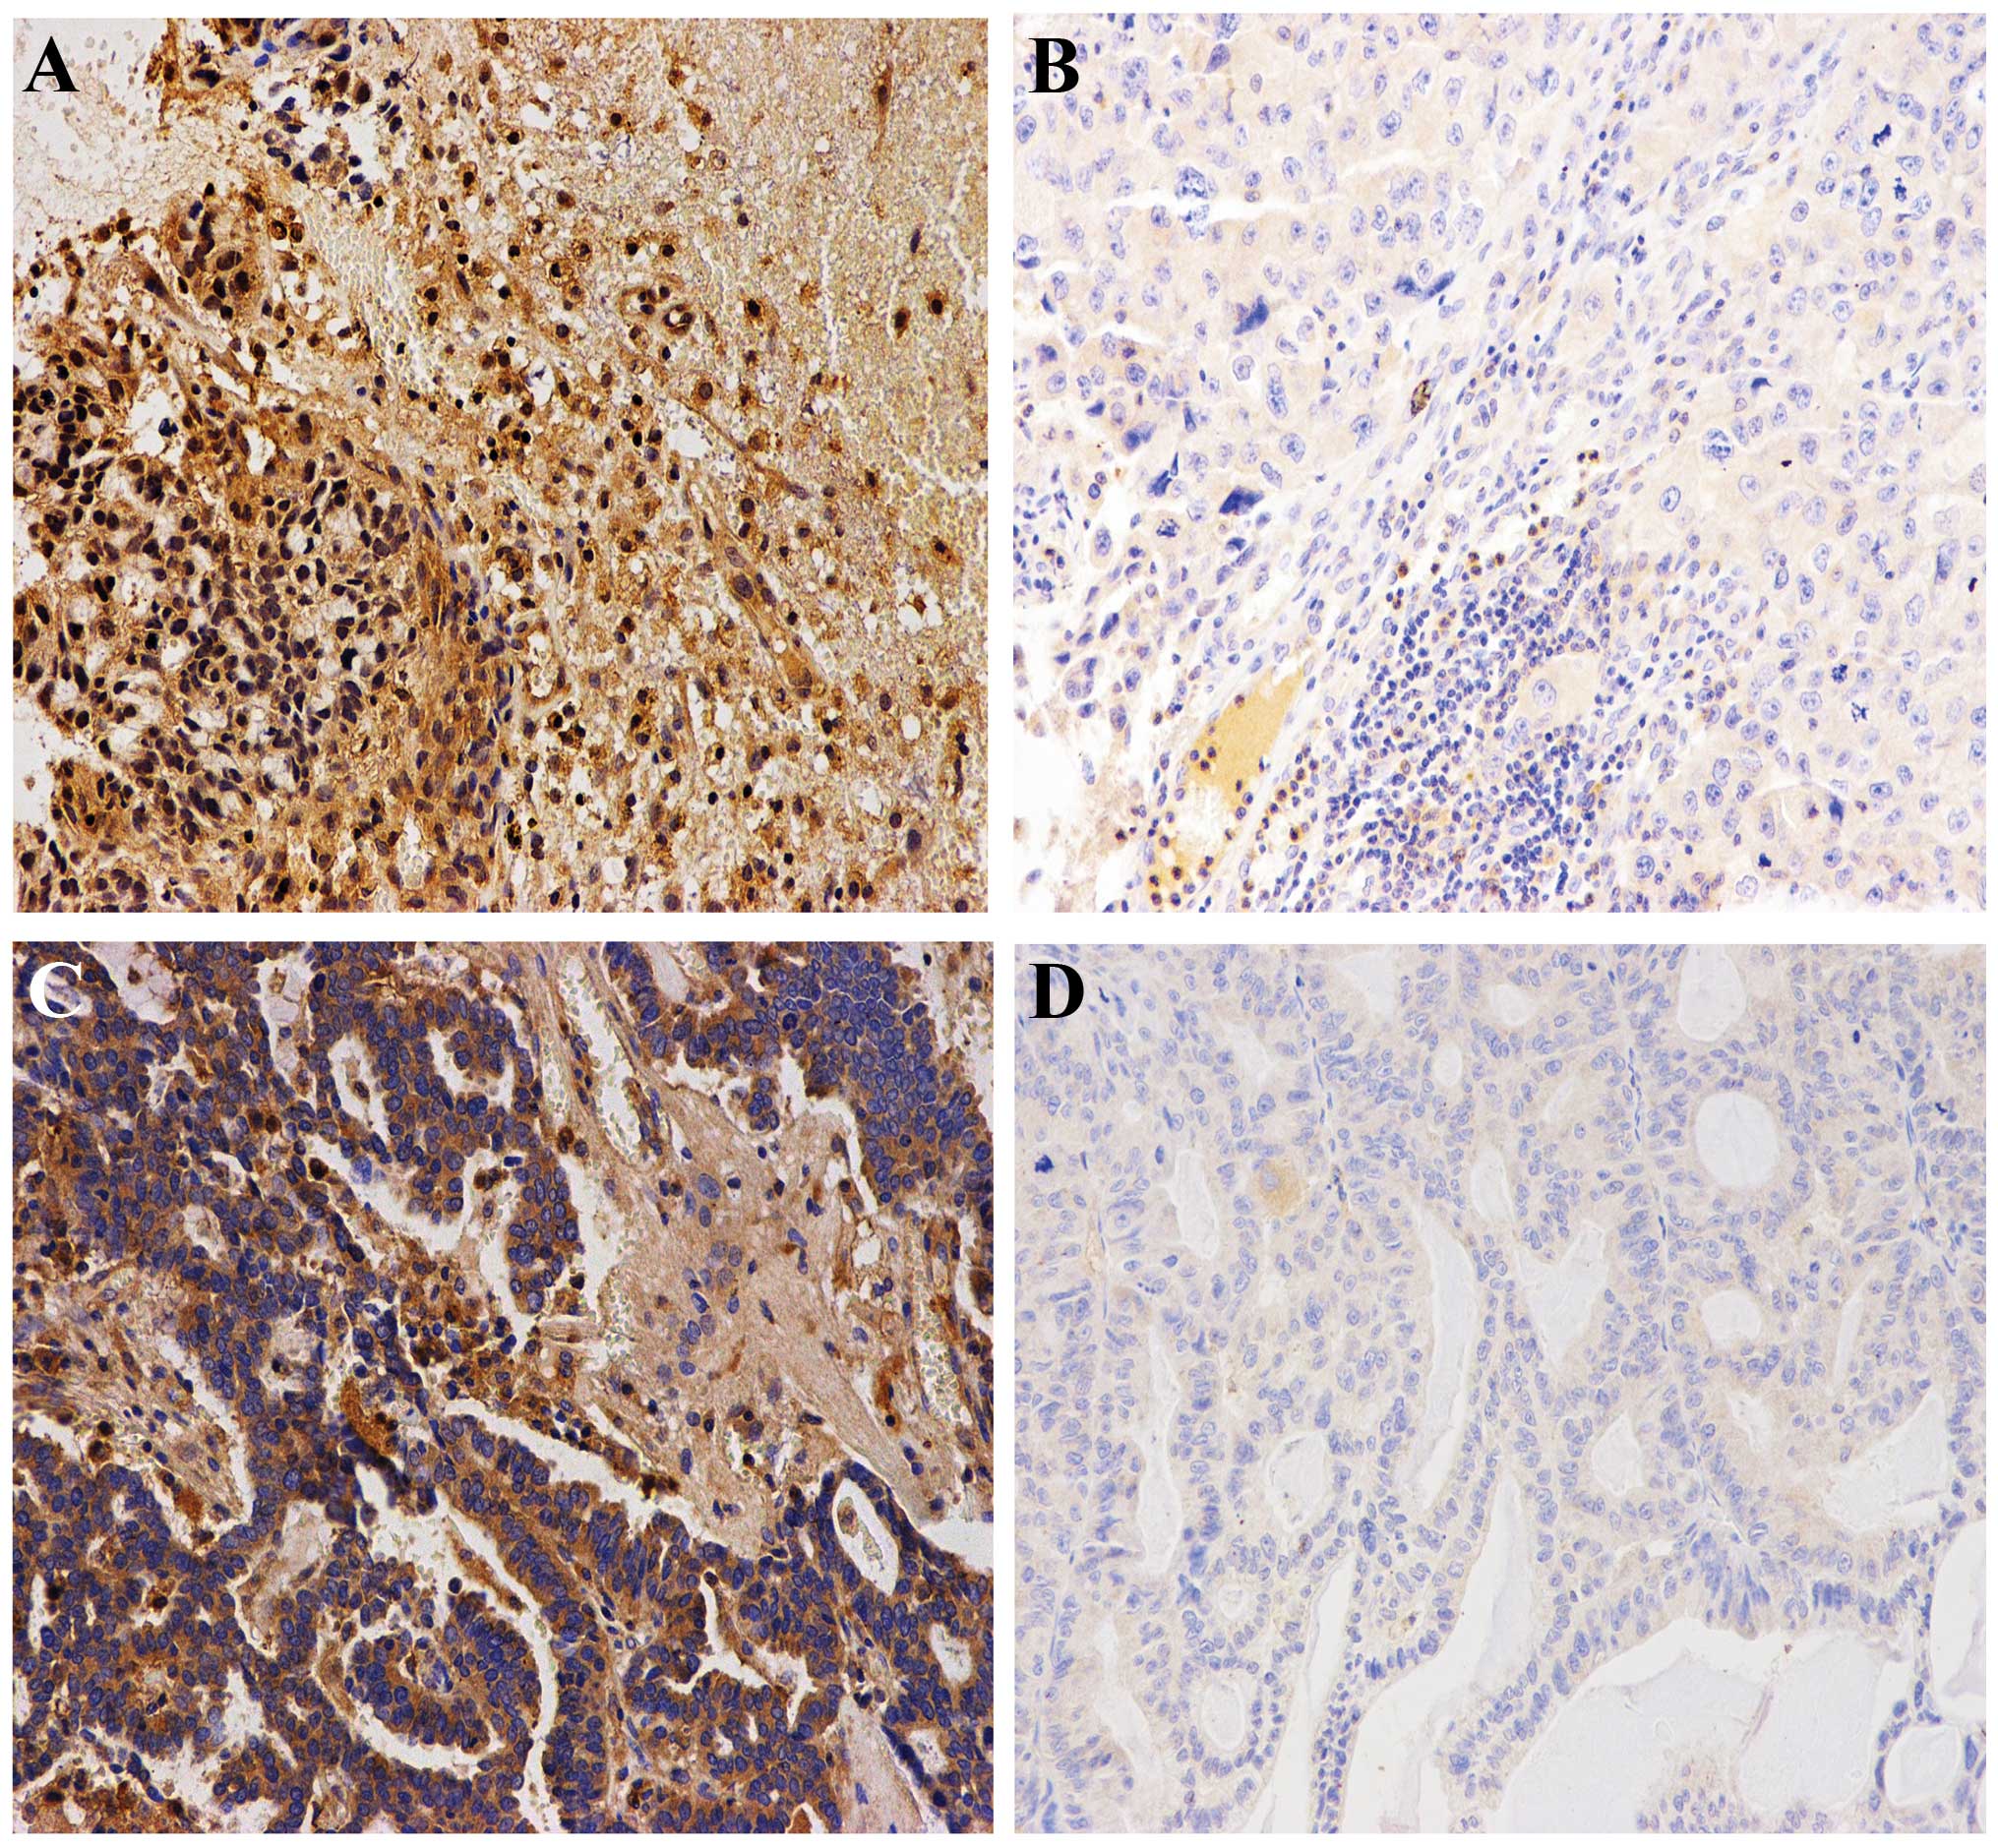
(Fig. 5). CAP1 associated with
brain metastasis was assessed by immunohistochemical analysis. The
χ2 test showed that CAP1 was associated with brain
metastasis (P<0.01) (Table II).
Immunoreactive CAP1 was detected in the cytoplasm of cancer cells
in all 39 brain metastasis samples. It was found that CAP1
immunoreactivity was highly expressed in lung cancer with brain
metastasis but was weakly expressed in lung cancer tissues without
brain metastasis. In addition, when CAP1 was highly expressed in
lung tissues, it was also highly expressed in brain tissues
(Fig. 6).
| Table IICorrelation between immunoreactive
CAP1 signals and brain metastasis. |
Table II
Correlation between immunoreactive
CAP1 signals and brain metastasis.
| Biomarkers | Brain metastasis, n
(%) | Non-brain
metastasis, n (%) | P-value |
|---|
| CAP1 + | 31 (79.5) | 23 (32.9) | <0.01 |
| CAP1 − | 8 (20.5) | 47 (67.1) | |
The 39 brain samples were classified into a
CAP1-negative group, where the tumor staining score was 0 or 1, and
a CAP1-positive group, where the tumor staining score was 2 or 3.
The relationship between clinicopathological background and IHC of
CAP1 expression is shown in Table
III. Increased expression of CAP1 exhibited a significant
correlation with tumor sizes (P=0.02), while there were no
correlations between CAP1 and age, gender, histopathology, adjuvant
chemotherapy and adjuvant RT. In addition, a multivariate Cox
proportional hazard model was constructed comparing factors
including age, grade, tumor size, histopathology, adjuvant
chemotherapy, adjuvant RT and CAP1 expression. CAP1 expression and
tumor size were independent prognostic factors in NSCLC patients
with brain metastasis (P<0.01 and P=0.047, respectively)
(Table IV).
| Table IIICAP1 expression and
clinicopathological characteristics in 39 brain specimens. |
Table III
CAP1 expression and
clinicopathological characteristics in 39 brain specimens.
|
Characteristics | Total, n (%) | CAP1-negative | CAP1-positive,
n | P-value |
|---|
| Gender |
| Male | 25 (64.1) | 10 | 15 | 0.729 |
| Female | 14 (35.9) | 4 | 10 | |
| Age (years) |
| ≤65 | 24 (61.5) | 10 | 14 | 0.274 |
| >65 | 15 (38.5) | 4 | 11 | |
| Histopathology |
|
Adenocarcinoma | 18 (46.2) | 5 | 13 | 0.261 |
|
Non-adenocarcinoma | 21 (53.8) | 9 | 12 | |
| Tumor size (T)
(cm) |
| ≤3 | 20 (51.3) | 12 | 8 | 0.02 |
| >3 | 19 (48.7) | 2 | 17 | |
| Adjuvant
chemotherapy |
| Yes | 20 (51.3) | 5 | 15 | 0.131 |
| No | 19 (48.7) | 9 | 10 | |
| Adjuvant radiation
therapy |
| Yes | 17 (43.6) | 6 | 11 | 0.607 |
| No | 22 (56.4) | 8 | 14 | |
| Table IVContribution of various potential
prognostic factors to survival by Cox regression analysis in 39
brain specimens. |
Table IV
Contribution of various potential
prognostic factors to survival by Cox regression analysis in 39
brain specimens.
| Values | B | SE | Wald | P-value | Exp (B) | 95% CI for Exp (B)
lower-upper |
|---|
| Gender | 0.386 | 0.302 | 1.486 | 0.223 | 1.445 | 0.800–2.611 |
| Age | 0.045 | 0.360 | 0.016 | 0.900 | 1.046 | 0.516–2.120 |
| Histopathology | 10.285 | 0.332 | 0.739 | 0.390 | 1.330 | 0.694–2.547 |
| Tumor size (T)
(cm) | 1.126 | 0.568 | 3.936 | 0.047a | 3.083 | 1.014–9.379 |
| Adjuvant
chemotherapy | 1.120 | 0.735 | 2.323 | 0.127 | 3.065 | 0.726–12.944 |
| Adjuvant radiation
therapy | 0.320 | 0.291 | 1.209 | 0.272 | 1.377 | 0.778–2.437 |
| Expression of
CAP1 | 1.757 | 0.400 | 19.238 | <0.01b | 5.793 | 2.642–12.700 |
Establishment of the prediction model of
brain metastasis
The ROC analysis (Fig.
7) suggested that the area under the curve was 73.33%
(P<0.01; 95% CI, 63.5–83.2%). When P=0.466, the sensitivity and
specificity reached 79.5 and 67.1%, respectively. Thus, P≥0.466 can
be used as the screening indicator in this model to identify
patients at high risk of brain metastasis in NSCLC.
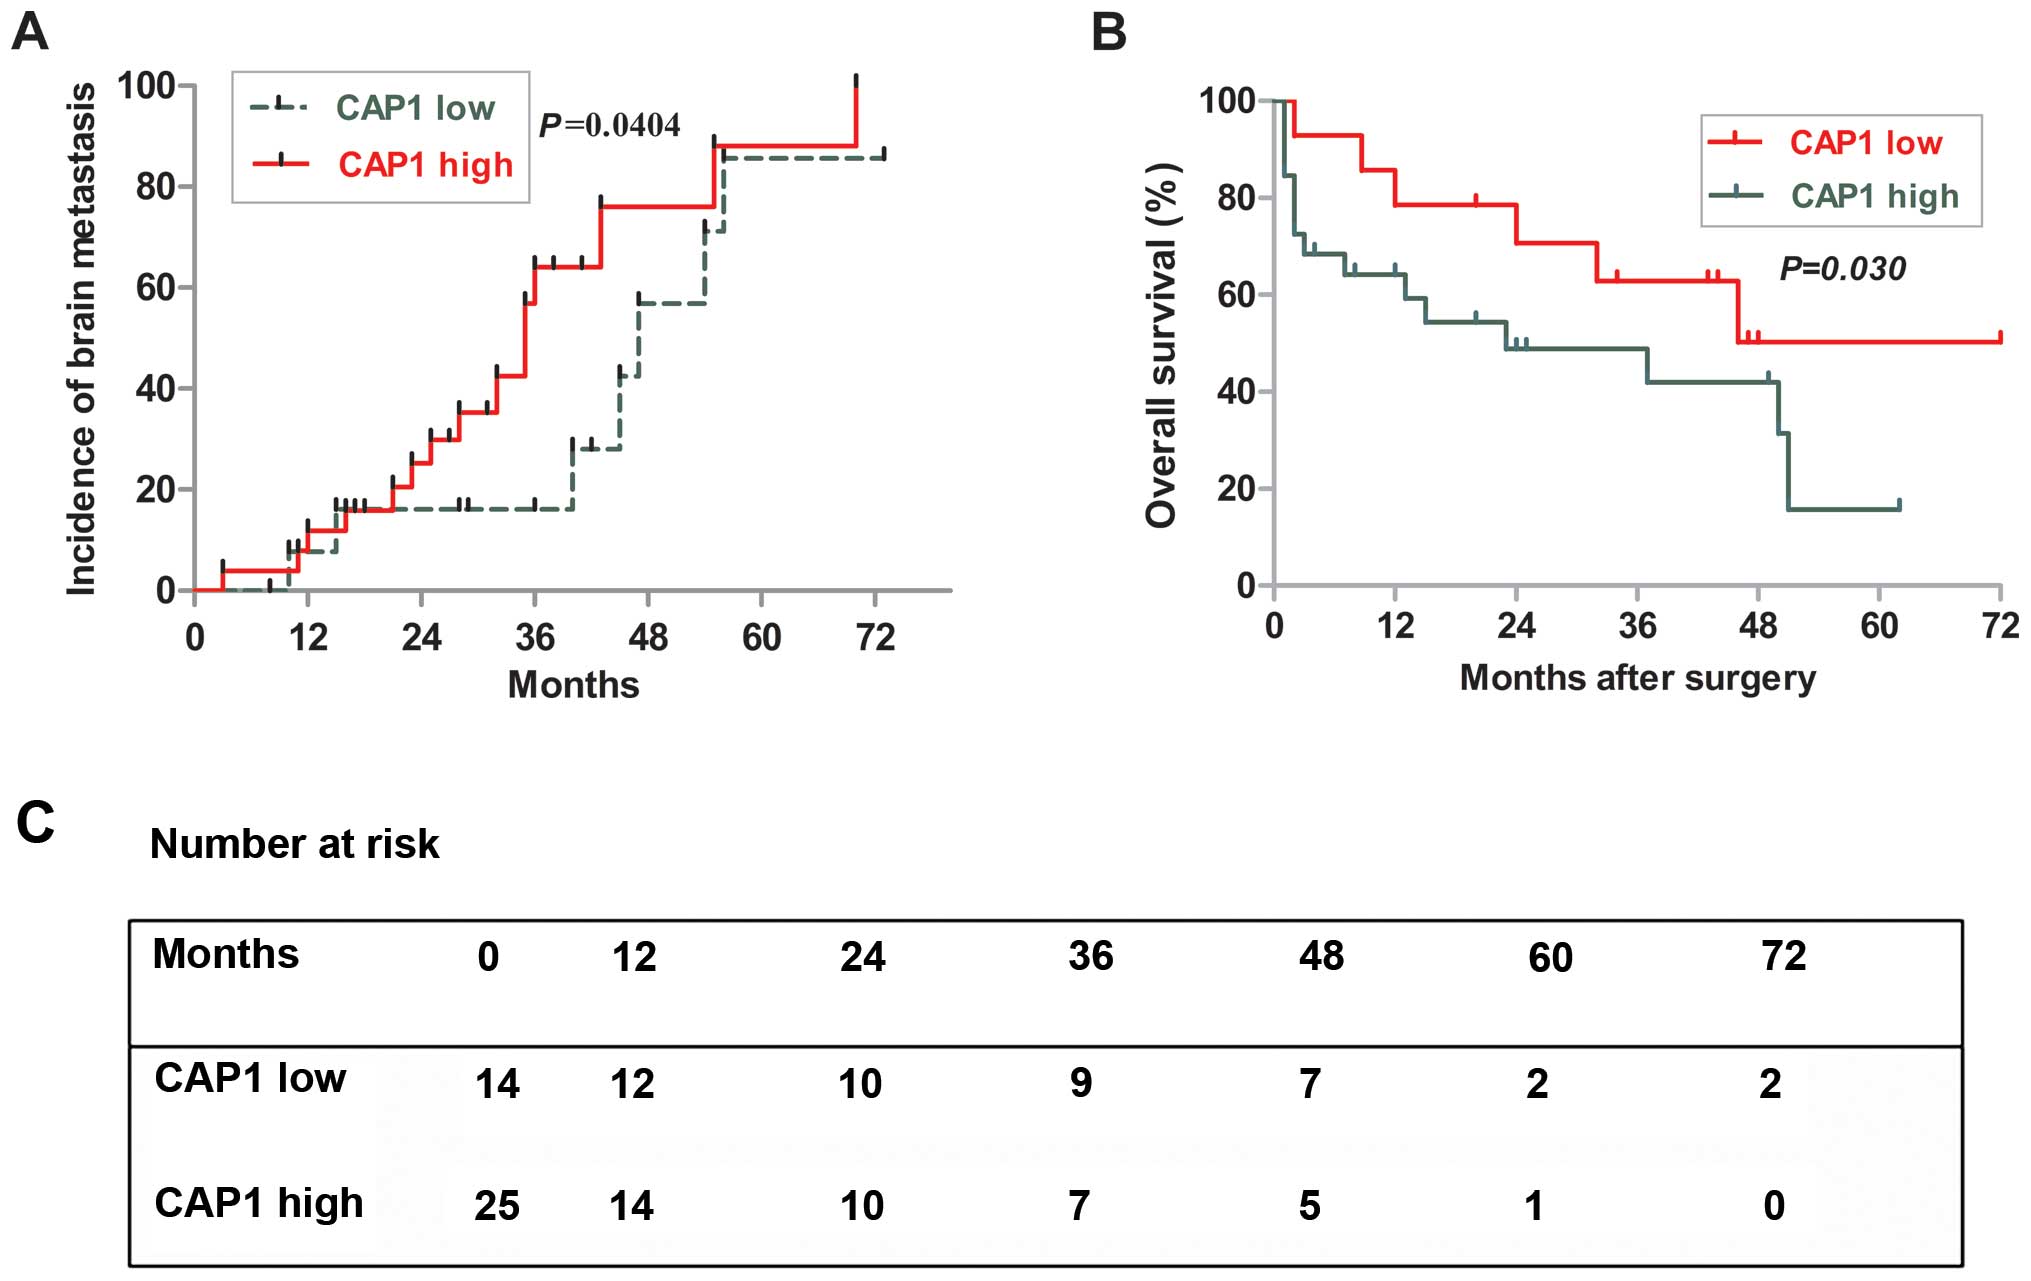
CAP1 overexpression is associated with
poor prognosis
The Kaplan-Meier survival analysis revealed the poor
outcome of patients in the high-level CAP1-expression group
(Fig. 8B and C), and 5-year
survival rates were 19 and 59% in the high- and low-level groups
(P=0.030, log-rank test). In addition, although the time-adjusted
incidence of brain metastasis did not significantly differ between
the high and low expression of CAP1, the low CAP1 appeared to delay
the onset of late brain metastasis (P=0.0404) (Fig. 8A). These results indicated that the
expression level of CAP1 is associated with tumor size, which can
be associated with shorter survival of NSCLC patients with brain
metastasis.
Discussion
Between 25 and 40% of NSCLC patients reportedly
develop BM during the course of their disease. The majority of BM
(80%) generally occur in the cerebral hemispheres, 15% in the
cerebellum, and 5% in the brainstem (13). BM patients frequently require
therapeutic intervention in the form of RT, surgery and
chemotherapy, which may considerably add to the cost of their
end-of-life care. In addition, BM from NSCLC is associated with
numerous negative effects on the patient quality of life and
survival. At the present time, there are no proven treatments for
cognitive impairment following brain cancer and no known effective
preventive strategies.
Adenylate CAP1 is an actin monomer-binding protein
coded by the CAP1 gene (14), which was originally cloned from
budding yeast and is located downstream of the ras gene
(15). Human homology of CAP1 was
identified in the early 1990s (16). Both mammal and yeast CAPs interact
with actin (17) and play a role in
actin turnover (18). Given the
critical role for actin filament reorganization in cell migration
and the regulatory role for CAP1 in actin filament reorganization
(19,20), it may be hypothesized that CAP1 is
associated with tumor metastasis. However, only a few studies have
reported CAPs in mammalian cells and human cancer (21). The involvement of CAP1 in the
aggressive behavior of pancreatic cancer cells has been reported
(21). In this study, the
relationship between the expression of CAP1 and the migration of BM
was identified.
To evaluate the association of CAP1 and BM, we first
assessed CAP1 gene expression at the protein level in brain
metastases of SCC and AD as compared to other metastatic groups,
such as bone- and visceral-metastatic subjects by western blot
analysis. The results clearly demonstrated that CAP1 gene
transcription was significantly elevated in brain metastasis
patients and the elevation was more pronounced in AD lung cancer
patients. To further evaluate the correlation between CAP1
expression and BM of NSCLC, 120 NSCLC patients were employed from
June, 2008 to December, 2009, and were followed up until December,
2013. The results show that 50 patients developed BM while the 70
remaining patients developed other types of metastasis. In the
present study, stronger immunoreactive CAP1 signals were detected
in the perinuclear cytoplasm of BM in NSCLC in the biopsy
specimens. The IHC analyses identified CAP1 overexpression in BM of
NSCLC from the multivariate regression analysis. As a result, CAP1
was involved in BM. Furthermore, the result of the ROC curve
demonstrated that CAP1 can establish the prediction model of BM. In
addition, the ratio of BM, Kaplan-Meier survival and the high and
low expression of CAP1 was analyzed.
To the best of our knowledge, this is the first
study undertaken to evaluate the relationship between biomarker
CAP1 and BM in NSCLC patients. Although the results are noteworthy,
the limitations of this study should be acknowledged. This study
was limited to a small number of NSCLC patients. In the future, a
large-scale study focusing on different stages may be useful to
assess the value of this prediction model.
In conclusion, the diagnostic and prognostic value
of CAP1 was shown to be commonly overexpressed, and to predict the
risk of BM in NSCLC in order to screen the patients at high risk of
BM for early intervention. Taken together, our data have shown that
CAP1 is a novel prognostic biomarker in BM of NSCLC.
Acknowledgements
This study was funded by the National Natural
Science Foundation of China (nos. 81172229 and 81100018).
References
|
1
|
Siegel R, Ward E, Brawley O and Jemal A:
Cancer statistics: the impact of eliminating socioeconomic and
racial disparities on premature cancer deaths. CA Cancer J Clin.
61:212–236. 2011. View Article : Google Scholar : PubMed/NCBI
|
|
2
|
Walling J: Chemotherapy for advanced
non-small-cell lung cancer. Respir Med. 88:649–657. 1994.
View Article : Google Scholar : PubMed/NCBI
|
|
3
|
Govindan R, Page N, Morgensztern D, et al:
Changing epidemiology of small-cell lung cancer in the United
States over the last 30 years: analysis of the surveillance,
epidemiologic, and end results database. J Clin Oncol.
24:4539–4544. 2006. View Article : Google Scholar : PubMed/NCBI
|
|
4
|
Strauss GM, Herndon JE, Sherman DD, et al:
Neoadjuvant chemotherapy and radiotherapy followed by surgery in
stage IIIA non-small-cell carcinoma of the lung: report of a Cancer
and Leukemia Group B phase II study. J Clin Oncol. 10:1237–1244.
1992.PubMed/NCBI
|
|
5
|
Albain KS, Rusch VW, Crowley JJ, et al:
Concurrent cisplatin/etoposide plus chest radiotherapy followed by
surgery for stages IIIA (N2) and IIIB non-small-cell lung cancer:
mature results of Southwest Oncology Group phase II study 8805. J
Clin Oncol. 13:1880–1892. 1995.PubMed/NCBI
|
|
6
|
Andre F, Grunenwald D, Pujol JL, et al:
Patterns of relapse of N2 non-small-cell lung carcinoma patients
treated with preoperative chemotherapy: should prophylactic cranial
irradiation be reconsidered? Cancer. 91:2394–2400. 2001. View Article : Google Scholar : PubMed/NCBI
|
|
7
|
Carmichael J, Crane JM, Bunn PA, et al:
Results of therapeutic cranial irradiation in small cell lung
cancer. Int J Radiat Oncol Biol Phys. 14:455–459. 1998. View Article : Google Scholar
|
|
8
|
Cox JD, Stanley K, Petrovich Z, et al:
Cranial irradiation in cancer of the lung of all cell types. JAMA.
245:469–472. 1981. View Article : Google Scholar : PubMed/NCBI
|
|
9
|
Arriagada R, Le Chevalier T, Borie F, et
al: Prophylactic cranial irradiation for patients with small-cell
lung cancer in complete remission. J Natl Cancer Inst. 87:183–190.
1995. View Article : Google Scholar : PubMed/NCBI
|
|
10
|
Shaw EG, Su JQ, Eagan RT, et al:
Prophylactic cranial irradiation in complete responders with
small-cell lung cancer: analysis of the Mayo Clinic and North
Central Cancer Treatment Group data bases. J Clin Oncol.
12:2327–2332. 1994.PubMed/NCBI
|
|
11
|
Langer CJ and Mehta MP: Current management
of brain metastases, with a focus on systemic options. J Clin
Oncol. 23:6207–6219. 2005. View Article : Google Scholar : PubMed/NCBI
|
|
12
|
Tan M, Song X, Zhang G, et al:
Overexpression of adenylate cyclase-associated protein 1 is
associated with metastasis of lung cancer. Oncol Rep. 30:1639–1644.
2013.PubMed/NCBI
|
|
13
|
Delattre JY, Krol G, Thaler HT and Posner
JB: Distribution of brain metastases. Arch Neurol. 45:741–744.
1988. View Article : Google Scholar : PubMed/NCBI
|
|
14
|
Fedor-Chaiken M, Deschenes RJ and Broach
JR: SRV2, a gene required for RAS activation of adenylate cyclase
in yeast. Cell. 61:329–340. 1990. View Article : Google Scholar : PubMed/NCBI
|
|
15
|
Field J, Vojtek A, Ballester R, et al:
Cloning and characterization of CAP, the S. cerevisiae gene
encoding the 70 kd adenylyl cyclase-associated protein. Cell.
61:319–327. 1990. View Article : Google Scholar : PubMed/NCBI
|
|
16
|
Matviw H, Yu G and Young D: Identification
of a human cDNA encoding a protein that is structurally and
functionally related to the yeast adenylyl cyclase-associated CAP
proteins. Mol Cell Biol. 12:5033–5040. 1992.PubMed/NCBI
|
|
17
|
Freeman NL, Chen Z, Horenstein J, Weber A
and Field J: An actin monomer binding activity localizes to the
carboxyl-terminal half of the Saccharomyces cerevisiae
cyclase-associated protein. J Biol Chem. 270:5680–5685. 1995.
View Article : Google Scholar : PubMed/NCBI
|
|
18
|
Moriyama K and Yahara I: Human CAP1 is a
key factor in the recycling of cofilin and actin for rapid actin
turnover. J Cell Sci. 115:1591–1601. 2002.PubMed/NCBI
|
|
19
|
Hubberstey AV and Mottillo EP:
Cyclase-associated proteins: CAPacity for linking signal
transduction and actin polymerization. FASEB J. 16:487–499. 2002.
View Article : Google Scholar : PubMed/NCBI
|
|
20
|
Loisel TP, Boujemaa R, Pantaloni D and
Carlier MF: Reconstitution of actin-based motility of Listeria and
Shigella using pure proteins. Nature. 401:613–616. 1999. View Article : Google Scholar : PubMed/NCBI
|
|
21
|
Yamazaki K, Takamura M, Masugi Y, et al:
Adenylate cyclase-associated protein 1 overexpressed in pancreatic
cancers is involved in cancer cell motility. Lab Invest.
89:425–432. 2009. View Article : Google Scholar : PubMed/NCBI
|