Introduction
Vasohibin-2 (VASH2) belongs to the VASH family,
which also includes VASH1 (1).
VASH2 has been identified as a vascular endothelial growth factor
(VEGF)-independent angiogenic factor and is expressed
preferentially in mononuclear cells that are mobilized from the
bone marrow (1,2). Initial analysis of VASH2 revealed that
it is also present in endothelial cells (ECs) in developing human
or mouse embryos and that its levels are reduced after birth
(3). It was reported that VASH2 is
transcriptionally activated in human tumors, promoting angiogenesis
and growth in hepatic, ovarian and endometrial carcinoma (4–6). VASH2
has shown a strong and extensive ability to promote tumor by
epithelial-mesenchymal transition (EMT), increase the proportion of
stem cells and inhibit apoptosis, which beyond paracrine promotes
angiogenesis and migration (7,8). VASH2
knockdown in cancer cells prominently inhibits growth and
angiogenesis in tumors (9).
Furthermore, VASH2 is perceived as a cancer-promoting
gene.
However, there are no reliable protein expression
studies of VASH2 in human tissue (3). Recently, rabbit anti-human VASH2
polyclonal antibodies were successfully generated for use in
western blot analysis (WB) and immunohistochemistry (IHC) (10). It was also determined that,
different VASH2 isoforms have different intracellular localizations
in HepG2 cells: one (311 amino acids) in the nucleus and the other
(355 amino acids) in the cytoplasm (10). According to these differing
locations, VASH2 was classified as nuclear and cytoplasmic type
(10). Thus, differing locations of
VASH2 may have different mechanisms of cell growth promotion.
Previous studies have focused on full-length VASH2 (4–9),
without a clear distinction between cytoplasmic and nuclear VASH2.
In the present study, we focused on nuclear VASH2.
Nuclear VASH2 expression was screened using IHC in
human normal and cancer tissues and nuclear VASH2 was found to
correlate positively with cell proliferation. The proportion of
nuclear VASH2 positivity was positively correlated with the
Ki-67-positive proportion in the normal and cancer tissues. Based
on these findings, we hypothesized that nuclear VASH2 may be
partially involved in the yet unknown mechanisms of cell
proliferation. To confirm whether VASH2 is involved in cell
proliferation, we stably constructed VASH2 overexpression and
knockdown in LO2 and HepG2 cell lines. Cell proliferation was
increased in nuclear VASH2-overexpressed cells and decreased in
VASH2 knockdown cells. Nuclear VASH2 overexpression promoted
G0/G1 to S phase progression, while VASH2
knockdown induced upregulation of the G0/G1
population. As far as we know, this is the first study to show that
nuclear VASH2 promotes cell proliferation by inducing
G0/G1 to S phase progression. The present
study provides a better understanding of the function of VASH2.
Materials and methods
Tissue microarray and IHC
High-density, multiple organ tumors and normal
tissue microarray (MC5003a) and multiple organ normal tissue
microarrays (FDA999b) were purchased from Biomax (Rockville, MD,
USA) for IHC. Squamous epithelial, adjacent non-tumor liver and
hepatic cancer tissues were obtained from patients at the First
Affiliated Hospital of Nanjing Medical University (Nanjing, China).
Written informed consent was obtained from all the patients. The
Research Ethics Committee of Nanjing Medical University approved
the present study. Primary antibodies used in the present study
were as described previously (10):
rabbit polyclonal anti-VASH2 (self-prepared) and rabbit polyclonal
anti-Ki-67 (Fuzhou Maixin Biotechnology, Fuzhou, China). Ki-67 and
nuclear VASH2 staining were evaluated by calculating the proportion
of positively stained cells: One thousand cells were counted in
each of the 10 randomly selected high-power fields.
Cell culture
The L02 cells were kindly provided by Professor
Beicheng Sun of the Department of General Surgery, The First
Affiliated Hospital of Nanjing Medical University (Jiangsu, China).
Human HepG2 liver cancer cells were obtained from the American Type
Culture Collection (ATCC; Manassas, VA, USA). The cells were
cultured in Dulbecco's modified Eagle's medium (DMEM) containing
10% fetal bovine serum (FBS) (both from Wisent, QC, Canada) and 100
mg/ml penicillin and 100 mg/ml streptomycin (HyClone, Logan, UT,
USA) at 37°C in 5% CO2.
Plasmid construction and lentivirus
packaging
The highly expressed VASH2 (355 amino acid residues)
plasmid fused with the DDK tag at the c-terminal was constructed as
previously described (15). VASH2
cDNA (encoding for 311 amino acid residues) purchased from Origene
(Rockville, MD, USA) was fused with V5 tag at the c-terminal and
cloned into the Lv-CMV-EGFP vector. The plasmids were verified by
sequencing (Invitrogen, Shanghai, China). Lentiviral (Lv)
constructs were designed to induce nuclear VASH2 overexpression and
knockdown, as previously described (4,10). The
primer pair for the VASH2 plasmid (311 amino acid residues) was as
follows: forward, 5′-CGGCTAGCCCCACCATGA CCGGCTC-3′ and reverse,
5′-AACTGCAGCTACGTAGAA TCGAGACCGAGGAGAGGGTTAGGGATAGGCTTACCA
ATTCGGATTTGATAGCCCACTT-3′ (V5-tag) (10). LO2 and HepG2 cells were stably
transfected with Lv-cytomegalovirus (CMV)-VASH2 for VASH2
overexpression (encoding for 311 amino acid residues) and
designated as LO2-VASH2 and HepG2-VASH2, respectively. LO2 and
HepG2 cells stably transfected with Lv-CMV-EGFP (enhanced green
fluorescent protein) as controls were designated as LO2-EGFP and
HepG2-EGFP, respectively. LO2 and HepG2 cells stably transfected
with VASH2-targeting short hairpin RNA (shRNA) lentivirus for VASH2
knockdown (both 355 and 311 amino acid residues were downregulated)
were designated as LO2-shVASH2 and HepG2-shVASH2, respectively. For
knockdown, the shv2 construct, with ≥85% knockdown efficiency, was
used for subsequent studies (Fig.
4). This shRNA sequences used for subsequent studies were:
shVASH2, 5′-CCGGTTTGACT TTGAGGACTCTTACCTCGAGGTAAGAGTCCTCAAAG
TAAATTTTTG-3′; shScrambled, 5′-CCGGCCTAAGGT
TAAGTCGCCCTCGCTCGAGCGAGGGCGACTTAACCT TAGGTTTTTG-3′ (4). LO2 and HepG2 cells stably transfected
with scrambled shRNA lentivirus as controls were designated as
LO2-shcont and HepG2-shcont, respectively.
Immunofluorescence
HepG2 cell line was arrayed in a 24-well plate
(Corning Inc., NY, USA) and immunofluorescence was performed as
previously described (11,12). The polyclonal antibodies were
diluted as previously described (10). Mouse-anti-DDK antibody was purchased
from Abmart (Arlington, MA, USA). The secondary antibody used was
the goat anti-rabbit IgG-dylight 593 (Sigma-Aldrich, St. Louis, MO,
USA). The nucleus dye, 10 µg/ml DAPI (Sigma-Aldrich) was
diluted in PBS. The cells were then observed under a fluorescence
microscope (Olympus, Tokyo, Japan).
Bromodeoxyuridine (BrdU) cell
proliferation assay
Cultured cells (1×10⁵/well) were plated
in 96-well plates. Cell proliferation at 24, 48 and 72 h was
evaluated using a BrdU Cell Proliferation Assay kit (cat. no.
11647229001; Roche Applied Science, Mannheim, Germany) according to
the manufacturer's instructions. The cell proliferation rate was
determined by measuring the absorbance at 492 nm using a
computer-controlled microplate reader (Multiskan FC; Thermo
Scientific, Waltham, MA, USA) (13).
Fluorescence-activated cell sorting
analysis
Cells were collected, washed with 300 µl cold
phosphate-buffered saline and precipitated with 3 ml cold 75%
ethanol. Cells to be used for fluorescence-activated cell sorting
(FACS) were stored at −20°C in 75% ethanol for 16 h, stained with
propidium iodide for 30 min at 37°C and the DNA content analyzed
using a FACS Calibur unit (BD Biosciences, Allschwil, Switzerland)
(14).
Nuclear extraction analysis and western
blot analysis
Cytoplasmic and nuclear protein samples were
isolated using a Nuclear Extraction kit 2900 (Millipore, Billerica,
MA, USA) according to the manufacturer's instructions. Total cell
lysates were prepared using a radioimmunoprecipitation assay buffer
(Beyotime, Nantong, China). Protein quantities of 40 µg/lane
for LO2 cell synchronization were used for western blotting.
Polyvinylidene difluoride membranes (Millipore) were blocked with
5% non-fat dried milk and incubated overnight at 4°C with the
appropriate primary antibodies. The rabbit anti-human VASH2
polyclonal antibody was used as reported previously described
(10).
Statistical analysis
A two-sample t-test was performed to compare the
mean IHC scores for nuclear VASH2 between benign and malignant
tissues overall and in a specific organ/system. The Spearman's rank
correlation test was used for correlation analysis between nuclear
VASH2 and Ki-67. Cell cycle group comparison was performed using an
independent sample t-test. We used the Student-Newman-Keuls test
for inequality of unpaired multiple data sets to determine
significant differences in BrdU absorbance in the 24-, 48- and 72-h
groups.
Results
Screening of nuclear VASH2 expression in
normal and tumor tissues
We used a tissue microarray chip (547 specimens) to
identify expression trends to analyze nuclear VASH2 expression in
human normal and tumor tissues. Based on the tissue microarray,
there were 34 normal human tissue (140 specimens), 22 primary
malignant tumor (383 specimens) and 9 tumor-adjacent normal tissue
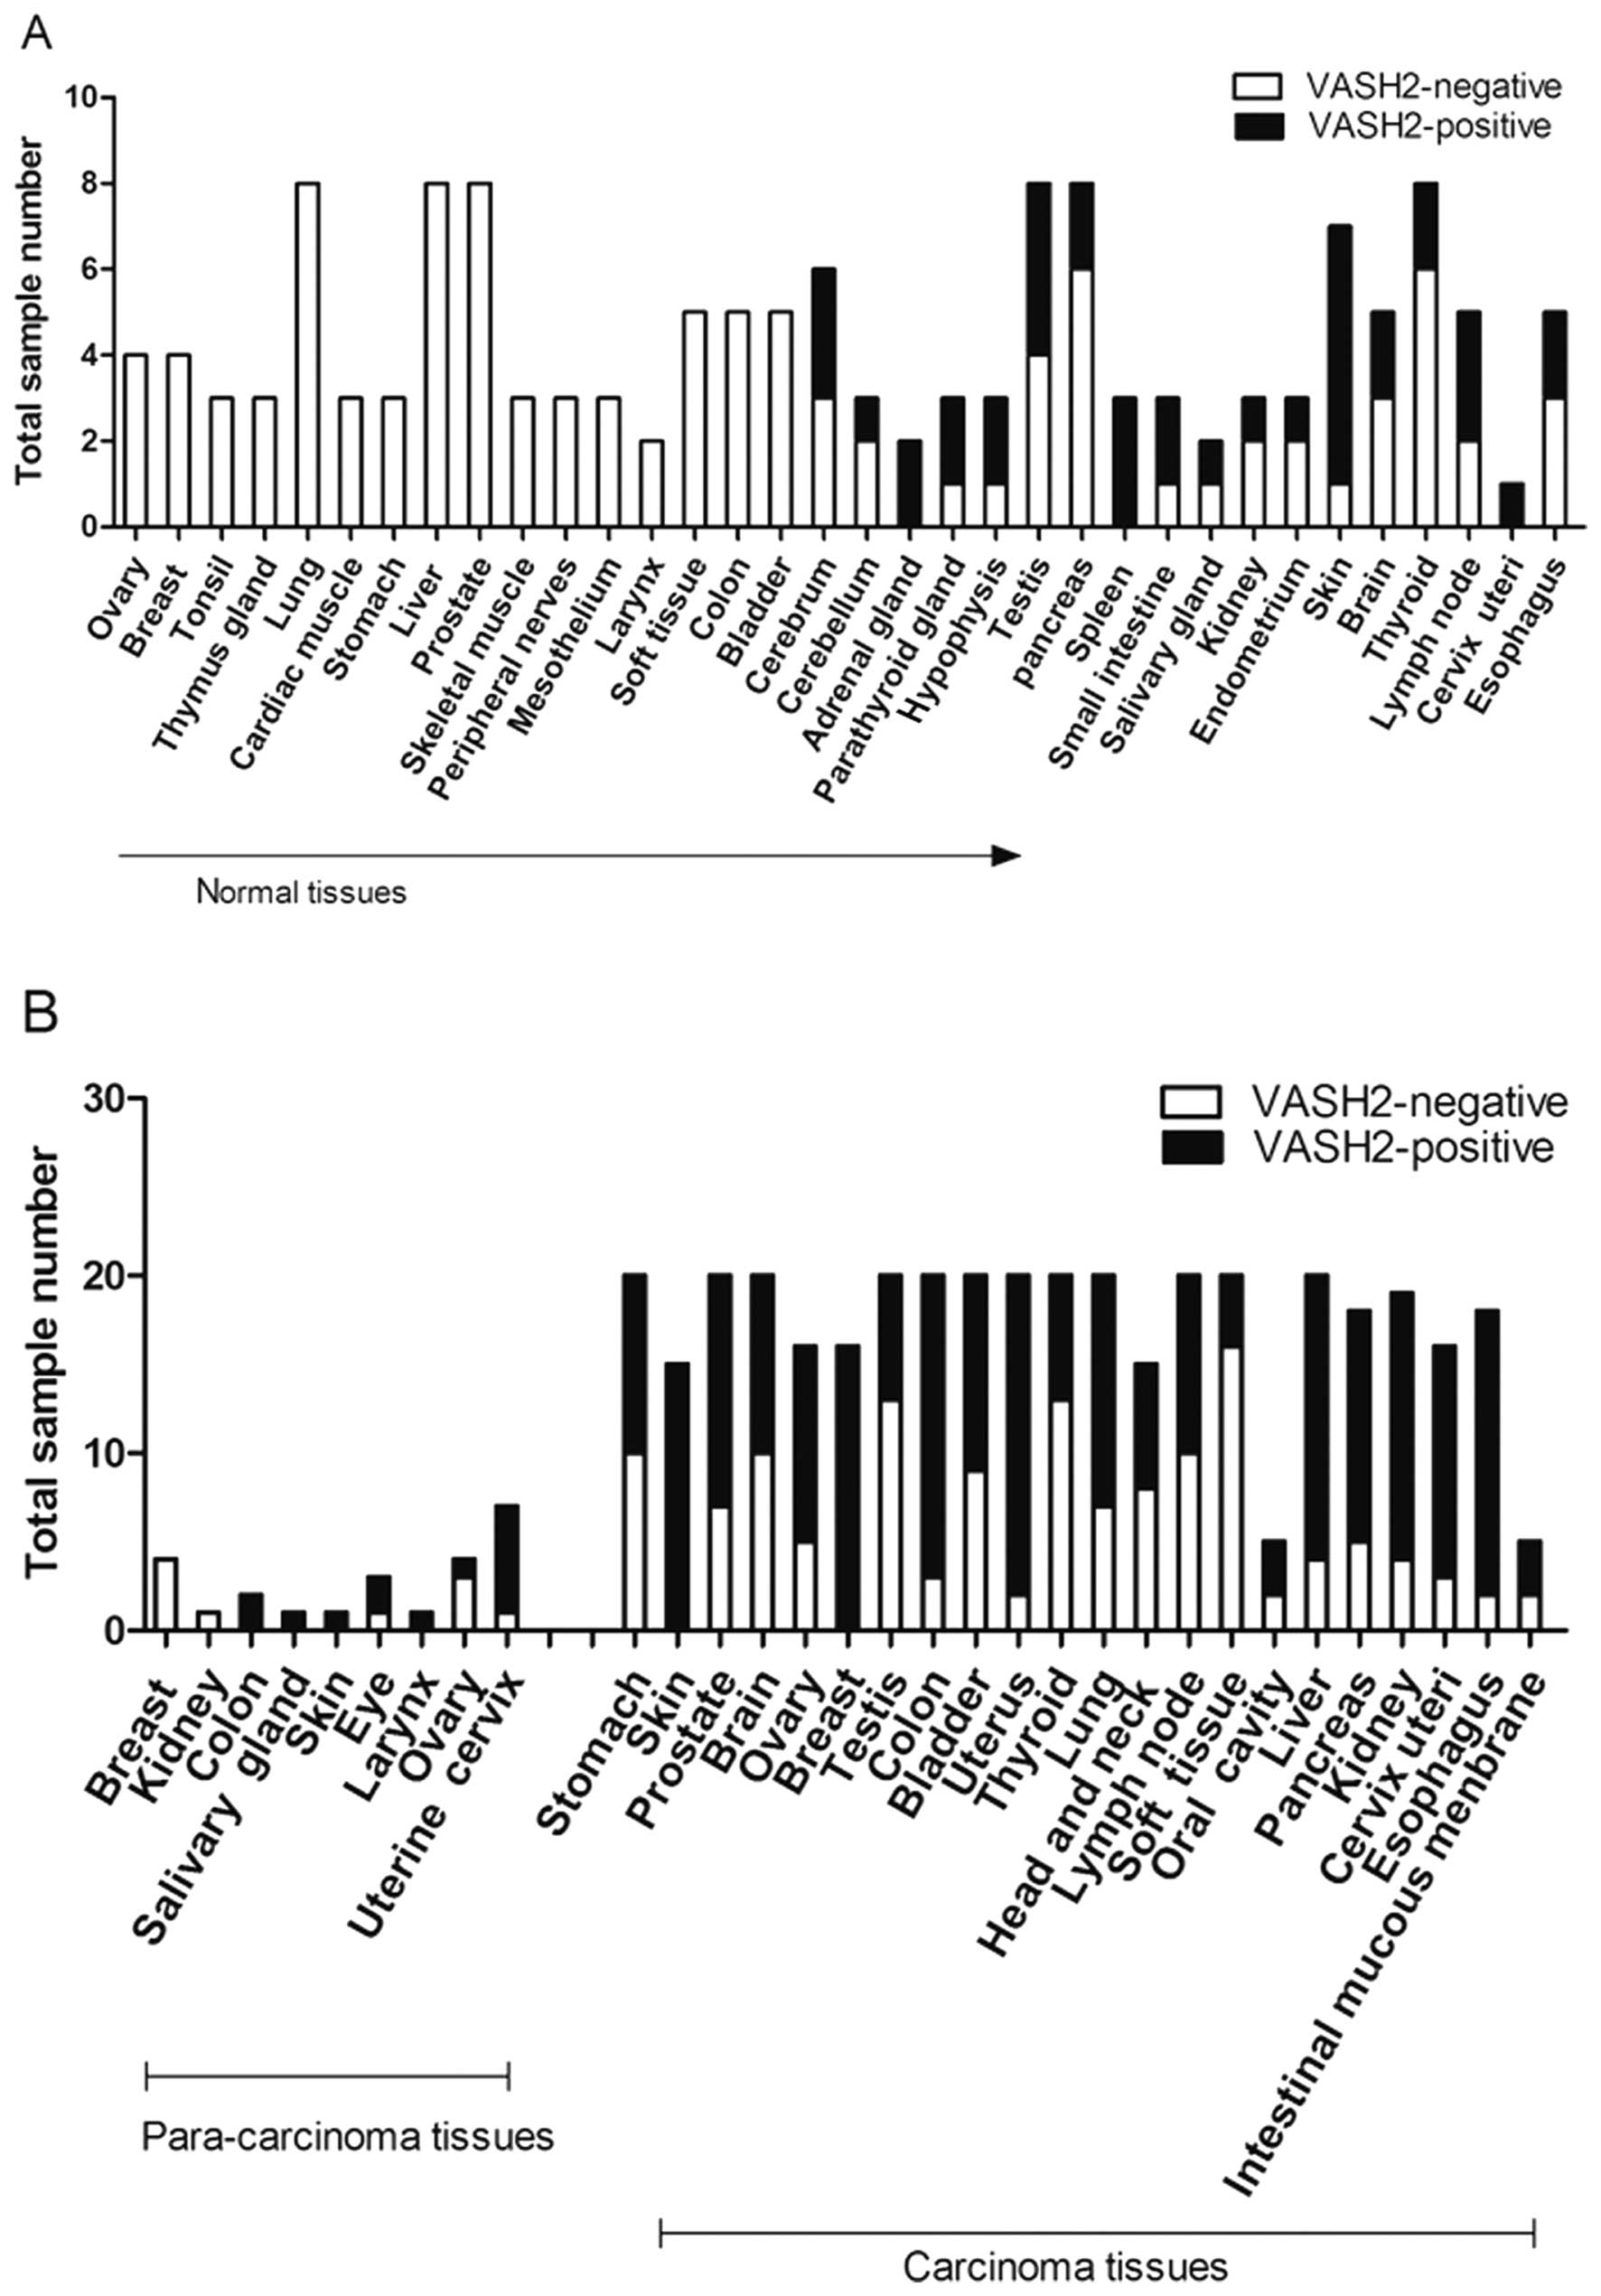
types (24 specimens). There was positive VASH2 staining in 27.1%
(38/140) of the normal human tissues. The 16 VASH2-negative normal
mature human tissue types were derived from the ovary, breast,
tonsil, thymus gland, lung, cardiac muscle, stomach, liver,
prostate, skeletal muscle, peripheral nerves, mesothelium, larynx,
soft tissue, colon and bladder (Fig.
1A). VASH2 expression localized to the nucleus was detected in
the remaining 18 tissue types, including the cerebrum (3/6),
cerebellum (1/3), adrenal gland (2/2), parathyroid gland (2/3),
hypophysis (2/3), testis (4/8), pancreas (2/8), spleen (3/3), small
intestine (2/3), salivary gland (1/2), kidney (1/3), endometrium
(1/3), skin (6/7), brain (2/5), thyroid (2/8), lymph node (2/5),
cervix uteri (1/1) and esophagus (2/5) (Fig. 1A).
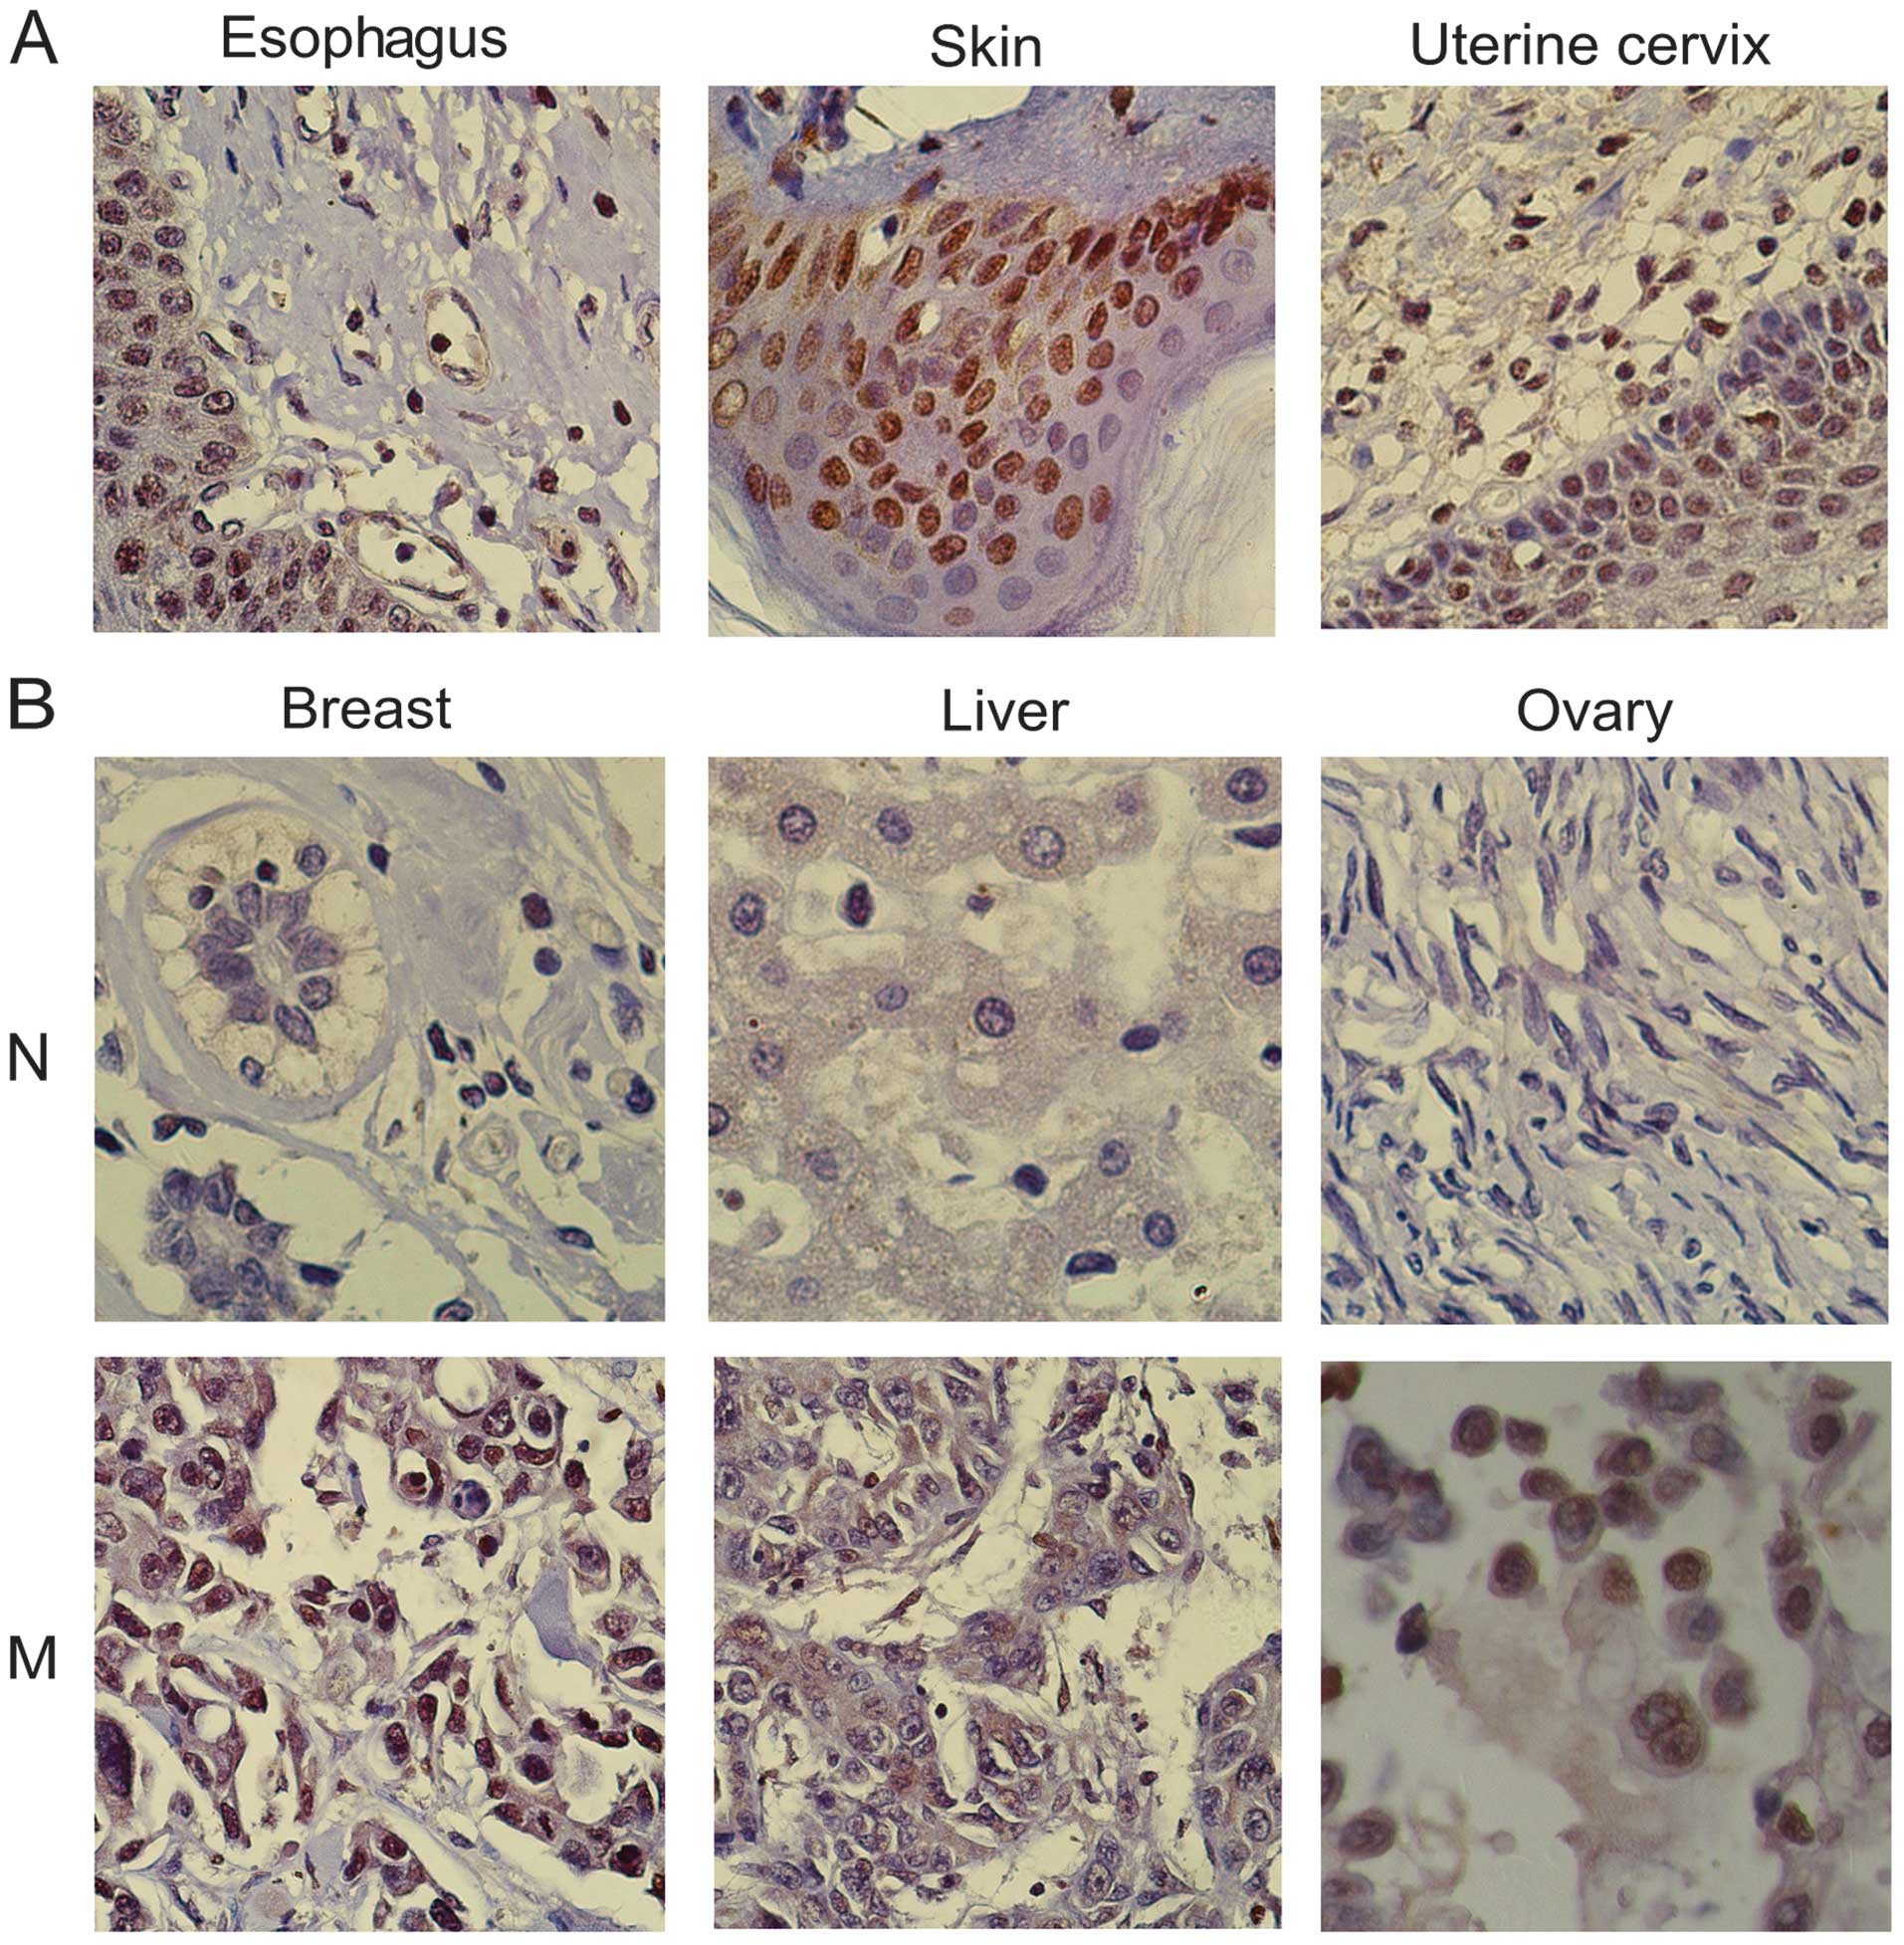
In the normal tissue specimens, there was usually an
absence of cell proliferation in the nuclear VASH2-negative tissues
(Fig. 2), whereas there was usually
strong cell and nuclear division and cytokinesis in nuclear
VASH2-positive tissues (Fig. 2).
There was deep nuclear VASH2 staining in the basal and parabasal
layer cells of normal skin, small intestine, cervix uteri and
esophageal tissues and these tissues were accompanied by numerous
mitotic figures (Fig. 2).
We observed positive nuclear VASH2 staining in seven
tumor-adjacent normal tissue types, including colon (2/2), salivary
gland (1/1), skin (1/1), eye (2/3), larynx (1/1), ovary (1/4) and
uterine cervix (6/7) (Fig. 1B). The
nuclear VASH2-positive proportion in primary malignant tumor tissue
specimens (22 tumor types) (64.8%, 248/383) (Fig. 1) was significantly higher than that
of normal tissues (27.1%, 38/140, P<0.001). In addition, the
tumor tissues were characterized by high proliferation capability
(20). A high VASH2 expression in
the nucleus was correlated with strong cytokinesis; dark,
pathological mitotic figures; large, deeply stained nuclei and a
high nucleo-cytoplasmic ratio (Fig.
2). However, these results need to be reconfirmed with an
increasing size in these tissues. Table
I showed significant differences in the expression levels of
nuclear VASH2 between benign and malignant changes in different
tissues. Based on these observations, it was determined that
nuclear VASH2 may correlate with cell proliferation.
 | Table IStatistically significant nuclear
VASH2 expression levels (IHC score) between benign and malignant
changes in different organs/tissues. |
Table I
Statistically significant nuclear
VASH2 expression levels (IHC score) between benign and malignant
changes in different organs/tissues.
| Organ/tissue | No. | Benign
changes
(mean ± SD) | No. | Malignant
changes
(mean ± SD) | P-value |
|---|
| Stomach | 3 | 0.006±0.0057 | 20 | 0.530±0.0523 | 0.017 |
| Skin | 7 | 0.772±0.0381 | 15 | 0.996±0.0058 | 0.001 |
| Prostate | 8 | 0.004±0.0062 | 20 | 0.657±0.0236 | 0.01 |
| Brain | 5 | 0.400±0.0187 | 20 | 0.624±0.0543 | <0.001 |
| Ovary | 4 | 0.017±0.0095 | 16 | 0.710±0.0451 | 0.027 |
| Breast | 5 | 0.060±0.0790 | 16 | 0.988±0.0160 | 0.002 |
| Colon | 5 | 0.018±0.0081 | 20 | 0.847±0.0257 | <0.001 |
| Bladder | 5 | 0.016±0.0086 | 20 | 0.659±0.0628 | 0.006 |
| Lung | 8 | 0.006±0.0074 | 20 | 0.674±0.0366 | 0.041 |
| Liver | 8 | 0.012±0.0098 | 20 | 0.844±0.0306 | 0.006 |
| Pancreas | 8 | 0.003±0.0074 | 20 | 0.684±0.0422 | 0.032 |
| Kidney | 3 | 0.296±0.0251 | 20 | 0.836±0.0364 | <0.001 |
| Esophagus | 5 | 0.456±0.1985 | 20 | 0.840±0.0380 | 0.001 |
Positive correlation of nuclear VASH2
with cell proliferation
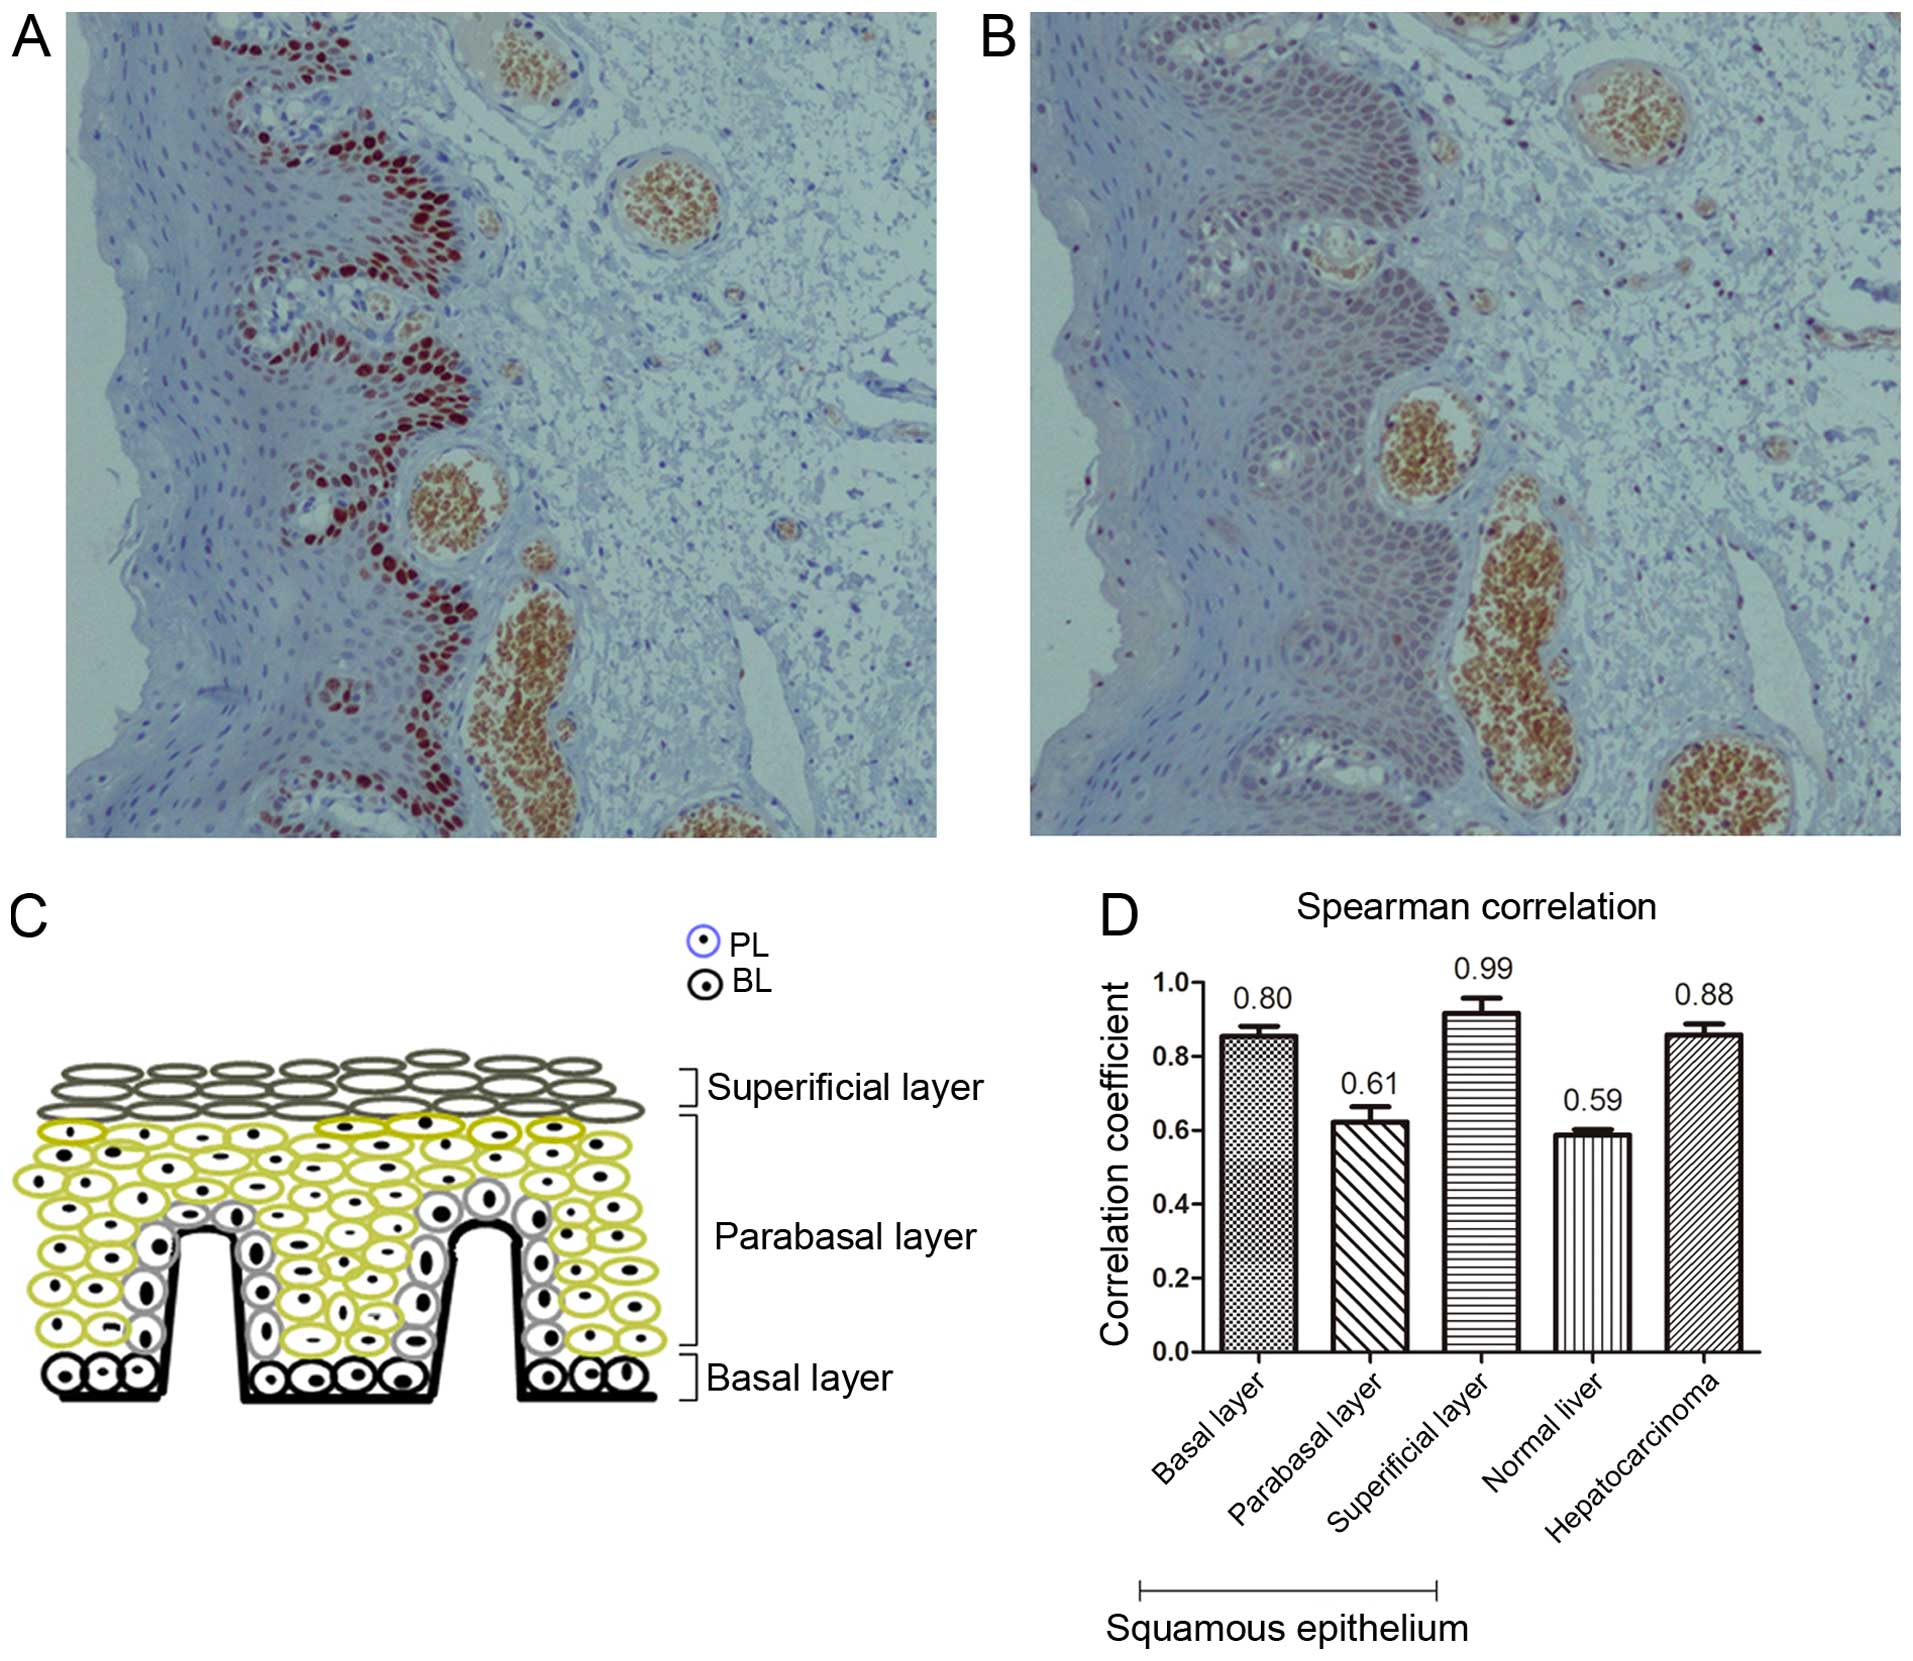
To examine the relationship between nuclear VASH2
and cell proliferation, we investigated nuclear VASH2 expression in
proliferative normal squamous epithelium, adjacent non-tumor liver
and hepatocarcinoma tissues. Proliferation was assessed by
detecting Ki-67, which is widely used as a proliferation marker in
histopathology (15–18). The Ki-67- and nuclear VASH2-positive
proportion were highest in the basal layer (75.00±5.00 and
85.00±5.01%, respectively), intermediate in the parabasal layer
(25.03±5.05 and 31.33±6.65%, respectively) and lowest in the
superficial layer (2.10±1.15 and 4.00±1.00%, respectively) of
normal squamous epithelium tissues (n=15, Fig. 3). We also calculated the Ki-67 and
nuclear VASH2-positive proportion in the adjacent non-tumor liver
tissues (n=15, 27.67±2.51 and 32.67±2.57%, respectively) and
hepatocarcinoma tissues (n=15, 78.00±2.00 and 76.00±3.60%,
respectively). The nuclear VASH2-positive proportion was positively
correlated with the Ki-67-positive proportion in the basal (r=0.80,
P<0.05), parabasal (r=0.61, P<0.05), superficial layer
(r=0.99, P<0.05), adjacent non-tumor (r=0.59, P<0.05) and
malignant liver tissues (r=0.88, P<0.05, Fig. 3). These observations suggested that
nuclear VASH2 was positively correlated with cell
proliferation.
Generation and identification of stably
transfected cells
Previous findings showed that full-length VASH2
promoted growth and angiogenesis in hepatocellular carcinoma (HCC)
(4,8). Therefore, to investigate the functions
of nuclear VASH2 in cell proliferation, we overexpressed and
silenced nuclear VASH2 expression in LO2 and HepG2 cells. We
constructed VASH2 overexpression (311 amino acid residues) and
VASH2-knockdown lentiviral constructs, infected HepG2 cells and
selected stably infected cells for further study. We confirmed
expression levels using western blot analysis (Fig. 4). The stable cells of LO2 were
treated in the same manner as HepG2.
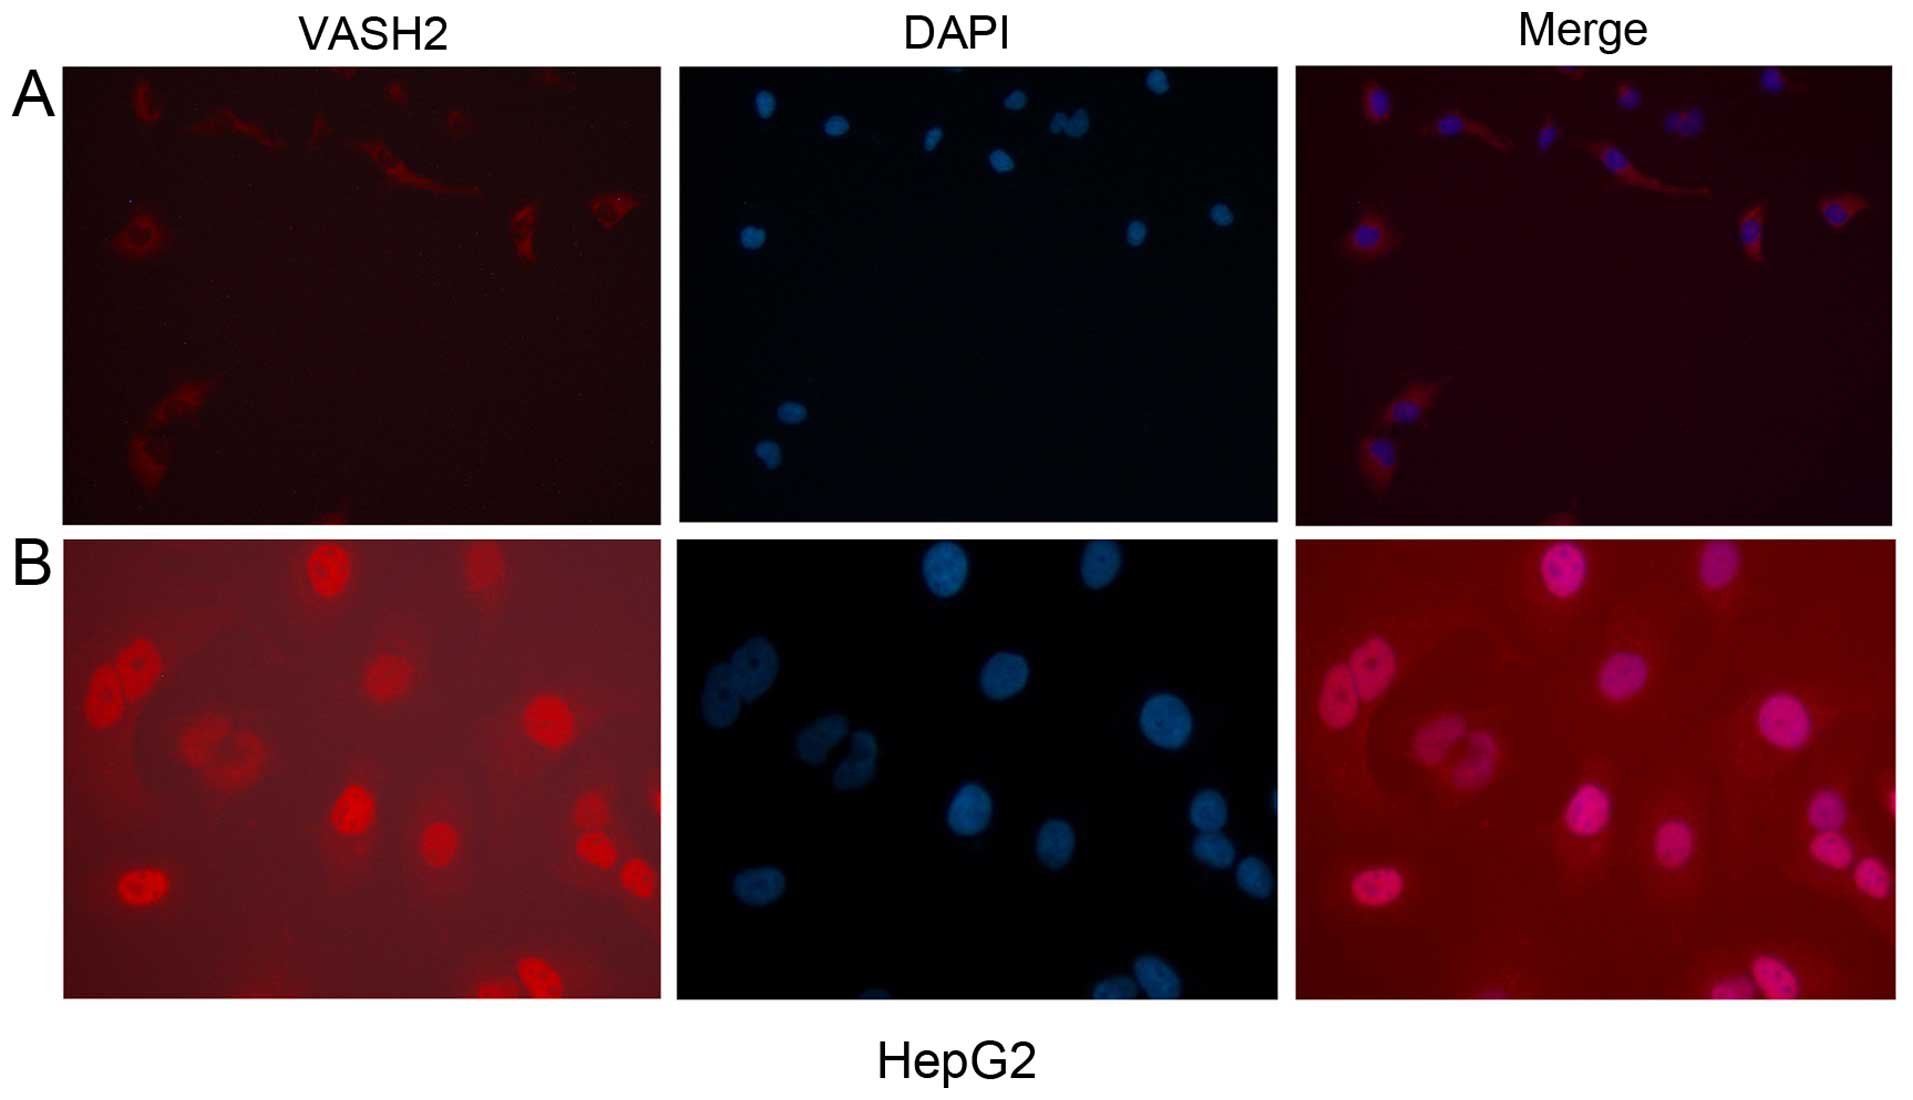
To verify the localization of nuclear VASH2,
immunofluorescence analysis was performed for the HepG2-VASH2
(transient overexpressed c-terminal V5 tag 311 and c-terminal
DDK-tagged 355 amino acid residues VASH2). The HepG2-VASH2 (311
amino acid residues) nucleus was stained red while the cytoplasm
was red in the HepG2-VASH2 (355 amino acid residues) under the
fluorescence microscope (Fig.
5).
Nuclear VASH2 promotes cell proliferation
in vitro
We determined the proliferation ability of LO2-EGFP,
LO2-VASH2, LO2-shcont, LO2-shVASH2, HepG2-EGFP, HepG2-VASH2,
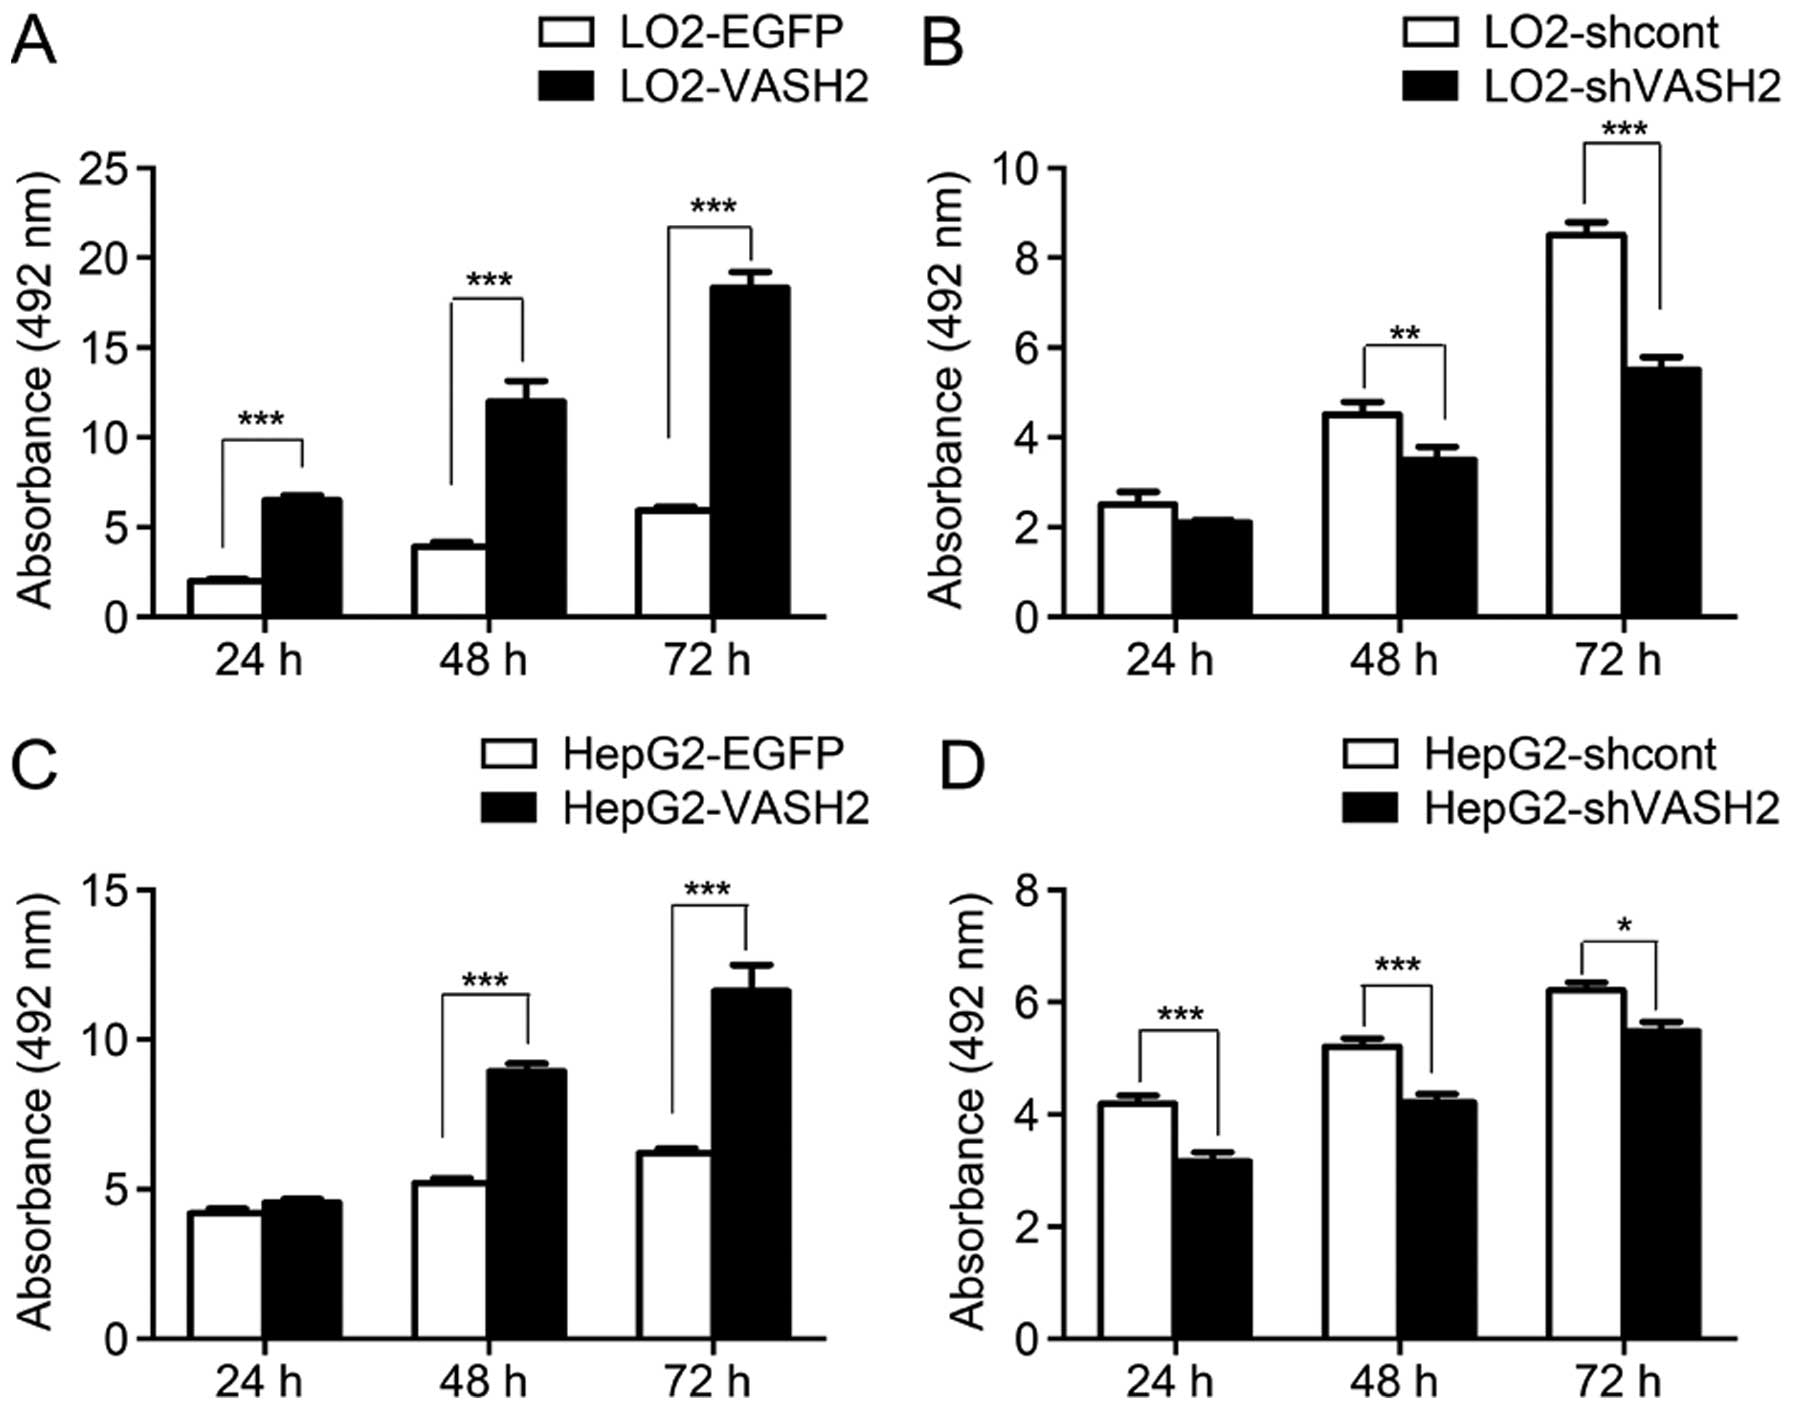
HepG2-shcont and HepG2-shVASH2 cells with BrdU analysis. The BrdU
uptake assay revealed an increased DNA synthesis in LO2-VASH2 cells
compared to LO2-EGFP cells (24-, 48-, 72-h post-plating; all
P<0.001, Fig. 6); decreased DNA
synthesis in LO2-shVASH2 cells after 48- and 72-h incubation
(P<0.01 and P<0.001, respectively, vs. LO2-shcont cells,
Fig. 6); markedly increased
proliferation ability of HepG2-VASH2 cells compared to the control
cells (24-, 48-, 72-h post-plating; all P<0.001 vs.
HepG2-shVASH2 cells, Fig. 6); and
decreased DNA synthesis in HepG2-shVASH2 cells after 48- and 72-h
incubation (P<0.05 and P<0.001, respectively, vs.
HepG2-shcont cells, Fig. 6).
Compared to the control group, nuclear VASH2 overexpression in the
LO2 and HepG2 cells resulted in significantly increased cell
proliferation. VASH2 knockdown significantly reduced the
proliferation of HepG2-shVASH2 compared to the HepG2-shcont and LO2
cells. These results indicated that nuclear VASH2 promotes cell
proliferation. Considering BrdU incorporation can also be used to
determine the S phase of the cell cycle (19), we hypothesized that nuclear VASH2
promotes cell proliferation by inducing cell cycle progression to
the S phase.
Nuclear VASH2 induces cell cycle
progression from G0/G1 to S phase
Compared with the control LO2-EGFP cells, there was
an increased relative proportion of LO2-VASH2 cells in the S phase
(30.44±4.26 vs. 52.56±5.32%, P<0.01, Fig. 7). Compared with the control
LO2-shcont cells, there was an increased relative proportion of
LO2-shVASH2 cells in the G0/G1 phase
(60.05±3.38 vs. 75.88±12.22%, P<0.05, Fig. 7), but a reduced relative proportion
of LO2-shVASH2 cells in the S phase (30.91±5.32 vs. 10.51±6.01%,
P<0.01, Fig. 7). Compared with
the control HepG2-EGFP cells, there was an increased relative
proportion of HepG2-VASH2 cells in the S phase (30.05±10.92 vs.
45.13±5.22%, P<0.05, Fig. 7).
Compared with the control HepG2-shcont cells, there was an
increased relative proportion of HepG2-shVASH2 cells in the
G0/G1 phase (41.53±16.86 vs. 73.87±7.35%,
P<0.01, Fig. 7), but a reduced
relative proportion of HepG2-shVASH2 cells in the S phase
(35.47±10.36 vs. 9.87±3.12%, P<0.01, Fig. 7). These results suggested that
nuclear VASH2 induced cell cycle progression from
G0/G1 to the S phase.
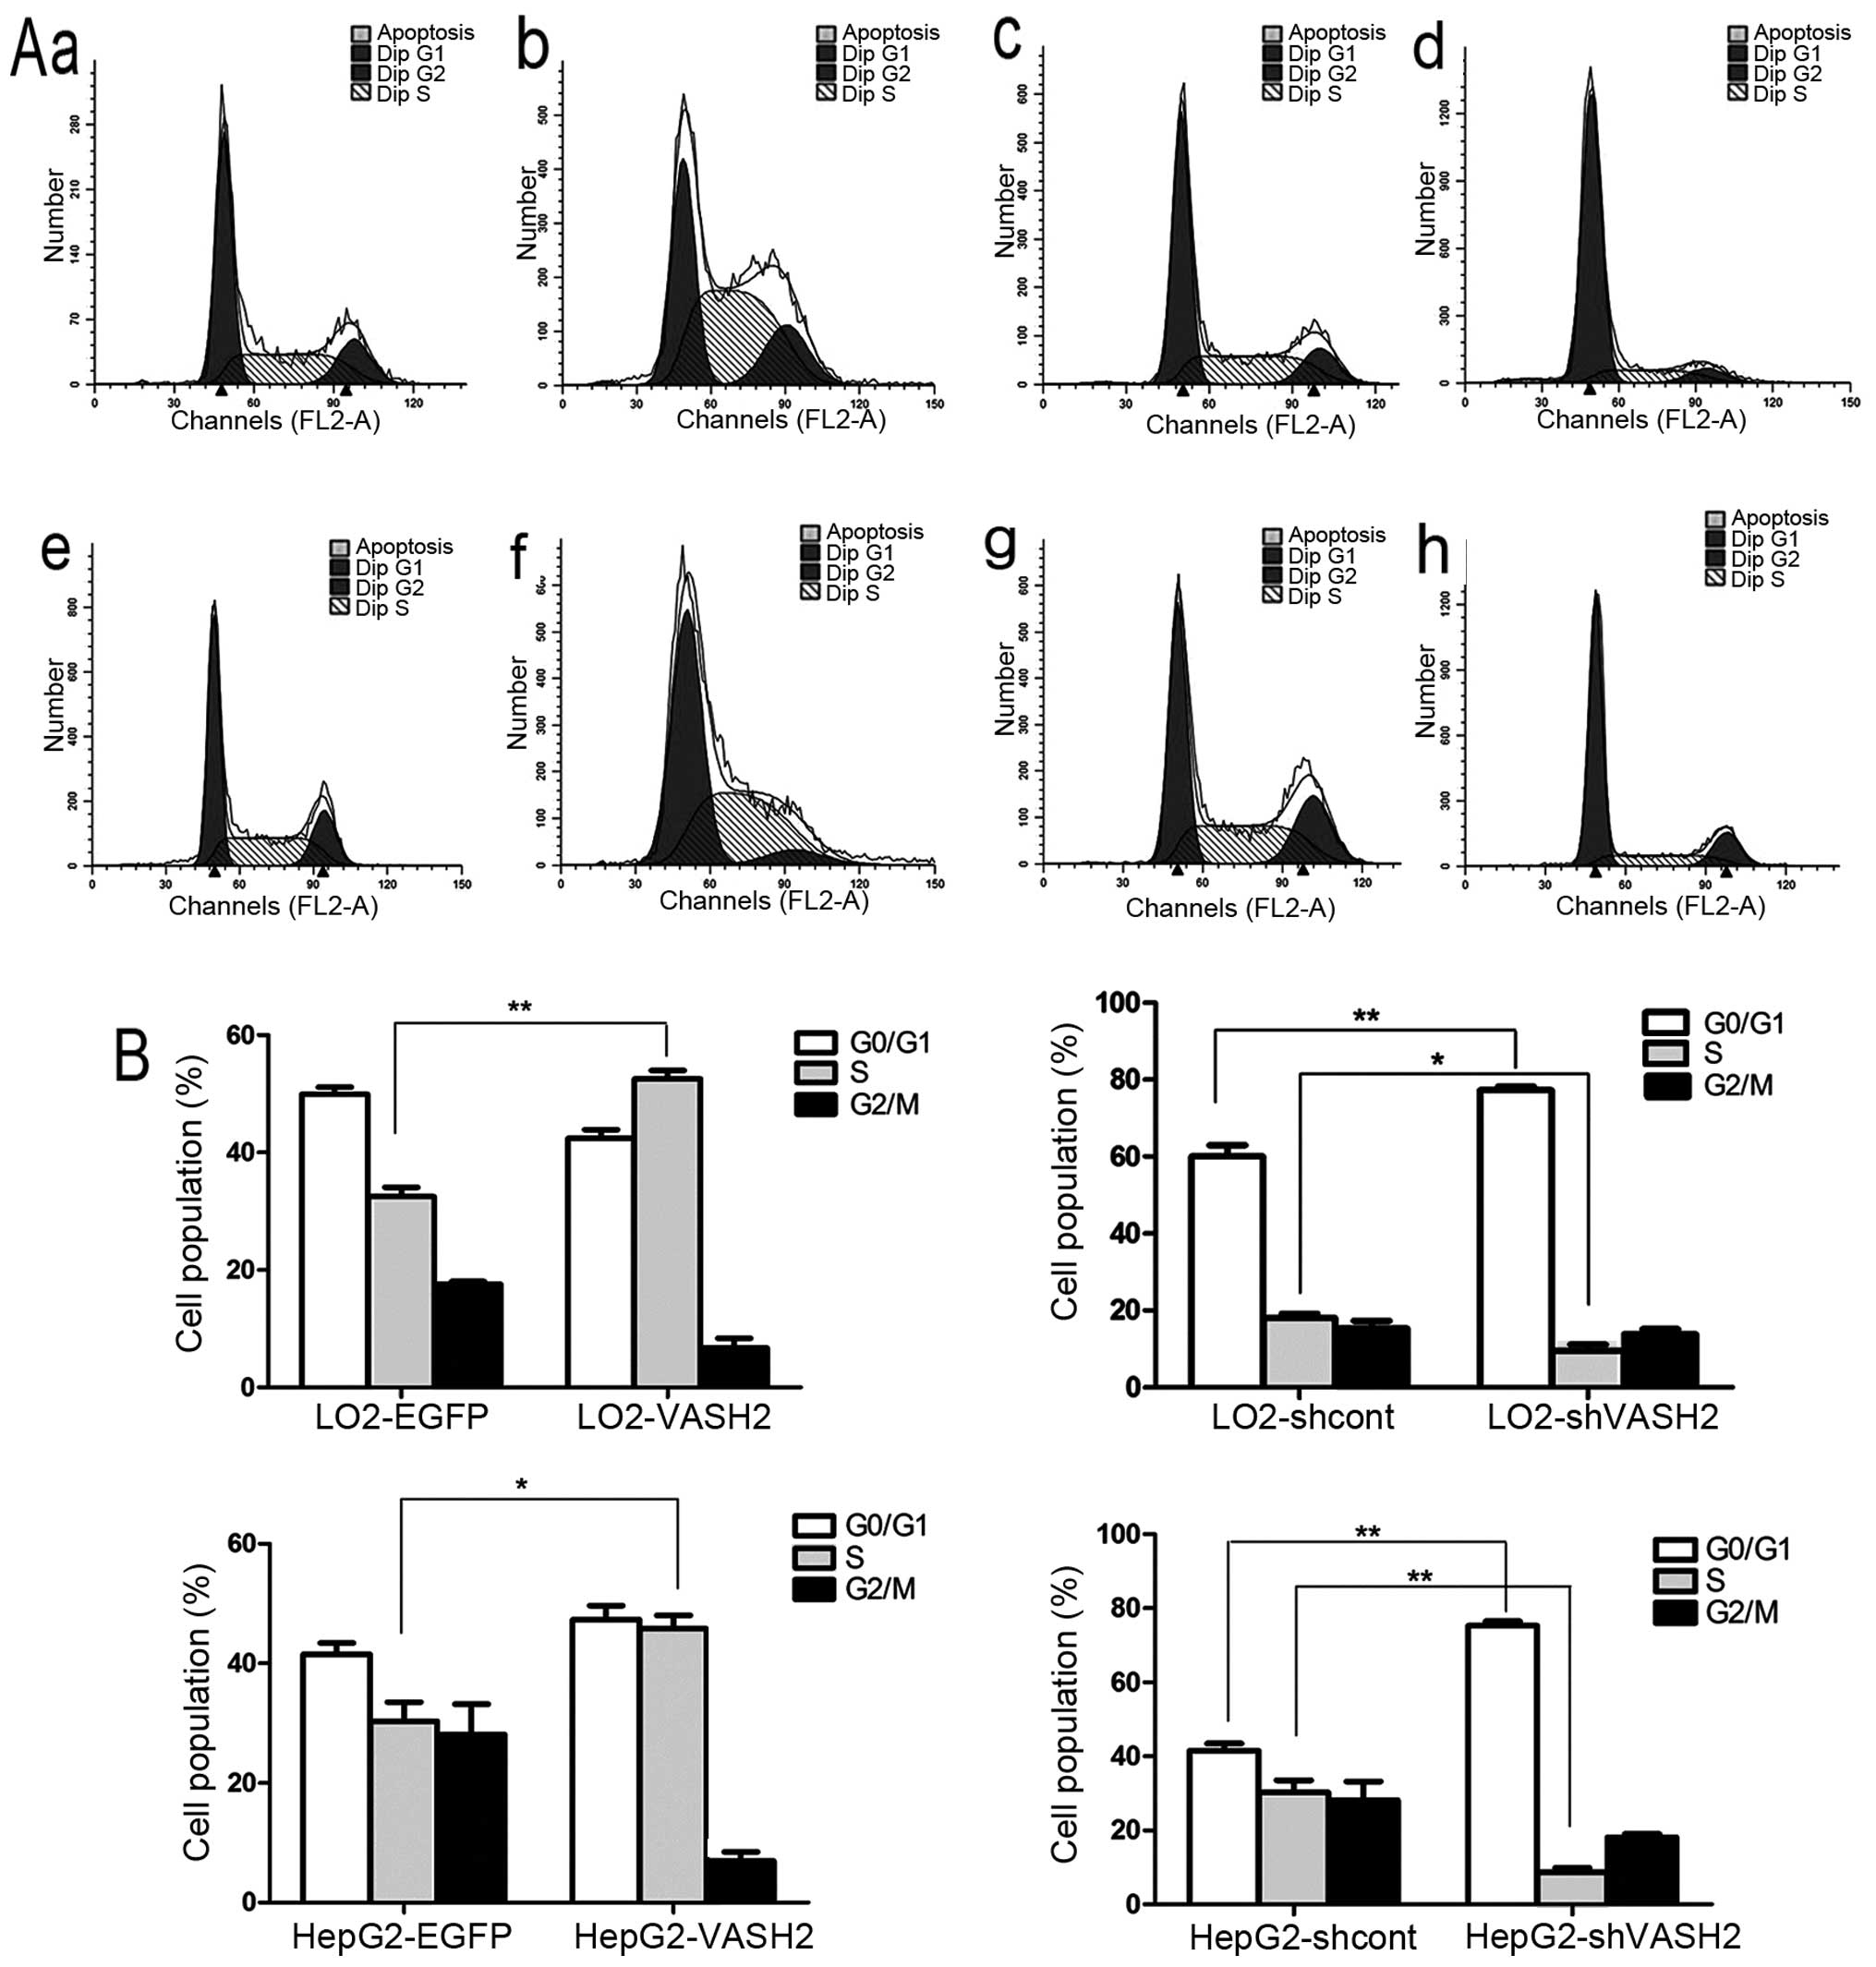 | Figure 7Nuclear VASH2 induces cell cycle
progression from G0/G1 to S phase. (A) Flow
cytometric analysis of DNA content. (A-a) LO2-EGFP control cells,
(b) LO2-VASH2 cells (34 kDa, 311 amino acid residues), (c)
LO2-shcont control cells, (d) LO2-shVASH2 cells, (A-e) HepG2-EGFP
control cells, (A-f) HepG2-VASH2 cells (34 kDa, 311 amino acid
residues), (A-g) HepG2-shcont cells, (A-h) HepG2-shVASH2 cells. (B)
Increased relative proportion of LO2-VASH2 cells in the S phase
compared to the control cells. Increased relative proportion of
LO2-shVASH2 cells in the G0/G1 phase compared
to LO2-shcont, but LO2-shVASH2 cells in the S phase were decreased.
Increased relative proportion of HepG2-VASH2 cells in the S phase
compared to the HepG2-EGFP cells; Increased relative proportion of
HepG2-shVASH2 in the G0/G1 phase compared to
the HepG2-shcont cells, although HepG2-shVASH2 cells in the S phase
were decreased. *P<0.05, **P<0.01.
VASH2, vasohibin-2. |
Discussion
Previously, it was reported that VASH2 is an
angiogenesis factor associated with carcinoma angiogenesis and
malignant transformation (1–6). VASH2
knockdown in cancer cells inhibits tumor growth and angiogenesis in
an obvious manner (9). Besides that
VASH2 also has shown a strong and extensive ability to promote
tumor to EMT, increase the proportion of stem cells and inhibit
apoptosis (7,8). We generated VASH2 polyclonal
antibodies for immunoblotting and IHC (10). Based on its intracellular locations,
we classified VASH2 into nuclear (with 311 amino acid residues) and
cytoplasmic types (with 355 amino acid residues) (10). In the present study, we focused on
nuclear VASH2, which, has not yet to be investigated so far.
We analyzed nuclear VASH2 levels in 547 tissue
specimens, finding that proliferative cells in normal tissues
tended to be nuclear VASH2-positive. Nuclear VASH2 was also
expressed in most of the primary malignant tumor specimens, which
are always highly proliferative (20). These observations indicated that
nuclear VASH2 may be associated with cell proliferation.
Ki-67 is a good marker for detecting cell
proliferation (18). We found that
nuclear VASH2 staining was consistent with Ki-67 staining in normal
squamous epithelial, adjacent non-tumor liver and hepatic cancer
tissue. There was a high nuclear VASH2 expression in the basal and
parabasal layers of the normal squamous epithelial tissue, where
cell proliferation is high, whereas nuclear VASH2 was rarely
expressed in the superior basal layer, where there is no mitosis or
proliferation. In the adjacent non-tumor liver tissues, Ki-67
staining was consistent with that of nuclear VASH2. In malignant
hepatic tissues with a strong self-renewal ability, high Ki-67
staining was accompanied by a similarly high nuclear VASH2
staining. There was a significant positive correlation between
nuclear VASH2 and Ki-67 staining, which indicates that nuclear
VASH2 correlates positively with cell proliferation.
To identify the correlation between nuclear VASH2
and cell proliferation, we established nuclear VASH2 overexpression
and knockdown cell models and used them in the BrdU proliferation
test. Nuclear VASH2 overexpression in LO2 and HepG2 cells increased
BrdU absorbance, while VASH2 knockdown decreased it, with only
mitotic S-phase cells incorporating BrdU (21–22).
Nuclear VASH2 increased the S-phase population and promoted cell
proliferation. Based on these findings, we determine that nuclear
VASH2 may promote cell progression by regulating the cell
cycle.
To confirm this hypothesis, we analyzed the effect
of nuclear VASH2 overexpression and knockdown on the cell cycle.
Cell cycle analysis showed that VASH2 knockdown in LO2 and HepG2
cells increased the G0/G1 population and
decreased the S-phase population and nuclear VASH2 overexpression
promoted G0/G1 progression to the S phase.
These results indicate that nuclear VASH2 regulates cell cycle
progression from G0/G1 to the S phase.
An in vivo tumorigenicity experiment using
HepG2 cells reported that VASH2 knockdown inhibited tumor growth
significantly, while cytoplasmic VASH2 overexpression did not lead
to greater tumor growth compared to the control cells (4). Using in vitro tetrazolium
bromide proliferation assays, Xue et al (4) reported a significantly decreased
proliferation rate of HepG2-shVASH2 (VASH2 knockdown) compared to
HepG2 cells, while there were no differences between cytoplasmic
VASH2-overexpressing HepG2-VASH2 (with 355 amino acid residues) and
HepG2 cells. Cytoplasmic VASH2 did not promote cell proliferation
in HepG2 cells in vitro and in vivo. The authors
attributed this to the possibility that VASH2 expression in HepG2
cells is already relatively high and that the exogenous VASH2
overexpression did not alter its function (4). Both nuclear and cytoplasmic VASH2 were
silenced when VASH2 was knocked down by shRNA, but the VASH2
overexpression detected was only that of cytoplasmic VASH2 in the
study by Xue et al (4). In
the present study, we confirmed that nuclear VASH2, encoding 311
amino acids, plays a definite role in promoting cell proliferation,
where its overexpression (with 311 amino acid residues) induced
cell proliferation significantly in HepG2 cells. Previously, we
also determined that nuclear VASH2 is dominant while cytoplasmic
VASH2 expression is very low in HepG2 cells (10). Our results are not in concordance
with the those of Xue et al (4) who reported that VASH2 expression in
HepG2 cells is already relatively high and that exogenous VASH2
overexpression has no effect on cell proliferation. We attribute
the effect on HepG2 cell proliferation to nuclear VASH2, not
cytoplasmic VASH2. However, we concede that cytoplasmic VASH2 may
not promote cell proliferation in HepG2 cells.
Thus, to the best of our knowledge, the present
study is the first to identify that nuclear VASH2 promotes cell
proliferation. The present study improves the understanding of the
functions of VASH2. However, the precise mechanism by which nuclear
VASH2 regulates cell proliferation remains to be investigated.
Acknowledgments
The present study was partially supported by the
National Natural Science Foundation of China (nos. 81272239,
81170336, 81172267 and 81372657), the Program for Development of
Innovative Research Team in the First Affiliated Hospital of the
Nanjing Medical University (Jiangsu, China), the Priority Academic
Development Program of Jiangsu Higher Education Institutions (PAPD,
JX10231801), the Special Research Fund for Public Welfare Industry
of Health (201202007) and the Graduate Education Innovation Project
of Jiangsu Province (JX22013230).
References
|
1
|
Shibuya T, Watanabe K, Yamashita H,
Shimizu K, Miyashita H, Abe M, Moriya T, Ohta H, Sonoda H,
Shimosegawa T, et al: Isolation and characterization of vasohibin-2
as a homologue of VEGF-inducible endothelium-derived angiogenesis
inhibitor vasohibin. Arterioscler Thromb Vasc Biol. 26:1051–1057.
2006. View Article : Google Scholar : PubMed/NCBI
|
|
2
|
Suzuki Y, Kobayashi M, Miyashita H, Ohta
H, Sonoda H and Sato Y: Isolation of a small vasohibin-binding
protein (SVBP) and its role in vasohibin secretion. J Cell Sci.
123:3094–3101. 2010. View Article : Google Scholar : PubMed/NCBI
|
|
3
|
Sato Y: The vasohibin family: A novel
family for angiogenesis regulation. J Biochem. 153:5–11. 2013.
View Article : Google Scholar
|
|
4
|
Xue X, Gao W, Sun B, Xu Y, Han B, Wang F,
Zhang Y, Sun J, Wei J, Lu Z, et al: Vasohibin 2 is
transcriptionally activated and promotes angiogenesis in
hepatocellular carcinoma. Oncogene. 32:1724–1734. 2013. View Article : Google Scholar
|
|
5
|
Takahashi Y, Koyanagi T, Suzuki Y, Saga Y,
Kanomata N, Moriya T, Suzuki M and Sato Y: Vasohibin-2 expressed in
human serous ovarian adenocarcinoma accelerates tumor growth by
promoting angiogenesis. Mol Cancer Res. 10:1135–1146. 2012.
View Article : Google Scholar : PubMed/NCBI
|
|
6
|
Koyanagi T, Saga Y, Takahashi Y, Suzuki Y,
Suzuki M and Sato Y: Downregulation of vasohibin-2, a novel
angiogenesis regulator, suppresses tumor growth by inhibiting
angiogenesis in endometrial cancer cells. Oncol Lett. 5:1058–1062.
2013.PubMed/NCBI
|
|
7
|
Tu M, Liu X, Han B, Ge Q, Li Z, Lu Z, Wei
J, Song G, Cai B, Lv N, et al: Vasohibin-2 promotes proliferation
in human breast cancer cells via upregulation of fibroblast growth
factor-2 and growth/differentiation factor-15 expression. Mol Med
Rep. 10:663–669. 2014.PubMed/NCBI
|
|
8
|
Li Z, Tu M, Han B, Gu Y, Xue X, Sun J, Ge
Q, Miao Y, Qian Z and Gao W: Vasohibin 2 decreases the cisplatin
sensitivity of hepatocarcinoma cell line by downregulating p53.
PLoS One. 9:e903582014. View Article : Google Scholar : PubMed/NCBI
|
|
9
|
Koyanagi T, Suzuki Y, Saga Y, Machida S,
Takei Y, Fujiwara H, Suzuki M and Sato Y: In vivo delivery of siRNA
targeting vasohibin-2 decreases tumor angiogenesis and suppresses
tumor growth in ovarian cancer. Cancer Sci. 104:1705–1710. 2013.
View Article : Google Scholar : PubMed/NCBI
|
|
10
|
Sun J, Tu M, Han B, Xue X, Zhang Y, Wei J,
Chen J, Lu Z, An Y, Cai B, et al: Generation and characterization
of rabbit polyclonal antibodies against Vasohibin-2 for
determination of its intracellular localization. Int J Oncol.
43:255–261. 2013.PubMed/NCBI
|
|
11
|
Tang S, Wang Y, Zhang D, Gao Y, Ma Y, Yin
B, Sun J, Liu J and Zhang Y: Reprogramming donor cells with oocyte
extracts improves in vitro development of nuclear transfer embryos.
Anim Reprod Sci. 115:1–9. 2009. View Article : Google Scholar
|
|
12
|
Lin J, Lin X, Yang GH, Wang Y, Peng BW and
Lin JY: Toxoplasma gondii: Expression of GRA1 gene in endoplasmic
reticulum promotes both growth and adherence and modulates
intracellular calcium release in macrophages. Exp Parasitol.
125:165–171. 2010. View Article : Google Scholar : PubMed/NCBI
|
|
13
|
Dolbeare F: Bromodeoxyuridine: A
diagnostic tool in biology and medicine, part III. proliferation in
normal, injured and diseased tissue, growth factors,
differentiation, DNA replication sites and in situ hybridization.
Histochem J. 28:531–575. 1996. View Article : Google Scholar : PubMed/NCBI
|
|
14
|
Danova M, Riccardi A and Mazzini G: Cell
cycle-related proteins and flow cytometry. Haematologica.
75:252–264. 1990.PubMed/NCBI
|
|
15
|
Scholzen T and Gerdes J: The Ki-67
protein: From the known and the unknown. J Cell Physiol.
182:311–322. 2000. View Article : Google Scholar : PubMed/NCBI
|
|
16
|
Cohen SM, Ohnishi T, Clark NM, He J and
Arnold LL: Investigations of rodent urinary bladder carcinogens:
Collection, processing, and evaluation of urine and bladders.
Toxicol Pathol. 35:337–347. 2007. View Article : Google Scholar : PubMed/NCBI
|
|
17
|
Dwivedi N, Chandra S, Kashyap B, Raj V and
Agarwal A: Suprabasal expression of Ki-67 as a marker for the
severity of oral epithelial dysplasia and oral squamous cell
carcinoma. Contemp Clin Dent. 4:7–12. 2013. View Article : Google Scholar : PubMed/NCBI
|
|
18
|
Kramer E, Herman O, Frand J, Leibou L,
Schreiber L and Vaknine H: Ki67 as a biologic marker of basal cell
carcinoma: A retrospective study. Isr Med Assoc J. 16:229–232.
2014.PubMed/NCBI
|
|
19
|
Luo Y, Kleiboeker S, Deng X and Qiu J:
Human parvovirus B19 infection causes cell cycle arrest of human
erythroid progenitors at late S phase that favors viral DNA
replication. J Virol. 87:12766–12775. 2013. View Article : Google Scholar : PubMed/NCBI
|
|
20
|
Robertson DS: The development of tumor
cell characteristics. J Cell Physiol. 229:705–710. 2014. View Article : Google Scholar : PubMed/NCBI
|
|
21
|
Zhao P, Fu JL, Yao BY, Jia YR and Zhou ZC:
S phase cell percentage normalized BrdU incorporation rate, a new
parameter for determining S arrest. Biomed Environ Sci. 27:215–219.
2014.PubMed/NCBI
|
|
22
|
Bahrami F, Morris DL, Rufener L and
Pourgholami MH: Anticancer properties of novel aminoacetonitrile
derivative monepantel (ADD 1566) in pre-clinical models of human
ovarian cancer. Am J Cancer Res. 4:545–557. 2014.PubMed/NCBI
|