Introduction
Ovarian cancer is a lethal disease characterized by
early metastasis. According to the American Cancer Society, 21,980
women developed ovarian cancer and 14,270 women succumbed to this
disease in 2014 in the US (1).
Ovarian cancer is histologically heterogeneous, and 50–70% of
ovarian cancers are high-grade serous ovarian carcinoma (HGSC).
Most patients (up to 70%) are diagnosed at an advanced stage.
Despite advances in medical research, the survival rate of ovarian
cancer has remained unchanged in the past 50 years (2,3). Thus,
it is crucial to identify a potential therapeutic target for
HGSC.
High-mobility gene group A2 (HMGA2), as an
oncofetal protein, participates in ovarian carcinogenesis (4,5).
HMGA2 is overexpressed in >70% of early serous tubal
intraepithelial carcinoma (STIC) and late stages of human HGSC
(6), as well as in early ovarian
cancer in a mouse model (4).
HMGA2 overexpression resulted in malignant tumor
transformation in ovarian epithelial cells (7). Silencing HMGA2 in ovarian
cancer cells inhibited tumor growth in vivo (8). The oncogenic properties of
HMGA2 in promoting the aggressiveness of malignancy were
mainly attributed to its regulation of epithelial-mesenchymal
transition (EMT) (9–11). A global gene profiling analysis
revealed that HMGA2 overexpression upregulated stanniocalcin
2 (STC2) (7).
Stanniocalcin (STC) is a glycoprotein hormone
originally found to be produced by the corpuscles of Stannous in
bony fish. Its main function is to regulate calcium and phosphate
homeostasis (12). This hormone has
two members: The STC1 gene, mapped at chromosome 8p11, whose
protein contains 247 amino acids and the STC2 gene, located
at 5q35, whose protein consists of 302 amino acids and has 34%
homology to STC1 (13). STC1
was reported to be a Ras-induced gene leading to the
aggressive tumor growth of ovarian cancer in vitro and in
vivo (14). STC2
overexpression was found to be associated with cancer progression
and worse clinical outcome (15–18).
Previous findings showed that STC2 was regulated by HIF-1
under hypoxic conditions and the induction of STC2
stimulated cell proliferation and promoted EMT formation in ovarian
cancer (19). The exact regulation
mechanism of STC2 in cancer, in particular in ovarian cancer
remains unknown.
In the present study, we characterized the oncogenic
properties of STC2 in ovarian cancer cells and investigated
HMGA2-mediated STC2 upregulation. We found that
STC2 was directly upregulated by HMGA2 at the
transcriptional level. STC2 promoted cell migration and
invasion in vitro. Of note, studies of several large cohorts
focusing on human ovarian cancer populations revealed that the
expression of HMGA2 and STC2 was positively
correlated and associated with tumor grades and histologic
subtypes. High STC2 was associated with poor clinical
outcome of ovarian cancer.
Materials and methods
Patients and tissue samples
Three ovarian cancer populations were used in the
present study. The training set consisted of 278 ovarian cancer
cases was purchased from US Biomax Inc. (Rockville, MD, USA). The
validation set consisted of 150 ovarian cancer cases and was
purchased from Super BioTek (Shanghai, China). The clinical
biodemography, pathological features and clinical outcomes of
patients were collected by retrospective chart review (Table I). The third cohort of 95 patients
with ovarian cancer was obtained from the Northwestern Memorial
Hospital between 2002 and 2007. This cohort had follow-up
information and the information was previously reported (20). Ethics approval for the study was
obtained from the Institutional Review Board.
 | Table ICharacteristics of the training
(n=278) and validation cohort (n=150). |
Table I
Characteristics of the training
(n=278) and validation cohort (n=150).
|
Characteristics | Training cohort
(%) | Validation cohort
(%) |
|---|
| Age (years) | | |
| ≤50 | 160 (57.6) | 69
(46.0) |
| >50 | 118 (42.4) | 81
(54.0) |
| T stage | | |
| T1 | 194 (69.8) | 72
(48.0) |
| T2 | 39
(14.0) | 52
(34.7) |
| T3 | 33
(11.9) | 26
(17.3) |
| T4 | 12
(4.3) | 0
(0.0) |
| Grading | | |
| 1 | 75
(27.0) | 44
(29.3) |
| 2 | 79
(28.4) | 50
(33.3) |
| 3 | 124 (44.6) | 56
(37.3) |
| Node
metastasis | | |
| Absent | 243 (87.4) | 143 (95.3) |
| Present | 35
(12.6) | 7
(4.7) |
| Distant
metastasis | | |
| Absent | 266 (95.7) | 135 (90.0) |
| Present | 12
(4.3) | 15
(10.0) |
| Histotype | | |
| Serous | 222 (79.9) | 108 (72.0) |
| Mucinous | 56
(20.1) | 42
(28.0) |
| Total | 278 (100) | 150 (100) |
Stable overexpression of STC2 in T29
cells
T29 were plated in 6-well plates in antibiotic-free
medium. When the cells reached 70–80% confluence, each well was
transfected with a mixture containing either 4 μg of
pCMV6-STC2 or control pCMV6 and 10 μl of Lipofectamine 2000.
Seventy-two hours after transfection, the cells were selected for
20–30 days in the presence of 600 ng/μl G418. Single
colonies with STC2 overexpression were selected and confirmed by
western blot analysis.
Stable knockdown of STC2 in Caov-3
cells
STC2 shRNA (pGPU6/GFP/Neo-shRNA-1604 with
target sequence GGGCAAGTCATTCATCAAAGA) and STC2 control (the
scrambled shRNA construct pGPU6/GFP/Neo-shNC) plasmids were
transfected into cells using Lipofectamine 2000 as previously
described (7). Single colonies with
STC2 knockdown were selected and confirmed by western blot
analysis.
Wound-healing assay
The cells (9×10⁵) were seeded in 6-well
plates and allowed to reach confluence overnight in culture medium.
A linear scratch was created using a sterile pipette tip. The media
were then changed to remove any detached cells and the scratched
areas were photographed under an inverted microscope at indicated
time points. At least three fields along each scratch were analyzed
and the experiment was performed in triplicate.
Transwell migration and Matrigel invasion
assays
Cells (1×10⁵/well) were suspended in 200
μl of serum-free medium and then seeded on the upper side of
a 24-well Transwell migration chamber (Corning Inc., Corning, NY,
USA). After 48 h, the cells retained on the upside of the membrane
were removed by cotton swab. The cells that migrated onto the
bottom side were fixed by 10% formalin, stained by 0.1% crystal
violet and observed under microscope at a magnification of ×100.
The Matrigel invasion assay was similar to the Transwell migration
assay, except that the upside of the membrane was coated with the
Matrigel.
Immunohistochemical analysis
After formalin-fixed and paraffin-embedded tissue
samples were treated with xylene and ethanol, antigen retrieval was
performed in 1 l of citrate buffer (0.01 mol/l, pH 6.0) at 95°C for
10 min. Endogenous peroxidase activity was inactivated with 3%
H2O2 for 10 min at room temperature (RT) and
slides were blocked in 10% goat serum at RT for 30 min. The
sections were then incubated with rabbit polyclonal anti-HMGA2
(1:100; Bio-Check, Inc. (Foster City, CA, USA) or rabbit polyclonal
anti-STC2 (1:100; Abcam, Cambridge, MA, USA) at 4°C overnight.
Subsequently, the sections were treated with secondary antibody at
RT for 1 h. The slides were incubated with diaminobenzidine (DAB)
and counterstained with hematoxylin. Immunohistochemical staining
scoring was semi-quantitatively evaluated by staining intensity and
the percentage of positive cells. The percentage positivity was
graded as 0 (<5%), 1 (5–25%), 2 (25–50%), 3 (51–75%), or 4
(>75%). The staining intensity was graded as 0 (no staining), 1
(weak staining), 2 (moderate staining) or 3 (strong staining). The
two grades were added together to yield the immunoreactive score
(IRS). Cases with discrepancies in IRS were discussed with other
pathologists until consensus was reached. Evaluation of
immunohistochemical staining was carried out by two pathologists
(J.-J. Wei and M. Lai) blinded to the clinicopathological
characteristics.
Western blotting
Equal amounts (25 μg) of total proteins were
resolved by 12% SDS-PAGE and transferred to polyvinylidene fluoride
(PVDF) membranes. The membranes were blocked with 5% non-fat milk
for 1 h at RT and incubated with primary antibodies at 4°C
overnight, including rabbit polyclonal anti-STC2 (1:200; Abcam) and
mouse monoclonal anti-β-actin (1:1,000; Sigma, St. Louis, MO, USA).
The secondary antibody was then detected by an enhanced
chemiluminescence kit (Perkin-Elmer, Waltham, MA, USA).
Luciferase assay
The upstream regions of human STC2 from −290/+43,
−647/+43, −1,313/+43, −1,313/−620 were generated by PCR (Table II) and cloned into the pGL3-basic
plasmid. The 293T cells were seeded in 24-well plates at densities
of 7×10⁴/well. After 24 h, 0.1 μg of pRL-TK, 0.5
μg of pGL3-STC2 and the indicated amounts (0, 0.2, 0.4 and
0.8 μg) of pcDNA3.1-HMGA2, along with varied amounts (0.8,
0.6, 0.4 and 0 μg) of blank pcDNA3.1 plasmid were
transfected into 293T cells by Lipofectamine 2000. Forty-eight
hours after transfection, the firefly luciferase activity was
measured with the Dual-Luciferase Reporter Assay System (Promega,
Madison, WI, USA), and results were normalized by Renilla
luciferase activity. The experiments were repeated at least three
times with three replicates per sample.
| Table IIPrimers for construction of STC2
promoter in pGL3 luciferase plasmid. |
Table II
Primers for construction of STC2
promoter in pGL3 luciferase plasmid.
| Primer site | Sequences
5′-3′ | Product (bp) |
|---|
| −290 to +43 | F:
5′-CCGCTCGAGACTCCTTCATTCAAGTGACA-3′ |
334 |
| R:
5′-CCCAAGCTTACCAAAGCCAGGGTCATG-3′ | |
| −647 to +43 | F:
5′-CCGCTCGAGAACTTTCCCAACCCGATGT-3′ |
691 |
| R:
5′-CCCAAGCTTACCAAAGCCAGGGTCATG-3′ | |
| −1,313 to +43 | F:
5′-CCGCTCGAGAACTTTCTCCTTCCCTCCA-3′ | 1,357 |
| R:
5′-CCCAAGCTTACCAAAGCCAGGGTCATG-3′ | |
| −1,313 to −620 | F:
5′-CCGCTCGAGAACTTTCTCCTTCCCTCCA-3′ |
694 |
| R:
5′-CCCAAGCTTGTCACACCCACATCGGGTT-3′ | |
Statistical analysis
The associations between expression status and
clinicopathological characteristics were assessed using the
χ2 test. Overall survival curves were calculated for the
expression groups using the Kaplan-Meier method. RNA and protein
expression levels were presented as means ± standard deviation from
at least three independent experiments. Data were analyzed by the
Student's t-test in two groups and one-way ANOVA in multiple
groups. SPSS 17.0 software was used for statistical analysis.
P<0.05 was considered to indicate a statistically significant
result.
Results
Overexpression of STC2 promotes cell
migration and invasion in ovarian surface epithelial cells in
vitro
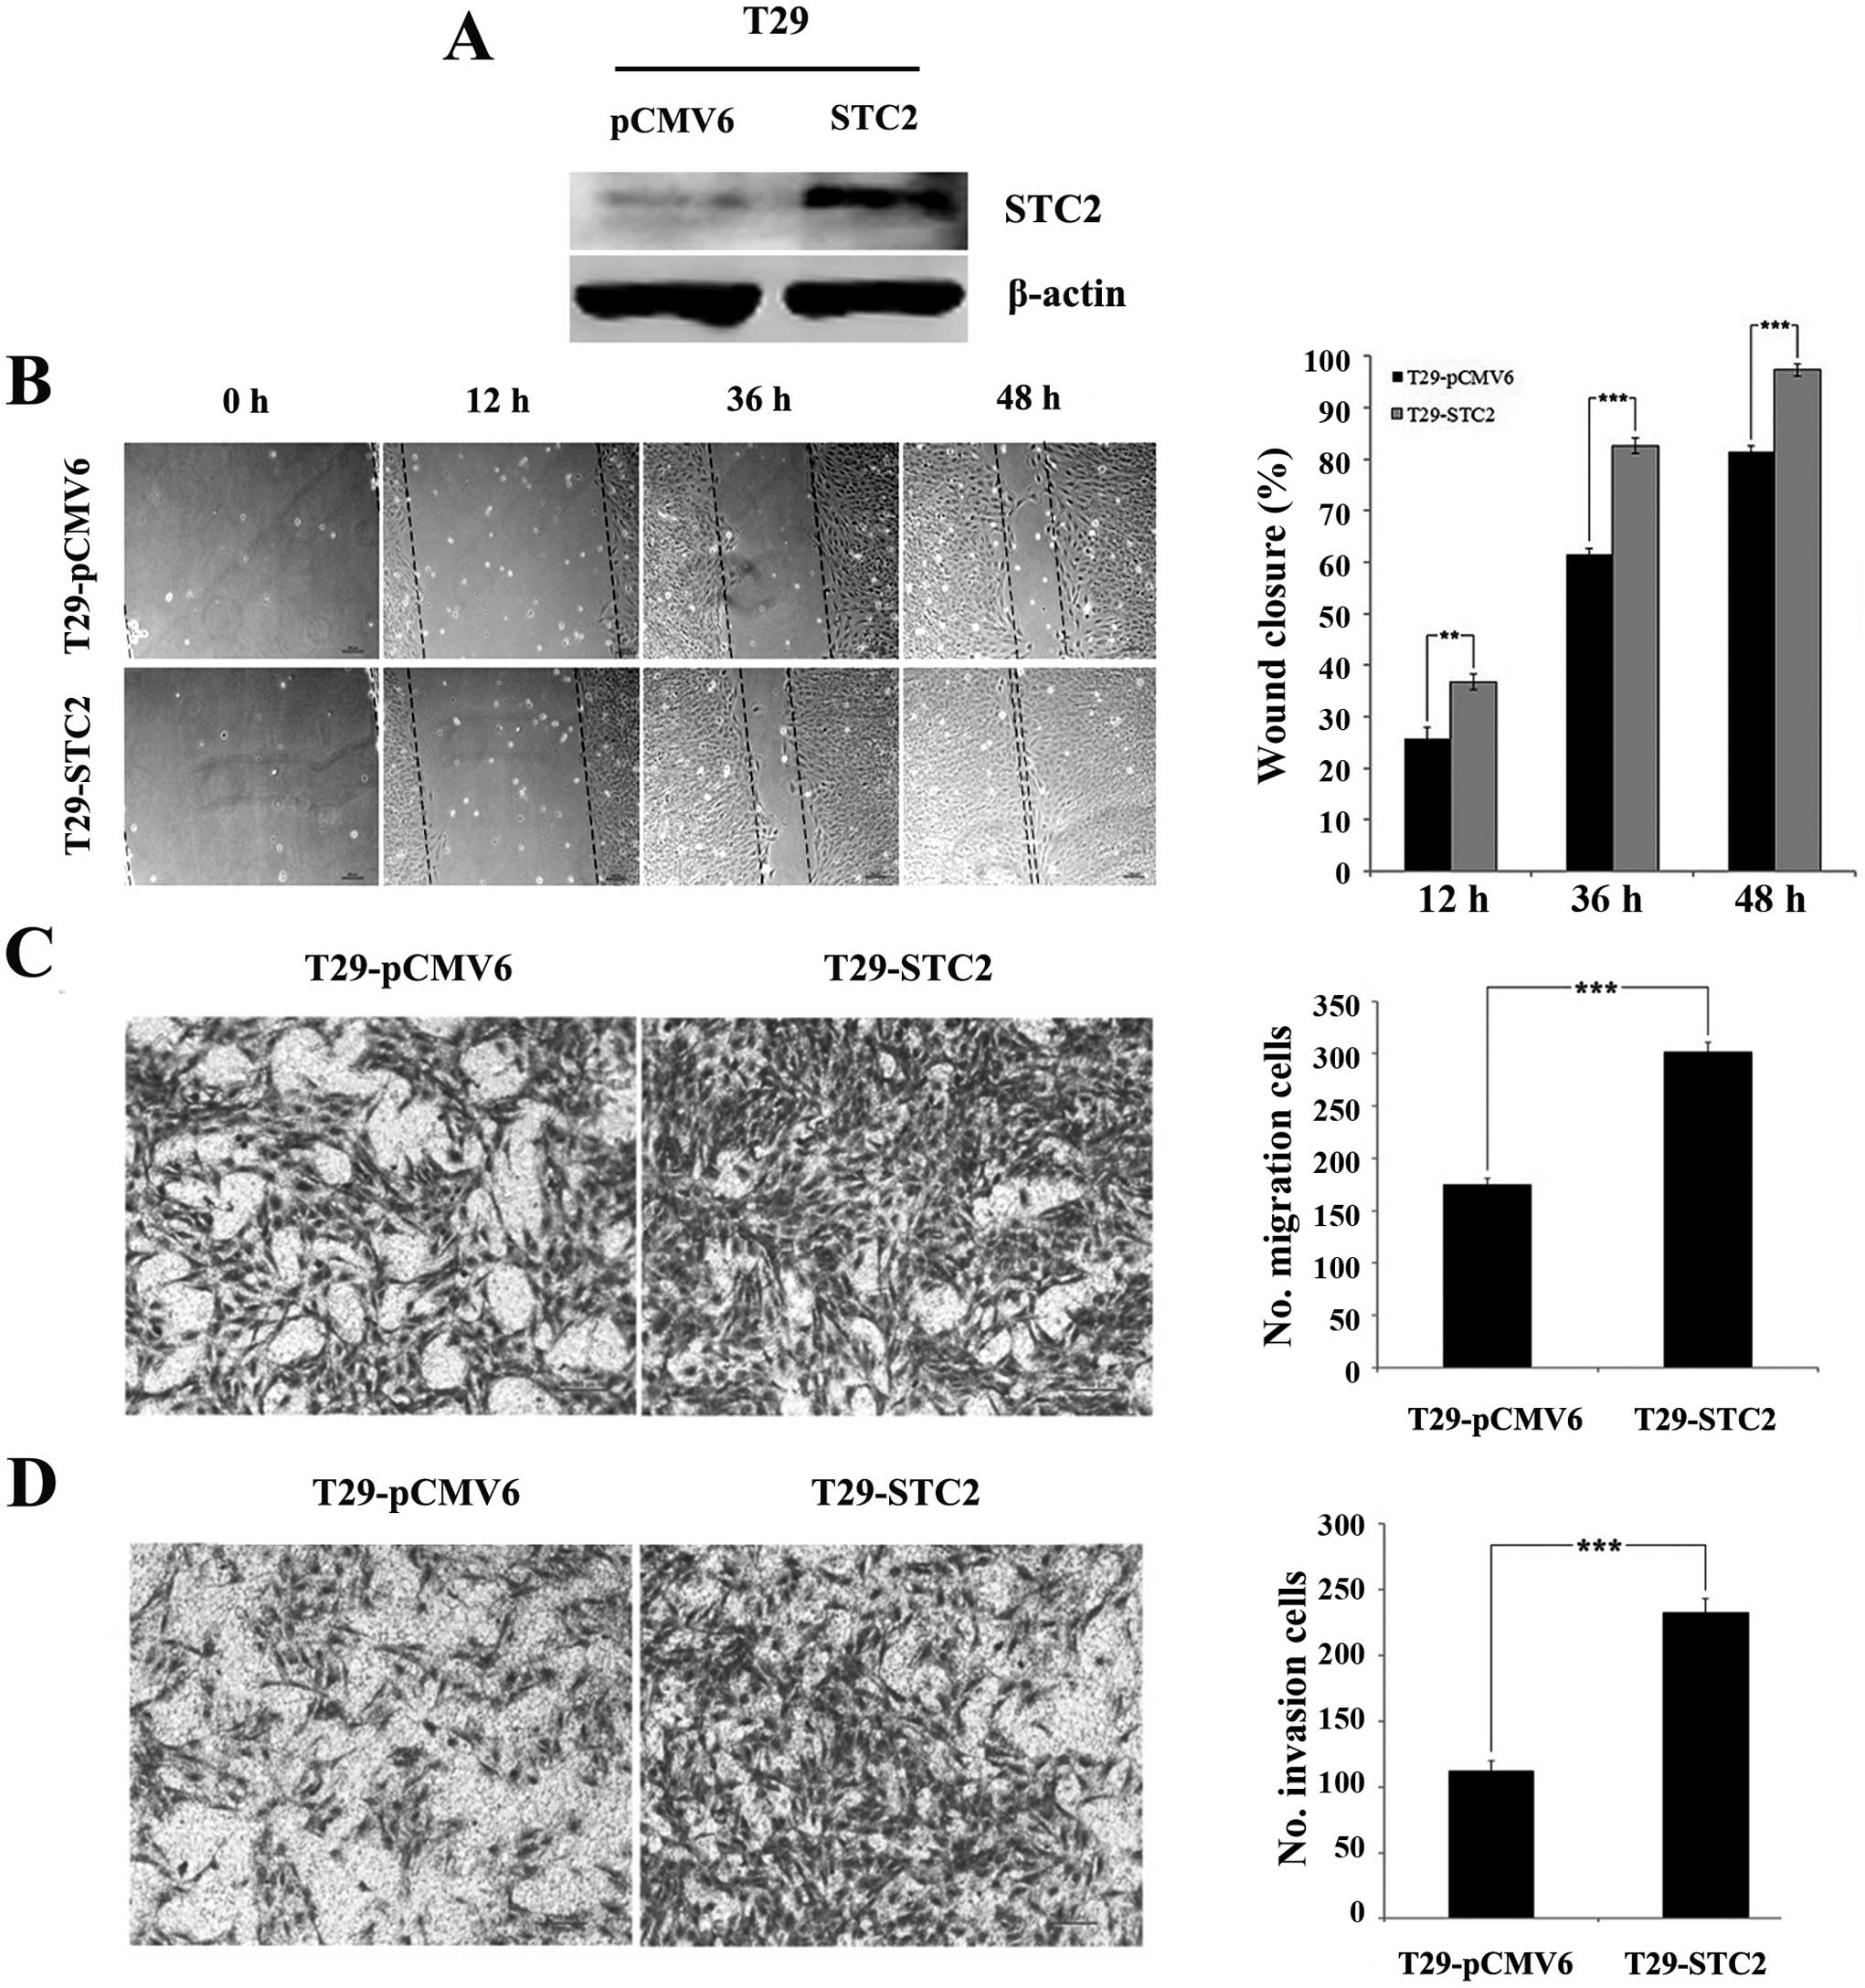
To examine the roles of STC2 in cell
mobility, a stable STC2 overexpression was established in an
ovarian T29 surface epithelial cell line (T29-STC2)
(Fig. 1A). Cells with a vector
control (T29-pCMV6) were used. Introduction of STC2
overexpression enhanced cell metastasis and invasion in
vitro. The wound-healing assay revealed that the closure rates
of T29-STC2 at 12, 36 and 48 h (36.77±1.55, 82.59±1.50 and
97.33±1.15%) were significantly higher than those of T29-pCMV6
(25.69±2.22, 61.50±1.10 and 81.45±1.13%; P<0.01, Fig. 1B). The Transwell chamber assay
indicated that migration of the T29-STC2 cells (301.33±9.29)
was significantly higher than that of T29-pCMV6 (174.67±6.03,
P<0.001, Fig. 1C) at 24 h. In
the Matrigel invasion assay, we also observed a significant
induction of the invasive potential of T29-STC2
(232.67±10.69) compared to that of the control (112.33±7.57,
P<0.001, Fig. 1D). These results
demonstrated that STC2 overexpression promoted the migration
and invasion of ovarian surface epithelial cells in
vitro.
Knockdown of STC2 inhibits cell migration
and invasion in ovarian cancer cells in vitro
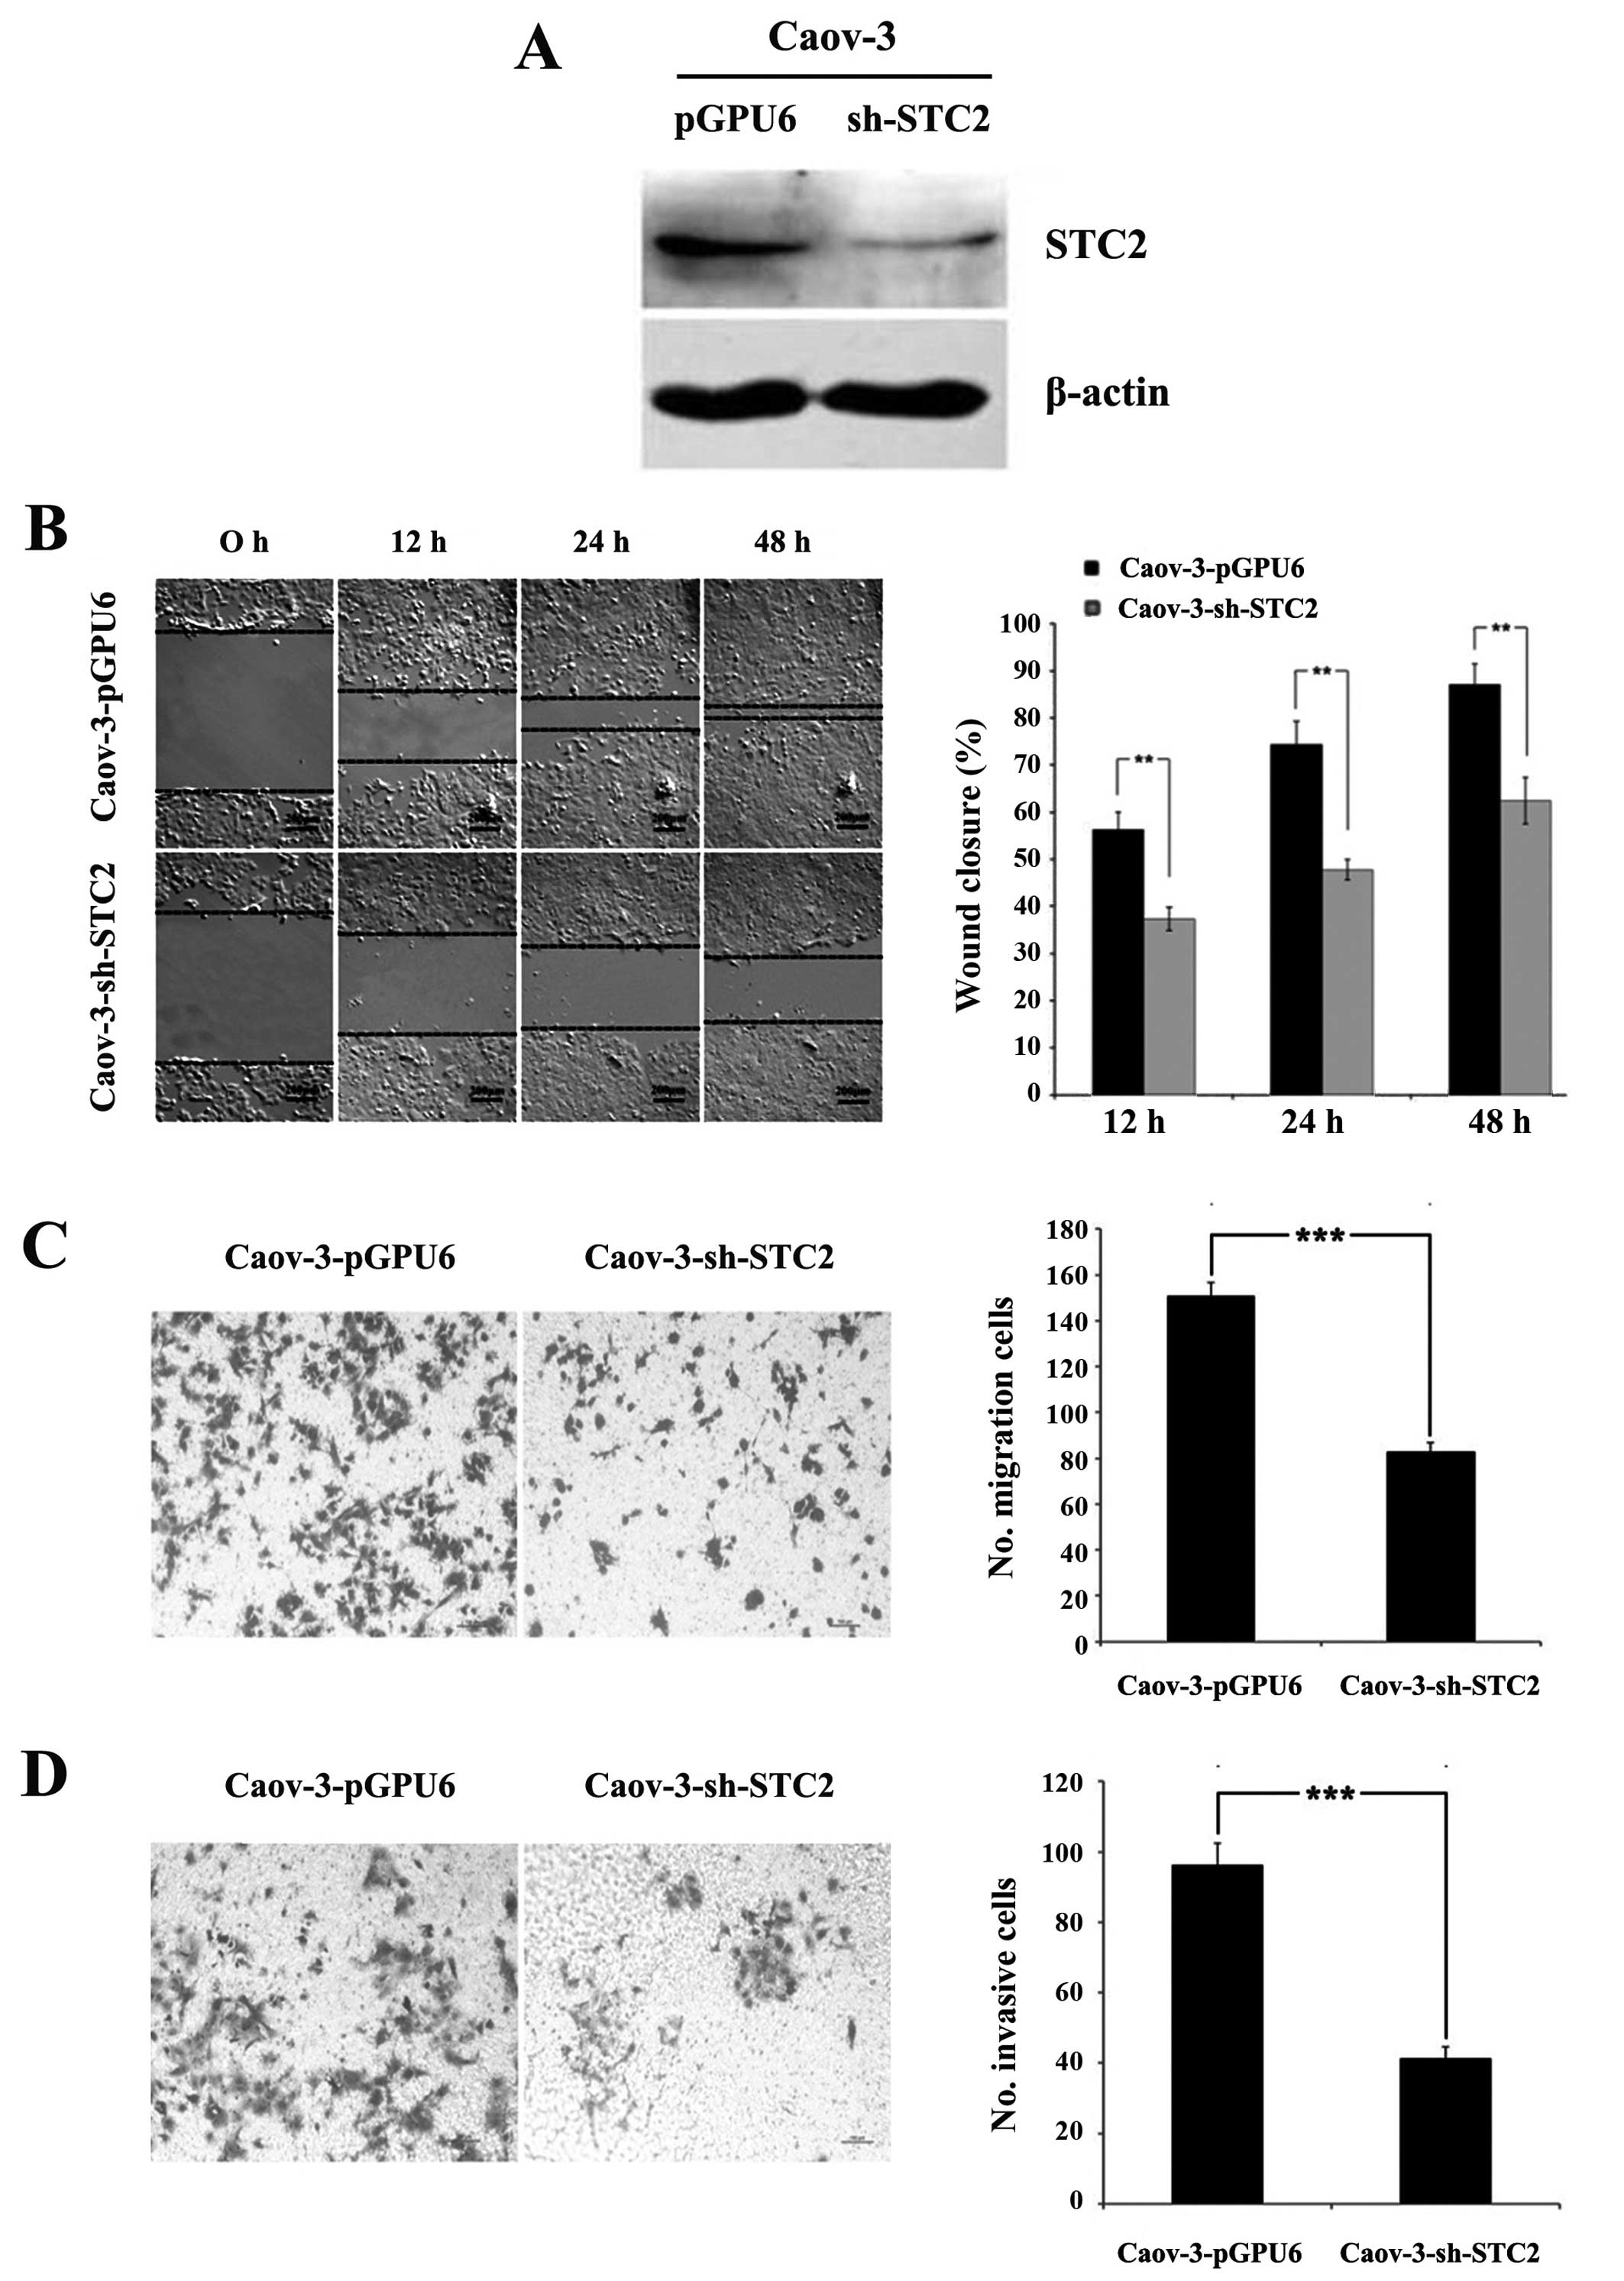
To investigate whether blocking STC2 restored
or reduced the cell aggressiveness, we used the ovarian cancer cell
line, Caov-3. Caov-3 exhibited abundant endogenous STC2
expression. A stable knockdown cell (Caov-3-sh-STC2) and
scrambled control cell (Caov-3-pGPU6) were prepared (Fig. 2A).
The wound closure rates of Caov-3-sh-STC2 at 12, 24
and 48 h (37.35±2.50, 47.79±2.20 and 62.48±4.89%) were
significantly lower than those of Caov-3-pGPU6 (56.28±3.69,
74.33±4.91 and 87.10±4.35%, P<0.01, Fig. 2B), indicating that the
downregulation of STC2 reduced the locomotion of the cancer cells.
Similarly, the number of cells migrating through the Transwell
membrane was significantly reduced in Caov-3-sh-STC2 cells (83±4),
compared with the Caov-3-pGPU6 cells (151±5.57, P<0.001,
Fig. 2C). The Matrigel invasion
assay revealed that blocking STC2 expression inhibited the
invasiveness of Caov-3 cells (41.33±3.21 for Caov-3-sh-STC2 cells
vs. 96.33±6.02 for Caov-3-pGPU6 cells, P<0.001, Fig. 2D). These results indicated that
knockdown of STC2 inhibited cell migration and invasion in ovarian
cancer in vitro.
STC2 is regulated by HMGA2 at
transcription levels
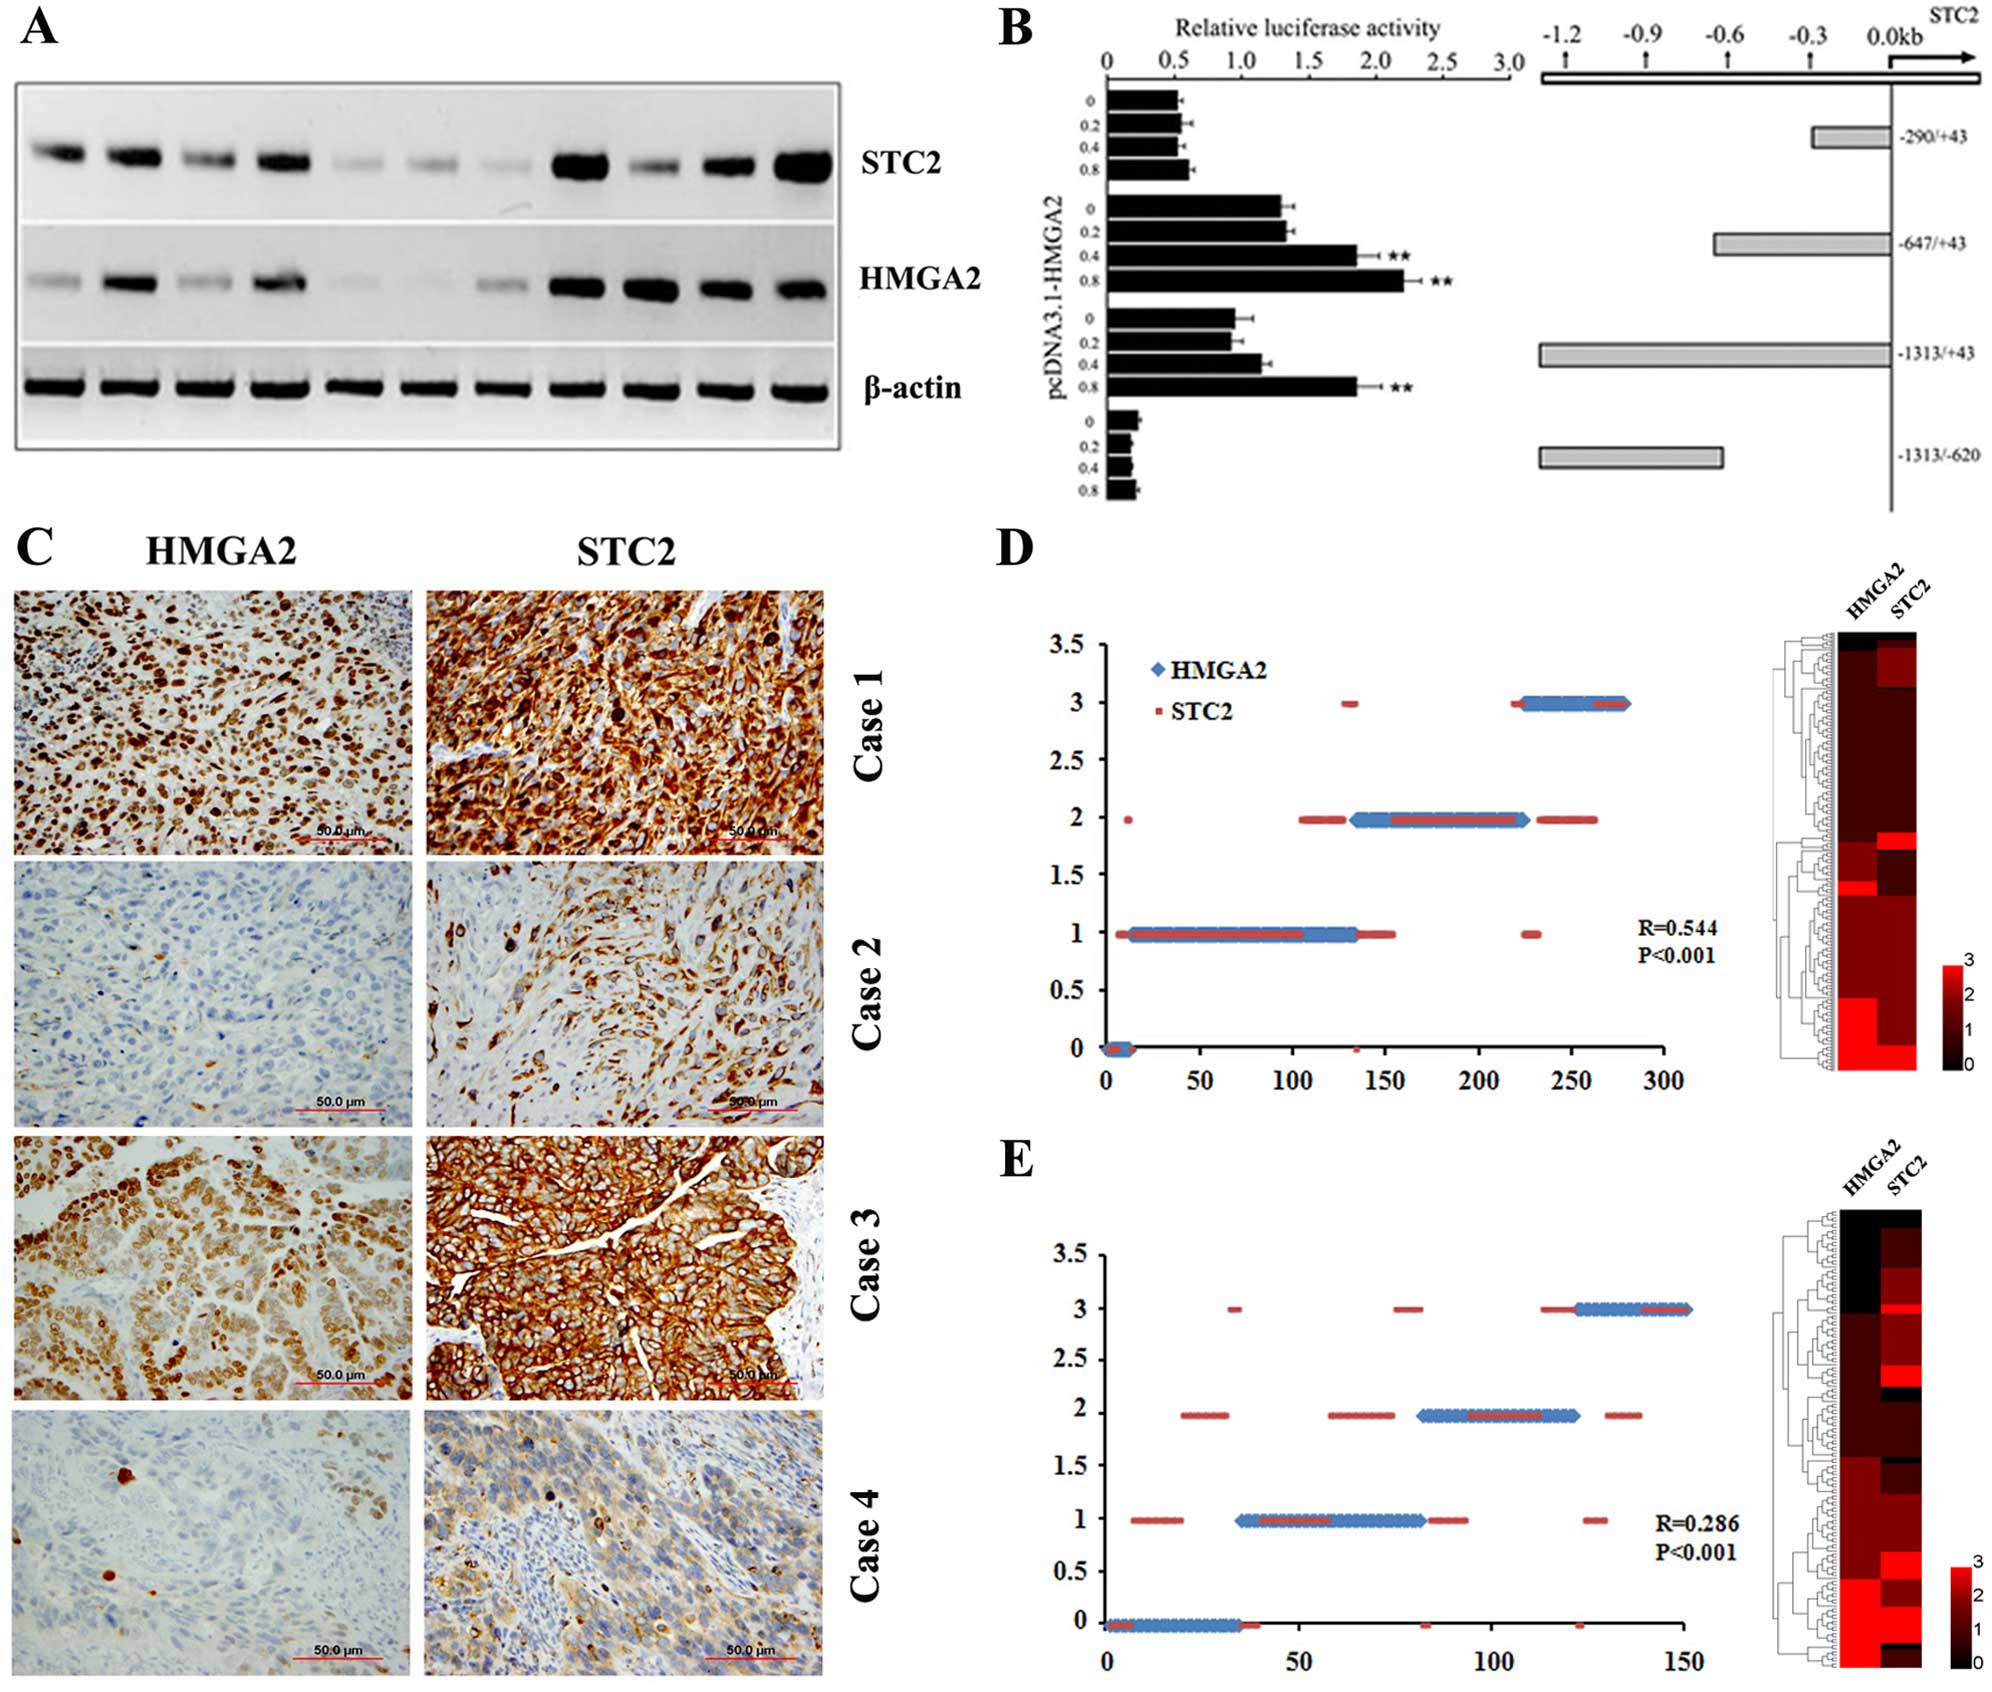
Gene profiling analysis revealed that ovarian
epithelial cells with HMGA2 overexpression enhanced
STC2 expression (7). To
determine whether HMGA2 directly regulated STC2
expression, we examined HMGA2 and STC2 expression at
transcription levels using RT-PCR in 11 randomly selected HGSC
samples. As shown in Fig. 3A, there
was a correlation between HMGA2 and STC2 expression.
We then investigated whether the increased STC2 expression
was directly regulated by HMGA2 at the transcription level.
The sequence analysis revealed multiple HMGA2 AT binding
domains (21) along the 1,200 bp
region upstream from the 5′ transcription start site of
STC2. To define the genomic regions that were possibly
regulated by HMGA2, we prepared several luciferase reporter
constructs representing different parts of the STC2 promoter
(Fig. 3B). The genomic region
immediately adjacent to the STC2 transcription start site,
up to −600 bp, conferred a significant increase in luciferase
expression when co-transfected with the HMGA2 expression
vector (Fig. 3B). Elevation in
luciferase activity in response to HMGA2 co-transfection was
dose-dependent (Fig. 3B). By
contrast, the upstream sequence beyond this region showed minimal
activity in driving luciferase expression, indicating that the
HMGA2 regulatory region was mostly confined to the +1 to
−600 bp promoter region of STC2. The findings suggested that
HMGA2-induced STC2 upregulation was likely mediated
by transcription regulation.
STC2 expression is positively correlated
with HMGA2 expression in epithelial ovarian cancer
The abovementioned results indicated that
STC2 was associated with aggressive tumor growth and was
regulated by HMGA2. To examine whether STC2 expression was
correlated with HMGA2 expression at the protein level in epithelial
ovarian cancer (EOC), immunohistochemical analysis (Fig. 3C) was employed for measurement of
the protein expressions in two cohorts of the EOC cases. The
results showed a moderate correlation between HMGA2 and STC2
expression in the training cohort (R=0.544, P<0.001, Fig. 3D) and validation cohort (R=0.286,
P<0.001, Fig. 3E). These
findings suggested that STC2 expression was mainly regulated by
HMGA2 but may also be regulated by other genes or pathways.
Expression of STC2 correlates with tumor
grade and histologic subtype
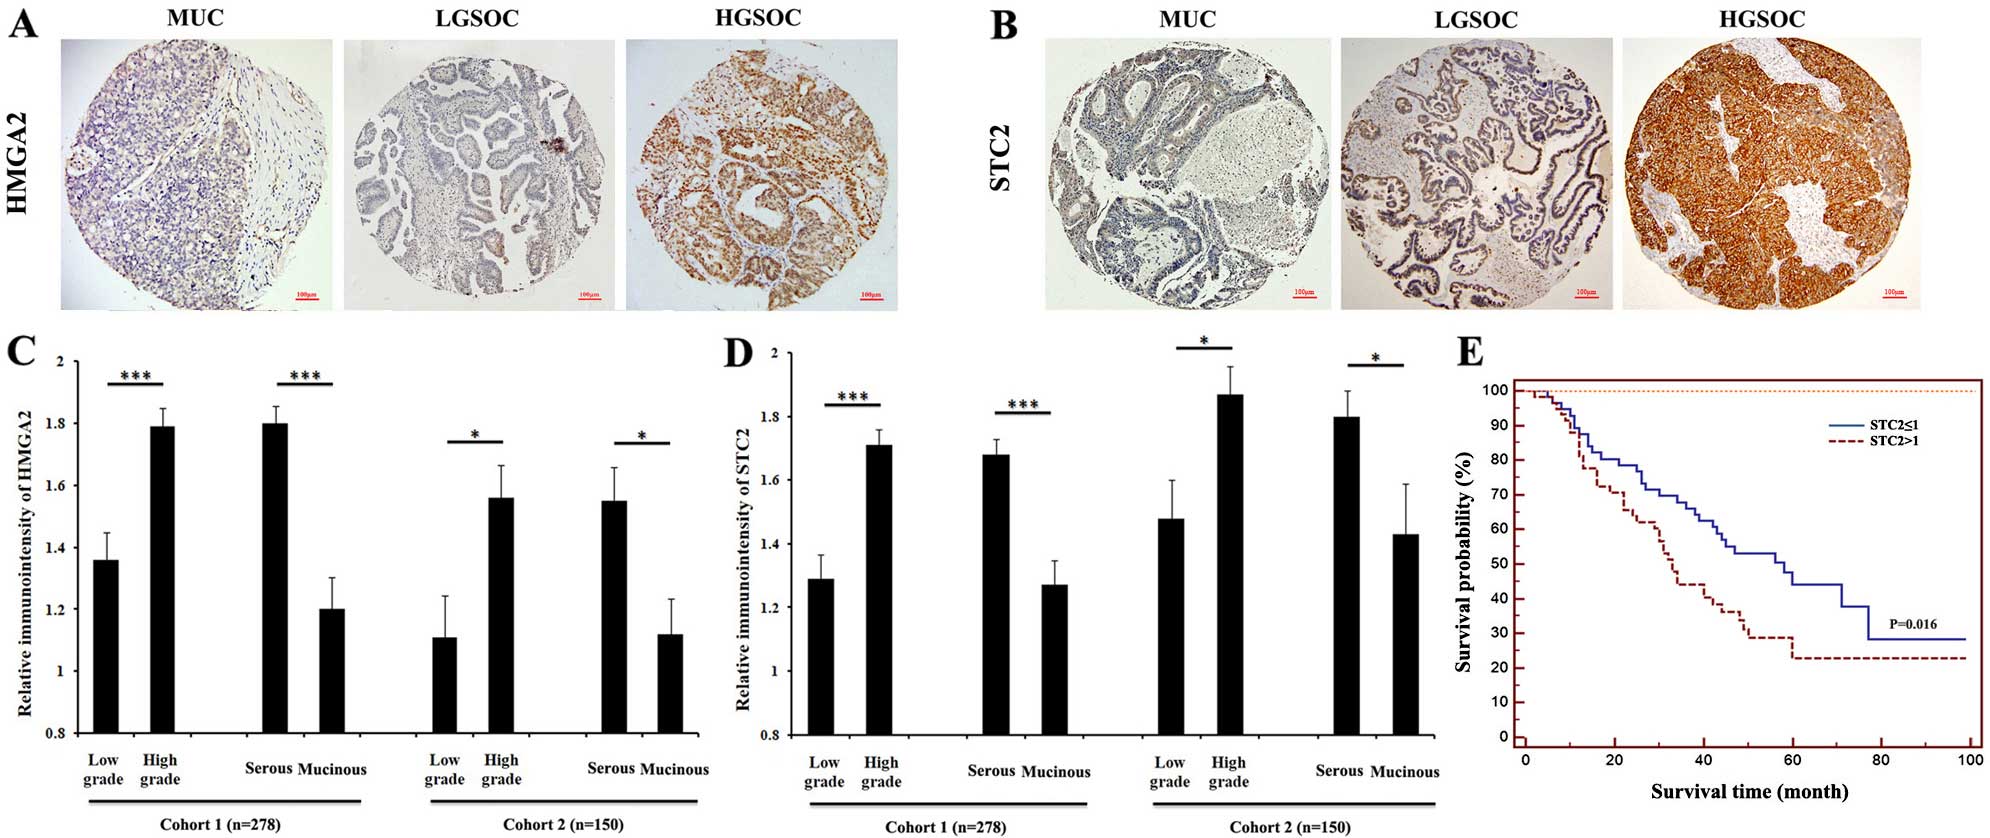
The clinicopathological characteristics of the
training and validation cohort are shown in Table I. As shown in Tables III and IV and Fig.
4, strong immunoreactivity for HMGA2 and STC2 staining were
closely associated with tumor grade. In the training cohort, the
patients with higher grade had a significantly higher HMGA2
(P<0.001; Table III, Fig. 4A and C). A similar trend was
observed in STC2 expression (P<0.001; Table III, Fig. 4B and D). The validation cohort
results were consistent with those of the training cohort.
Increasing tumor grade showed a statistically positive association
with a higher expression of HMGA2 (P=0.003; Table IV, Fig.
4A and C) and STC2 (P=0.013; Table
IV, Fig. 4B and D).
| Table IIIAssociation of HMGA2 and STC2
expression with clinicopathological characteristics in the training
set (n=278). |
Table III
Association of HMGA2 and STC2
expression with clinicopathological characteristics in the training
set (n=278).
|
Characteristics | Patients | HMGA2
immunoreactivity
| STC2
immunoreactivity
|
|---|
No. of patients (%)
| | No. of patients (%)
| |
|---|
| Low | High | P-value | Low | High | P-value |
|---|
| Age (years) | | | | | | | |
| ≤50 | 160 | 72
(45.0) | 88
(55.0) |
0.269 | 75
(46.9) | 85
(53.1) |
0.923 |
| >50 | 118 | 61
(51.7) | 57
(48.3) | | 56
(47.5) | 62
(52.5) | |
| T stage | | | | | | | |
| T1+T2 | 233 | 108 (46.4) | 125 (53.6) |
0.258 | 106 (45.5) | 127 (54.5) |
0.216 |
| T3+T4 | 45 | 25
(55.6) | 20
(44.4) | | 25
(55.6) | 20
(44.4) | |
| Grading | | | | | | | |
| Low | 75 | 49
(65.3) | 26
(34.7) |
<0.001 | 53
(70.7) | 22
(29.3) |
<0.001 |
| High | 203 | 84
(45.6) | 119 (54.4) | | 78
(43.0) | 125 (57.0) | |
| Node
metastasis | | | | | | | |
| Absent | 243 | 114 (46.9) | 129 (53.1) |
0.414 | 111 (45.7) | 132 (54.3) |
0.204 |
| Present | 35 | 19
(54.3) | 16
(45.7) | | 20
(57.1) | 15
(42.9) | |
| Distant
metastasis | | | | | | | |
| Absent | 266 | 128 (48.1) | 138 (51.9) |
0.662 | 124 (46.6) | 142 (53.4) |
0.426 |
| Present | 12 | 5
(41.7) | 7
(58.3) | | 7
(58.3) | 5
(41.7) | |
| Histotype | | | | | | | |
| Serous | 222 | 92
(41.4) | 130 (58.6) |
<0.001 | 90
(40.5) | 132 (59.5) |
<0.001 |
| Mucinous | 56 | 41
(73.2) | 15
(26.8) | | 41
(73.2) | 15
(26.8) | |
| Table IVAssociation of HMGA2 and STC2
expression with clinicopathological characteristics in the
validation cohort (n=150). |
Table IV
Association of HMGA2 and STC2
expression with clinicopathological characteristics in the
validation cohort (n=150).
|
Characteristics | Patients | HMGA2
immunoreactivity
| STC2
immunoreactivity
|
|---|
No. of patients (%)
| | No. of patients (%)
| |
|---|
| Low | High | P-value | Low | High | P-value |
|---|
| Age (years) | | | | | | | |
| ≤50 | 69 | 40 (58.0) | 29 (42.0) | 0.368 | 27 (39.1) | 42 (60.9) | 0.613 |
| >50 | 81 | 41 (50.6) | 40 (49.4) | | 35 (43.2) | 46 (56.8) | |
| T stage | | | | | | | |
| T1+T2 | 124 | 70 (56.5) | 54 (43.5) | 0.188 | 52 (41.9) | 72 (58.1) | 0.744 |
| T3 | 26 | 11 (42.3) | 15 (57.7) | | 10 (38.5) | 16 (61.5) | |
| Grading | | | | | | | |
| Low | 44 | 32 (72.7) | 12 (27.3) | 0.003 | 25 (56.8) | 19 (43.2) | 0.013 |
| High | 106 | 49 (46.2) | 57 (53.8) | | 37 (34.9) | 69 (65.1) | |
| Node
metastasis | | | | | | | |
| Absent | 143 | 79 (55.2) | 64 (44.8) | 0.167 | 59 (41.3) | 84 (58.7) | 0.933 |
| Present |
7 | 2
(28.6) | 5
(71.4) | | 3
(42.9) | 4
(57.1) | |
| Distant
metastasis | | | | | | | |
| Absent | 135 | 76 (56.3) | 59 (43.7) | 0.090 | 55 (40.7) | 80 (59.3) | 0.658 |
| Present | 15 | 5
(33.3) | 10 (66.7) | | 7
(46.7) | 8
(53.3) | |
| Histotype | | | | | | | |
| Serous | 108 | 49 (45.4) | 59 (54.6) | 0.001 | 38 (35.2) | 70 (64.8) | 0.014 |
| Mucinous | 42 | 32 (76.2) | 10 (23.8) | | 24 (57.1) | 18 (42.9) | |
A strong correlation between histologic subtypes and
the levels of HMGA2 and STC2 expression was identified. A higher
rate of HMGA2 was detected in serous tumors as compared with that
in mucinous type in the training cohort (58.6% in serous type,
26.8% in mucinous type, P<0.001; Table III, Fig. 4A and C) and validation cohort (54.6%
in serous type, 23.8% in mucinous type, P=0.001; Table IV, Fig.
4A and C). A similar trend was observed in STC2 expression. A
higher rate of STC2 was detected in serous tumors as compared with
that in mucinous type in the training cohort (59.5% in serous type,
26.8% in mucinous type, P<0.001; Table III, Fig. 4B and D) and validation cohort (64.8%
in serous type, 42.9% in mucinous type, P=0.014; Table IV, Fig.
4B and D). Statistical analysis revealed that HMGA2 and STC2
expression was not significantly associated with age, stage, or
lymph node and distant metastatic status.
In 95 ovarian cancer cases with clinical follow-up
data, we examined the correlation of STC2 expression with the
overall survival using the Kaplan-Meier method. We found that the
elevated expression of STC2 was associated with a shorter overall
survival rate (P=0.016, Fig. 4E).
These results indicated that STC2 may be a valuable
predictive marker for prognosis in EOC, with a high STC2 expression
being associated with a poor overall survival.
Discussion
In a previous gene profiling analysis, we showed the
upregulation of STC2 expression in a transformed ovarian
epithelial cell line that overexpressed HMGA2 (7). In the present study, we showed that
STC2 and HMGA2 were frequently co-upregulated in EOC.
We also showed that STC2 was upregulated by HMGA2 at
the transcription level. Our findings in the present study suggest
that STC2 is an immediate downstream target of HMGA2.
STC2 overexpression was associated with aggressive ovarian
cancer growth, high grade and poor clinical outcome.
STC2 was highly expressed in numerous solid
human cancers and appeared to act as an oncoprotein. In breast
cancer, STC2 was recognized as an estrogen-responsive gene
and its expression was correlated with estrogen receptor (ER)
status (22). In ovarian cancer,
STC2 was identified as a biomarker and its overexpression
was associated with a decreased disease-free interval (18). Findings of Law and Wong showed that
two consecutive HRE binding sites in the STC2 promoter.
STC2 was transactivated by HIF-1 (19). Consistent with a previous study
(23), we showed that STC2
played an important role in cell migration and invasion in ovarian
cancer cell lines. The results of the present study added another
layer of evidence of HMGA2 as an oncogene in the
tumorigenesis of EOC.
In gastric cancer, it was demonstrated that a high
STC2 expression was correlated with an enhanced rate of
venous invasion and became an independent prognostic marker
(24,25). In neuroblastoma, STC2 was highly
expressed in stage 4 tumors (metastatic stage) and was recognized
as a biomarker of metastatic neuroblastoma. STC2 was found
to promote the invasion of neuroblastomas and erosion of blood
vessels in vivo (26).
Similarly, STC2 was shown to be upregulated and promoted
cell proliferation and migration in hepatocellular carcinoma
(27). In renal cell cancer,
STC2 was used as an indicator for clinical prognosis
(28). Furthermore, Ieta et
al found that a higher level of STC2 expression was
closely associated with larger tumor size, greater depth, increased
lymph node metastasis, higher AJCC stage and worse survival
(15). The abovementioned findings
suggest that STC2 functioned as an oncogene in the course of
tumor progression.
In summary, our results have shown that STC2
may be induced by HMGA2 at the transcription level. Additionally,
HMGA2 and STC2 were highly expressed in EOC. The stable
overexpression of STC2 in T29 cells promoted migration and invasion
in vitro, whereas its knockdown in Caov-3 inhibited cell
migration and invasion in vitro. Patients with serous
histotype and poorer differentiation grade had higher rates of
HMGA2 and STC2 high intensity. The EMT-enhancing properties of
HMGA2 in EOC appeared to be partly mediated by STC2. We also
found that STC2 may be used as an independent predictor of survival
for EOC patients. Immunohistochemistry for STC2 proved a clean and
reliable stain and may serve as a tumor prognostic marker for HGSC.
Further characterization of STC2-mediated tumorigenesis in HGSC may
be useful to develop potential therapeutic modality targeting STC2
for the aggressiveness of HGSC.
Acknowledgments
We would like to thank the staff at the Pathology
Core Laboratory for technical support. The present study was
supported in part by the Marsha Rivkin Ovarian Cancer Research
Award, the Dixon Translation fund, the National Natural Science
Foundation of China (nos. 81302073, 81302072 and 81172313), the
Zhejiang Provincial Natural Science Foundation of China
(LQ13H160011), and the Fundamental Research Funds for the Central
Universities (2014QNA7018).
References
|
1
|
Siegel R, Ma J, Zou Z and Jemal A: Cancer
statistics, 2014. CA Cancer J Clin. 64:9–29. 2014. View Article : Google Scholar : PubMed/NCBI
|
|
2
|
Coleman RL, Monk BJ, Sood AK and Herzog
TJ: Latest research and treatment of advanced-stage epithelial
ovarian cancer. Nat Rev Clin Oncol. 10:211–224. 2013. View Article : Google Scholar : PubMed/NCBI
|
|
3
|
Kurman RJ and Shih IeM: The origin and
pathogenesis of epithelial ovarian cancer: A proposed unifying
theory. Am J Surg Pathol. 34:433–443. 2010. View Article : Google Scholar : PubMed/NCBI
|
|
4
|
Park SM, Shell S, Radjabi AR, Schickel R,
Feig C, Boyerinas B, Dinulescu DM, Lengyel E and Peter ME: Let-7
prevents early cancer progression by suppressing expression of the
embryonic gene HMGA2. Cell Cycle. 6:2585–2590. 2007. View Article : Google Scholar : PubMed/NCBI
|
|
5
|
Welsh JB, Zarrinkar PP, Sapinoso LM, Kern
SG, Behling CA, Monk BJ, Lockhart DJ, Burger RA and Hampton GM:
Analysis of gene expression profiles in normal and neoplastic
ovarian tissue samples identifies candidate molecular markers of
epithelial ovarian cancer. Proc Natl Acad Sci USA. 98:1176–1181.
2001. View Article : Google Scholar : PubMed/NCBI
|
|
6
|
Wei JJ, Wu J, Luan C, Yeldandi A, Lee P,
Keh P and Liu J: HMGA2: A potential biomarker complement to P53 for
detection of early-stage high-grade papillary serous carcinoma in
fallopian tubes. Am J Surg Pathol. 34:18–26. 2010. View Article : Google Scholar
|
|
7
|
Wu J, Liu Z, Shao C, Gong Y, Hernando E,
Lee P, Narita M, Muller W, Liu J and Wei JJ: HMGA2
overexpression-induced ovarian surface epithelial transformation is
mediated through regulation of EMT genes. Cancer Res. 71:349–359.
2011. View Article : Google Scholar : PubMed/NCBI
|
|
8
|
Malek A, Bakhidze E, Noske A, Sers C,
Aigner A, Schäfer R and Tchernitsa O: HMGA2 gene is a promising
target for ovarian cancer silencing therapy. Int J Cancer.
123:348–356. 2008. View Article : Google Scholar : PubMed/NCBI
|
|
9
|
Wu J and Wei JJ: HMGA2 and high-grade
serous ovarian carcinoma. J Mol Med Berl. 91:1155–1165. 2013.
View Article : Google Scholar : PubMed/NCBI
|
|
10
|
Morishita A, Zaidi MR, Mitoro A,
Sankarasharma D, Szabolcs M, Okada Y, D'Armiento J and Chada K:
HMGA2 is a driver of tumor metastasis. Cancer Res. 73:4289–4299.
2013. View Article : Google Scholar : PubMed/NCBI
|
|
11
|
Zha L, Zhang J, Tang W, Zhang N, He M, Guo
Y and Wang Z: HMGA2 elicits EMT by activating the Wnt/β-catenin
pathway in gastric cancer. Dig Dis Sci. 58:724–733. 2013.
View Article : Google Scholar
|
|
12
|
Serlachius M, Alitalo R, Olsen HS and
Andersson LC: Expression of stanniocalcin-1 in megakaryocytes and
platelets. Br J Haematol. 119:359–363. 2002. View Article : Google Scholar : PubMed/NCBI
|
|
13
|
Chang AC and Reddel RR: Identification of
a second stanniocalcin cDNA in mouse and human: Stanniocalcin 2.
Mol Cell Endocrinol. 141:95–99. 1998. View Article : Google Scholar : PubMed/NCBI
|
|
14
|
Liu G, Yang G, Chang B, Mercado-Uribe I,
Huang M, Zheng J, Bast RC, Lin SH and Liu J: Stanniocalcin 1 and
ovarian tumorigenesis. J Natl Cancer Inst. 102:812–827. 2010.
View Article : Google Scholar : PubMed/NCBI
|
|
15
|
Ieta K, Tanaka F, Yokobori T, Kita Y,
Haraguchi N, Mimori K, Kato H, Asao T, Inoue H, Kuwano H, et al:
Clinicopathological significance of stanniocalcin 2 gene expression
in colorectal cancer. Int J Cancer. 125:926–931. 2009. View Article : Google Scholar : PubMed/NCBI
|
|
16
|
Girgis AH, Iakovlev VV, Beheshti B, Bayani
J, Squire JA, Bui A, Mankaruos M, Youssef Y, Khalil B, Khella H, et
al: Multilevel whole-genome analysis reveals candidate biomarkers
in clear cell renal cell carcinoma. Cancer Res. 72:5273–5284. 2012.
View Article : Google Scholar : PubMed/NCBI
|
|
17
|
Yuan Y, Yang ZL, Zou Q, Li JH, Li DQ,
Liang LF, Zeng GX and Chen SL: Comparative study of
clinicopathological significance, BIRC7, and STC2 expression
between squamous cell/adenosquamous carcinomas and adenocarcinoma
of gallbladder. Neoplasma. 60:698–705. 2013. View Article : Google Scholar : PubMed/NCBI
|
|
18
|
Buckanovich RJ, Sasaroli D,
O'Brien-Jenkins A, Botbyl J, Hammond R, Katsaros D, Sandaltzopoulos
R, Liotta LA, Gimotty PA and Coukos G: Tumor vascular proteins as
biomarkers in ovarian cancer. J Clin Oncol. 25:852–861. 2007.
View Article : Google Scholar : PubMed/NCBI
|
|
19
|
Law AY and Wong CK: Stanniocalcin-2 is a
HIF-1 target gene that promotes cell proliferation in hypoxia. Exp
Cell Res. 316:466–476. 2010. View Article : Google Scholar
|
|
20
|
McMillen BD, Aponte MM, Liu Z, Helenowski
IB, Scholtens DM, Buttin BM and Wei JJ: Expression analysis of
MIR182 and its associated target genes in advanced ovarian
carcinoma. Mod Pathol. 25:1644–1653. 2012. View Article : Google Scholar : PubMed/NCBI
|
|
21
|
Cui T and Leng F: Specific recognition of
AT-rich DNA sequences by the mammalian high mobility group protein
AT-hook 2: A SELEX study. Biochemistry. 46:13059–13066. 2007.
View Article : Google Scholar : PubMed/NCBI
|
|
22
|
Bouras T, Southey MC, Chang AC, Reddel RR,
Willhite D, Glynne R, Henderson MA, Armes JE and Venter DJ:
Stanniocalcin 2 is an estrogen-responsive gene coexpressed with the
estrogen receptor in human breast cancer. Cancer Res. 62:1289–1295.
2002.PubMed/NCBI
|
|
23
|
Law AY and Wong CK: Stanniocalcin-2
promotes epithelial-mesenchymal transition and invasiveness in
hypoxic human ovarian cancer cells. Exp Cell Res. 316:3425–3434.
2010. View Article : Google Scholar : PubMed/NCBI
|
|
24
|
Yokobori T, Mimori K, Ishii H, Iwatsuki M,
Tanaka F, Kamohara Y, Ieta K, Kita Y, Doki Y, Kuwano H, et al:
Clinical significance of stanniocalcin 2 as a prognostic marker in
gastric cancer. Ann Surg Oncol. 17:2601–2607. 2010. View Article : Google Scholar : PubMed/NCBI
|
|
25
|
Wang YY, Li L, Zhao ZS and Wang HJ:
Clinical utility of measuring expression levels of KAP1, TIMP1 and
STC2 in peripheral blood of patients with gastric cancer. World J
Surg Oncol. 11:812013. View Article : Google Scholar : PubMed/NCBI
|
|
26
|
Volland S, Kugler W, Schweigerer L,
Wilting J and Becker J: Stanniocalcin 2 promotes invasion and is
associated with metastatic stages in neuroblastoma. Int J Cancer.
125:2049–2057. 2009. View Article : Google Scholar : PubMed/NCBI
|
|
27
|
Wang H, Wu K, Sun Y, Li Y, Wu M, Qiao Q,
Wei Y, Han ZG and Cai B: STC2 is upregulated in hepatocellular
carcinoma and promotes cell proliferation and migration in vitro.
BMB Rep. 45:629–634. 2012. View Article : Google Scholar : PubMed/NCBI
|
|
28
|
Dondeti VR, Wubbenhorst B, Lal P, Gordan
JD, D'Andrea K, Attiyeh EF, Simon MC and Nathanson KL: Integrative
genomic analyses of sporadic clear cell renal cell carcinoma define
disease subtypes and potential new therapeutic targets. Cancer Res.
72:112–121. 2012. View Article : Google Scholar :
|