Introduction
Cancer is the leading cause of morbidity and
mortality worldwide with the number of cases expected to increase
by 70% over the next 2 decades (1).
Brain and central nervous system tumors are ranked 17th in
incidence among all cancers worldwide, being the 13th and 15th most
common tumor in men and women, respectively (2). Cancer is the 2nd leading cause of
death in the paediatric age group (3), with brain and other nervous system
tumors ranked 2nd in incidence after leukaemias (4).
Brain tumors can be either primary or secondary.
Gliomas are the most common of the primary brain tumors consisting
mainly of oligodendroglioma and astrocytoma with a small number of
mixed oligoastrocytoma. Glioblatoma multiforme (GBM) is the most
malignant and aggressive of these tumors (5).
Despite advances in surgery, radiation and
chemotherapy together with more recently available therapies such
as molecularly targeted therapies, prognosis is generally poor. The
median survival for patients with malignant gliomas is less than 15
months with GBM patients having the worst prognosis with less than
5% surviving after 5 years (6).
One of the reasons that cancers are detected at a
late stage is because many tumors do not have symptoms until the
disease has spread. The current methods available for the detection
of gliomas are computed tomography (CT) scan and magnetic resonance
imaging (MRI) of the brain. However, the definitive diagnosis is by
stereotactic guided biopsy of the tumor sample which is technically
demanding and has its risks but is, however, considered acceptable
(7–9). Therefore, the development of a simple,
non-invasive blood test which involves RNA profiling in whole
blood, can be used as an addition to the more traditional methods
of cancer screening and detection (10).
The inspiration for whole-blood, transcriptome
profiling in the context of gliomas originates from the ‘sentinel’
principle (10). Inherent in this
principle is the fact that blood is in intimate contact and
interacts with all human tissues including cancerous tissue. Blood
is considered a connective tissue and is a transporter for various
substances such as oxygen, nutrients, cells of the immune system
including B cells, T cells, dendritic and natural killer cells,
cytokines, growth factors and hormones (11). In addition, blood cells are affected
in many disease processes such as hematological malignancies, solid
tumors, asthma, autoimmune diseases such as rheumatoid arthritis to
common chronic illnesses such as hypertension, diabetes and
cardiovascular disease (12–15).
Peripheral blood cells have the ability to respond
to changes that affect the physiology, microenvironment and systems
biology of the human body. Perturbations or disturbances in the
homeostasis of the system can also be subtly detected by peripheral
blood cells (11,16). Thus, blood, being easily accessible
could serve as a molecular gene expression profile reflecting
changes that occur within tissues of the human body (10). The term ‘bloodomics’ has thus been
coined to reflect this function of blood in regulation of gene
expression and in the molecular profiling of human diseases
(11).
One of the earliest models where the sentinel
principle has been studied is colorectal carcinoma where a 5- and
7-gene biomarker panel has been developed to assess the current
relative risk of patients developing this cancer in Canada and
Malaysia (17–19). Molecular gene profiling of the blood
transcriptome has also been studied in other diseases including
neurological disorders such as schizophrenia and bipolar disorders,
chronic fatigue syndrome, tuberous sclerosis complex 2,
neurofibromatosis type 1, Down's syndrome, epilepsy, Tourette
syndrome, ischemic stroke, migraine, Huntington's and Alzheimer's
diseases (20–27).
In the case of an insiduous development of a tumor,
substances are secreted by the tumor into the bloodstream and as a
systemic response, there are subtle alterations in the level of
expression of genes within peripheral blood cells in order to
maintain homeostasis or as a reaction to the disease entity itself
(10). In the brain, disruption of
the blood-brain barrier is due to loss of substances such as the
tight junction proteins claudin-1 and claudin-3, decrease in
polarity of glioma cells, loss of the molecule agrin and
upregulation of the aqueous channel protein, aquaporin 4
(AQP4) resulting in brain oedema formation (28–34).
Since blood-brain barrier disruption occurs in brain tumors
(35,36), substances that play a role in both
homeostasis and tumorigenesis are likely to be secreted into the
bloodstream under such conditions and may give a molecular
signature profile.
In this study, we have extrapolated the fascinating
theory of the sentinel principle to the development of adult
gliomas and to determine if such expression profiling in blood
could be used to distinguish between high and low grade gliomas,
non-gliomas and control samples. The justification for the present
study is that such profiling will help not only in the
stratification of gliomas, but also in the early detection of
tumors when they are far more amenable to complete surgical
resection, thus, improving prognosis and survival of the
patient.
Materials and methods
Clinical patient data
Upon admission to the hospital, demographic data and
a brief clinical history was elicited from 30 of the 50 patients.
The demographic data included the age and gender of the patient and
the state in which the patient was domiciled. The 30 patients
comprised of 10 high grade glioma (HG), 10 low grade glioma (LG)
(Table I) and 10 non-glioma (NG)
cases (Table II). The remaining 20
patients were normal, healthy controls (C) (Table III). The incidence of gliomas is
2–3 new cases per 100,000 population per year (37). As such, the number of samples we
were able to collect on our own was small.
 | Table I.WHO classification, histopathology of
tumor samples and demographic data. |
Table I.
WHO classification, histopathology of
tumor samples and demographic data.
| Histopathology | Grade | Age (years) | Gender |
|---|
| Pilocytic
astrocytoma | I | 31 | Male |
| Diffuse
astrocytoma | II | 17 | Male |
| Diffuse
astrocytoma | II | 32 | Male |
| Fibrillary
astrocytoma | II | 62 | Female |
| Recurrent
astrocytoma | II | 45 | Female |
| Diffuse
astrocytoma | II | 36 | Male |
| Low grade
astrocytoma | II | 59 | Male |
| Low grade
oligodendroglioma | II | 45 | Male |
| Low grade
oligodendroglioma | II | 56 | Male |
| Recurrent
oligodendroglioma | II | 59 | Male |
| Anaplastic
oligoastrocytoma | III | 37 | Female |
| Anaplastic
oligoastrocytoma | III | 58 | Male |
| Recurrent
anaplastic oligoastrocytoma | III | 66 | Male |
| Anaplastic
astrocytoma | III | 29 | Female |
| Anaplastic
astrocytoma | III | 43 | Male |
| Glioblastoma
multiforme | IV | 24 | Male |
| Glioblastoma
multiforme | IV | 54 | Male |
| Glioblatoma
multiforme | IV | 24 | Male |
| Glioblastoma
multiforme | IV | 34 | Male |
| Glioblastoma
multiforme | IV | 56 | Female |
| Table II.Demographics and types of non-glioma
samples. |
Table II.
Demographics and types of non-glioma
samples.
| Patient no. | Age (years) | Gender | Sample type |
|---|
| 1 | 40 | Male |
Hemangioblastoma |
| 2 | 77 | Male | Blood clot |
| 3 | 44 | Female | Inflammatory
pseudotumour |
| 4 | 27 | Male | Arteriovenous
malformation (AVM) |
| 5 | 51 | Female | Ischaemic
stroke |
| 6 | 53 | Female |
Hemangioblastoma |
| 7 | 61 | Male | Haemorrhagic
stroke |
| 8 | 56 | Female | Multiple
sclerosis |
| 9 | 34 | Female | Ischaemic
stroke |
| 10 | 46 | Female | Haemorrhagic
stroke |
| Table III.Demographics of control samples. |
Table III.
Demographics of control samples.
| Patient no. | Age (years) | Gender |
|---|
| 1 | 30 | Female |
| 2 | 38 | Female |
| 3 | 41 | Male |
| 4 | 57 | Male |
| 5 | 25 | Male |
| 6 | 57 | Male |
| 7 | 33 | Male |
| 8 | 51 | Male |
| 9 | 28 | Male |
| 10 | 25 | Male |
| 11 | 56 | Male |
| 12 | 32 | Male |
| 13 | 22 | Male |
| 14 | 59 | Female |
| 15 | 42 | Female |
| 16 | 55 | Male |
| 17 | 58 | Male |
| 18 | 48 | Male |
| 19 | 33 | Male |
| 20 | 55 | Male |
Informed consent was obtained prior to blood taking
and brain tumor removal from the patient during surgery. After
obtaining consent, blood was immediately drawn from the patient on
the day before surgery. Surgery was performed the next day,
typically within 12–24 h of obtaining consent and drawing blood
from the patient. In addition, this study received ethics approval
from the Medical Research Ethics Committee (MREC) of the Ministry
of Health, Malaysia.
Histopathological examination
Brain tumor tissue was sectioned onto glass slides
and stained with hematoxylin and eosin (H&E). The slides were
read by neuropathologists at the respective hospital. The diagnosis
was made based on the World Health Organization (WHO)
classification of tumors of the central nervous system (2007)
(5). Of the 20 tumor samples, 10
each were high and low grade gliomas, respectively. Grade I and II
tumors were classified as low grade while grade III and IV tumors
were classified as high grade.
Non-glioma and control samples
In addition to the 20 tumor samples, 10 non-glioma
and 20 control samples were also obtained. The 10 non-glioma cases
constituted patients with an inflammatory, non-malignant condition
of the brain and included cases of hemangioblastoma, haemorrhagic
and ischaemic stroke, inflammatory pseudotumor, arteriovenous
malformation and multiple sclerosis (Table II). The 20 control subjects were
healthy with no known medical illness (Table III).
Blood sample collection
A total of 2.5 ml of venous blood was drawn from
each patient using the BD Vacutainer (Becton-Dickinson, Franklin
Lakes, NJ, USA) with attached 21G × 3/4′′ × 12′′ butterfly needle
directly into the PreAnalytiX PAXgene Blood RNA Tube (BRT) (Qiagen,
Hilden, Germany). The samples were kept at room temperature for 2 h
to allow for complete lysis of cell components after which they
were stored at −20°C.
RNA extraction
RNA was extracted from each blood sample using the
PreAnalytiX PAXgene™ Total RNA Blood Extraction kit (Qiagen). After
collection, the blood sample in the PAXgene Blood RNA Tube (BRT)
was incubated at a minimum of 2 h at room temperature to ensure
complete lysis of blood cells. The BRT was then spun for 10 min at
3,000–5,000 × g. The supernatant was removed and the pellet
containing the blood cells vortexed until dissolved in 4 ml of
RNase-free water. The BRT was centrifuged again and the supernatant
removed. A total of 350 µl of resuspension buffer was added and the
pellet vortexed until dissolved. The sample was transferred into a
1.5-ml microcentrifuge tube where 300 µl of binding buffer was
added to bind the RNA which was predominantly derived from
leukocytes; 40 µl of proteinase was also added to dissolve any
protein present in the sample. The lysate was transferred directly
into a PAXgene Shredder spin column and centrifuged to remove cell
debris. The flow through supernatant containing the total RNA was
mixed with 350 µl of 96–100% ethanol and vortexed. Sample (700 µl)
was pipetted into the PAXgene RNA spin column to which DNase I was
added to remove any contaminating DNA. The PAXgene RNA spin column
was washed several times with wash buffers 1 and 2 after which 40
µl of elution buffer was added directly onto the PAXgene RNA spin
column membrane. This was centrifuged for 1 min at 8,000–20,000 × g
to elute the RNA. The eluate containing the total RNA was incubated
at 65°C for 5 min and then chilled immediately on ice.
The concentration and purity of the RNA was analyzed
using the Spectrophotometer NanoDrop ND-1000 (Thermo Fisher
Scientific, Tewksbury, MA, USA). The integrity of the RNA was
analyzed using the Agilent 2100 BioAnalyzer RNA 6000 Nano Chip
platform (Agilent Technologies, Santa Clara, CA, USA). The
concentration of RNA obtained ranged from 37 to 442 ng/µl. The
average value for the RNA integrity number (RIN) for the samples
was 7.4 with a standard deviation of 0.87. The samples were stored
at −80°C until further use.
Microarray processing
Two-colour microarray-based gene expression
utilizing the Agilent 4×44K Whole Human Genome microarray, was
performed on RNA isolated from the 50 blood samples. Standard
protocols were followed for sample preparation, probe labeling and
hybridization according to the Two-Colour Microarray-Based Gene
Expression Analysis Protocol (Agilent Technologies).
For sample preparation, the Two-Colour RNA Spike-In
kit (Agilent Technologies) was used. Spike A and Spike B Mix were
thawed, mixed vigorously on a vortex mixer and then heated at 37°C
in a water bath for 5 min. Three serial dilutions of 1:20, 1:40 and
1:4 were performed for each spike mix. For the labeling reactions,
the Low Input Quick Amp Labeling kit (Agilent Technologies) was
used. Total RNA (150 ng) to a volume of 1.5 µl was labeled; 2 µl of
the Spike A Mix/Cy3-CTP was used to label the Universal Human
Reference RNA (Stratagene, La Jolla, CA, USA) while 2 µl of the
Spike B/Cy5-CTP was used to label the HG, LG, NG and C samples,
respectively. A total of 1.8 µl of T7 Promoter Primer Mix
(consisting of 0.8 µl T7 promoter primer and 1 µl nuclease-free
water) was added to the reaction containing 3.5 µl of total RNA and
diluted RNA Spike-in Mix. The primer and template were denatured by
incubating the reaction in a water bath at 65°C for 10 min. The
reactions were then placed on ice for 5 min. cDNA Master mix (4.7
µl) (2 µl 5X first strand buffer, 1 µl 0.1 M DTT, 0.5 µl 10 mM dNTP
and 1.2 µl AffinityScript RNase block mix) was added to each sample
tube to a total volume of 10 µl. Samples were incubated at 40°C in
a water bath for 2 h after which they were moved to a 70°C water
bath and incubated for a further 15 min. The samples were then
incubated on ice for 5 min. Finally, 6 µl of transcription master
mix (0.75 µl nuclease-free water, 3.2 µl 5X transcription buffer,
0.6 µl 0.1 M DTT, 1 µl NTP mix, 0.21 µl T7 RNA polymerase blend and
0.24 µl Cy3-CTP/Cy5-CTP) was added to each sample tube for a total
volume of 16 µl and incubated at 40°C in a water bath for 2 h.
The resulting labeled/amplified cRNA was purified as
per protocol using the RNeasy mini spin columns (Qiagen). The
cleaned cRNA sample was eluted by transferring the RNeasy column to
a new 1.5 ml collection tube. RNase-free water (30 µl) was added
directly onto the RNeasy filter membrane and allowed to stand for
60 sec. The RNeasy column in the collection tube was then
centrifuged at 4°C for 30 sec at 13,000 rpm. The flow-through
containing the cRNA sample was maintained on ice. If not used
immediately, the samples were stored at −80°C.
The cRNA was quantified using the NanoDrop
spectrophotometer as previously described. The yield and specific
activity of each reaction was determined respectively as
follows:
(ConcentrationofcRNA)x30μl(elutionvolume)1000=μgofcRNA
(ConcentrationofCy3orCy5ConcentrationofcRNAx1000=pmolCy3orCy5perμgcRNA
For the 4-pack microarray format, almost all yields
obtained were ≥0.825 µg and had specific activity (pmol Cy3 or Cy5
per µg cRNA) ≥6.
The initial step for the hybridization reactions
involved the fragmentation of RNA. For the 4-pack microarray
format, 825 ng each of Cy3- and Cy5-labeled, linearly amplified
cRNA, 11 µl of 10X blocking agent were made up to a volume of 52.8
µl with nuclease-free water, after which 2.2 µl of 25X
fragmentation buffer was added to a total volume of 55 µl. The
samples were incubated at 60°C for exactly 30 min to fragment the
RNA and then immediately cooled on ice for 1 min. Fragmentation mix
(55 µl) containing cRNA was mixed with an equal volume of 2X GE
Hybridization buffer HI-RPM. The samples were spun in a
microcentrifuge at 13,000 rpm for 1 min at room temperature to
drive any residual sample from the walls and lid of the tubes and
to help with bubble reduction. The samples were then placed on ice
and loaded onto the array immediately. Sample (100 µl) was pipetted
into the gasket slide well of the Agilent SureHyb chamber and the
‘active side’ of the array placed directly on top of the gasket
slide to form a sandwich pair. The SureHyb chamber cover was placed
on the sandwich slides and the clamp assembly tightened onto the
chamber. The assembled slide chamber was then placed in a
rotisserie hybridization oven at 20 rpm and the samples allowed to
hybridize at 65°C for 17 h. The slides were then washed with Gene
Expression Wash Buffer 1 followed by Prewarm Gene Expression Wash
Buffer 2. In addition, 0.0005% Triton X-102 was added to both
buffers which reduced the possibility of array wash artifacts. The
microarray slides were scanned using the DNA microarray scanner
(Agilent Technologies).
Data extraction
Data were extracted using Agilent feature extraction
software analyzed with Gene Spring version GX 12.5V (Agilent
Technologies). The data files were extracted in text (.txt) format
after Lowess normalization. The sequence of events involved in
processing of the data files were as follows: thresholding,
summarization, dye swap, ratio computation, log transformation and
baseline transformation.
Thresholding involved a substitution step where all
expression values below a certain specified value were made
constant. Thresholding was done to remove very small expression
values or negative values in the dataset. This was to ensure that
there were no very large negative numbers when the data was log
transformed. Summarization was done by calculating the geometric
mean of the expression values. Raw signal values were then
generated which essentially were linear data that had undergone
thresholding and summarization for the individual channels (Cy3 and
Cy5). Normalized signal values refer to the data after it has
undergone ratio computation, log2 transformation and baseline
transformation. Normalization was also done using the Human
Reference RNA.
Dye-swapping accounts for dye related bias as
different dyes (Cy3 and Cy5) bind DNA with different affinities.
This dye related bias cannot be removed by standard normalization
methods. In GeneSpring, samples that have been marked as
dye-swapped were treated as follows: Cy3 was designated as ‘signal’
and Cy5 as ‘control’ and the signal was computed as Cy3/Cy5. For
samples that have not undergone dye-swapping, GeneSpring treats Cy5
as ‘signal’ and Cy3 as ‘control’ and the signal is computed as
Cy5/Cy3.
In baseline transformation, the baseline to median
of control samples was performed. In the Agilent 4×44K Human Array,
there are a set of samples designated as controls that can be used
for all samples. In this baseline transformation, for each probe,
the median of the log summarized values from the control samples
was first computed, after which, this value was subtracted from the
sample.
As mentioned previously, Lowess normalization was
performed before the raw data were extracted. Lowess normalization
is critical for reducing intra-array (within slide) variation. In 2
colour experiments, 2 fluorescent dyes, red and green, are used.
The intensity-dependent variation in dye bias may introduce
spurious variations in the dataset. Lowess normalization is
performed which merges the 2 colour data and applies a smoothing
adjustment which removes such variations.
Investigating the effects of tumor
status, age, gender and experimental array batch on gene
expression
A linear mixed regression analysis was performed
using the ‘R’ statistical package, to investigate the effects of
tumor pathology, age, gender and experimental batch effects on gene
expression. The tumor status was defined by the four groups of
samples, HG, LG, NG and C. The age and gender of patients are
represented in Tables I–III, respectively. Samples were run on
arrays in 4 experimental batches as follows: Batch 1, 6 HG and 6 LG
samples; Batch 2, 4 HG, 4 LG and 4C samples; Batch 3, 8C and 4 NG
samples; Batch 4, 8C and 6 NG samples. The explanatory power of
each factor was assessed in a stepwise manner by examining the
increase in the variation explained when a new covariate or set of
covariates was added to the existing model. This resulted in the
investigation of the following four models: i) model 1, gene
expression as a function of tumor status; ii) model 2, gene
expression as a function of tumor status and age; iii) model 3,
gene expression as a function of tumor status, age and gender; and
iv) model 4, gene expression as a function of tumor status, age,
gender and array batch.
In total there were 50 microarray samples each with
29,092 gene expression values from 44,000 probe sets. In
preparation of input data for multiple regression analysis, a table
of 50 microarray samples (50 rows) × 29,092 gene expression values
(29,092 columns) was generated. The metadata for each sample that
included tumor status, age, gender and array batch were combined as
columns in the prepared table. The input data were then read into
the ‘R’ software. For each gene, a linear model was fitted using
the Im function to its respective gene expression values vs.
variable(s) of interest as per the four models. For each model,
there were 29,092 r2 (coefficient of determination)
values that were generated. Each r2 value was then
modified to generate an adjusted r2 value to account for
the number of variables and the sample size. A median, mean and
range for r2 was then calculated for each model as shown
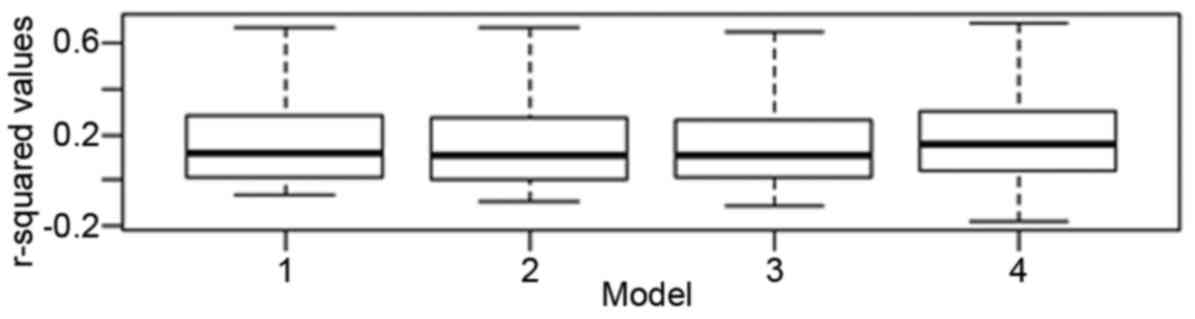
in Fig. 1 and Table IV.
| Table IV.Median and mean adjusted r2 values
for models 1–4. |
Table IV.
Median and mean adjusted r2 values
for models 1–4.
| Model | Median | Mean |
|---|
| 1 | 0.11830 | 0.17220 |
| 2 | 0.110700 | 0.163200 |
| 3 | 0.11180 | 0.16360 |
| 4 | 0.1540 | 0.1882 |
Unsupervised hierarchical
clustering
Unsupervised hierarchical clustering using the
Euclidean distance method and Ward's linkage was performed on each
of the 4 different pairs of conditions and all 4 conditions. One of
the limitations in unsupervised hierarchical clustering is that
this form of analysis could be influenced by noise and outliers
particularly when sample sizes are small.
Principal component analysis
(PCA)
Principal component analysis was performed on the
complete data set. The first step in PCA was to subtract the mean
from each of the data dimensions. Then, the covariance matrix and
the eigenvectors and eigenvalues of the covariance matrix were
calculated. Data compression and reduced dimensionality was
performed when converting the data into components and to form
feature vectors in 3 dimensions along the x-, y- and z-axis.
Identification of significant
differences in gene expression between the 4 different
conditions
The moderated t-test, a modification of the Students
t-test, was used to identify significant differences in gene
expression between the 4 sets of conditions (HG vs. C, LG vs. C, HG
vs. LG and NG vs. C). While the Students t-test calculates variance
from the data that is available for each gene, the moderated t-test
uses information from all of the genes to calculate variance. This
is particularly useful when a small number of samples is available
in each group (as in this case) making the variance estimates
unstable.
When testing was performed across these different
conditions, each gene was considered independently from the other
as a moderated t-test was performed on each gene separately. Given
that in this microarray experiment, the expression levels of 44,000
probes was measured simultaneously across each condition, multiple
testing correction (MTC) was required. With this in mind, the
Benjamini and Hochberg (B-H) false discovery rate was used to
control for the large number of tests performed. This procedure is
one of the less stringent methods of MTC but it provides a good
balance between identification of many genes that are statistically
significant and protection against false positives (type I
error).
Pathway analysis
For each group, genes were selected based on at
least a 2-fold difference in expression and a B-H corrected
P<0.01. Pathway analysis was performed using the ingenuity
pathway analysis (IPA) programme (Johns Hopkins University,
Baltimore, MD, USA).
IPA is based on the Ingenuity Knowledge Base. In
IPA, canonical pathways are well characterized pathways that have
been curated and hand-drawn by PhD level scientists and the
information comes from specific journal articles, review articles,
text books and HumanCyc, an encyclopaedia of human genes and
metabolism (http://humancyc.org). Gene selection for
the canonical pathways is based on this analysis.
cDNA synthesis
RNA from each sample was converted to cDNA using the
high capacity RNA-to-cDNA kit (Applied Biosystems). Optimal blend
priming was performed with a mixture of random octamers and oligo
dT primers.
Total RNA (200 ng) was mixed with 10.0 µl of 2X
reverse transcriptase (RT) buffer, 1.0 µl 20X enzyme mix and
nuclease-free water to a total volume of 20.0 µl. The tube
containing the reaction mix was then incubated in the Professional
basic thermocycler (Biometra, Gottingen, Germany) at 37°C for 60
min after which the reaction was terminated by heating to 95°C for
5 min. The reactions were then used for droplet digital PCR (ddPCR)
or stored long-term at −80°C.
Droplet digital polymerase chain
reaction (ddPCR)
Selected genes (Table
V) from each of the 4 group pairs as previously mentioned, were
verified using ddPCR. Reactions for each sample were done either
singly or in duplicate. Beta-glucuronidase (GUSB) was used
as the reference gene as it showed the least variation with gene
expression amongst the other housekeeping genes used, namely TATA
binding protein (TBP) and human acidic ribosomal protein
(HuPO). All reagents and equipment used for ddPCR were from
Bio-Rad Laboratories (Hercules, CA, USA). cDNA (10 ng) was mixed
with 10 µl of 2X ddPCR Supermix for probes (No dUTP), 1 µl 20X
target primers/probe mix (FAM) or 20x reference primers/probe (HEX)
and nuclease-free water to a total reaction volume of 20 µl. The
entire reaction mix of 20 µl was then loaded into a sample well of
a DG8 Cartridge for the QX200/QX100 droplet generator. This was
then followed by adding 70 µl of droplet generation oil for probes
into the oil wells of the cartridge, according to the QX200/QX100
Droplet Generator Instruction Manual. The cartridge was then
inserted into the Automated Droplet Generator. After droplet
generation, the droplets were transferred to a 96-well plate and
then sealed with foil using the PX1 PCR plate sealer.
| Table V.The significant genes after
Bonferroni correction. |
Table V.
The significant genes after
Bonferroni correction.
| Condition | Gene | Fold change from
GeneSpring | Fold change from
ddPCR | P-value | Bonferroni
correction: new 0.05 threshold, 10 tests | Result
(P-value) |
|---|
| NG vs. C | MMP9 | +2.35 | +6.49 | 0.0068 | 0.005 | False |
| LG vs. C | MAP3K8 | +2.46 | +1.61 | 0.00003 | 0.005 | True |
|
| TP53 | −2.81 | +2.00 | 0.00007 | 0.005 | True |
|
| SOS1 | −2.62 | −1.69 | 0.00362 | 0.005 | True |
| HG vs. C | FOS | +2.28 | +3.55 | 0.00853 | 0.005 | False |
|
| IL6 | +4.06 | +3.05 | 0.00001 | 0.005 | True |
|
| TNF | −2.90 | +1.60 | 0.00620 | 0.005 | False |
| HG vs. LG | EGFR | +2.44 | −1.25 | 0.43 | 0.005 | False |
|
| VEGFA | +2.13 | +1.36 | 0.24 | 0.005 | False |
|
| MAPK12 | −4.09 | +1.19 | 0.27 | 0.005 | False |
Thermal cycling was then performed on the droplets
using the C1000 Touch Thermal Cycler with 96-deep well reaction
module according to the following protocol: enzyme activation at
95°C for 10 min (1 cycle), denaturation at 94°C for 30 sec followed
by annealing/extension at 55°C for 1 min (40 cycles), enzyme
deactivation at 98°C for 10 min (1 cycle) followed by hold at 4°C.
The ramp rate was set at 2°C/sec, the heated lid to 105°C and the
sample volume at 40 µl. After thermal cycling, the sealed plate was
placed in a QX200/QX100 droplet reader and the absolute gene
expression level per well for the probes and reference genes were
quantitated using QuantaSoft software.
For analysis of the gene expression data, we assumed
a normal distribution. Each gene was evaluated for its expression
in a minimum of 3 to a maximum of 6 samples under each pair of
conditions. The gene expression values for each sample were
normalized to the housekeeping gene. The values for the absolute
level of gene expression as obtained by ddPCR were then subjected
to the t-test for the genes selected under the 4 sets of
conditions, with a resulting fold change and P-value. Statistical
outliers were removed using the box and whisker plot.
In summary, ddPCR is a method for performing digital
PCR that utilizes a water-oil emulsion droplet system using a
combination of microfluidics and proprietary surfactant
chemistries. Droplets are formed in a water-oil emulsion that
partitions the nucleic acid samples into 20,000 nanoliter sized
droplets, with background and target DNA randomly distributed among
the droplets. Sample partitioning is key to ddPCR. PCR
amplification is then carried out on each droplet thus enabling the
measurement of thousands of independent amplification events within
a single sample. Nucleic acids are quantified by counting the
regions that contain the PCR end product. Thus, ddPCR is not
dependent on the number of amplification cycles to determine the
initial sample amount, hence eliminating the reliance on uncertain
exponential data to quantify target nucleic acids. This allows
clonal amplification of nucleic acids with direct and absolute
quantification. Therefore, the main benefits of ddPCR technology
are simplified and absolute quantification of nuclei acids with
superior partitioning, unparalleled precision, increased
signal-to-noise ratio and removal of PCR bias.
Results
Modeling the effects of tumor status,
age, gender and experimental array batch effects on gene
expression
Using a linear mixed regression analysis, the effect
of tumor pathology, age, gender and experimental batch on gene
expression was investigated. For models 1, 2, 3 and 4, the median
and mean adjusted r2 values did not vary significantly
(Table IV and Fig. 1). The change in median values for
models 2 and 3 were 0.0077 and 0.0065%, respectively as compared to
model 1, suggesting that age and gender had a minimal impact on
gene expression globally. For model 4, the change in the median
adjusted r2 value when compared to tumor status alone
was 3.57%, indicating that array batch had some impact on gene
expression globally, but that this was still small. The mean
adjusted r2 values showed a similar trend. Based on
these findings, all subsequent analysis focused on the impact of
tumor pathology alone on gene expression.
Microarray analysis of samples
(a) Unsupervised hierarchical clustering was
performed on each of the 4 different pairs of conditions (HG vs. C,
LG vs. C, HG vs. LG and NG vs. C) and all 4 conditions together,
with the total gene input list, using the Euclidean distance method
and Ward's linkage. The gene input list consisted of genes which
were found to be differentially expressed with a corrected
P<0.01 and a fold change of at least 2. The results are depicted
in Fig. 2 showing 3 clusters of
samples: one cluster for the high grade tumors, a second cluster
for the low grade tumors and a third cluster for the non-glioma and
control samples. The non-glioma and controls clustered together and
were distinct from the glioma samples, with the low grade glioma
being furthest from the control and non-glioma samples. Therefore,
not only were we able to show a distinction between the glioma and
control samples but were also able to distinguish between high and
low grade gliomas.
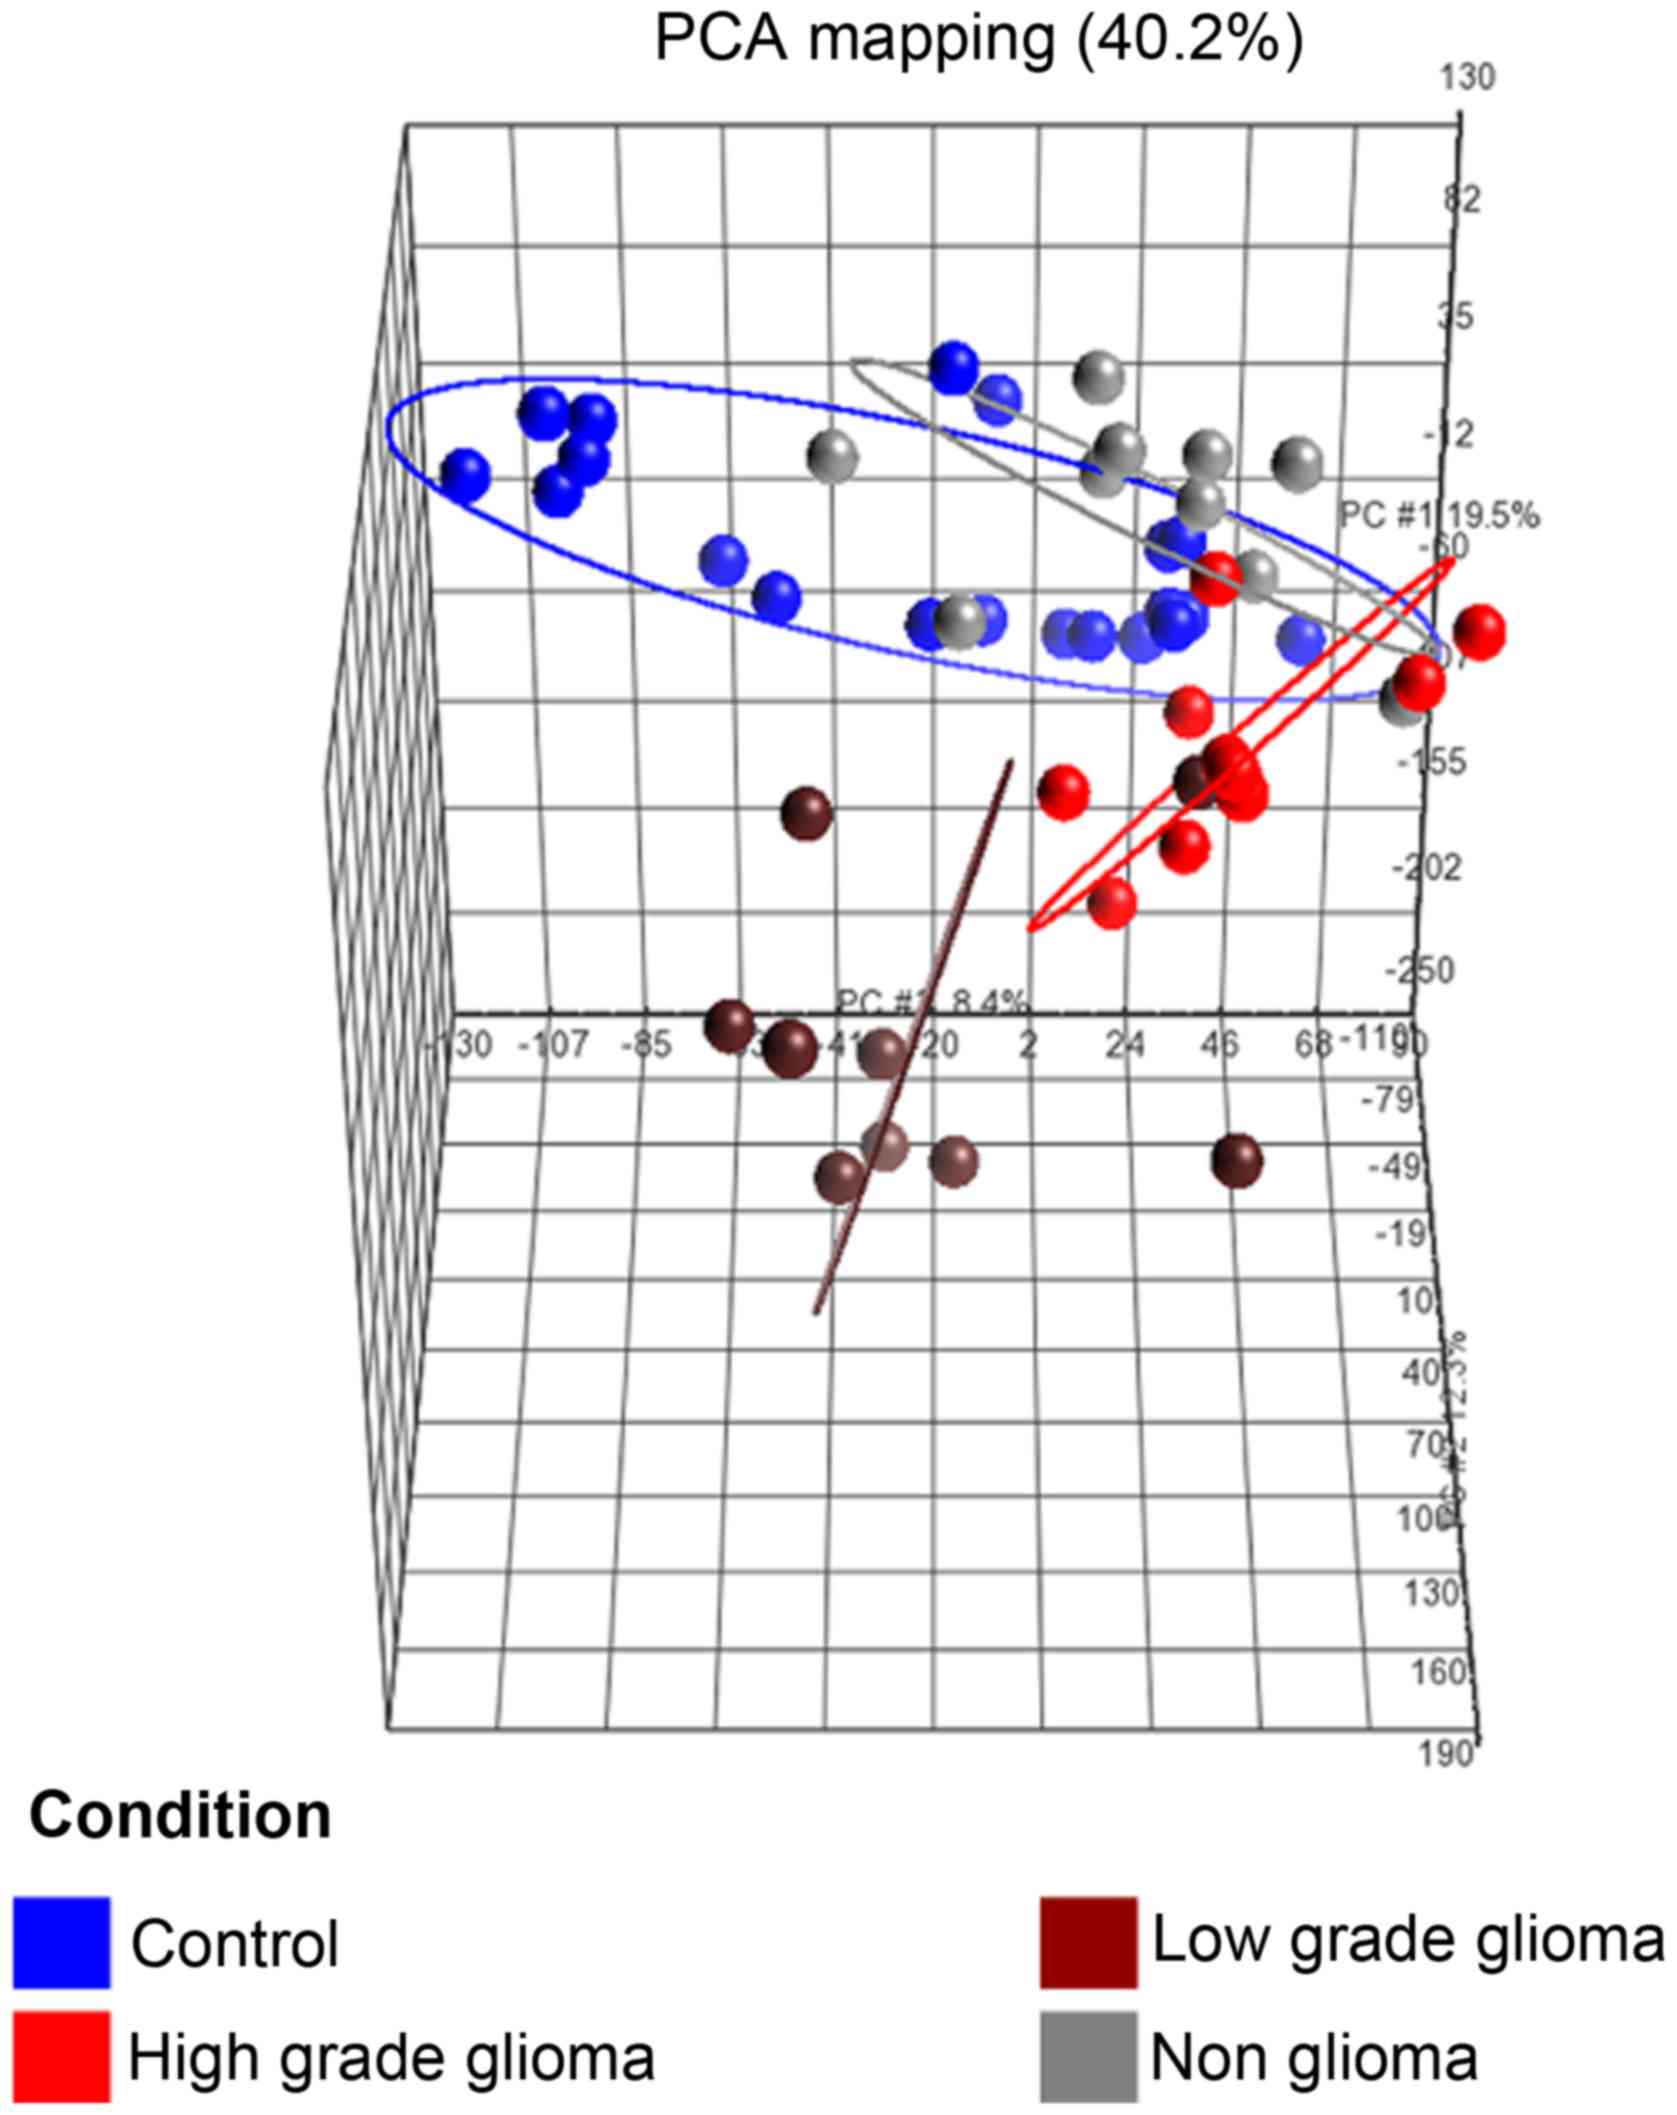
(b) Principal component analysis (PCA)
of samples
The PCA plot (Fig.
3) of the first 3 axes, showed results that were very similar
to that of the microarray analysis, demonstrating clear separation
into the 3 clusters of samples as mentioned in (a). Of specific
note, is that the 2 sample types which were closest to each other
were the control and non-glioma sets.
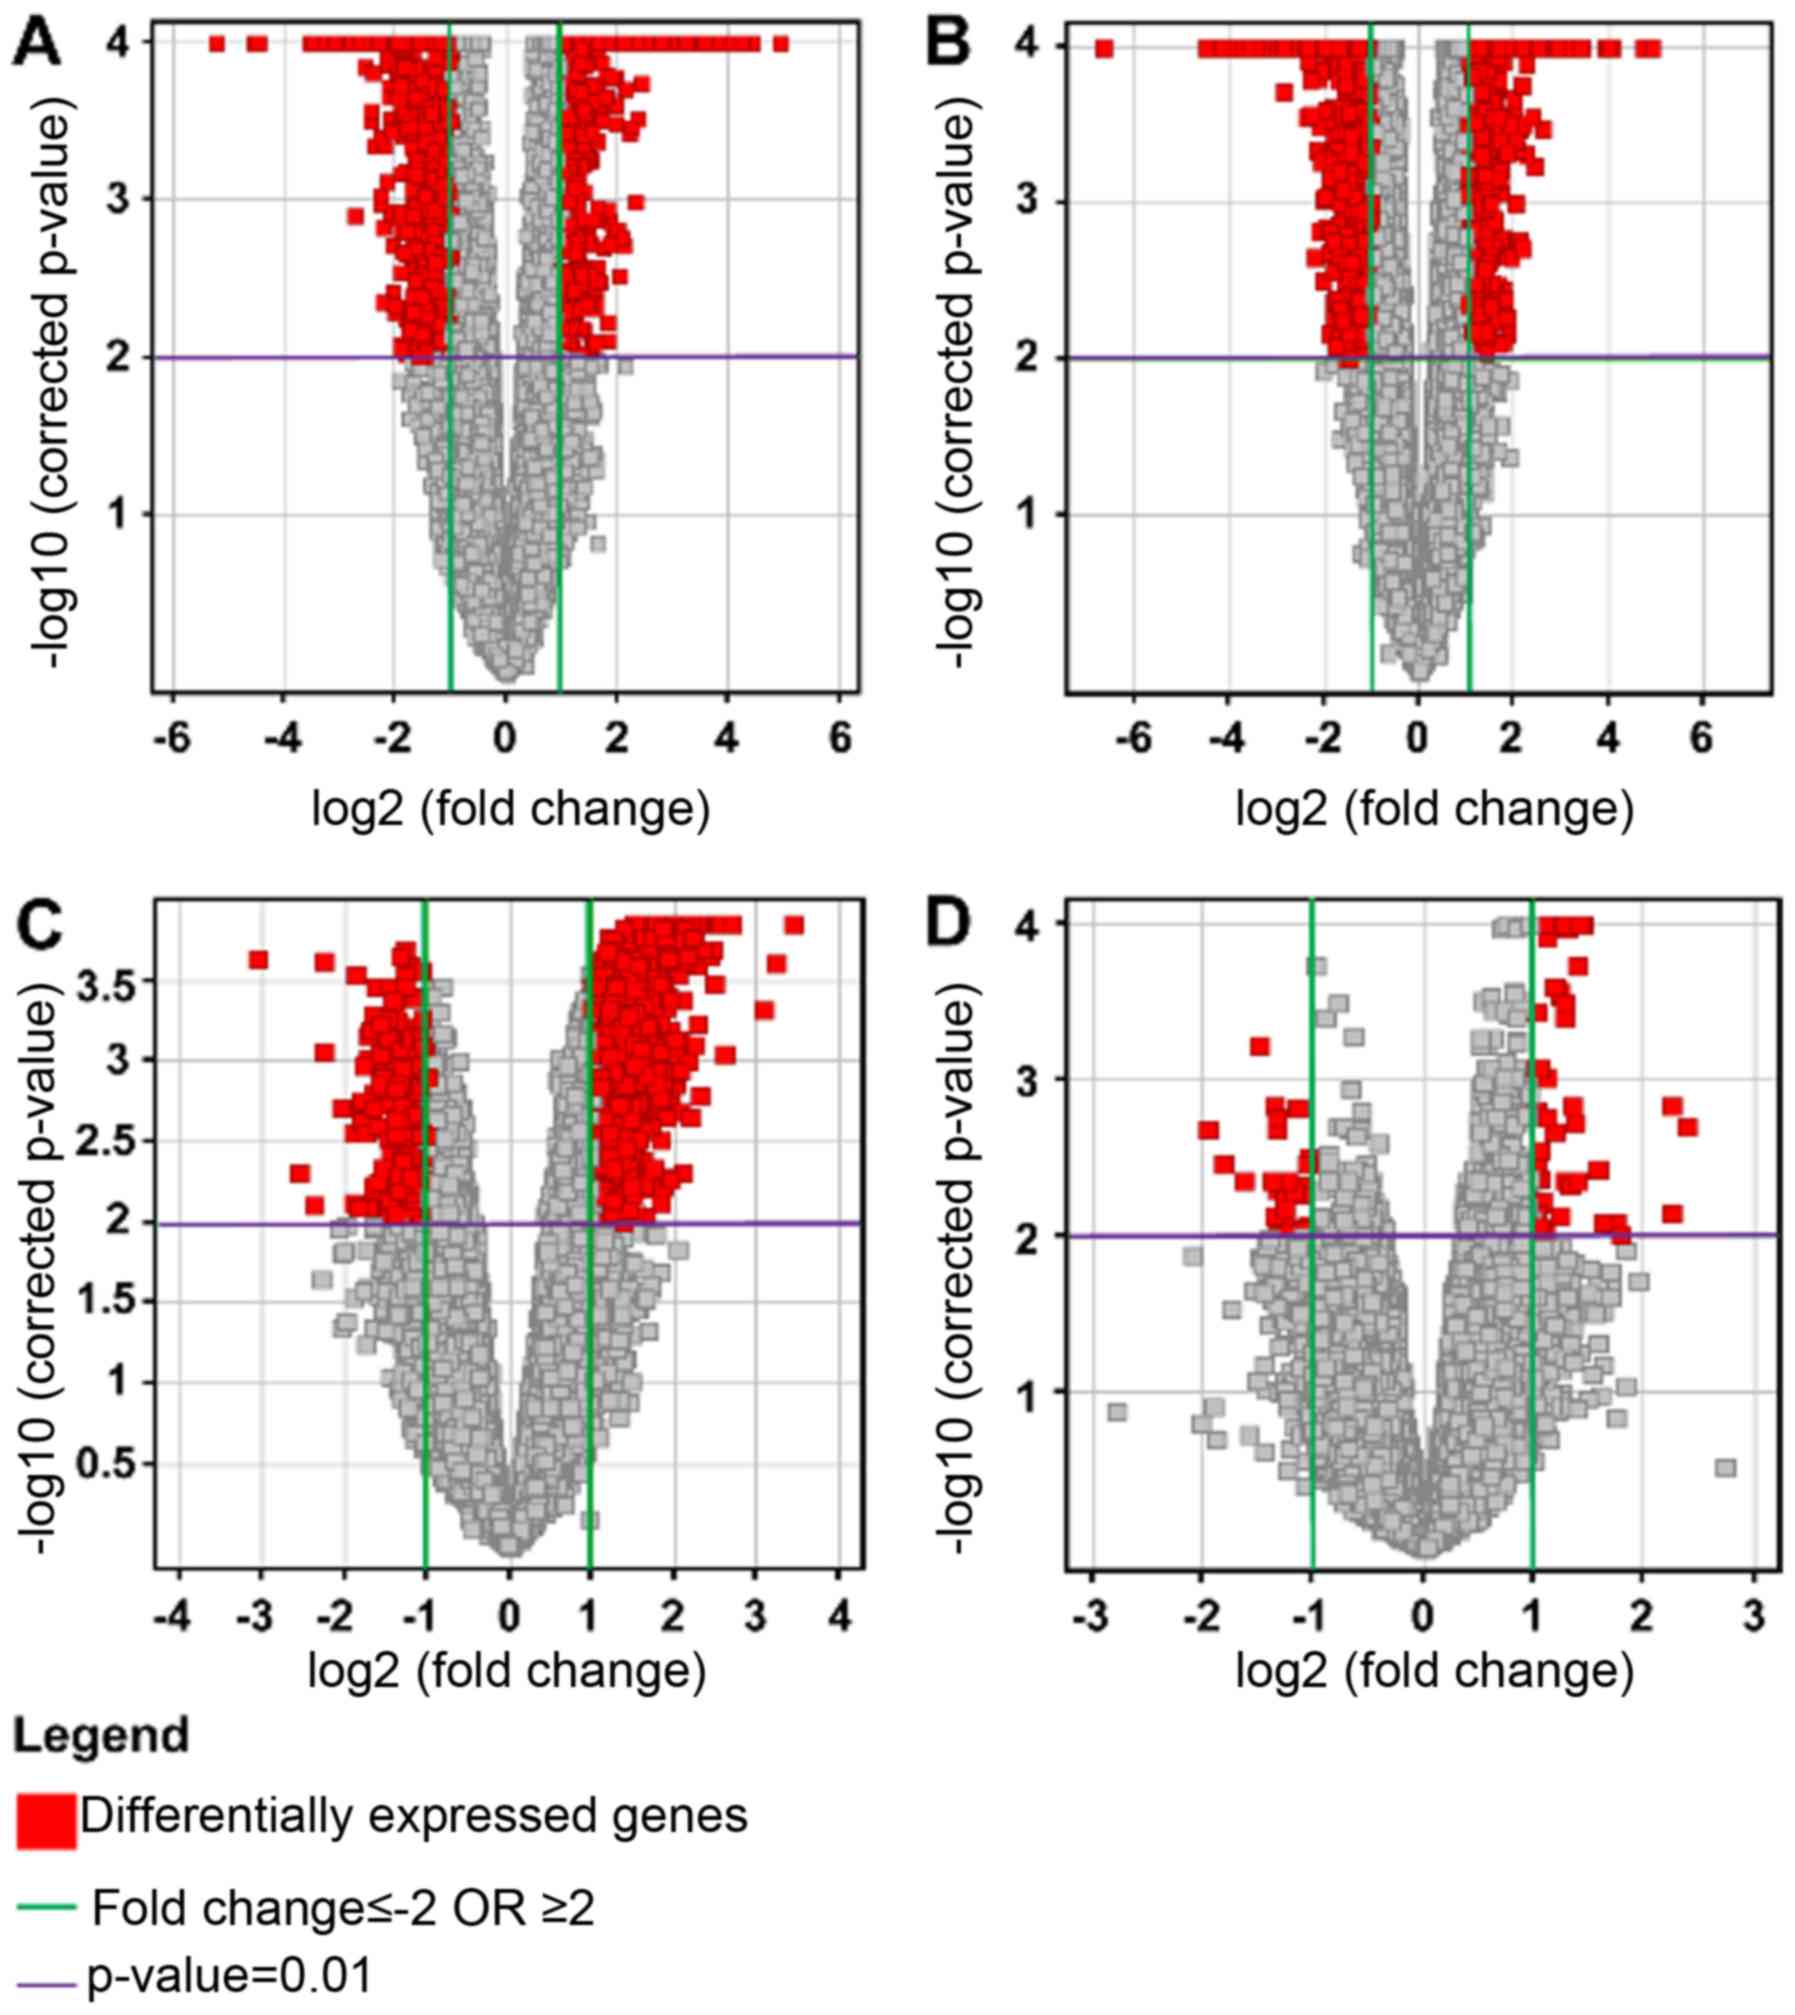
Volcano plots
Multiple testing correction using the
Benjamini-Hochberg (B-H) analysis with a corrected P<0.01, and a
2-fold change cut-off, for each of the four conditions were as
follows: HG vs. C: total number of genes, 1055, with 479
upregulated and 576 downregulated; LG vs. C: total number of genes,
2708, with 713 upregulated and 1995 downregulated; HG vs. LG: total
number of genes, 1629, with 1287 upregulated and 342 downregulated;
and NG vs. C: total number of genes, 82, with 56 upregulated and 26
downregulated. The results were represented on volcano plots
(Fig. 4).
The results showed that there were relatively few
genes which were differentially expressed between control and
non-glioma samples. In comparing the glioma samples to the
controls, the predominant effect was the downregulation of genes in
the glioma samples. When comparing the high and low grade samples,
there was in general an upregulation occurring in the high grade
samples.
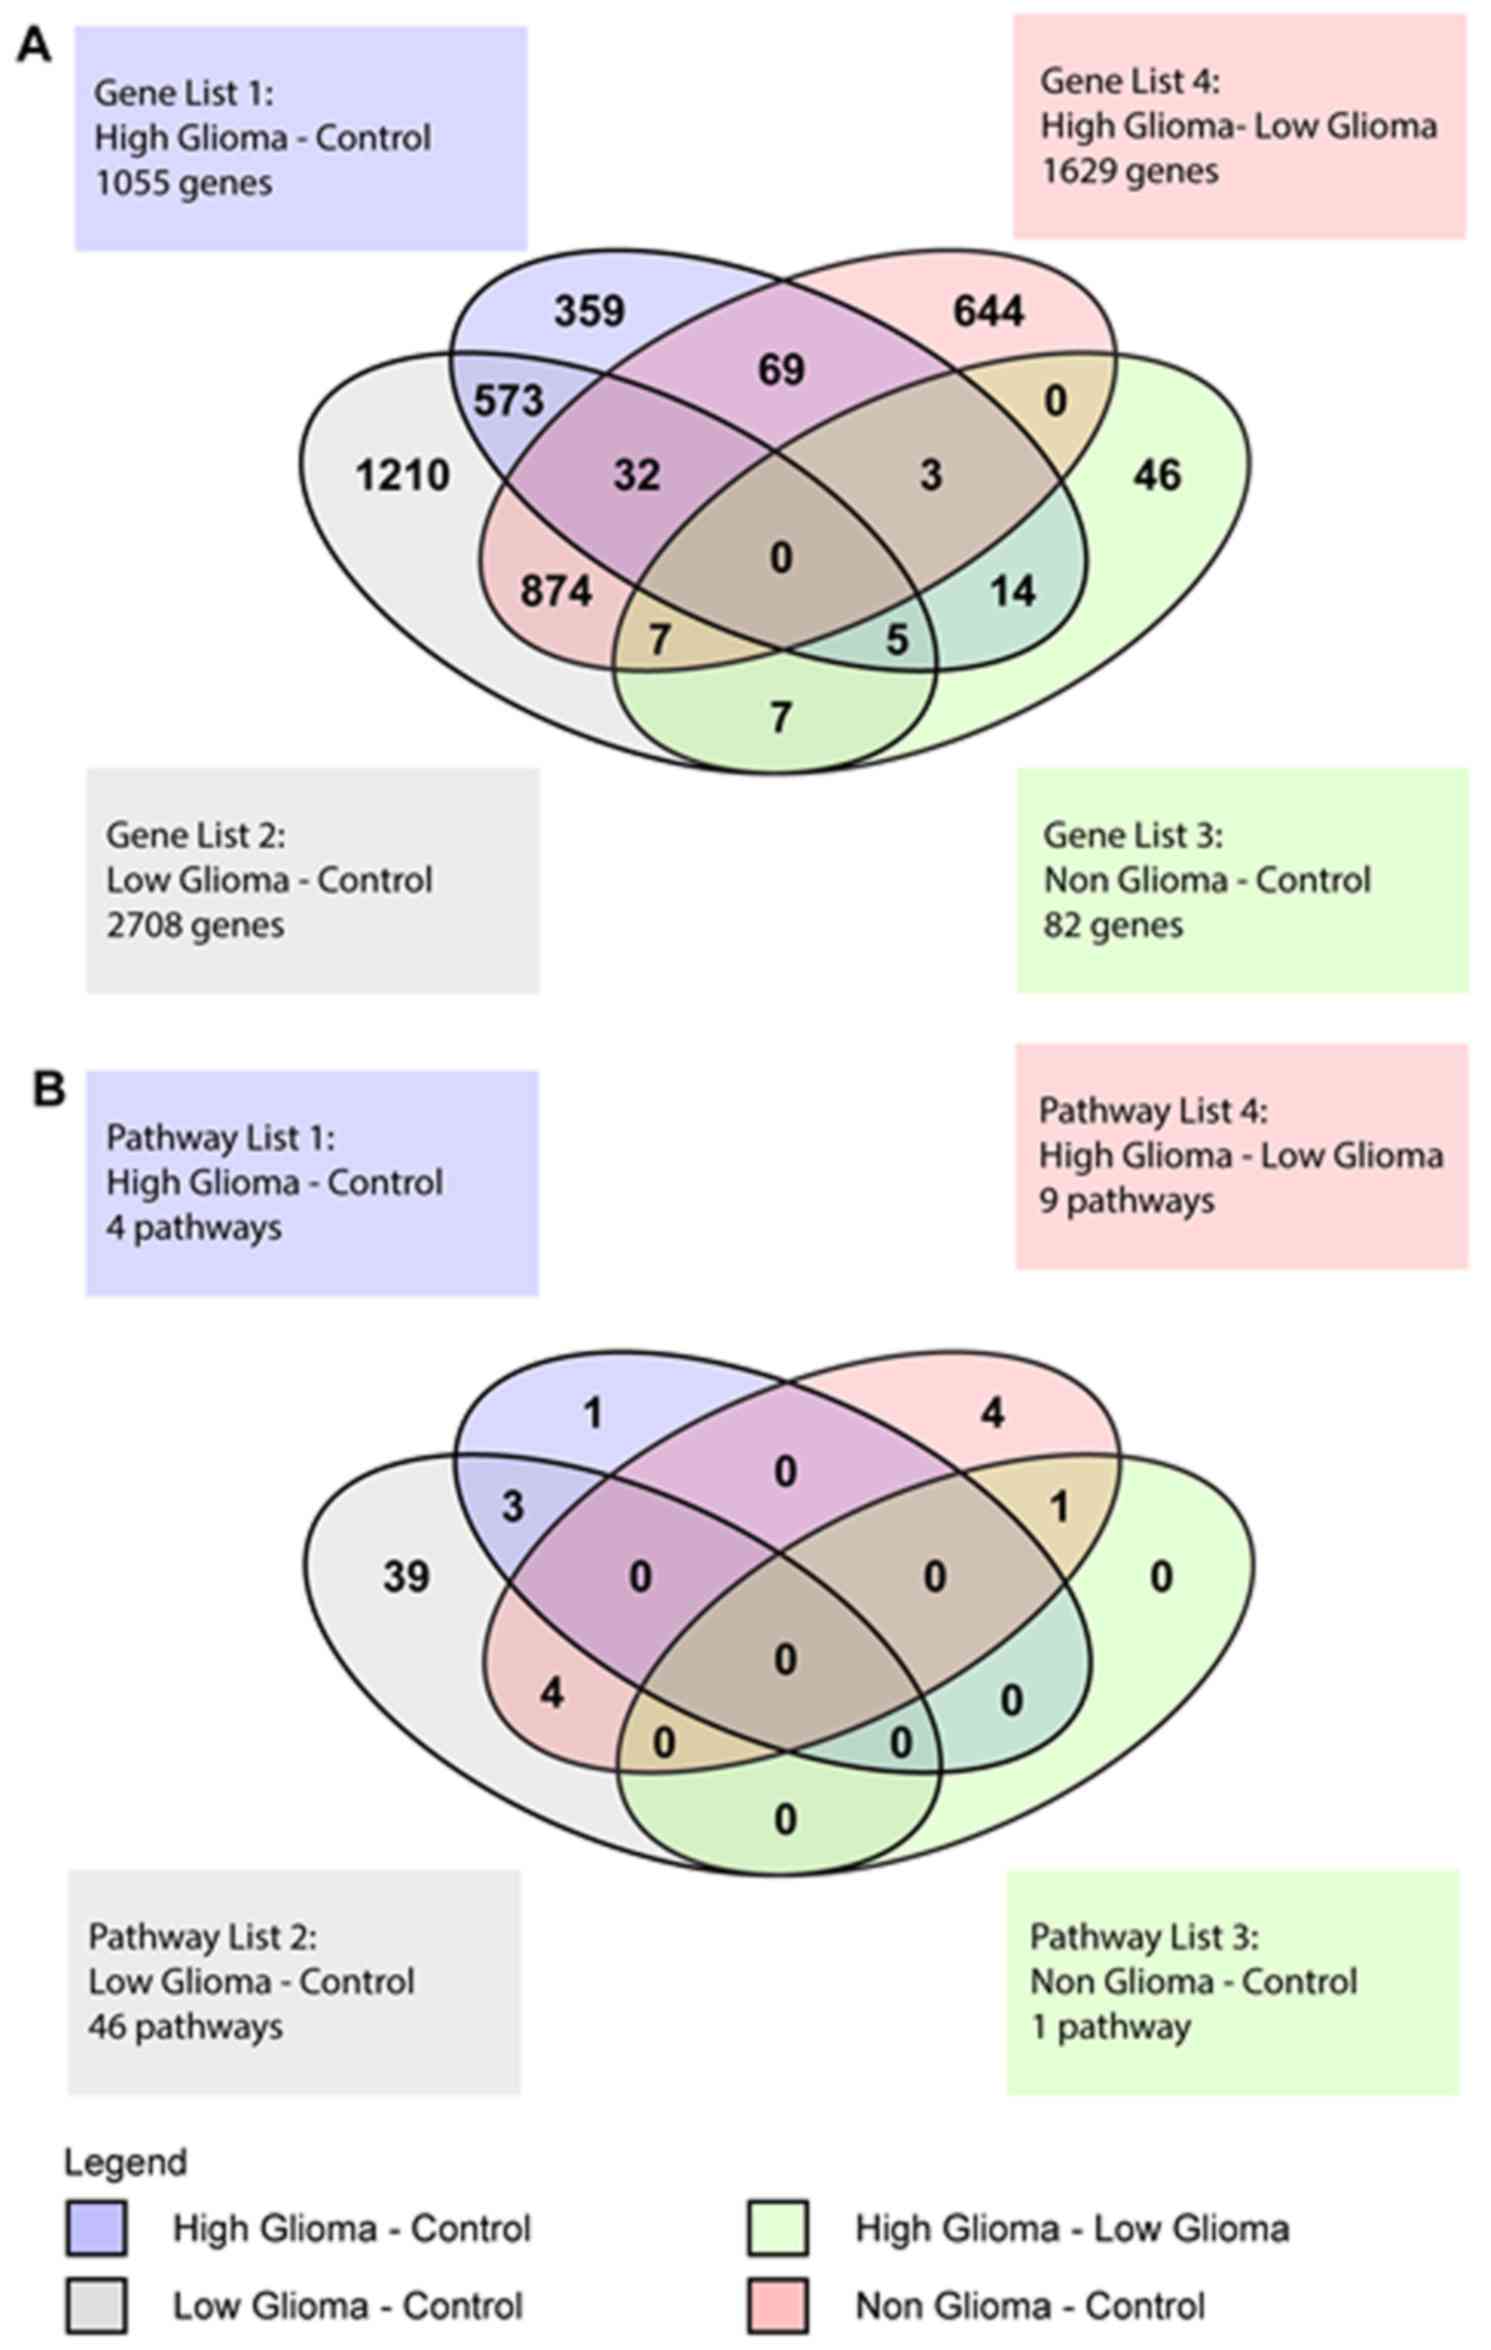
Venn diagram of differentially
expressed genes
The Venn Diagram represented the genes with at least
a 2-fold difference in expression and a P<0.01, that were unique
to each condition and also those that overlapped between the
various conditions (Fig. 5A). There
were 104 genes common to both the HG vs. C and the HG vs. LG pairs.
These included genes belonging to the zinc finger transcription
factor, ZNF 649 and ZNF 205, homeobox genes such as
HOXB2 and SOX8, a transcription factor involved in
embryonic development and determination of cell fate. For the HG
vs. LG pair, there were a total of 1629 genes, of which 644 were
unique to this pair and included EGFR, TGFβ1 and
VEGFA. There were 573 genes common to both the HG vs. C and
LG vs. C pairs. These common genes included IL12RB1,
FOS, TP53 and TNF. One important gene common
to the HG vs. C, LG vs. C and HG vs. LG pairs was IL6.
For the NG vs. C pair, there were 46 unique genes,
19 that overlapped with the HG vs. C pair, 7 that overlapped with
the LG vs. C pair and another 7 that were common to the HG vs. LG
and LG vs. C pairs. There were no genes common to all 4 conditions
(Fig. 5A).
Canonical pathways
The significance of association between
differentially expressed genes and the canonical pathways (as
annotated by the HumanCyc Pathway database) were assumed to follow
a normal distribution and assessed using the B-H multiple testing
correction to calculate a P-value. Only those pathways with a
corrected P<0.05 were selected. This determined the probability
that the association between the genes and the pathways, relative
to all functionally characterized human genes, were not explained
by chance alone (data not shown). The IPA also determines whether
the pathways are activated or inhibited by assigning a z score. The
ratio defined the proportion of differentially expressed genes from
a pathway to the total number of genes that make up that particular
pathway. For the HG vs. C pair, 4 significant pathways were
identified (ratios ranging from 0.084 to 0.136) with no evidence
for significant activation or inhibition as shown by z scores close
to zero (data not shown). The 4 significant pathways included those
involved in innate and adaptive immunity. For the LG vs. C pair,
the IPA predicted a mixed pattern of activity for the 46
significant pathways with 23 pathways having no activity pattern
available, 5 pathways having a positive z-score (predicted
activation), 16 pathways having a negative z-score (predicted
inhibition) and 2 pathways having a z-score of zero (data not
shown). The z-score of zero corresponded to the standard mean of
the normal distribution curve. Pathways having no activity pattern
available meant that a z-score could not be calculated. The
significant pathways with a positive z-score included those
involved in LXR/RXR activation, RhoG, Ephrin B,
IL-8 and cholecystokinin/gastrin-mediated signaling. The
z-score of zero included pathways involved in NF-κB
activation by viruses and glioma invasiveness signaling. The
significant pathways with a negative z-score were signaling by the
Rho family of GTPases, TEC kinase signaling,
HGF, eicosanoid, integrin, acute phase response, PEDF
and thrombin signaling. It also included pathways involved in
PKC, actin nucleation and immune system signaling.
For the HG vs. LG glioma pair, 9 significant
pathways were predicted with 6 having no activity pattern and 1
each with a positive, negative and zero z-score respectively (data
not shown). The activity pattern referred to the differential
expression of genes that made up the pathway. The 6 pathways with
no activity pattern were those involved in FXR/RXR
activation, superoxide radical degeneration, hepatic
fibrosis/hepatic stellate cell activation, role of tissue factor in
cancer, clathrin-mediated endocytosis and atherosclerosis
signaling. The pathways that had a positive z-score, a z-score of
zero and a negative z-score were pathways involved in
LXR/RXR activation, coagulation system and acute phase
response signaling respectively. For the NG vs. C pair, there was
only one significant pathway, hepatic fibrosis/hepatic stellate
cell activation that had no activity pattern available (data not
shown).
Venn diagram of significant
pathways
The Venn diagram for the pathways showed pathways
that were unique to each pair of conditions and also pathways that
overlapped between the 4 different groups (Fig. 5B). For the HG vs. C pair, there was
1 unique pathway and 3 pathways that overlapped with the LG vs. C
pair. The LG vs. C pair had 39 unique pathways. The pathways that
overlapped between the HG vs. C and LG vs. C pairs were pathways
involved in the innate and adaptive immune response. The HG vs. LG
pair had a total of 9 significant pathways, with 4 unique pathways,
4 overlapping with the LG vs. C pair and 1 overlapping with the NG
vs. C pair. The 4 unique pathways were the superoxide radicals
degradation, clathrin-mediated endocytosis, coagulation system and
role of tissue factor in cancer pathways. The 4 pathways
overlapping with the LG vs. C pair were the acute phase response,
FXR/RXR activation, LXR/RXR activation and
atherosclerosis signaling pathways. The 1 pathway overlapping with
the NG vs. C pair was the hepatic fibrosis/hepatic stellate cell
activation pathway.
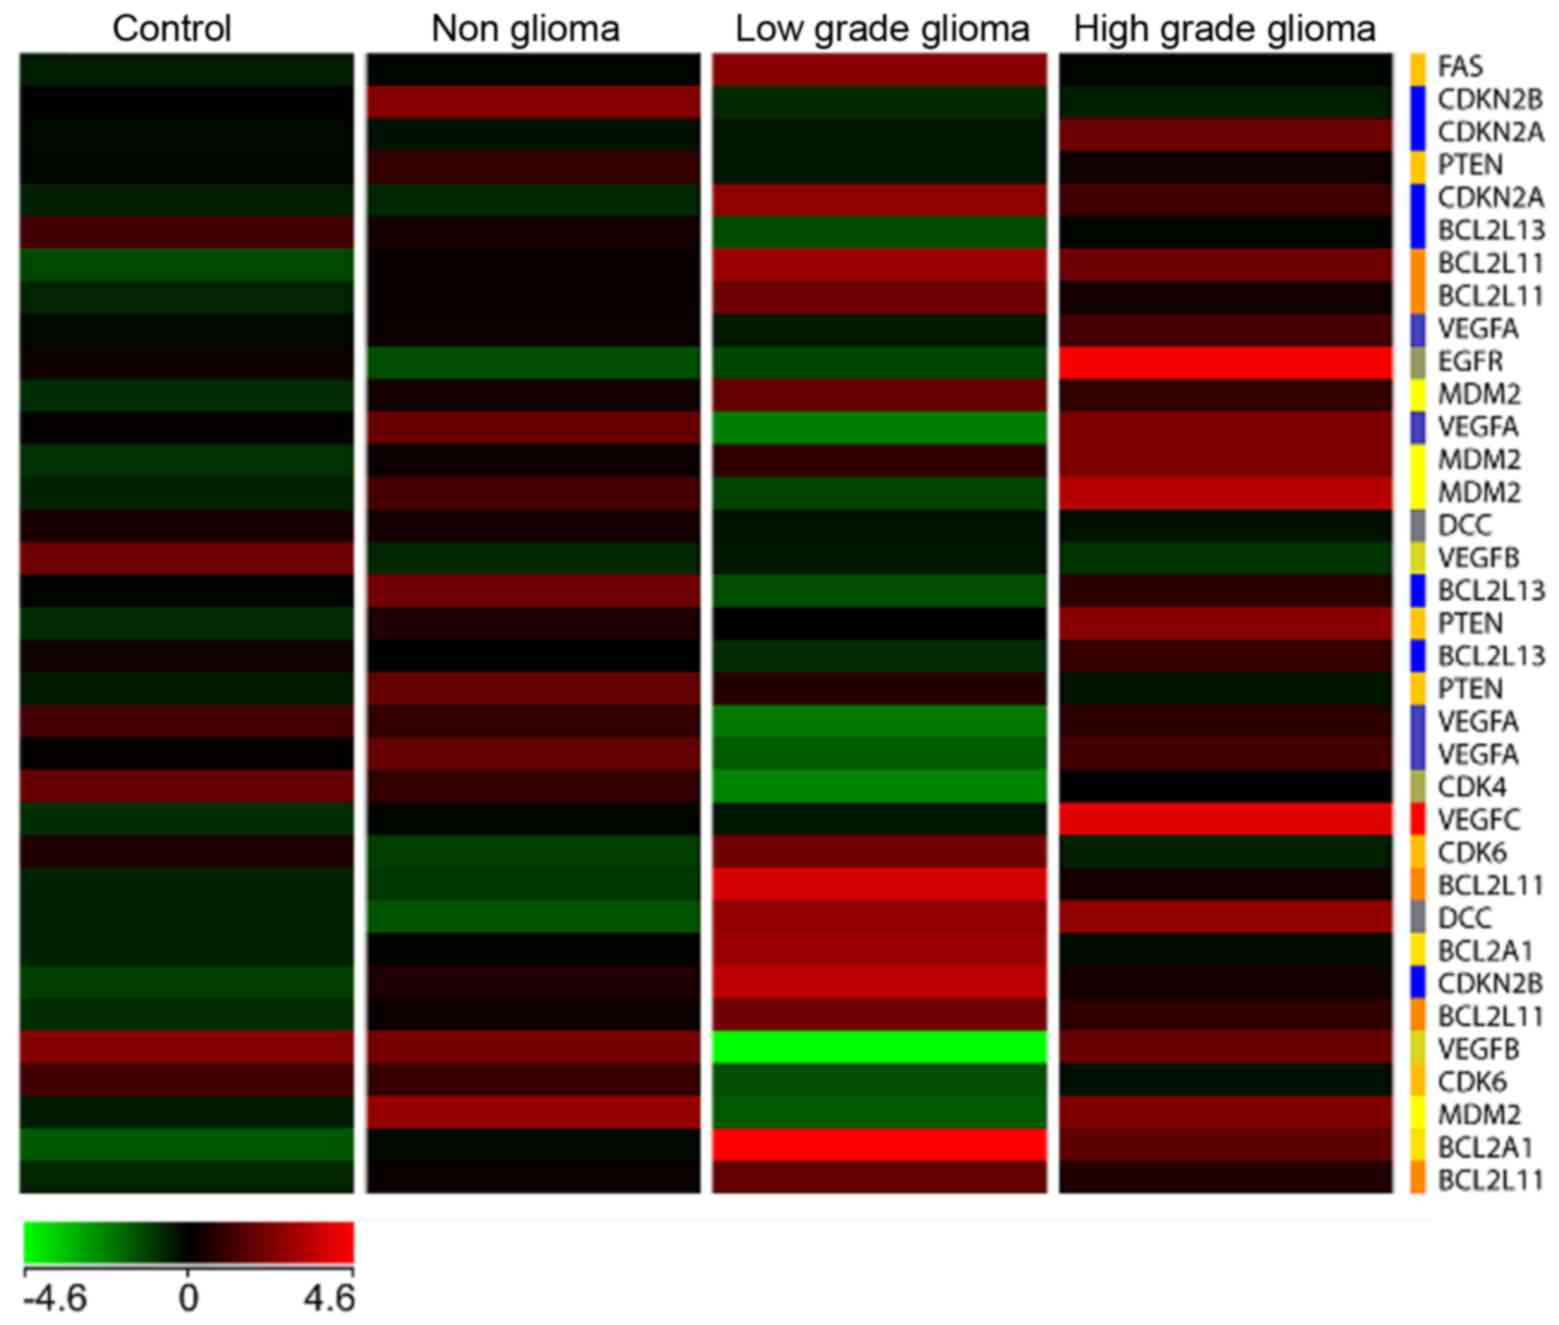
Heat map
A heat map (Fig. 6)
with genes commonly involved in tumor signaling pathways especially
in high and low grade brain tumors was generated with the four
types of samples, namely C, NG, LG and HG glioma, respectively. The
results showed a unique differential pattern of expression for each
of the 4 sample types. In addition, genes commonly upregulated in
high grade tumors such as EGFR and VEGFC, are also
highly expressed in blood. On the other hand, these genes are
downregulated in the low grade tumor heat map. Specific isoforms of
Bcl2 such as Bcl2L11 and Bcl2A1 are
upregulated in the low grade but not high grade samples. None of
the genes involved in tumorigenesis are significantly upregulated
in the non-glioma and control samples.
Genes chosen for validation by
ddPCR
Ten genes were selected for statistical validation
by ddPCR (Table V). These genes
were selected from the list of differentially expressed genes that
were significant from the 4 pairs of conditions. These genes were
selected because they were known to be common genes involved in
pathways related to tumorigenesis including the pathogenesis of
brain tumors. Only the NG vs. C had no significant genes that were
downregulated. The other 3 conditions had significant genes that
were both upregulated and downregulated.
Each gene was evaluated for its expression in a
minimum of 3 to a maximum of 6 samples under each pair of
conditions. The values for the absolute level of gene expression as
obtained by ddPCR was then subjected to statistical analysis. A
normal distribution of the values was assumed and the t-test
applied to each gene with a resulting P-value. Seven of the 10
genes had P<0.05 and 3 genes had P>0.05. The genes with a
P<0.05 were MMP, MAP3K8, TP53, SOS1,
FOS, IL6 and TNF. The genes with a P>0.05
were EGFR, VEGFA and MAPK12 (Table I). Multiple testing correction of
the P-value using the Bonferroni correction with a threshold
P-value of 0.05 and 10 test samples, resulted in only 4 genes that
were highly significant. The genes were MAP3K8, TP53,
SOS1 and IL6 (Table
V).
Discussion
This study has advanced the idea of using
blood-based gene expression studies as an indicator of neoplastic
changes occurring in brain tissue. This idea was based upon the
sentinel principle and extrapolated to the study of brain tumors.
In this study, we have used the sentinel principle not only to
identify patients with a glioma but also to differentiate between
high grade, low grade, non-glioma and control subjects.
The unsupervised hierarchical clustering and
principal component analysis clearly showed that the four groups of
subjects clustered into 3 statistically significant groups as
represented by the ellipses, which showed a distinct directionality
in the different groups based on similarities in gene expression
(Fig. 3). The fact that the
non-glioma and control subjects clustered together and were
distinct from the high and low grade tumor patients, indicated that
the changes in gene expression in blood in these 2 groups were
clearly different from that of the glioma patients indicating
specificity of expression. This lends further credence to the
sentinel principle that substances are released from the tumor into
the bloodstream (10,11) and may be distinct for each tumor
subtype. Although the blood samples in this study were taken from
patients after presentation to the hospital with neurological
symptoms, it is highly likely that these substances were released
during the early stages of tumor formation (10) and continued to persist in blood even
as the tumor enlarged based upon the theory and evidence from the
sentinel principle (10,11).
The brain, as an immunologically privileged site, is
protected by the blood-brain barrier which restricts the movement
of water soluble molecules by tight junctions (38) and a low level of transcytosis
(39). The breakdown of the
blood-brain barrier in brain tumors can be visualized by either
freeze fracture electron microscopy (40) or contrast enhanced magnetic
resonance imaging (MRI) using gadolinium (41). The normal blood-brain barrier is
impermeable to contrast medium but there is a gradual increase in
the degree of disruption of the blood-brain barrier corresponding
to the grade of the tumor. WHO grade II tumors show little or no
contrast medium enhancement, WHO grade III tumors enrich more
contrast medium than grade II tumors while WHO grade IV tumors
(GBM) show the greatest gadolinium enhancement (35). This observation fits well with our
postulation that substances from the brain are able to cross the
blood-brain barrier and enter the circulation due to the varying
degrees of disruption of the blood-brain barrier during glioma
formation.
In addition, cells may dislodge from the tumor and
enter the peripheral circulation as circulating tumor cells (CTCs).
These CTCs then colonize a distant tissue or organ and begin to
form a new tumor mass. Although most CTCs do not survive in the
circulation, a subset of cells known as disseminated tumor cells
(DTCs) that have cancer stem cell properties are able to survive.
They then invade a distant tissue or organ site and form tumor cell
clusters known as micrometastasis (42). Since CTCs are found in extremely low
levels in the circulation (<5 cells/10 ml of blood) (43), identification and detection of these
cells require analytical methods that are highly sensitive and
specific combined with enrichment procedures. We did not perform
the isolation of CTCs in this study as the contribution of these
CTCs is extremely small compared to the contribution of leucocytes
to the gene expression patterns seen in the peripheral blood
transcriptome through signaling mechanisms via the sentinel
principle.
In gliomas, CTCs are mainly detected in patients
with high grade glioma such as GBM. Unlike tumors of epithelial
origin which express epithelial cell adhesion molecule (EpCAM),
glioma cells instead express Nestin, both in, in vitro and
in vivo studies. This suggests that Nestin could be used as
a suitable marker for the detection of circulating glioma cells. In
addition, glioma cells also express high levels of human telomerase
(hTERT) which co-localizes with Nestin in vivo (44).
Athough CTCs may have limited use in studying gene
expression patterns in the peripheral blood transcriptome, they may
have clinical utility in distinguishing between a persistent signal
on MRI which may be due to either true disease progression or
pseudoprogression. Thus, the identification of glioma-derived CTCs
in the circulation of such patients posttreatment (after
chemoradiation therapy) is prognostic, with a reduction in CTCs
indicating treatment response and an increase in CTCs indicating
disease progression (44,45).
Besides CTCs, circulating tumor-associated nucleic
acids (CNAs) can also be used as possible biomarkers. CNAs are
particularly promising as biomarkers as this allows the tumor to be
sampled at the transcriptomal and genomic level from blood. Nucleic
acids can be found in body fluids including blood as a result of
tumor apoptosis, necrosis or active secretion into the peripheral
circulation (46). Circulating
tumor-associated DNA (ctDNA) may harbor the same genetic
aberrations found in the tumor. ctDNA in glioma patients have been
shown to have similar genetic alterations as found in the parent
tumor including LOH for 1p and 19q (47), IDH1 mutation (48) and abnormal methylation of the
promoters of certain genes including MGMT (49) and p16 (50). Using circulating tumor-associated
RNA (ctRNA) as a biomarker is more challenging, as RNA is easily
degraded by RNases which are present in the peripheral blood of
cancer patients. However, microRNAs (miRNAs) have shown more
promise as biomarkers in glioma patients. These include RNU6-1,
miR-320 and miR-574 which are associated with GBM (51) and miR-29 with differential
expression in low grade vs. high grade gliomas (52). However, we chose not to include
these types of investigations in the present study as we were
focusing on gene expression of the peripheral blood transcriptome
via the sentinel principle.
The differentially expressed genes for the four
different conditions were unique, but also had some commonality.
Most of the unique and common genes in the HG and LG tumor samples
were transcription factors, cytokines, proto-oncogenes, oncogenes,
growth factors and tumor suppressor genes. These genes are involved
in inflammation, tumor signaling pathways, glioma formation, tissue
necrosis, apoptosis, homeostasis, cytoskeletal architecture,
maintenance of the extracellular matrix and determination of cell
fate. Notably, there were also a substantial number of genes
involved in the innate and adaptive immune system suggesting that
modulation of the immune system plays a critical role in tumor
response. In addition, genes known to be involved in the
pathogenesis of GBM were also upregulated in blood. These genes
included EGFR, VEGF and IL-6. This evidence
implied that some of the changes occurring in the tumor tissue may
be reflected in blood, suggesting that these substances may be
released into the circulation through disruption of the blood-brain
barrier or through complex signaling mechanisms.
The canonical pathways for the 4 sets of conditions
mirrored the differential gene expression pattern. These included
pathways involved in the innate and adaptive immune response,
interleukin, acute phase response, glioma invasiveness, NF-κB
activation and TGF-β signaling. The latter 3 pathways are also
involved in the pathogenesis of gliomas. Again, we see much
commonality between the signaling pathways in tissue and blood
taken from glioma patients. One of the reasons for this could be
the fact that peripheral blood cells share more than 80% of the
transcriptome with 9 different tissue types including brain
(10). More important is the fact
that blood cells express organ specific genes and also genes that
are responsive to physiological changes and stimuli that were
previously thought to be exclusive to certain tissue types
(10). In the pathogenesis and
formation of gliomas, these interactions between blood and tissue,
together with disruption of the blood-brain barrier, could possibly
explain some of the similarity observed in gene expression between
gliomas and peripheral blood cells.
The validation of selected genes was done by ddPCR.
As previously mentioned, these genes were selected because they
were known to be involved in signaling pathways that played an
important role in tumorigenesis including the pathogenesis and
formation of gliomas. In the selection of 10 genes for validation,
4 of the 10 genes, namely TP53, TNF, MAPK12
and EGFR showed fold changes that were reversed to that seen
in the microarray experiment. TP53, TNF and
MAPK12 were downregulated in the microarray experiment but
upregulated by validation and EGFR was upregulated in the
microarray experiment but minimally downregulated by validation.
The reason for this could be multifactorial. Firstly and most
importantly, the probes used for the microarray experiment are
different from the primers used in ddPCR. As genes very commonly
have isoforms, it is likely that the primers in ddPCR may be
amplifying an isoform of the gene resulting in alternative
transcripts (26). These
transcripts may have expression levels that are different from the
parent gene. In addition, there may be a negative feedback loop
where one transcript inhibits the expression of the alternative
transcript of the same gene or vice versa. This could result in
reversal of expression as seen during ddPCR validation. Therefore,
great importance should be placed on careful primer design when
using qRT-PCR and ddPCR. For these validation assays, the primers
should be designed to be on the same exon as the microarray probes.
By doing this, variations in gene expression between microarrays
and validation assays including ddPCR will be minimized. Secondly,
we selected GUSB as the housekeeping gene to normalize our
ddPCR data. Although GUSB showed the least variation with
samples compared to TBP and HuPO, it might still have
shown some variation in gene expression in the tumor samples. This
could result in reversal of gene expression after validation.
Thirdly, microarray analysis is generally used to screen large
numbers of genes and the possibility arises that there may be false
positives. In addition, microarray experiments are often performed
with a small number of biological replicates, resulting in low
statistical power for detecting differentially expressed genes and
concomitant high false positive rates. Studies have shown that
microarray results were in agreement with qRT-PCR and ddPCR for
genes with medium and high expression but there was very little
agreement for genes with lower or variable expression (53–55).
In this study, the genes generally varied in expression from 2–4
fold which is considered a low fold change. As such, we would
expect some differences between the gene expression in microarrays
compared to ddPCR including reversal of expression. Fourthly, human
samples have huge technical and biological variability and it is
likely that the presence of substances such as activators or
inhibitors within the samples could be contributing to the
differences observed. This is because ddPCR, being far more
sensitive and quantitative and having a higher dynamic range, is
able to detect the expression of genes affected by either
inhibitors or activators, that may not be detected by microarray
analysis. Also, the scanning software for microarrays has low
sensitivity which can limit the precision of detection of the
image, thus, contributing to a lower fold change of the
differentially expressed genes. Fifthly, not all samples were used
for validation by ddPCR. Only 3–6 samples were used for each set of
conditions and this may have affected the level and pattern of gene
expression as well.
The initial P-values obtained showed that 7 of the
10 genes chosen for validation had statistically significant
P<0.05. The genes with initial P>0.05 were EGFR,
VEGFA and MAPK12. After applying the Bonferroni
correction for the P-value, only 4 of the 10 genes passed this
stringent statistical test. The 4 genes were MAP3K8,
IL6, SOS1 and TP53. Although the other genes
were not considered to be statistically significant, they could be
clinically significant. In addition, P-values are dependent on many
factors including sample size, with a larger sample size giving
rise to a more reliable P-value (56). In our case with a limited sample
size, the P-value could vary by adding or removing even one value.
Thus, a larger sample size would definitely add more confidence to
the P-values that were obtained in our experiments.
There are limitations to the use of the sentinel
principle and that of a blood-based biomarker to detect changes in
a disease state in another tissue. The main limitation is that the
blood transcriptome is susceptible to a vast array of changes such
as that due to tobacco smoke, environmental pollutants and toxins,
and to diseases such as hypertension, diabetes, cardiovascular
disease, ischaemic stroke and asthma (12–15,57,58).
Many cancer patients, including the patients in the present study,
have these comorbidities and this could have a confounding effect
on the differential gene expression pattern observed. In addition,
the drawing of blood, temperature and storage conditions can all
have an effect on gene expression levels of peripheral blood
cells.
This is a preliminary study to assess the
possibility of using a blood-based biomarker to differentiate
between high grade, low grade, non-glioma and control samples. The
main drawback of the present study is the small sample size. In
order to take this study forward to a blood-based biomarker panel
for gliomas, we would need a much larger sample size to give this
study more power and to obtain more reliable P-values for the genes
selected. In addition, this study would need to be validated in an
independent data set.
Finally, the data in this study will be freely
available. As the sample number, n, in this study is small, this
will enable those who are interested to verify the results of this
study, to use the data as a starting point. They may wish to
replicate this study using a similar or larger sample size.
Acknowledgements
We wish to thank the Director General of Health,
Malaysia for the permission to publish this study. The present
study was financially supported by a grant (NMRR 10-930-7461) from
the Ministry of Health, Malaysia, awarded to Dr S.N.P.
References
|
1
|
Stewart BW and Wild CP: World Cancer
Report 2014. International Agency for Research on Cancer (IARC)
Publications; Lyon, France: 2014, http://www.iarc.fr/en/publications/books/wcr/index.php
|
|
2
|
Ferlay J, Soerjomataram I, Ervik M,
Dikshit R, Eser S, Mathers C, Rebelo M, Parkin DM, Forman D and
Bray, F: Cancer incidence and mortality worldwideIARC CancerBase
no. 11. 2012, IARC Press; Lyon:
|
|
3
|
US Mortality Data, . 2006.National Centre
for Health Statistics. Centres for Disease Control and Prevention.
2009.
|
|
4
|
Linet MS, Ries LA, Smith MA, Tarone RE and
Devesa SS: Cancer surveillance series: Recent trends in childhood
cancer incidence and mortality in the United States. J Natl Cancer
Inst. 91:1051–1058. 1999. View Article : Google Scholar : PubMed/NCBI
|
|
5
|
Louis DN, Ohgaki H, Wiestler OD, Cavenee
WK, Burger PC, Jouvet A, Scheithauer BW and Kleihues P: The 2007
WHO classification of tumours of the central nervous system. Acta
Neuropathol. 114:97–109. 2007. View Article : Google Scholar : PubMed/NCBI
|
|
6
|
Stupp R, Mason WP, van den Bent MJ, Weller
M, Fisher B, Taphoorn MJ, Belanger K, Brandes AA, Marosi C, Bogdahn
U, et al: European Organisation for Research and Treatment of
Cancer Brain Tumor and Radiotherapy Groups; National Cancer
Institute of Canada Clinical Trials Group: Radiotherapy plus
concomitant and adjuvant temozolomide for glioblastoma. N Engl J
Med. 352:987–996. 2005. View Article : Google Scholar : PubMed/NCBI
|
|
7
|
Sawin PD, Hitchon PW, Follett KA and
Torner JC: Computed imaging-assisted stereotactic brain biopsy: A
risk analysis of 225 consecutive cases. Surg Neurol. 49:640–649.
1998. View Article : Google Scholar : PubMed/NCBI
|
|
8
|
Samadani U, Stein S, Moonis G, Sonnad SS,
Bonura P and Judy KD: Stereotactic biopsy of brain stem masses:
Decision analysis and literature review. Surg Neurol. 66:484–490;
discussion 491. 2006. View Article : Google Scholar : PubMed/NCBI
|
|
9
|
Chen CC, Hsu PW, Erich Wu TW, Lee ST,
Chang CN, Wei KC, Chuang CC, Wu CT, Lui TN, Hsu YH, et al:
Stereotactic brain biopsy: Single center retrospective analysis of
complications. Clin Neurol Neurosurg. 111:835–839. 2009. View Article : Google Scholar : PubMed/NCBI
|
|
10
|
Liew CC, Ma J, Tang HC, Zheng R and
Dempsey AA: The peripheral blood transcriptome dynamically reflects
system wide biology: A potential diagnostic tool. J Lab Clin Med.
147:126–132. 2006. View Article : Google Scholar : PubMed/NCBI
|
|
11
|
Mohr S and Liew CC: The peripheral-blood
transcriptome: New insights into disease and risk assessment.
Trends Mol Med. 13:422–432. 2007. View Article : Google Scholar : PubMed/NCBI
|
|
12
|
Gladkevich A, Nelemans SA, Kauffman HF and
Korf J: Microarray profiling of lymphocytes in internal diseases
with an altered immune response: Potential and methodology.
Mediators Inflamm. 2005:317–330. 2005. View Article : Google Scholar : PubMed/NCBI
|
|
13
|
Hansson GK: Inflammation, atherosclerosis,
and coronary artery disease. N Engl J Med. 352:1685–1695. 2005.
View Article : Google Scholar : PubMed/NCBI
|
|
14
|
Hotamisligil GS: Inflammation and
metabolic disorders. Nature. 444:860–867. 2006. View Article : Google Scholar : PubMed/NCBI
|
|
15
|
Coussens LM and Werb Z: Inflammation and
cancer. Nature. 420:860–867. 2002. View Article : Google Scholar : PubMed/NCBI
|
|
16
|
Liew CC: Methods for the detection of gene
transcripts in blood and uses thereof. United States patent US
20040014059. Jan 22–2004.
|
|
17
|
Marshall KW, Mohr S, Khettabi FE, Nossova
N, Chao S, Bao W, Ma J, Li XJ and Liew CC: A blood-based biomarker
panel for stratifying current risk for colorectal cancer. Int J
Cancer. 126:1177–1186. 2010.PubMed/NCBI
|
|
18
|
Han M, Liew CT, Zhang HW, Chao S, Zheng R,
Yip KT, Song ZY, Li HM, Geng XP, Zhu LX, et al: Novel blood-based,
five-gene biomarker set for the detection of colorectal cancer.
Clin Cancer Res. 14:455–460. 2008. View Article : Google Scholar : PubMed/NCBI
|
|
19
|
Yip KT, Das PK, Suria D, Lim CR, Ng GH and
Liew CC: A case-controlled validation study of a blood-based
seven-gene biomarker panel for colorectal cancer in Malaysia. J Exp
Clin Cancer Res. 29:128–134. 2010. View Article : Google Scholar : PubMed/NCBI
|
|
20
|
Tsuang MT, Nossova N, Yager T, Tsuang MM,
Guo SC, Shyu KG, Glatt SJ and Liew CC: Assessing the validity of
blood-based gene expression profiles for the classification of
schizophrenia and bipolar disorder: A preliminary report. Am J Med
Genet B Neuropsychiatr Genet 133B. 1–5. 2005. View Article : Google Scholar
|
|
21
|
Glatt SJ, Everall IP, Kremen WS, Corbeil
J, Sásik R, Khanlou N, Han M, Liew CC and Tsuang MT: Comparative
gene expression analysis of blood and brain provides concurrent
validation of SELENBP1 up-regulation in schizophrenia. Proc Natl
Acad Sci USA. 102:15533–15538. 2005. View Article : Google Scholar : PubMed/NCBI
|
|
22
|
Kaushik N, Fear D, Richards SC, McDermott
CR, Nuwaysir EF, Kellam P, Harrison TJ, Wilkinson RJ, Tyrrell DA,
Holgate ST, et al: Gene expression in peripheral blood mononuclear
cells from patients with chronic fatigue syndrome. J Clin Pathol.
58:826–832. 2005. View Article : Google Scholar : PubMed/NCBI
|
|
23
|
Tang Y, Schapiro MB, Franz DN, Patterson
BJ, Hickey FJ, Schorry EK, Hopkin RJ, Wylie M, Narayan T, Glauser
TA, et al: Blood expression profiles for tuberous sclerosis complex
2, neurofibromatosis type 1, and Downs syndrome. Ann Neurol.
56:808–814. 2004. View Article : Google Scholar : PubMed/NCBI
|
|
24
|
Tang Y, Gilbert DL, Glauser TA, Hershey AD
and Sharp FR: Blood gene expression profiling of neurologic
diseases: A pilot microarray study. Arch Neurol. 62:210–215. 2005.
View Article : Google Scholar : PubMed/NCBI
|
|
25
|
Du X, Tang Y, Xu H, Lit L, Walker W,
Ashwood P, Gregg JP and Sharp FR: Genomic profiles for human
peripheral blood T cells, B cells, natural killer cells, monocytes,
and polymorphonuclear cells: Comparisons to ischemic stroke,
migraine, and Tourette syndrome. Genomics. 87:693–703. 2006.
View Article : Google Scholar : PubMed/NCBI
|
|
26
|
Borovecki F, Lovrecic L, Zhou J, Jeong H,
Then F, Rosas HD, Hersch SM, Hogarth P, Bouzou B, Jensen RV, et al:
Genome-wide expression profiling of human blood reveals biomarkers
for Huntington's disease. Proc Natl Acad Sci USA. 102:11023–11028.
2005. View Article : Google Scholar : PubMed/NCBI
|
|
27
|
Maes OC, Xu S, Yu B, Chertkow HM, Wang E
and Schipper HM: Transcriptional profiling of Alzheimer blood
mononuclear cells by microarray. Neurobiol Aging. 28:1795–1809.
2007. View Article : Google Scholar : PubMed/NCBI
|
|
28
|
Liebner S, Fischmann A, Rascher G, Duffner
F, Grote EH, Kalbacher H and Wolburg H: Claudin-1 and claudin-5
expression and tight junction morphology are altered in blood
vessels of human glioblastoma multiforme. Acta Neuropathol.
100:323–331. 2000. View Article : Google Scholar : PubMed/NCBI
|
|
29
|
Wolburg H, Wolburg-Buchholz K, Kraus J,
Rascher-Eggstein G, Liebner S, Hamm S, Duffner F, Grote EH, Risau W
and Engelhardt B: Localization of claudin-3 in tight junctions of
the blood-brain barrier is selectively lost during experimental
autoimmune encephalomyelitis and human glioblastoma multiforme.
Acta Neuropathol. 105:586–592. 2003.PubMed/NCBI
|
|
30
|
Noell S, Fallier-Becker P, Beyer C, Kröger
S, Mack AF and Wolburg H: Effects of agrin on the expression and
distribution of the water channel protein aquaporin-4 and volume
regulation in cultured astrocytes. Eur J Neurosci. 26:2109–2118.
2007. View Article : Google Scholar : PubMed/NCBI
|
|
31
|
Wolburg H, Noell S, Wolburg-Buchholz K,
Mack A and Fallier-Becker P: Agrin, aquaporin-4, and astrocyte
polarity as an important feature of the blood-brain barrier.
Neuroscientist. 15:180–193. 2009. View Article : Google Scholar : PubMed/NCBI
|
|
32
|
Noell S, Fallier-Becker P, Deutsch U, Mack
AF and Wolburg H: Agrin defines polarized distribution of
orthogonal arrays of particles in astrocytes. Cell Tissue Res.
337:185–195. 2009. View Article : Google Scholar : PubMed/NCBI
|
|
33
|
Saadoun S, Papadopoulos MC, Davies DC,
Krishna S and Bell BA: Aquaporin-4 expression is increased in
oedematous human brain tumors. J Neurol Neurosurg Psychiatry.
72:262–265. 2002. View Article : Google Scholar : PubMed/NCBI
|
|
34
|
Warth A, Kröger S and Wolburg H:
Redistribution of aquaporin-4 in human glioblastoma correlates with
loss of agrin immunoreactivity from brain capillary basal laminae.
Acta Neuropathol. 107:311–318. 2004. View Article : Google Scholar : PubMed/NCBI
|
|
35
|
Larsson HB, Stubgaard M, Frederiksen JL,
Jensen M, Henriksen O and Paulson OB: Quantitation of blood-brain
barrier defect by magnetic resonance imaging and gadolinium-DTPA in
patients with multiple sclerosis and brain tumors. Magn Reson Med.
16:117–131. 1990. View Article : Google Scholar : PubMed/NCBI
|
|
36
|
Wolburg H, Noell S, Fallier-Becker P, Mack
AF and Wolburg-Buchholz K: The disturbed blood-brain barrier in
human glioblastoma. Mol Aspects Med. 33:579–589. 2012. View Article : Google Scholar : PubMed/NCBI
|
|
37
|
Lantos PL, VandenBerg SR and Kleihues P:
Tumors of the nervous systemGreenfields neuropathology. Graham DI
and Lantos PL: Arnold; London: pp. 583–879. 1996
|
|
38
|
Brightman MW and Reese TS: Junctions
between intimately apposed cell membranes in the vertebrate brain.
J Cell Biol. 40:648–677. 1969. View Article : Google Scholar : PubMed/NCBI
|
|
39
|
Peters A, Palay SL and Webster H: The Fine
Structure of the Nervous System. 3nd. Oxford University Press; New
York: 1991
|
|
40
|
Dinda AK, Sarkar C, Roy S, Kharbanda K,
Mathur M, Khosla AK and Banerji AK: A transmission and scanning
electron microscopic study of tumoral and peritumoral microblood
vessels in human gliomas. J Neurooncol. 16:149–158. 1993.
View Article : Google Scholar : PubMed/NCBI
|
|
41
|
Sage MR and Wilson AJ: The blood-brain
barrier: An important concept in neuroimaging. AJNR Am J
Neuroradiol. 15:601–622. 1994.PubMed/NCBI
|
|
42
|
Pantel K and Alix-Panabières C:
Circulating tumour cells in cancer patients: Challenges and
perspectives. Trends Mol Med. 16:398–406. 2010. View Article : Google Scholar : PubMed/NCBI
|
|
43
|
Pantel K, Alix-Panabières C and Riethdorf
S: Cancer micrometastases. Nat Rev Clin Oncol. 6:339–351. 2009.
View Article : Google Scholar : PubMed/NCBI
|
|
44
|
Macarthur KM, Kao GD, Chandrasekaran S,
Alonso-Basanta M, Chapman C, Lustig RA, Wileyto EP, Hahn SM and
Dorsey JF: Detection of brain tumor cells in the peripheral blood
by a telomerase promoter-based assay. Cancer Res. 74:2152–2159.
2014. View Article : Google Scholar : PubMed/NCBI
|
|
45
|
Gao F, Cui Y, Jiang H, Sui D, Wang Y,
Jiang Z, Zhao J and Lin S: Circulating tumor cell is a common
property of brain glioma and promotes the monitoring system.
Oncotarget. Aug 8–2016.(Epub ahead of print). doi:
10.18632/oncotarget.11114.
|
|
46
|
Schwarzenbach H, Hoon DS and Pantel K:
Cell-free nucleic acids as biomarkers in cancer patients. Nat Rev
Cancer. 11:426–437. 2011. View Article : Google Scholar : PubMed/NCBI
|
|
47
|
Lavon I, Refael M, Zelikovitch B, Shalom E
and Siegal T: Serum DNA can define tumor-specific genetic and
epigenetic markers in gliomas of various grades. Neuro Oncol.
12:173–180. 2010. View Article : Google Scholar : PubMed/NCBI
|
|
48
|
Boisselier B, Gállego Pérez-Larraya J,
Rossetto M, Labussière M, Ciccarino P, Marie Y, Delattre JY and
Sanson M: Detection of IDH1 mutation in the plasma of patients with
glioma. Neurology. 79:1693–1698. 2012. View Article : Google Scholar : PubMed/NCBI
|
|
49
|
Balańa C, Carrato C, Ramírez JL, Cardona
AF, Berdiel M, Sánchez JJ, Tarón M, Hostalot C, Musulen E, Ariza A,
et al: Tumour and serum MGMT promoter methylation and protein
expression in glioblastoma patients. Clin Transl Oncol. 13:677–685.
2011. View Article : Google Scholar : PubMed/NCBI
|
|
50
|
Wakabayashi T, Natsume A, Hatano H, Fujii
M, Shimato S, Ito M, Ohno M, Ito S, Ogura M and Yoshida J: p16
promoter methylation in the serum as a basis for the molecular
diagnosis of gliomas. Neurosurgery. 64:455–461; discussion 461–462.
2009. View Article : Google Scholar : PubMed/NCBI
|
|
51
|
Manterola L, Guruceaga E, Gállego
Pérez-Larraya J, González-Huarriz M, Jauregui P, Tejada S,
Diez-Valle R, Segura V, Samprón N, Barrena C, et al: A small
noncoding RNA signature found in exosomes of GBM patient serum as a
diagnostic tool. Neuro Oncol. 16:520–527. 2014. View Article : Google Scholar : PubMed/NCBI
|
|
52
|
Wu J, Li L and Jiang C: Identification and
evaluation of serum microRNA-29 family for glioma screening. Mol
Neurobiol. 52:1540–1546. 2015. View Article : Google Scholar : PubMed/NCBI
|
|
53
|
Kuo WP, Liu F, Trimarchi J, Punzo C,
Lombardi M, Sarang J, Whipple ME, Maysuria M, Serikawa K, Lee SY,
et al: A sequence-oriented comparison of gene expression
measurements across different hybridization-based technologies. Nat
Biotechnol. 24:832–840. 2006. View Article : Google Scholar : PubMed/NCBI
|
|
54
|
Bustin SA, Benes V, Garson JA, Hellemans
J, Huggett J, Kubista M, Mueller R, Nolan T, Pfaffl MW, Shipley GL,
et al: The MIQE guidelines: Minimum information for publication of
quantitative real-time PCR experiments. Clin Chem. 55:611–622.
2009. View Article : Google Scholar : PubMed/NCBI
|
|
55
|
Huggett JF, Foy CA, Benes V, Emslie K,
Garson JA, Haynes R, Hellemans J, Kubista M, Mueller RD, Nolan T,
et al: The digital MIQE guidelines: Minimum Information for
publication of Quantitative digital PCR experiments. Clin Chem.
59:892–902. 2013. View Article : Google Scholar : PubMed/NCBI
|
|
56
|
Sackett DL, Rosenberg WM, Gray JA, Haynes
RB and Richardson WS: Evidence based medicine: What it is and what
it isnt. 1996. Clin Orthop Relat Res. 455:3–5. 2007.
|
|
57
|
Wang Z, Neuburg D, Li C, Su L, Kim JY,
Chen JC and Christiani DC: Global gene expression profiling in
whole-blood samples from individuals exposed to metal fumes.
Environ Health Perspect. 113:233–241. 2005. View Article : Google Scholar : PubMed/NCBI
|
|
58
|
Lampe JW, Stepaniants SB, Mao M, Radich
JP, Dai H, Linsley PS, Friend SH and Potter JD: Signatures of
environmental exposures using peripheral leukocyte gene expression:
Tobacco smoke. Cancer Epidemiol Biomarkers Prev. 13:445–453.
2004.PubMed/NCBI
|