Introduction
The first four articles in this series concerned
intraperitoneal glucose tolerance tests (1), the time course of changes in food
intake, body weight, plasma glucose and insulin concentrations and
insulin resistance (2), the
secretory behaviour of isolated pancreatic islets (3) and the metabolism of D-glucose in
isolated pancreatic islets (4) in
fructose-fed rats. Comparisons were made between the results for
control female rats exposed from the 8th week after birth and for
the ensuing 8 weeks to a diet containing 64% (w/w) starch and 5%
(w/w) sunflower oil (Ssun rats) and female rats exposed over the
same period to a diet containing 64% D-fructose and 5% sunflower
oil (Fsun rats) or 3.4% sunflower oil mixed with 1.6% salmon oil
(Fsal rats) or safflower oil (Fsaf rats). The selection of these
experimental conditions was based on an extensive examination of
the relevant literature, as documented in a review study dealing
mainly with the influence of nutritional factors on the
fructose-induced metabolic syndrome (5). The present report extends these
observations to a first set of post-mortem investigations dealing
inter alia with: the percentage of glycated hemoglobin in
blood and liver glucokinase activity relating to carbohydrate
metabolism; plasma concentration and liver content of cholesterol,
triglycerides and phospholipids in respect to lipid metabolism; and
protein, albumin, urea and creatinine concentrations in plasma in
respect to nitrogen-rich compounds.
Materials and methods
The four groups of female Wistar rats used in the
present study were the same as those defined in the first report in
this series. At sacrifice, blood was sampled by cardiac puncture
following overnight fasting.
The methods used for the measurement of the plasma
concentration of albumin (2),
blood concentration of glycated hemoglobin (2), liver protein content (6) and hepatic glucokinase activity
(7) have been described
previously. The kits used for the measurement of the plasma
concentration of urea and creatinine (Biocon, Vöhl-Marienhagen,
Germany), calcium (Spinreact S.A., Girona, Spain), iron (Randox
Laboratories Ltd., Crumlin, UK), plasma and liver triglycerides and
phospholipids (Spinreact S.A.) plasma and liver cholesterol
(Biolabo, Maizy, France), plasma HDL-cholesterol (Biocon) were
obtained from the sources cited in parentheses.
The plasma albumin concentration (2) and percentage of glycated hemoglobin
(2) are listed in the present
report for purpose of comparison. All results are presented as the
mean value ± SEM (standard error of the mean) together with the
number of individual determinations (n). The statistical
significance of a difference between mean values was assessed using
the Student’s t-test.
Results
Plasma data
The mean plasma concentrations of albumin, urea,
creatinine, phospholipids, triglycerides and total cholesterol were
all higher (P<0.07 or less) in the Fsun rats than in the Ssun
rats (Table I), such a difference
being, in relative terms, most pronounced in the case of urea,
creatinine, phospholipids, triglycerides and total cholesterol. The
plasma concentrations of calcium, iron and HDL-cholesterol,
however, were lower in the Fsun rats than in the Ssun rats
(P<0.06 or less).
 | Table IPlasma data. |
Table I
Plasma data.
| Ssun (n=6) | Fsun (n=6) | Fsal (n=5) | Fsaf (n=6) |
|---|
| Albumin (g/l) | 39.2±0.23 | 42.00±0.24 | 40.26±0.24 | 41.67±0.15 |
| Urea (mM) | 2.29±0.22 | 3.04±0.09 | 2.74±0.09 | 2.84±0.09 |
| Creatinine
(mg/dl) | 1.25±0.13 | 1.88±0.25 | 1.52±0.18 | 1.75±0.22 |
| Calcium (mM) | 2.21±0.03 | 1.75±0.01 | 2.36±0.02 | 2.38±0.02 |
| Iron (μM) | 12.33±1.33 | 8.86±0.85 | 15.28±1.22 | 10.15±1.13 |
| Phospholipids
(mM) | 1.20±0.04 | 2.50±0.06 | 1.56±0.05 | 1.69±0.05 |
| Triglycerides
(mM) | 3.19±0.05 | 5.12±0.18 | 3.55±0.15 | 4.86±0.17 |
| Total cholesterol
(mM) | 3.22±0.04 | 4.15±0.03 | 3.35±0.24 | 3.87±0.14 |
| HDL-cholesterol
(mM) | 2.82±0.11 | 2.15±0.19 | 3.05±0.36 | 2.33±0.08 |
The six variables listed in Table I which yielded higher mean values
in the Fsun rats than in the Ssun rats displayed a comparable
pattern when the results recorded in the fructose-fed rats were
compared with those of the starch-fed animals. Thus, in the Fsun,
Fsal and Fsaf rats, the measurements averaged, respectively,
148.0±6.3 (n=36; P<0.001), 114.9±3.3 (n=30; P<0.001) and
130.6±4.0% (n=36; P<0.001) of those in the Ssun rats
(100.0±1.9%; n=36). In this respect, the mean results recorded in
the Fsal and Fsaf rats were significantly lower (P<0.025 or
less) than those in the Fsun rats. The values in the Fsal rats were
also significantly lower (P<0.005) than those in the Fsaf
rats.
Relative to the differences between the Fsun and
Ssun rats for these six variables (100.0±6.7%; n=36), those found
between the Fsal or Fsaf rats and Ssun rats averaged 33.6±7.0
(n=30; P<0.001) and 71.8±7.0% (n=36; P<0.005), respectively.
That is, the increments recorded in the Fsaf rats averaged, for the
same six variables, 272.7±34.2% (n=36; P<0.001) of the mean
corresponding increments in the Fsal rats (100.0±30.9%; n=30).
A comparable situation prevailed for the three
variables, plasma HDL-cholesterol, calcium and iron concentrations,
which had a lower value in the Fsun rats than in the Ssun rats.
Indeed, relative to the mean value recorded in the latter rats
(100.0±3.6%; n=18), those determined in the Fsun, Fsal and Fsaf
rats averaged 74.8±3.1 (n=18; P<0.001), 113.0±5.4 (n=15;
P<0.05) and 90.9±4.2% (n=18; P>0.11), respectively. The mean
results recorded in the Fsal and Fsaf rats were thus significantly
higher (P<0.005 or less) than those in the Fsun rats. Moreover,
the values collected in the Fsal rats were also significantly
higher (P<0.004) than those in the Fsaf rats. In the latter
rats, they were not significantly different (P>0.11) from those
in the Ssun rats, whilst those in the Fsal rats were higher
(P<0.05 or less) than those in the Ssun rats.
Blood data
The concentration of hemoglobin in the blood did not
differ significantly among the four groups of rats, with an overall
mean value of 503±36 mg/ml (n=23). The percentage of glycated
hemoglobin, however, was significantly higher (P<0.001) in the
fructose-fed than in the starch-fed rats (Table II). In the former rats, it again
displayed a Fsun >Fsaf >Fsal hierarchy (P<0.001).
| Table IIBlood data. |
Table II
Blood data.
| Ssun (n=6) | Fsun (n=6) | Fsal (n=5) | Fsaf (n=6) |
|---|
| Hemoglobin
(mg/ml) | 474±74 | 532±82 | 483±68 | 522±77 |
| Glycated hemoglobin
(%) | 5.81±0.02 | 13.67±0.13 | 8.76±0.02 | 12.11±0.02 |
Liver data
The protein content of liver homogenates, expressed
relative to wet weight, did not differ significantly among the four
groups of rats (Table III), with
an overall mean value of 204±7 μg/mg wet wt. (n=23). The data
concerning the protein content of the liver were confirmed in an
independent assay in which no significant difference (P>0.20 or
more) was found among the mean values recorded in the four groups
of rats. In the latter assay, the protein content of the heart or
kidney also failed to differ among the four groups of rats, the
data recorded in Fsun, Fsal and Fsal rats averaging, respectively,
107.3±5.8 (n=12), 106.7±5.4 (n=10) and 100.9±9.1% (n=10) of the
corresponding mean values in the Ssun rats (100.0±8.6%; n=10).
Within the same assay, no significant differences were detected
among the four groups of rats in terms of the protein content of
the parametrial or visceral adipose tissue. The absolute values
determined in adipose tissue were, however, one order of magnitude
lower than in the liver, representing in the parametrial and
visceral adipose tissue no more than 9.4±1.1 and 11.9±1.2% of the
mean value in liver samples (100.0±6.5%; n=23 in all three
cases).
| Table IIILiver data. |
Table III
Liver data.
| Ssun | Fsun | Fsal | Fsaf |
|---|
| Protein (μg/mg wet
wt.) | 209±8a | 204±17a | 192±18b | 210±14a |
| Glucokinase activity
(nmol/mg wet wt. per 30 min) | 6.05±0.27b | 6.37±0.21a | 8.77±0.86b | 6.78±0.24a |
| Cholesterol (μmol/g
wet wt.) | 32.50±0.66a | 44.41±0.36a | 35.89±0.37b | 38.72±0.22a |
| Triglycerides (μmol/g
wet wt.) | 23.39±0.34a | 36.85±0.33a | 28.56±0.48b | 34.44±0.51a |
| Phospholipids (μmol/g
wet wt.) | 18.62±0.48a | 32.48±0.25a | 22.72±0.33b | 28.35±0.31a |
As judged from triplicate measurements of liver
glucokinase activity conducted in each of two separate assays, with
a correlation coefficient between the latter two assays of +0.922
(n=22; P<0.001), the results recorded in the Fsun rats did not
differ significantly (P>0.2 or more) from those found in the
Ssun or Fsaf rats (Table III).
However, the values found in the Fsaf rats appeared higher
(P<0.06) than those recorded in the Ssun rats. Finally, in the
Fsal rats, the activity of glucokinase exceeded that found in the
Ssun (P<0.02), Fsun (P<0.02) and Fsaf rats (P<0.05).
The mean values for the liver content of
cholesterol, triglycerides and phospholipids in the four groups of
rats are listed in Table III.
These three variables displayed a comparable hierarchy in the four
groups of rats, the overall mean values in the Fsun, Fsaf and Fsal
rats averaging, respectively, 156.2±3.8 (n=18), 139.5±3.6 (n=18)
and 118.2±1.8% (n=15) of the mean corresponding values in the Ssun
rats (100.0±1.1%; n=18). The latter four mean values differed
significantly (P<0.004 or less) from one another.
Discussion
The results recorded in the present study are shown
in Fig. 1. It documents that, for
the majority of variables, specifically the percentage of glycated
hemoglobin (Fig. 1A), liver
cholesterol, triglyceride and phospholipid content (Fig. 1B) and plasma concentration of
albumin, urea, creatinine, phospholipids, triglycerides and total
cholesterol (Fig. 1C), the
measurements recorded in the Fsun rats were invariably higher than
those determined in the Ssun rats. In the fructose-fed rats, the
substitution of part of the sunflower oil by an equal amount of
either safflower oil or salmon oil minimized the relative magnitude
of such increases, with salmon oil having the greatest minimizing
effect. Conversely, the substitution of starch by D-fructose in the
diet containing sunflower oil decreased the plasma concentration of
calcium, iron and HDL-cholesterol (Fig. 1D). The effect of D-fructose was
again opposed by the substitution of some of the sunflower oil by
either safflower oil or salmon oil, the latter having the stronger
effect. Two variables, that is, the blood hemoglobin concentration
and liver protein content, were not significantly affected by the
dietary manipulations (Fig. 1E).
Finally, the activity of liver glucokinase was markedly higher in
the Fsal rats than in the other three groups of rats (Fig. 1F). Thus, in several respects, the
partial substitution of sunflower oil by either safflower oil or
salmon oil corrected, at least to some extent, the biochemical
perturbations found in the metabolic syndrome of the fructose-fed
rats (Fig. 1A-C) and, on occasion,
even increased the parameter under consideration above the level
found in the control Ssun rats (Fig.
1D and F).
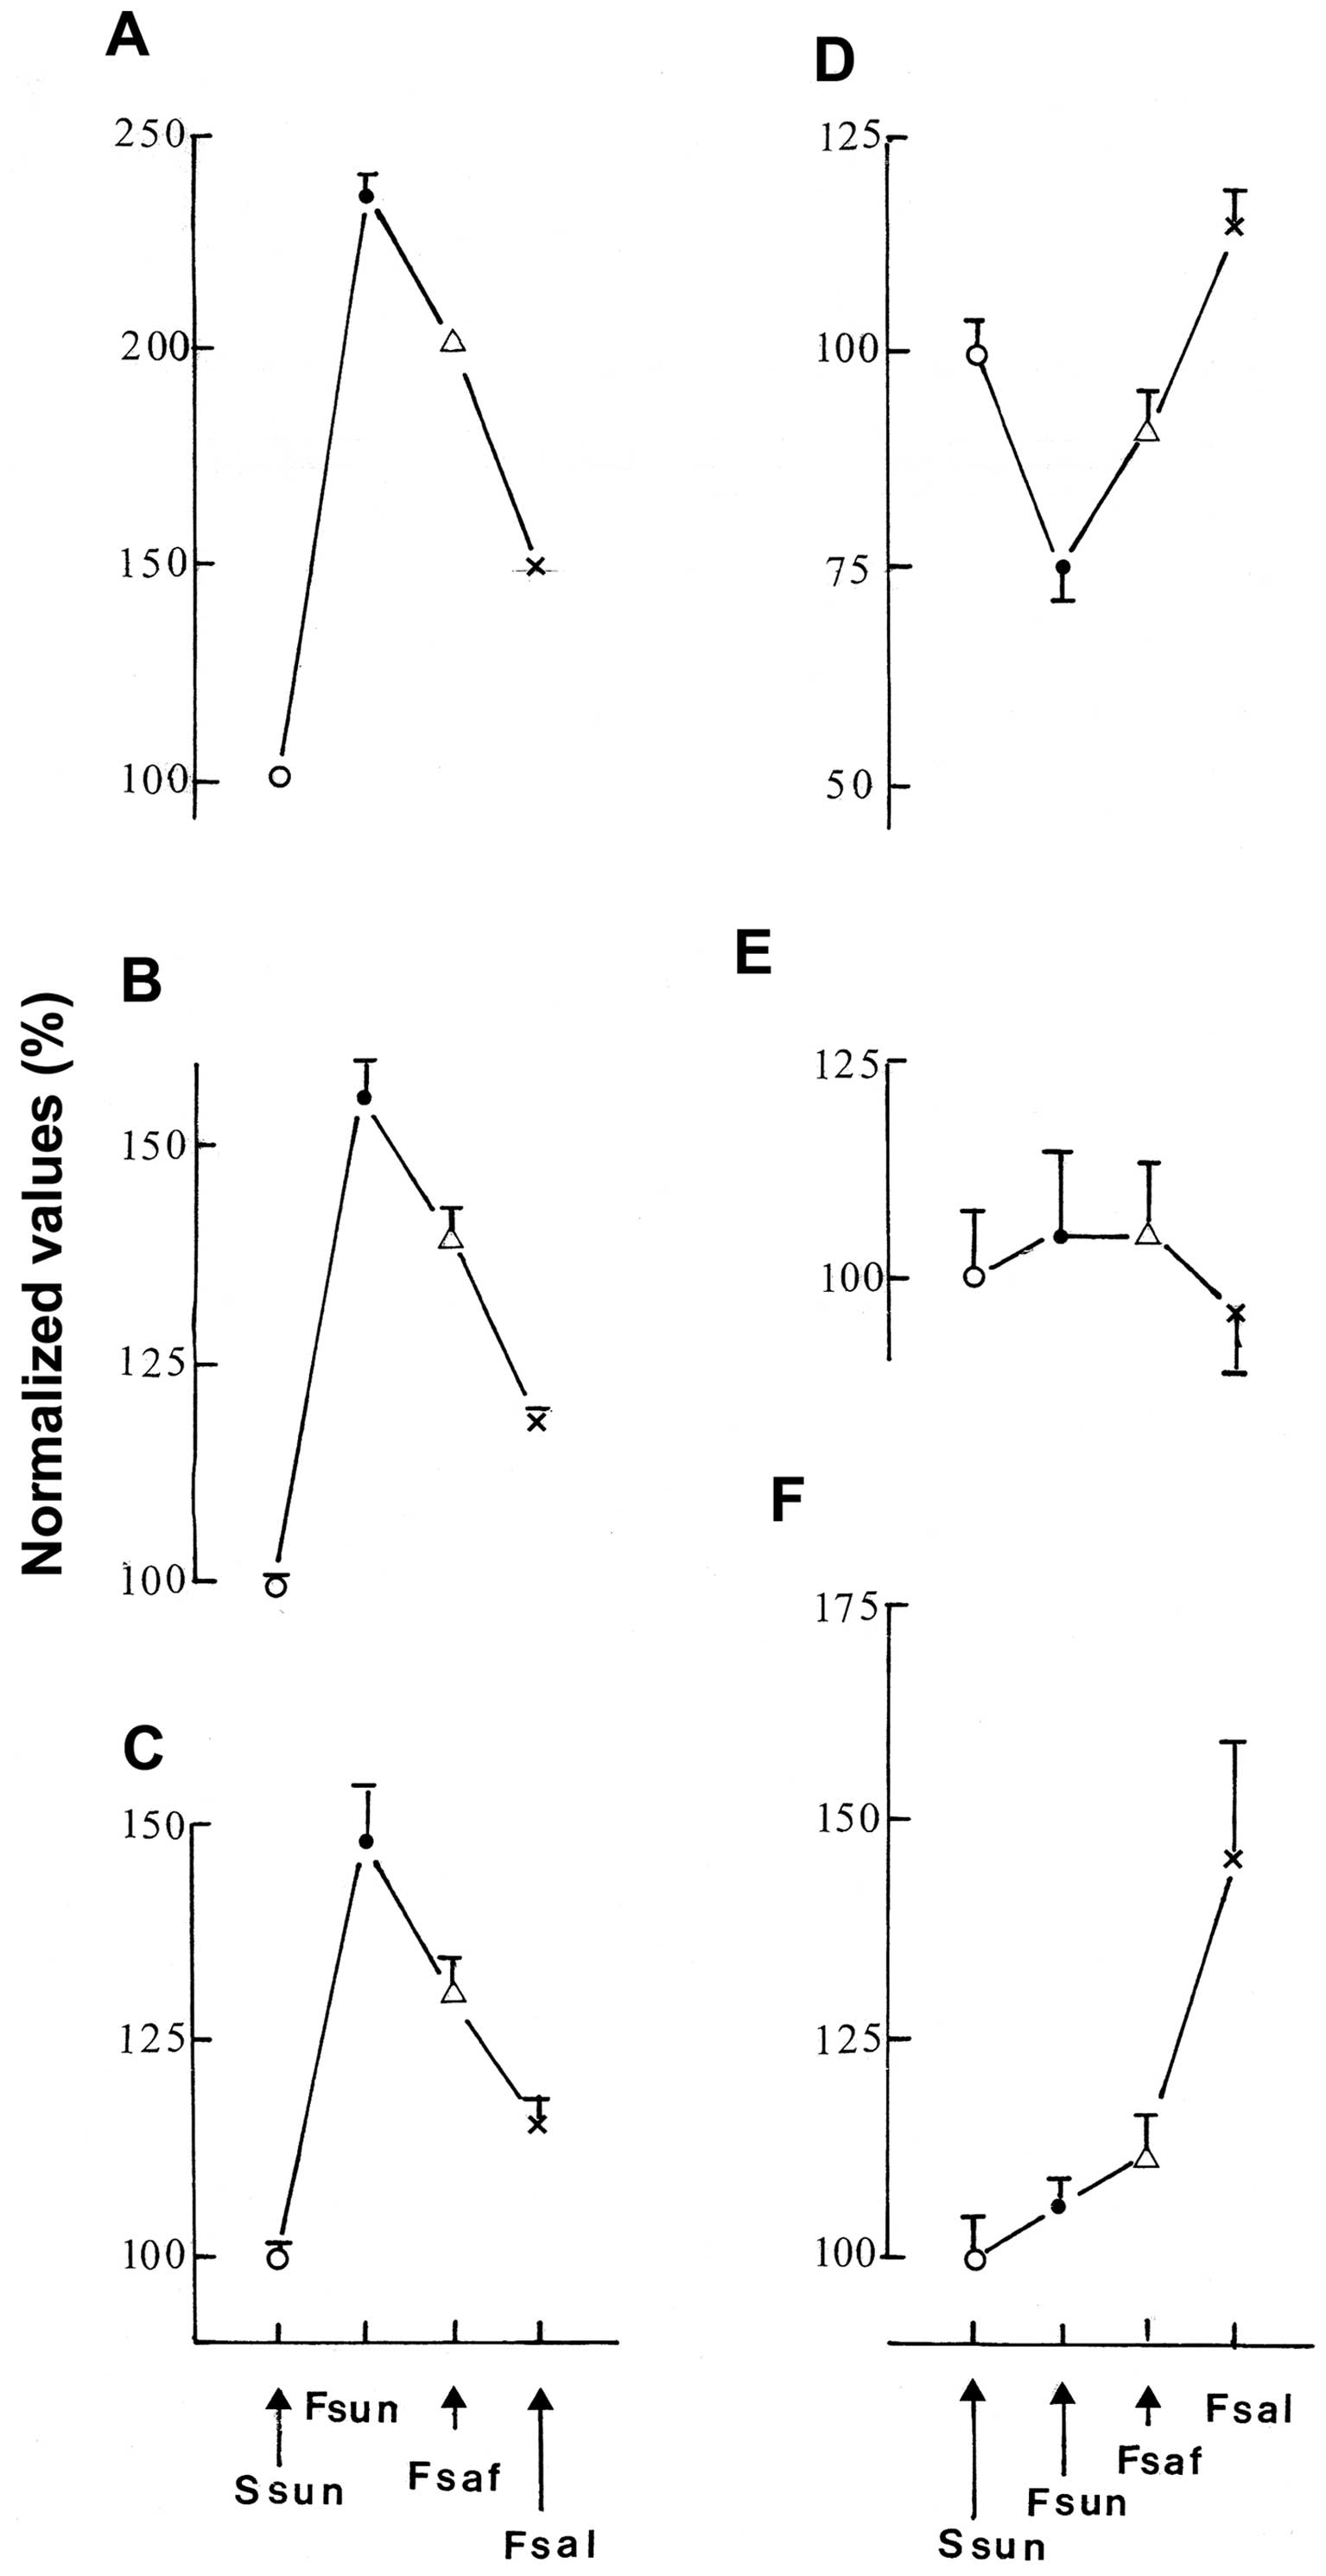 | Figure 1Metabolic parameters in Fsun (●), Fsaf
(△) and Fsal (x) rats. Mean values (± SEM) for (A) the percentage
of glycated hemoglobin, (B) liver cholesterol, triglycerides and
phospholipid content, (C) plasma concentration of albumin, urea,
creatinine, phospholipids, triglycerides and total cholesterol, (D)
plasma concentration of calcium, iron and HDL-cholesterol, (E)
blood hemoglobin concentration and liver protein content and (F)
liver glucokinase activity in Fsun, Fsaf and Fsal rats are
expressed relative to the mean corresponding values found in Ssun
rats (○). They refer to (A and F) 5–6 individual data, (E) 10–12
individual data, (B and D) 15–18 individual data and (C) 30–36
individual data. |
The determinants responsible for these diet-induced
changes in metabolic variables remain, to some extent, a matter of
speculation, as recently reviewed elsewhere (5). The following considerations should
not be ignored, however. In terms of carbohydrate metabolism and as
judged from the percentage of glycated hemoglobin, the present
findings are consistent with the well-known perturbation of glucose
homeostasis in fructose-fed rats, currently attributed to an
increase in hepatic glucose output and peripheral insulin
resistance (5). This supports the
view that the dietary supply of ω3 fatty acids to the Fsal rats
and, to a lesser extent, that of ω6 fatty acids, in this case
mainly C18:2ω6 to the Fsal rats (1) may oppose such an unfavorable effect
of the fructose-rich diet (5).
Incidentally, in the Fsal rats, the glycogen content of the liver
did not differ (98.5±7.5%; n=6) from that in the Ssun rats
(100.0±8.3%; n=6), whilst being decreased (P<0.007) to 71.8±4.9%
(n=11) of the same reference value in the other fructose-fed rats
(data not shown). The major novel information provided by the
present study in respect to carbohydrate metabolism relates to the
measurements of liver glucokinase activity. The results of such
measurements, as given in Table
III, document a higher activity of glucokinase in the liver of
the Fsal rats than in the other 3 groups of rats (P<0.05 or
less). The higher liver glucokinase activity in the Fsal rats, as
compared with either the Fsun or Fsaf rats, is reminiscent of the
higher glucokinase activity found in the pancreatic islet
homogenates of control rats, as compared with second generation
rats depleted in long-chain polyunsaturated ω3 fatty acids, a
difference tentatively ascribed to inhibition of the enzyme by
endogenous long-chain fatty acyl-coenzyme A in the ω3-depleted rats
(7). Indeed, in the present study,
the Fsal rats were the sole fructose-fed animals exposed to a diet
containing sizeable amounts of long-chain polyunsaturated ω3 fatty
acids (1), this coinciding with a
lower liver triglyceride content (P<0.001) in the Fsal rats than
in the Fsun or Fsaf rats. Furthermore, in the fructose-fed rats, a
significant negative correlation prevailed between the individual
values for liver glucokinase activity and liver triglyceride
content (r=−0.580; n=17; P<0.02).
In terms of lipid metabolism, the salient findings
comprised: the increased plasma concentration and liver content of
cholesterol, triglycerides and phospholipids, but decreased plasma
concentration of HDL-cholesterol in the Fsun rats, as compared with
the Ssun rats; and the partial or complete correction of these
perturbations in the Fsaf and Fsal rats, particularly in the
latter. The internal consistency of these findings is further
documented by the negative correlation found at the individual
level between the total cholesterol concentration and that of
HDL-cholesterol in plasma (r=−0.537; n=23; P<0.01). Likewise,
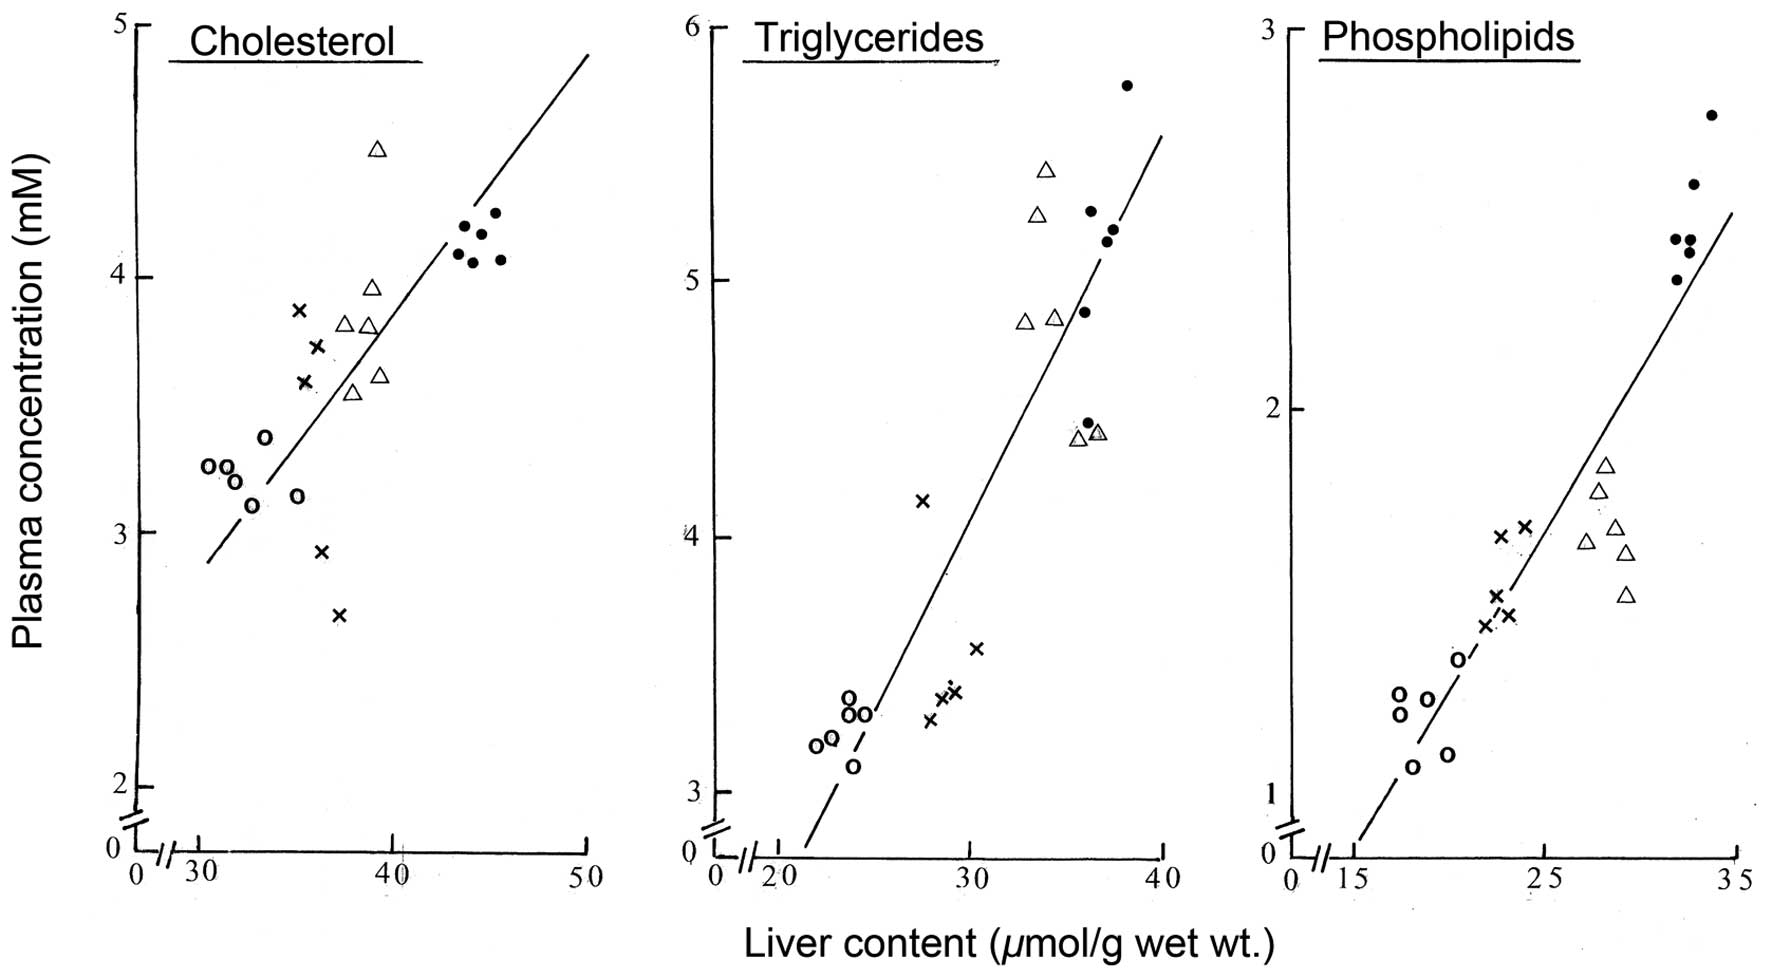
the likely relationship between liver and plasma lipids is
supported by the finding of close correlations between the
individual values for the liver content of cholesterol,
triglycerides and phospholipids and the plasma concentration of the
same lipids (Fig. 2). The
correlation coefficient in those three cases averaged 0.846±0.055
(n=3) with, in all cases, a probability well below 0.001 (n=23 in
all three cases). Notably, the individual negative xy products
represented no more than 1.6±0.8% (n=3) of the corresponding
positive xy products, no negative individual xy product being
observed between the liver content and plasma concentration of
triglycerides.
No clear difference in the protein content of the
liver, heart, kidney or adipose tissue was observed among the four
groups of rats. Nevertheless, the plasma albumin concentration was
somewhat higher (P<0.02 or less) in each group of fructose-fed
rats than in the control starch-fed rats (Table I). It was significantly lower,
however, in the Fsal rats than in the Fsun or Fsaf rats
(P<0.001). Likewise, the plasma protein concentration was
slightly higher (P<0.05) in the fructose-fed rats than in the
control starch-fed rats (data not shown). The correlation between
the individual values for plasma albumin and protein concentrations
was close to achieving statistical significance (r=+0.389; n=23;
P<0.07).
The urea and creatinine plasma concentrations were
increased in the Fsun rats, with a trend towards normalization in
the Fsaf and Fsal rats. Relative to the corresponding mean values
found in Ssun rats (100.0±5.5%; n=12), the measurements for the
Fsun rats averaged 141.6±10.1% (n=12; P<0.002) and decreased to
132.0±8.9% (n=12) in the Fsaf rats and 120.6±7.0% (n=10) in the
Fsal rats. The latter two mean values were significantly higher
(P<0.04 or less), however, than that determined in the Ssun
rats. These findings may indicate incipient nephropathy in the
fructose-fed rats.
Finally, the plasma concentration of calcium and
iron also underwent dual changes. Relative to the mean value in
Ssun rats (100.0±5.2%; n=12), that in the Fsun rats was decreased
(P<0.001) to 75.5±3.5% (n=12) and was distinctly different
(P<0.01 or less) from those in Fsaf (95.1±5.8%, n=12) and Fsal
rats (115.5±5.5%; n=10). The latter value was not significantly
higher (P<0.06) than that recorded in the control Ssun rats.
Changes in the plasma contribution of albumin are unlikely to act
as determinants of changes in the plasma concentration of calcium,
the correlation coefficient between these two variables (r=−0.390;
n=23; P<0.07) being negative. As an alternative hypothesis, it
may be speculated that the decrease in plasma calcium and iron
concentration indicates an impaired intestinal absorption of these
metals. To our knowledge, however, an enteropathy in animal models
of diabetes mellitus has only been well-documented in type 1
diabetic animals such as BB rats (8–10),
in which case it was proposed that the enteropathy plays a role in
the development of type 1 diabetes, rather than resulting from it
(11).
In summary, the present set of post-mortem data
collected in rats exposed for 8 weeks to a fructose-rich diet and
distinct oils confirms certain classical findings and reveals some
unexpected features of the metabolic syndrome prevailing in
fructose-fed rats, whilst duly documenting the favorable effect of
diets enriched with selected long-chain polyunsaturated ω3 and ω6
fatty acids on minimizing the fructose-induced perturbations in
several metabolic variables.
Acknowledgements
We are grateful to C. Demesmaeker for secretarial
help.
References
|
1
|
Mellouk Z, Hachimi Idrissi T, Louchami K,
Hupkens E, Malaisse WJ, Ait Yahia D and Sener A: The metabolic
syndrome of fructose-fed rats: effects of long-chain
polyunsaturated ω3 and ω6 fatty acids. I Intraperitoneal glucose
tolerance test. Int J Mol Med. 28:1087–1092. 2011.
|
|
2
|
Mellouk Z, Hachimi Idrissi T, Louchami K,
Hupkens E, Sener A, Ait Yahia D and Malaisse WJ: The metabolic
syndrome of fructose-fed rats: effects of long-chain
polyunsaturated ω3 and ω6 fatty acids. II Time course of changes in
food intake, body weight, plasma glucose and insulin concentrations
and insulin resistance. Int J Mol Med. 29:113–118. 2012.
|
|
3
|
Mellouk Z, Zhang Y, Bulur N, Louchami K,
Malaisse WJ, Ait Yahia D and Sener A: The metabolic syndrome of
fructose-fed rats: effects of long-chain polyunsaturated ω3 and ω6
fatty acids. III Secretory behaviour of isolated pancreatic islets.
Int J Mol Med. 29:285–290. 2012.
|
|
4
|
Mellouk Z, Zhang Y, Bulur N, Louchami K,
Sener A, Ait Yahia D and Malaisse WJ: The metabolic syndrome of
fructose-fed rats: effects of long-chain polyunsaturated ω3 and ω6
fatty acids. IV D-glucose metabolism in isolated pancreatic islets.
Int J Mol Med. 29:291–293. 2012.
|
|
5
|
Boukortt FO, Madani Z, Mellouk Z, Louchami
K, Sener A and Ait Yahia D: Nutritional factors and
fructose-induced metabolic syndrome. Metab Funct Res Diab. 4:18–34.
2011.
|
|
6
|
Lowry OH and Passonneau JV: A Flexible
System of Enzymatic Analysis. Academic Press; New York: pp.
1741972
|
|
7
|
Zhang Y, Bulur N, Peltier S, Carpentier
YA, Malaisse WJ and Sener A: Long-chain fatty acyl-coenzyme
A-induced inhibition of glucokinase in islets from rats depleted in
long-chain polyunsaturated ω3 fatty acids. Cell Biochem Funct.
26:233–237. 2008.PubMed/NCBI
|
|
8
|
Courtois P, Sener A, Scott FW and Malaisse
WJ: Disaccharidase activity in the intestinal tract of
Wistar-Furth, BBc and BBdp rats. Br J Nutr. 91:201–209. 2004.
View Article : Google Scholar
|
|
9
|
Courtois P, Sener A, Scott FW and Malaisse
WJ: Peroxidase activity in the intestinal tract of Wistar-Furth,
BBc and BBdp rats. Diabetes Metab Res Rev. 20:305–314. 2004.
View Article : Google Scholar : PubMed/NCBI
|
|
10
|
Graham S, Courtois P, Malaisse WJ, Rozing
J, Scott FW and Mowat AM: Enteropathy precedes type 1 diabetes in
the BB rat. Gut. 53:1437–1444. 2004. View Article : Google Scholar : PubMed/NCBI
|
|
11
|
Malaisse WJ, Courtois P and Scott FW:
Insulin-dependent diabetes and gut dysfunction: the BB rat model.
Horm Metab Res. 36:585–594. 2004. View Article : Google Scholar : PubMed/NCBI
|