Introduction
In modern medicine, fatigue refers to the
compromised function or response of cells, tissues and organs due
to repeated loading and is usually characterized by functional
decline and systemic discomfort. The production of fatigue is
regarded as a combined response to multiple physiological and
chemical changes. Christensen et al(1) proposed that physical fatigue may be
defined as a state of disturbed homeostasis attributable to work
and to the work environment. Studies have demonstrated that
excessive energy consumption and generation of numerous metabolites
are present in the state of fatigue. Certain metabolites may cause
severe damage to the human body. These metabolites include lactic
acid, ammonia, oxygen free radicals, peroxidated lipids and
lipofuscin. These metabolites accumulate in the muscles resulting
in disturbed homeostasis, damage to muscle cells, reduced synthesis
of adenosine triphosphate, inhibition of membrane adenosine
triphosphatase activity, compromised membrane function and
reduction of sarcoplasmic reticulum calcium ion transport, which
finally causes skeletal muscle fatigue (2–6).
Fatigue is the most common symptom of sub-healthy subjects and is
also a manifestation of compromised skeletal muscle cell functions.
However, the pathogenesis of fatigue in sub-healthy subjects
remains unclear. Our previous study revealed that the serum from
sub-healthy subjects with fatigue was able to reduce the activity
of mitochondrial cytochrome C oxidase (COX) and mitochondrial
energy charge (EC) in human skeletal muscle cells (HSkMCs), which
led to an energy metabolism disorder and changes in cellular
ultrastructure (7). We speculated
that these changes may play a significant role in the pathogenesis
of fatigue in sub-healthy subjects. In addition, we also revealed
that the serum from sub-healthy subjects with fatigue is able to
affect the protein expression in HSkMCs (8). McCully et al identified that
the blood flow and oxygen consumption in skeletal muscles remained
unchanged in subjects with chronic fatigue but that the
Mg2+ level increased significantly, which suggested that
changes in certain substances in the blood may be attributed to the
pathogenesis of fatigue (9–11).
Numerous studies have revealed that sub-healthy subjects present
abnormal serum levels of specific cytokines, including tumor
necrosis factor α (TNF-α), interleukin (IL)-1, IL-4, IL-6, IL-10
and interferon, certain immunoglobulins, hormones, cortisol and
adrenocorticotropic hormone (12–16).
Our group has demonstrated the changes that occur in protein and
gene expression in the serum of sub-healthy subjects (17–19).
Cells, as the basic units of life, may be inevitably affected by
numerous environmental, physical and chemical factors, which may
lead to functional or organic changes. Thus, we speculate that
certain substances in the serum of sub-healthy subjects are
changed, resulting in the disorder of skeletal muscle cell
functions and leading to the occurrence of fatigue.
Genes serve as the functional unit in genetics and
carry genetic information in nucleic acids. They exhibit genomic
functions through the encoding of functional proteins and
consequently play a determinant role in life, with a direct or
indirect correlation with almost all diseases and health states.
Increasing numbers of studies have revealed that changes in gene
expression determine the occurrence and development of diseases in
humans. In recent years, microarray technology has provided an
effective tool for the large-scale analysis of gene expression. In
the present study, a microarray was employed to investigate the
effect of serum from sub-healthy subjects with fatigue on the gene
expression of HSkMCs in vitro. Through this experiment
differentially expressed genes were identified with an aim to
provide evidence for the pathogenesis of fatigue in sub-healthy
subjects.
Materials and methods
Main instrument and materials
A Leica inverted microscope (Wetzlar, Germany),
Sigma 3K30 centrifuge (Sigma, St. Louis, MO, USA), incubator (Sun
Co., Ltd., Japan), clean bench (Sunshine Experimental Instrument
Co., Ltd., Shanghai, China), Gen III Microarray Spotter (Amersham
Pharmacia Biotech Ltd., Foster City, CA, USA), Gen III Microarray
Scanner (Amersham Pharmacia Biotech, Ltd.), Shel Lab general
purpose incubator (Shel Lab, Ltd.), Bio-Rad Mini-Sub GT System
(Bio-Rad Ltd., Hercules, CA, USA), DU 520 UV/Vis spectrophotometer
(Beckman Coulter Ltd., Miami, FL, USA), Vilber Gel documentation
system (Vilber, Ltd.), UV Crosslinker (Vilber Lourmat, France) and
MIDAS (Chipscreen Biosciences, Ltd.) were used in the present
study. A Qiagen RNeasy mini kit (Qiagen, Inc., Hilden, Germany),
Qiagen PCR Purification kit (Qiagen, Inc.), CyScribe cDNA Labeling
kit (Amersham Pharmacia Biotech, Ltd.), TRIzol reagent (Invitrogen,
Carlsbad, CA, USA), DEPC (Amersham Pharmacia Biotech, Ltd.),
DMEM/F12, fetal bovine serum (FBS; HyClone, Logan, UT, USA), 0.25%
trypsin, serum from sub-healthy subjects with fatigue and normal
serum (our lab) were also used in the present study. Human skeletal
muscle cells (HSkMCs) were purchased from ScienCell (Carlsbad, CA,
USA). The study was approved by the ethics committee of Nanfang
Hospital, Southern Medical University.
Preparation of serum from fatigued
sub-healthy and healthy subjects
The diagnosis of fatigue in sub-healthy subjects was
based on fatigue as the main manifestation lasting for >3
months, but not meeting the criteria for the clinical and
sub-clinical diagnosis of diseases. A total of 10 sub-healthy
subjects with fatigue aged 25–40 years old were recruited and
informed consent was obtained prior to the study. Serum was
prepared according to the following procedures: i) Serum from
sub-healthy subjects with fatigue; non-anti-coagulated fasting
venous blood (20 ml) was collected from the cubital vein at 10:00
a.m. and kept at room temperature for 1 h followed by
centrifugation at 3,000 rpm for 10 min. The supernatant was
collected under aseptic conditions and then heated in a water bath
at 65°C for 30 min during which gentle agitation was performed,
aiming to inactivate the serum. Aliquots of serum were prepared
after filtration with a disposable aseptic filter (Millipore,
Billerica, MA, USA) and stored at −20°C; ii) serum from healthy
subjects; ten sub-healthy subjects with fatigue which resolved
after treatment were recruited at least 1 week after treatment
discontinuation. Fasting venous blood (20 ml) was collected from
the cubital vein at 10:00 a.m. and the blood was processed as
described above.
Cell culture and grouping
The HSkMCs were thawed and maintained in a
75-cm2 flask. When the cell confluence reached >80%,
cells were divided into four 75-cm2 flasks and were
randomly assigned into the healthy (n=2) and the sub-healthy groups
(n=2). Cells in the healthy and sub-healthy groups were maintained
in DMEM/F12 containing 30% healthy serum and 30% sub-healthy serum,
respectively, for 72 h. The cells were then collected and washed in
PBS and the total RNA was extracted.
Design and preparation of the human
genome microarray
The human genome microarray was purchased from
Shenzhen Weixin Biotech Co., Ltd (Shenzhen, China). The microarray
was generated by directly adding the cDNA template and included
8,064 genes, the majority of which were from IMAGE human cDNA
library (Invitrogen). There were 7,488 cloned fragments including
7,458 expressed gene fragments (>500 bases in length) and 30
blank vector fragments. The reference standard gene samples were
purchased from Amersham Pharmacia Biotech Ltd., and included 120
external and 132 internal reference standard samples and 132
negative and positive control genes. Other gene fragments were
cloned and purified with RT-PCR and added to the samples in the
microarray by Shenzhen Weixin Biotech Ltd. The cDNA samples were
dissolved in spotting buffer (Amersham Pharmacia Biotech Ltd.)
followed by automatic spotting with an Array Spotter (Amersham
Pharmacia Biotech Ltd.). Subsequently, the cDNA was adhered to the
plate by ultraviolet cross-linking and then the microarray was
stored in a dry environment.
Extraction, identification and
purification of total RNA
Total RNA was extracted from cells in each group
with TRIzol followed by purification of the mRNA. The purity and
content of the mRNA were determined following electrophoresis of a
fraction of RNA.
Hybridization of microarray
Labeling and purification of the probes and
hybridization and washing of the microarray were performed by
Shenzhen Weixin Biotech Co., Ltd.
Detection and data processing
The microarray was scanned and the acquired images
were transformed into digital signals representing fluorescence
intensity. This was followed by data analysis and processing.
Results
Quality and purity of RNA from
HSkMCs
The total RNA from the 2 groups presented as three
bands at 28S, 18S and 5S. The ratio of 28S to 18S was approximately
2:1 demonstrating favorable integrity. As shown in Table I, the quality, concentration and
content of total RNA met the requirements for further
experiments.
 | Table IA260, A280, A260A:280 ratio, RNA
concentration and RNA content in two groups. |
Table I
A260, A280, A260A:280 ratio, RNA
concentration and RNA content in two groups.
| No. | Group | A260 | A280 | A260:A280 ratio | RNA concentration
(μg/μl) | RNA content (μg) |
|---|
| 1 | Healthy | 0.675 | 0.341 | 1.98 | 2.70 | 54.00 |
| 2 | Sub-healthy | 0.822 | 0.415 | 1.98 | 3.29 | 65.80 |
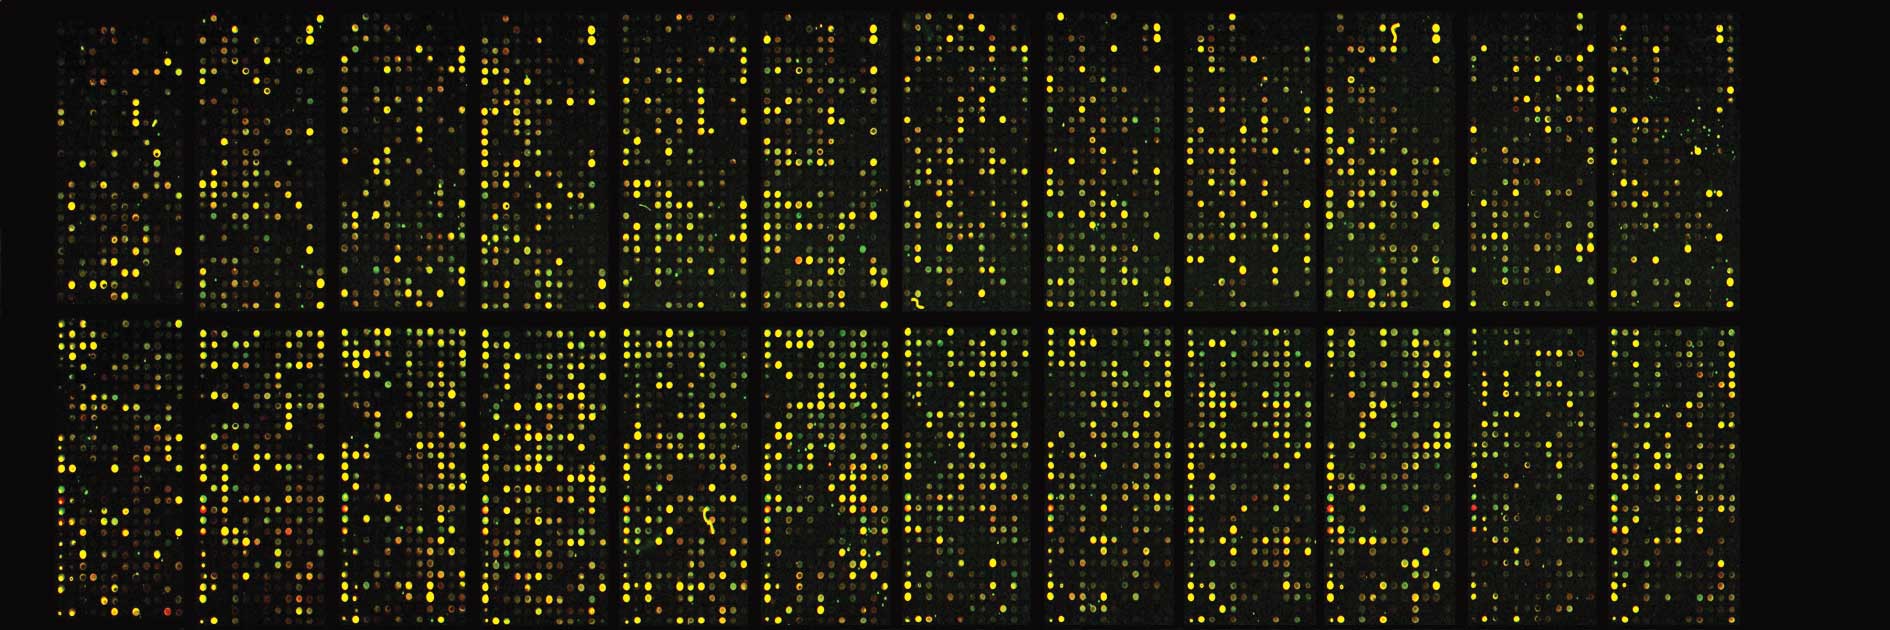
Gene expression profile analysis
The gene expression profile is exhibited in Fig. 1 and met the requirements for
further analysis. The signal density was high, the background was
even and no clear defects were observed.
Analysis of microarray quality
The correlation coefficient (R2) of the
hybridization signals between the two groups was ≥0.85, which
suggested that there was no significant difference in the
biological properties between the samples. The coefficient of
variation was low for the internal and external reference standard
genes, and the positive and negative control genes had favorable
reproducibility indicating the excellent quality of the microarray.
This and subsequent processing of the samples did not result in
artificial bias and the results were reliable.
Analysis of data and biological
information
Screening of data
When the signal intensity of a spot was higher than
the sum of the mean signal intensity of the negative controls and 3
times its standard deviation, this spot was regarded as an
applicable spot. The determination of a significant difference in
gene expression was based on step screening. When the fluorescence
signals met the above criteria in two channels, the above criteria
were directly applied (ratio >2 or <0.5); when the
fluorescence signals met the above criteria in only one channel
(CY3 OR CY5), the criteria for statistical significance were
defined as ratio >3 or <0.3.
Changes in gene expression
In the two channels of microarray 2000067473, there
were 2,979 applicable genes. Significant differences in gene
expression were identified in 71 genes, including 53 that revealed
upregulation and 18 with downregulation in the sub-healthy group. A
total of 567 applicable genes were identified in only one channel
with a significant difference in the gene expression identified in
15 genes, including 7 that revealed upregulation and 8 with
downregulation in the sub-healthy group (Table II).
| Table IIDifferentially expressed genes between
healthy subjects and sub-healthy subjects (microarray no.
2000067473). |
Table II
Differentially expressed genes between
healthy subjects and sub-healthy subjects (microarray no.
2000067473).
| Gene | Gene tag | Cy3/Cy5 ratio |
|---|
| CD36 antigen
(collagen type I receptor, thrombospondin receptor) | CD36 | 0.02 |
| Nuclear factor of
kappa light polypeptide gene enhancer in B-cells inhibitor, β | NFKBIB | 3.95 |
| Ring finger protein
24 | RNF24 | 0.03 |
| Heat shock
transcription factor 2 binding protein | HSF2BP | 3.88 |
| Proteasome (prosome,
macropain) 26S subunit, ATPase, 3 | PSMC3 | 2.95 |
| Homeo box B3 | HOXB3 | 6.26 |
| SCAN
domain-containing 1 | SCAND1 | 6.97 |
| Neurogenic
differentiation 2 | NEUROD2 | 0.33 |
| Zinc finger protein 7
(KOX 4, clone HF.16) | ZNF7 | 4.78 |
| Inhibitor of DNA
binding 1, dominant negative helix-loop-helix protein | ID1 | 2.57 |
| Mitogen-activated
protein kinase 6 | MAPK6 | 3.71 |
| Claudin 9 | CLDN9 | 27.57 |
| Human T-cell receptor
active α-chain mRNA from JM cell line, complete cds | TRA | 4.97 |
| HLA-G
histocompatibility antigen, class I, G | HLA-G | 3.12 |
| Insulin-like growth
factor binding protein 3 | IGFBP3 | 3.23 |
| Cytokine
receptor-like factor 1 | CRLF1 | 4.70 |
| Pim-1 oncogene | PIM1 | 6.06 |
| Transforming, acidic
coiled-coil containing protein 1 | TACC1 | 0.31 |
| Paraoxonase 1 | PON1 | 9.02 |
| Heat shock 27 kDa
protein 1 | HSPB1 | 2.01 |
| Calcium channel,
voltage-dependent, β 3 subunit | CACNB3 | 8.36 |
| Chloride
intracellular channel 1 | CLIC1 | 3.28 |
| Solute carrier family
7 (cationic amino acid transporter, y+ system), member 7 | SLC7A7 | 3.56 |
| Hyperpolarization
activated cyclic nucleotide-gated potassium channel 2 | HCN2 | 3.80 |
| Solute carrier
family 29 (nucleoside transporters), member 2 | SLC29A2 | 7.64 |
| Solute carrier
family 23 (nucleobase transporters), member 2 | SLC23A2 | 4.97 |
| Elastin microfibril
interface located protein | EMILIN | 4.89 |
| Endoplasmic
reticulum glycoprotein | GP36B | 2.31 |
| A kinase (PRKA)
anchor protein 4 | AKAP4 | 21.49 |
| Lipoprotein
lipase | LPL | 13.89 |
| Uridine
phosphorylase | UP | 0.34 |
| Aldolase C,
fructose-bisphosphate | ALDOC | 2.85 |
| Phosphoglycerate
kinase 1 | PGK1 | 2.44 |
| Aspartoacylase
(aminoacylase 2, Canavan disease) | ASPA | 0.37 |
| Succinate-CoA
ligase, GDP-forming, β subunit | SUCLG2 | 0.28 |
| Hydroxysteroid
(17-β) dehydrogenase 2 | HSD17B2 | 5.67 |
| Peripheral myelin
protein 2 | PMP2 | 0.32 |
| Cytochrome P450,
subfamily VIIB (oxysterol 7 α-hydroxylase), polypeptide 1 | CYP7B1 | 6.17 |
| Alcohol
dehydrogenase 3 (class I), γ polypeptide | ADH3 | 0.11 |
| Lysozyme
homolog | LOC57151 | 3.88 |
| Enolase 3 (β,
muscle) | ENO3 | 3.33 |
| Phosphatidylserine
decarboxylase | PISD | 3.30 |
| Phosphoglycerate
dehydrogenase | PHGDH | 2.10 |
|
Cholinephosphotransferase 1 | LOC56994 | 10.78 |
| Glycogenin | GYG | 0.45 |
|
Ubiquitin-conjugating enzyme E2E 1
(homologous to yeast UBC4/5) | UBE2E1 | 0.06 |
| Diptheria toxin
resistance protein required for diphthamide biosynthesis
(Saccharomyces)-like 2 | DPH2L2 | 4.44 |
| Tubulin-specific
chaperone c | TBCC | 0.05 |
| Protein
geranylgeranyltransferase type I, β subunit | PGGT1B | 3.49 |
| Eukaryotic
translation elongation factor 1 δ (guanine nucleotide exchange
protein) | EEF1D | 2.52 |
| Caspase 5,
apoptosis-related cysteine protease | CASP5 | 0.28 |
| BCL2/adenovirus E1B
19 kDa-interacting protein 1 | BNIP1 | 3.48 |
| Etoposide-induced
mRNA | PIG8 | 124.99 |
| Programmed cell
death 8 (apoptosis-inducing factor) | PDCD8 | 2.91 |
| 2′-5′
oligoadenylate synthetase 2 | OAS2 | 3.96 |
| Tumor necrosis
factor (ligand) superfamily, member 11 | TNFSF11 | 19.54 |
| Neuromedin B
receptor | NMBR | 3.00 |
| Integrin, β-like 1
(with EGF-like repeat domains) | ITGBL1 | 3.01 |
| Inhibin, β A
(activin A, activin AB α polypeptide) | INHBA | 4.13 |
| Insulin-like growth
factor 2 (somatomedin A) | IGF2 | 0.39 |
| FYN oncogene
related to SRC, FGR, YES | FYN | 0.32 |
| Tyrosine
3-monooxygenase/tryptophan 5-monooxygenase activation protein, eta
polypeptide | YWHAH | 2.63 |
| TRAF family
member-associated NFKB activator | TANK | 0.10 |
| Regulator of
G-protein signaling 10 | RGS10 | 0.06 |
| CDC14 (cell
division cycle 14, S. cerevisiae) homolog B | CDC14B | 0.06 |
| RAB26, member RAS
oncogene family | RAB26 | 0.04 |
| ADP-ribosylation
factor 1 | ARF1 | 2.40 |
| Triple functional
domain (PTPRF interacting) | TRIO | 3.45 |
| COP9 homolog | COP9 | 0.19 |
| Dipeptidylpeptidase
VI | DPP6 | 3.66 |
| Protein tyrosine
phosphatase, receptor type, N | PTPRN | 0.37 |
| Troponin C,
slow | TNNC1 | 6.81 |
| Profilin 2 | PFN2 | 0.02 |
| Actin, γ 2, smooth
muscle, enteric | ACTG2 | 2.29 |
| Tropomyosin 2
(β) | TPM2 | 2.74 |
| FERM, RhoGEF
(ARHGEF) and pleckstrin domain protein 1 (chondrocyte-derived) | FARP1 | 0.05 |
| Periplakin | PPL | 0.30 |
| Myosin-binding
protein C, slow-type | MYBPC1 | 3.06 |
| Hypothetical
protein FLJ11184 | FLJ11184 | 0.05 |
| Putative gene
product | 13CDNA73 | 0.39 |
| Type I
transmembrane protein Fn14 | FN14 | 2.35 |
| Tumor necrosis
factor α-inducible cellular protein containing leucine zipper
domains; Huntingtin-interacting protein L; transcription factor
IIIA-interacting protein | FIP2 | 3.16 |
| Soc-2 (suppressor
of clear, C. elegans) homolog | SHOC2 | 0.27 |
| JM27 protein | JM27 | 9.20 |
| Replication factor
C (activator 1) 5 (36.5 kDa) | RFC5 | 14.97 |
| Origin recognition
complex, subunit 5 (yeast homolog)-like | ORC5L | 0.25 |
Classification of genes with
differential expression
Primary data analysis revealed that the genes
differentially expressed between healthy subjects and sub-healthy
subjects were mainly associated with skeletal muscle development,
energy metabolism (transport, phosphorylation and hydrolysis), cell
proliferation and differentiation, oxidative stress, cell apoptosis
and signal transduction. Thus, the damage of skeletal muscle cells
by serum from sub-healthy subjects with fatigue may be associated
with the genes involved in skeletal muscle development, energy
metabolism (transport, phosphorylation and hydrolysis) and cell
proliferation and differentiation.
Discussion
Gene expression refers to how the genetic
information in genes is transformed into RNA via transcription and
into proteins via translation. In organisms, specific genes are
switched on or switched off using their own regulatory mechanisms.
The final result of gene expression is the harmonious and integral
activity of life. In humans, each cell possesses 2–4×10⁴
functional genes, the expression of which determines the functional
state. Thus, results from the analysis of information in RNA
involve not only the gene potentials in organisms, but the dynamic
changes in their functional state. In modern medicine, it has been
accepted that gene expression is regulated by genetic and
environmental factors. These genetic factors are also known as gene
regulatory sequences and include promoter, enhancer and splice
junction sites. Even the slightest changes in these factors may
significantly affect gene expression. In addition, gene expression
is also affected by certain environmental factors, including
temperature, light, mood, other factors causing changes in
endogenous hormones or other substances with involvement in signal
transduction. Studies have demonstrated the special changes that
occur in mRNA following heat shock, pharmacotherapy, metabolism and
disease (20–22). Chen et al revealed that the
expression of more than 40 genes was markedly changed in
hepatocytes undergoing hypoxia, and that these genes were involved
in metabolism, signal transduction and defense (23). Shi et al revealed that the
expression of more than 180 genes was markedly changed in the
skeletal muscle cells of mice undergoing exhaustive exercise and
that these genes were involved in ion transport, energy metabolism,
transcription and translation, the cell cycle, cell regulatory
proteins, skeletal muscle development, signal transduction and
phosphorylation of proteins and amino acids (24).
Whistler et al identified that the abnormal
expression of 839 genes in peripheral blood mononuclear cells
(PBMCs) was correlated with fatigue in subjects with chronic
fatigue of unknown cause, and that these genes were involved in
oxidative phosphorylation, gluconeogenesis, lipid metabolism and
signal transduction (25). Vernon
et al also identified 8 differentially expressed genes in
PBMCs in subjects with chronic fatigue syndrome which were mainly
involved in immune function and included CMRF35 antigen, IL-8 and
HD protein (26). Kaushik et
al identified 35 differentially expressed genes in PBMCs in
subjects with chronic fatigue syndrome, of which 15 were revealed
to be upregulated (ABCD4, PRKCL1, MRPL23, CD2BP2, GSN, NTE, POLR2G,
PEX16, EIF2B4, EIF4G1, ANAPC11, PDCD2, KHSRP, BRMS1 and GABARAPL1)
and one downregulated (IL-10RA) demonstrated by RT-PCR (27). Smith et al applied genomics
in the investigation of gene expression profiles and single
nucleotide polymorphisms (SNPs) in the PBMCs of subjects with
chronic fatigue syndrome. Their results revealed 65 SNPs and 165
differentially expressed genes which were associated with chronic
fatigue syndrome (28). These
findings confirm that the abnormal expression of specific genes is
closely associated with the occurrence and development of
fatigue.
In modern medicine, disorders of the
nerve-secretion-immune network may be the major cause of occurrence
and development of sub-health. Studies have demonstrated the
presence of abnormal metabolites in the blood of sub-healthy
subjects, which may cause damage to homeostasis thus affecting
cellular physiological functions (7,8). Our
previous study revealed that the serum from sub-healthy subjects
with fatigue are able to affect the structure and function of
skeletal cells in vitro. In the present study, our findings
revealed 86 differentially expressed genes in HSkMCs from
sub-healthy subjects with fatigue undergoing treatment with 30%
serum for 72 h. Of these genes, 60 were revealed to be upregulated
and 26 downregulated. These genes were predominantly involved in
cell growth and development (MFGE8, HLA-F, IGFBP6, IGFBP3, C3,
MAPK6, PIG11, CNN2, MAP4, CDC20, TFCP2, DAG1, ID1),
membrane-related ion channels (CLIC1, KCNJ15, CAANB3, HCN2, SLC23A,
SLC7A7), energy metabolism (TPI1, LPL, PTGS1, LDHA, PGK1, HSD17B2,
ADH3, COX8, ALDOC), stress (HSPB1, HSF2BP), cell signal
transduction (GAS6, IGF2) and apoptosis (SIVA, PDCD8) and the
majority were upregulated. Abnormal expression of these genes may
cause aberrant cell development and changes in ion channels in the
cell membranes. This may affect ion exchange and lead to an
increase of intracellular Ca2+ and an abnormal membrane
potential, causing an energy metabolism disorder, damage to
cellular structures and functions and impairment of cell
viability.
Heat shock proteins (HSPs) are a group of highly
conserved proteins possessing significant physiological functions.
Physiological, pathological and environmental factors may induce
the production of HSPs which thus are also known as stress
proteins. These physiological functions protect cells against
damage induced by various stimuli and have also been revealed to be
involved in the regulation of cell proliferation, differentiation
and apoptosis (29). In addition,
HSPs have been demonstrated to play significant roles in the
maintenance of homeostasis, defense against oxidative stress,
aiding protein synthesis and in the repair of misfolded proteins.
Stress is the basic cause of increased synthesis of HSPs in cells
(30–35). Sun et al identified that
HSP-27 expression was increased in the serum of sub-healthy
subjects (19). In the present
study, our findings suggest that the serum from sub-healthy
subjects with fatigue was able to upregulate the HSP genes. This
may be attributed to the theory that certain metabolites (including
peroxidized lipids) in the blood of sub-healthy subjects with
fatigue may cause damage to human skeletal muscle cells, which may
lead to disorder of the cytoskeleton in these cells resulting in
activation of genes, including HSPB1 and HSF2BP, and the subsequent
increase of HSP expression. These changes are essential for the
enhancement of tolerance to stress and the maintenance of cell
homeostasis.
Energy depletion in skeletal muscle cells is one
cause of fatigue. Our previous study revealed that mitochondrial
membrane cytochrome C oxidase activity and the mitochondrial energy
load were reduced in in vitro human skeletal muscle cells
undergoing treatment with serum from sub-healthy subjects with
fatigue; this may cause a disorder of the energy metabolism in the
cells (7). Glucose and fat are the
main sources of energy. PISD, LOC56994, ALDOC, AKAP4, LPL, PHGDH
and DPP6 are the major genes regulating the metabolism of glucose
and fat. In the present study, the expression of these genes was
markedly increased in sub-healthy subjects with fatigue compared
with the healthy subjects. This may be attributed to the theory
that the serum from sub-healthy subjects with fatigue causes an
energy metabolism disorder in skeletal muscle cells. This may
induce the expression of genes associated with energy metabolism in
order to meet the requirement for energy which is essential for
cell homeostasis and cellular physiological functions.
Taking all these results together, we speculate that
the serum from sub-healthy subjects with fatigue may alter the
expression of certain genes in human skeletal muscle cells, which
provides evidence for the pathogenesis of fatigue at a cellular
level.
Acknowledgements
This study was supported by the Natural Science
Foundation of Guangdong Province (06105115) and the Program of Drug
Administration of Guangdong Province (3060009).
References
|
1
|
Christensen T, Bendix T and Kehlet H:
Fatigue and cardiorespiratory function following abdominal surgery.
Br J Surg. 69:417–9. 1982. View Article : Google Scholar : PubMed/NCBI
|
|
2
|
Greenberg MJ, Mealy TR, Jones M,
Szczesna-Cordary D and Moore JR: The direct molecular effects of
fatigue and myosin regulatory light chain phosphorylation on the
actomyosin contractile apparatus. Am J Physiol Regul Integr Comp
Physiol. 298:R989–R996. 2010. View Article : Google Scholar
|
|
3
|
Minshull C, Eston R, Rees D and Gleeson N:
Knee joint neuromuscular activation performance during muscle
damage and superimposed fatigue. J Sports Sci. 30:1015–1024. 2012.
View Article : Google Scholar : PubMed/NCBI
|
|
4
|
Alessio HM: Exercise-induced oxdative
stress. Med Sci Sports Exerc. 25:218–224. 1993. View Article : Google Scholar : PubMed/NCBI
|
|
5
|
Zhang Y, Wen L, Nie JL, et al: Study on
molecular mechanism of exercise-induced fatigue in mitochondrial
membrane III. Relationships between proton potential energy across
membrane and generation of free radicals during acute exercise.
Chin J Sports Med. 19:346–349. 2000.
|
|
6
|
Zhang YL and Chen JT: Effects of taurine
on free radical metabolism, membrane fluidity and calcium transfer
after chronic exercise in rats. Chin J Sports Med. 18:248–251.
1999.
|
|
7
|
Li BL, Zhao XS, Luo R, et al: Influence of
sub-health fatigue serum on the activity of cytochrome C oxidase
and energy charge of mitochondrial membrane of human skeletal
muscle cells. Zhongguo Zu Zhi Gong Cheng Yan Jiu Yu Lin Chuang Kang
Fu. 37:7258–7262. 2008.(In Chinese).
|
|
8
|
Li BL, Zhao XS, Luo R, et al: Influence of
sub-health fatigue serum on protein expression of human skeletal
muscle cells. Zhong guo Zu Zhi Gong Cheng Yan Jiu Yu Lin Chuang
Kang Fu. 11:2095–2100. 2009.(In Chinese).
|
|
9
|
McCully KK, Smith S, Rajaei S, Leigh JS Jr
and Natelson BH: Blood flow and muscle metabolism in chronic
fatigue syndrome. Clin Sci (Lond). 104:641–647. 2003. View Article : Google Scholar : PubMed/NCBI
|
|
10
|
McCully KK, Smith S, Rajaei S, Leigh JS Jr
and Natelson BH: Muscle metabolism with blood flow restriction in
chronic fatigue syndrome. J Appl Physiol. 96:871–878. 2004.
View Article : Google Scholar : PubMed/NCBI
|
|
11
|
McCully KK, Malucelli E and Iotti S:
Increase of free Mg2+ in the skeletal muscle of chronic
fatigue syndrome patients. Dyn Med. 5:12006. View Article : Google Scholar
|
|
12
|
Meeus M, Nijs J, McGregor N, et al:
Unravelling intracellular immune dysfunctions in chronic fatigue
syndrome: interactions between protein kinase R activity, RNase L
cleavage and elastase activity, and their clinical relevance. In
Vivo. 22:115–121. 2008.
|
|
13
|
Kerr JR, Petty R, Burke B, et al: Gene
expression subtypes in patients with chronic fatigue
syndrome/myalgic encephalomyelitis. J Infect Dis. 197:1171–1184.
2008. View
Article : Google Scholar : PubMed/NCBI
|
|
14
|
Maes M, Mihaylova I, Kubera M and Bosmans
E: Not in the mind but in the cell: increased production of
cyclo-oxygenase-2 and inducible NO synthase in chronic fatigue
syndrome. Neuro Endocrinol Lett. 28:463–469. 2007.PubMed/NCBI
|
|
15
|
Broderick G, Fuite J, Kreitz A, Vernon SD,
Klimas N and Fletcher MA: A formal analysis of cytokine networks in
chronic fatigue syndrome. Brain Behav Immun. 24:1209–1217. 2010.
View Article : Google Scholar : PubMed/NCBI
|
|
16
|
Myhill S, Booth NE and McLaren-Howard J:
Chronic fatigue syndrome and mitochondrial dysfunction. Int J Clin
Med. 2:1–16. 2009.
|
|
17
|
Zhao XS, Luo R, Zhang ZQ, et al: Research
on related genes of kidney yin deficiency syndrome. Zhonghua Xian
Dai Yi Xue Za Zhi. 17:285–286. 2007.(In Chinese).
|
|
18
|
Dai FG, Zhao XS, Luo R, et al:
Construction of DNA subtractive library of deficiency of kidney yin
at sub-health state for Chinese Han people. Zhongguo Lin Chuang
Kang Fu. 19:97–99. 2005.(In Chinese).
|
|
19
|
Sun XM, Li XY and Jin W: The initial study
on plasma proteomics of sub-health deficiency of kidney-YIN. J
Sichuan Trad Chin Med. 26:7–9. 2008.
|
|
20
|
White AT, Light AR, Hughen RW, Vanhaitsma
TA and Light KC: Differences in metabolite-detecting, adrenergic,
and immune gene expression after moderate exercise in patients with
chronic fatigue syndrome, patients with multiple sclerosis, and
healthy controls. Psychosom Med. 74:46–54. 2012. View Article : Google Scholar
|
|
21
|
Nguyen DV, Arpat AB, Wang N and Carroll
RJ: DNA microarray experiments: biological and technological
aspects. Biometrics. 58:701–717. 2002. View Article : Google Scholar : PubMed/NCBI
|
|
22
|
Xiang Z, Yang Y, Ma X and Ding W:
Microarray expression profiling: analysis and applications. Curr
Opin Drug Discov Devel. 6:384–395. 2003.PubMed/NCBI
|
|
23
|
Chen W, Wu ZY and Qiu JF: Gene expression
profile in hepatocytes of rats undergoing hypoxia pre-conditioning.
Zhonghua Wai Ke Za Zhi. 43:1405–1406. 2005.(In Chinese).
|
|
24
|
Shi XH, Sun L and Yang Z: Microarray
detection of gene expression profiles difference of skeletal muscle
between normal rats and those with single bout of exhaustive
exercise. Zhong Guo Zu Zhi Gong Cheng Yan Jiu Yu Lin Chuang Kang
Fu. 9:140–143. 2006.(In Chinese).
|
|
25
|
Whistler T, Taylor R, Craddock RC,
Broderick G, Klimas N and Unger ER: Gene expression correlates of
unexplained fatigue. Pharmacogenomics. 7:395–405. 2006. View Article : Google Scholar : PubMed/NCBI
|
|
26
|
Vernon SD, Unger ER, Dimulescu IM,
Rajeevan M and Reeves WC: Utility of the blood for gene expression
profiling and biomarker discovery in chronic fatigue syndrome. Dis
Markers. 18:193–199. 2002. View Article : Google Scholar : PubMed/NCBI
|
|
27
|
Kaushik N, Fear D, Richards SC, et al:
Gene expression in peripheral blood mononuclear cells from patients
with chronic fatigue syndrome. J Clin Pathol. 58:826–832. 2005.
View Article : Google Scholar : PubMed/NCBI
|
|
28
|
Smith AK, Fang H, Whistler T, Unger ER and
Rajeevan MS: Convergent genomic studies identify association of
GRIK2 and NPAS2 with chronic fatigue syndrome. Neuropsychobiology.
64:183–194. 2011. View Article : Google Scholar : PubMed/NCBI
|
|
29
|
Arya R, Mallik M and Lakhotia SC: Heat
shook genes-integrating cell survival and death. J Biosci.
32:595–610. 2007. View Article : Google Scholar : PubMed/NCBI
|
|
30
|
Arrigo AP: Small stress proteins:
chaperones that act as regulators of intracellular redox state and
programmed cell death. Biol Chem. 379:19–26. 1998.PubMed/NCBI
|
|
31
|
Nelson RJ, Ziegelhoffer T, Nicolet C,
Werner-Washburne M and Craig EA: The translation machinery and 70
kd heat shock protein cooperate in protein synthesis. Cell.
71:97–105. 1992. View Article : Google Scholar : PubMed/NCBI
|
|
32
|
Gething MJ and Sambrook J: Protein folding
in the cell. Nature. 355:33–45. 1992. View
Article : Google Scholar : PubMed/NCBI
|
|
33
|
Liu Y, Lormes W, Wang L, Reissnecker S and
Steinacker JM: Different skeletal muscle HSP70 responses to
high-intensity strength training and low-intensity endurance
training. Eur J Appl Physiol. 91:330–335. 2004. View Article : Google Scholar : PubMed/NCBI
|
|
34
|
Naito H, Powers SK, Demirel HA and Aoki J:
Exercise training increases heat shock protein in skeletal muscles
of old rats. Med Sci Sports Exerc. 33:729–734. 2001. View Article : Google Scholar : PubMed/NCBI
|
|
35
|
Gao QJ, Ma XD and Xie LR: Research
development of skeletal muscle cytoskeleton and small heat shock
proteins. Chin Sport Sci. 25:70–74. 2005.
|