Introduction
Esophageal cancer is the sixth most life-threatening
type of cancer worldwide (1).
Unlike the epidemiologic feature of esophageal cancer in the west,
in 2005, >90% of the cases of esophageal cancer are esophageal
squamous cell carcinoma (ESCC) in China and Japan (2). Despite advances in the diagnosis and
treatment of cancer, improvements in esophageal cancer have
progressed more slowly and the overall prognosis for patients with
ESCC has remained unchanged. Furthermore, variability in the
clinical course of patients with ESCC remains to be elucidated, and
conventional clinicopathological parameters fail to assist in this.
The identification of novel prognostic factors may enable rational
selection of the most appropriate therapeutic options for
individual patients. Transcriptional profiling using DNA microarray
analysis is proving to be a useful tool in cancer research. It has
provided novel treatment targets and prediction models for
prognosis and treatment response (3–5). An
improved understanding of the genetic and molecular mechanisms
underlying the disease is key to enabling the early diagnosis,
appropriate treatment and improved prognosis of patients with
ESCC.
Micro (mi)RNAs are a class of small, non-coding
RNAs, which are 20–24 nucleotides in length and function as
regulators of gene expression. Each miRNA is considered to be
involved in the post-transcriptional regulation of hundreds of
genes, and the translational inhibition of a given gene may require
binding of more than one miRNA (6). It is estimated that one third of the
genes in the human genome are regulated by miRNAs (7) and, to date, >1,800 miRNA genes
have been identified (miRBase release 20.0; http://www.mirbase.org/) (8), including several that are involved in
key cellular processes, including apoptosis, proliferation and
differentiation. (9). MiRNA
misexpression or mutation results in a gain or loss of miRNA
function and, therefore, a downregulation or upregulation of the
target protein. Notably, the successful use of antagomirs to
silence miRNAs in mice (10) and
in non-human primates (11)
suggests the possible therapeutic use of miRNAs. Previously, miRNAs
have also been identified as oncogenes or tumor suppressors
(12,13).
However, the regulation of miRNAs and corresponding
target mRNAs during the occurrence and development of ESCC have not
been reported. The advent of genome-wide technologies, including
gene expression microarrays, has made it possible to achieve a
comprehensive view of the miRNAs and mRNAs alteration involved in
ESCC, and the use of bioinformatics enables analysis of differences
between miRNAs and mRNAs.
To identify the miRNAs and mRNAs that are involved
in the molecular biological changes of ESCC, the present study
examined the gene expression microarray of miRNAs and mRNAs from a
published database to discriminate those involved in ESCC from
those in normal tissues. The results may assist in identifying
novel targets for ESCC therapy and provide biomarkers on diagnosis
and prognosis.
Materials and methods
Selection of patients data
Patient microarray data were obtained from an miRNA
and an mRNA datasets, which included 88 and 358 appropriate
samples, respectively. The miRNA microarray series contained 44
ESCC tumor and 44 normal control samples, and the mRNA microarray
series contained 179 ESCC tumor and 179 normal control samples. The
two series were accessible at the NCBI GEO database (http://www.ncbi.nlm.nih.gov/geo/), and their
accession numbers were GSE13937 and GSE53625, respectively. The
details of sample characteristics were presented in their original
articles (14,15).
Differentially expressed miRNAs
The miRNAs, which were differentially expressed
between the ESCC and normal control samples were identified using
the limma method, which is a linear model for microarray data
analysis (16). The threshold
values were set at P<0.05 and false discover rate (FDR)<0.05,
from which the ESCC-associated differentially expressed miRNAs were
identified.
Differentially expressed mRNAs
The mRNAs, which were differentially expressed
between the ESCC and normal control samples were also identified
using the limma method. The P-value and the fold change were
calculated for each differentially expressed gene. The thresholds
were set at: Fold change>3, P<0.001 and FDR<0.001, from
which the ESCC-associated differential expression genes were
selected. Unsupervised hierarchical clustering was performed with
Cluster (version 3.0; Eisen Lab, Stanford, CA, USA) using Pearson’s
correlation distance metric and average linkage, followed by
visualization using Treeview (Eisen Lab, Stanford, CA, USA)
(17).
Gene Ontology (GO) analysis
Based on the GO Database (http://www.geneontology.org/), the significant GO
terms of the ESCC-associated differentially expressed genes were
analyzed with a two-tailed Fisher’s exact test and χ2
test using the Database for Annotation, Visualization and
Integrated Discovery (http://david.abcc.ncifcrf.gov/home.jsp) analysis
(18). The differentially
expressed genes were analyzed independently, according to the
upregulation and down-regulation of these genes. The P-values of
each differentially expressed gene in all the GO terms were
calculated. P<0.05 was considered to indicate a statistically
significant difference.
Pathway analysis
Pathway analysis was used to determine the
significant pathway of the differential genes, according to the
KEGG (http://www.genome.jp/kegg/), Biocarta
(http://www.biocarta.com/) and Reatome (http://www.reactome.org/) pathway databases. Fisher’s
exact test and a χ2 test were used to select the
significant pathway, and the threshold of significance was defined
by the P-value and FDR (19-21).
Annotation of miRNA targets
The target mRNAs of the miRNAs were predicted based
on TargetScan (http://www.targetscan.org/) version 6.2. TargetScan
predicts the biological targets of miRNAs by identifying conserved
8mer and 7mer sites, which match the seed region of each miRNA
(7). It also identifies sites with
mismatches in the seed region that are compensated by conserved 3′
pairing (22). In mammals, the
predictions are ranked based on the predicted efficacy of
targeting, calculated using the context scores of the site
alignments (23,24). TargetScan Human (http://www.targetscan.org/) considers matches to
annotate human untranslated regions and their orthologs, defined by
UCSC whole-genome alignments (25). Conserved targeting is also detected
within open reading frames.
miRNA-gene network
The associations between the miRNAs and genes were
determined by their counting their differential expression values,
and according to the interactions of miRNAs and genes in the Sanger
miRNA database (http://www.sanger.ac.uk/) to construct the miRNA-gene
network. The adjacency matrix of microRNA and genes, A =
[ai,j], was obtained from the attribute associations
among the genes and miRNAs, where ai,j represents the
association weight between the gene (i) and miRNA (j). In the
miRNA-gene network, a circular node represents the gene and a
square node represents the miRNA, and their association is
represented by a line. The center of the network is presented as
the degree, which indicates the contribution of one miRNA to the
surrounding genes, or the contribution of one gene to the
surrounding miRNAs. The key miRNA and gene in the network always
have the largest degrees.
Data analysis
Numerical data are presented as the mean ± standard
deviation. Differences between the means were analyzed using
Student’s t-test. All statistical analyses were performed using
SPSS 13.0 software (SPSS, Inc., Chicago, IL, USA).
Results
Clinical characteristics of the two group
samples
The same clinical characteristics of the miRNA
microarray and mRNA microarray groups were collected from the
original articles (Table I). On
comparing the two groups, the patients from the miRNA group had
similar levels of alcohol and tobacco consumption to those in the
mRNA group. In the miRNA microarray group, the distribution of
samples in the four tumor-node-metastasis (TNM) stages were
similar, while the samples from the mRNA microarray samples were in
stages I-III. However, these difference were not statistically
significant.
 | Table IClinicopathological characteristics
of patients with esophageal squamous cell carcinoma. |
Table I
Clinicopathological characteristics
of patients with esophageal squamous cell carcinoma.
| Characteristic | GSE13937 n
(n=44) | GSE53625 n
(n=179) |
|---|
| Alcohol
consumption | 33 | 101 |
| Smoking status | 33 | 105 |
| TNM stage |
| I | 7 | 12 |
| II | 18 | 86 |
| III | 6 | 81 |
| IV | 8 | 0 |
| NA | 5 | 0 |
Overview of the miRNAs profiles
From the miRNAs expression profiles, differentially
expressed miRNAs were identified between the ESCC and normal
control samples. The miRNA expression profiles were determined by
calculating the log fold change in the ESCC group / normal group.
Due to a limited sample size, the FDR and P-values were considered,
obtaining 17 results. Compared with the normal tissues, the FDR
values of miR-375, miR-26a-1* and miR-378 were the most
significantly upregulated miRNAs, while miR-21, miR-146b-5p and
miR-155 were the most significantly downregulated (Table II). The number of upregulated
miRNAs was similar with the number of downregulated miRNAs in the
ESCC group.
| Table IICollection of dysregulated miRNAs,
detected using microarray analysis, in ESCC. |
Table II
Collection of dysregulated miRNAs,
detected using microarray analysis, in ESCC.
A, Upregulated in
ESCC
|
|---|
| miRNA | P-value | FDR | Fold change |
|---|
| hsa-miR-21 |
1.29×10⁻¹⁰ |
4.01×10⁻⁷ | 2.59 |
|
hsa-miR-146b-5p |
7.03×10⁻⁸ |
4.13×10⁻⁵ | 1.91 |
| hsa-miR-155 |
6.16×10⁻⁷ |
2.30×10⁻⁴ | 1.88 |
| hsa-miR-223 |
2.51×10⁻⁶ |
8.35×10⁻⁴ | 2.38 |
| hsa-miR-7 |
5.66×10⁻⁶ |
1.35×10⁻³ | 1.59 |
| hsa-miR-181b |
1.48×10⁻⁵ |
2.59×10⁻³ | 1.47 |
| hsa-miR-224 |
7.28×10⁻⁵ |
7.58×10⁻³ | 1.82 |
| hsa-miR-181a |
1.61×10⁻⁴ |
1.22×10⁻² | 1.45 |
| hsa-miR-146a |
5.10×10⁻⁴ |
3.09×10⁻² | 1.45 |
B, Downregulated in
ESCC
|
|---|
| miRNA | P-value | FDR | Fold change |
|---|
| hsa-miR-375 |
6.22×10⁻⁷ |
2.30×10⁻⁴ | 0.38 |
|
hsa-miR-26a-1* |
8.21×10⁻⁵ |
8.08×10⁻³ | 0.57 |
| hsa-miR-378 |
9.23×10⁻⁵ |
8.79×10⁻³ | 0.56 |
| hsa-miR-202 |
1.19×10⁻⁴ |
1.05×10⁻² | 0.32 |
| hsa-miR-100 |
2.32×10⁻⁴ |
1.58×10⁻² | 0.59 |
| hsa-miR-145 |
5.28×10⁻⁴ |
3.14×10⁻² | 0.59 |
| hsa-miR-143 |
7.85×10⁻⁴ |
3.90×10⁻² | 0.59 |
| hsa-miR-1 |
8.42×10⁻⁴ |
4.07×10⁻² | 0.46 |
Overview of the mRNAs profiles
In the mRNA microarray group, up to 26,154 coding
transcripts were detected in the 358 samples. Using the limma
method, with cut of criteria of a fold change>3, and P-value and
FDR<0.001 between the two groups, 576 probes were upregulated
and 1,094 probes were downregulated in the ESCC samples. The global
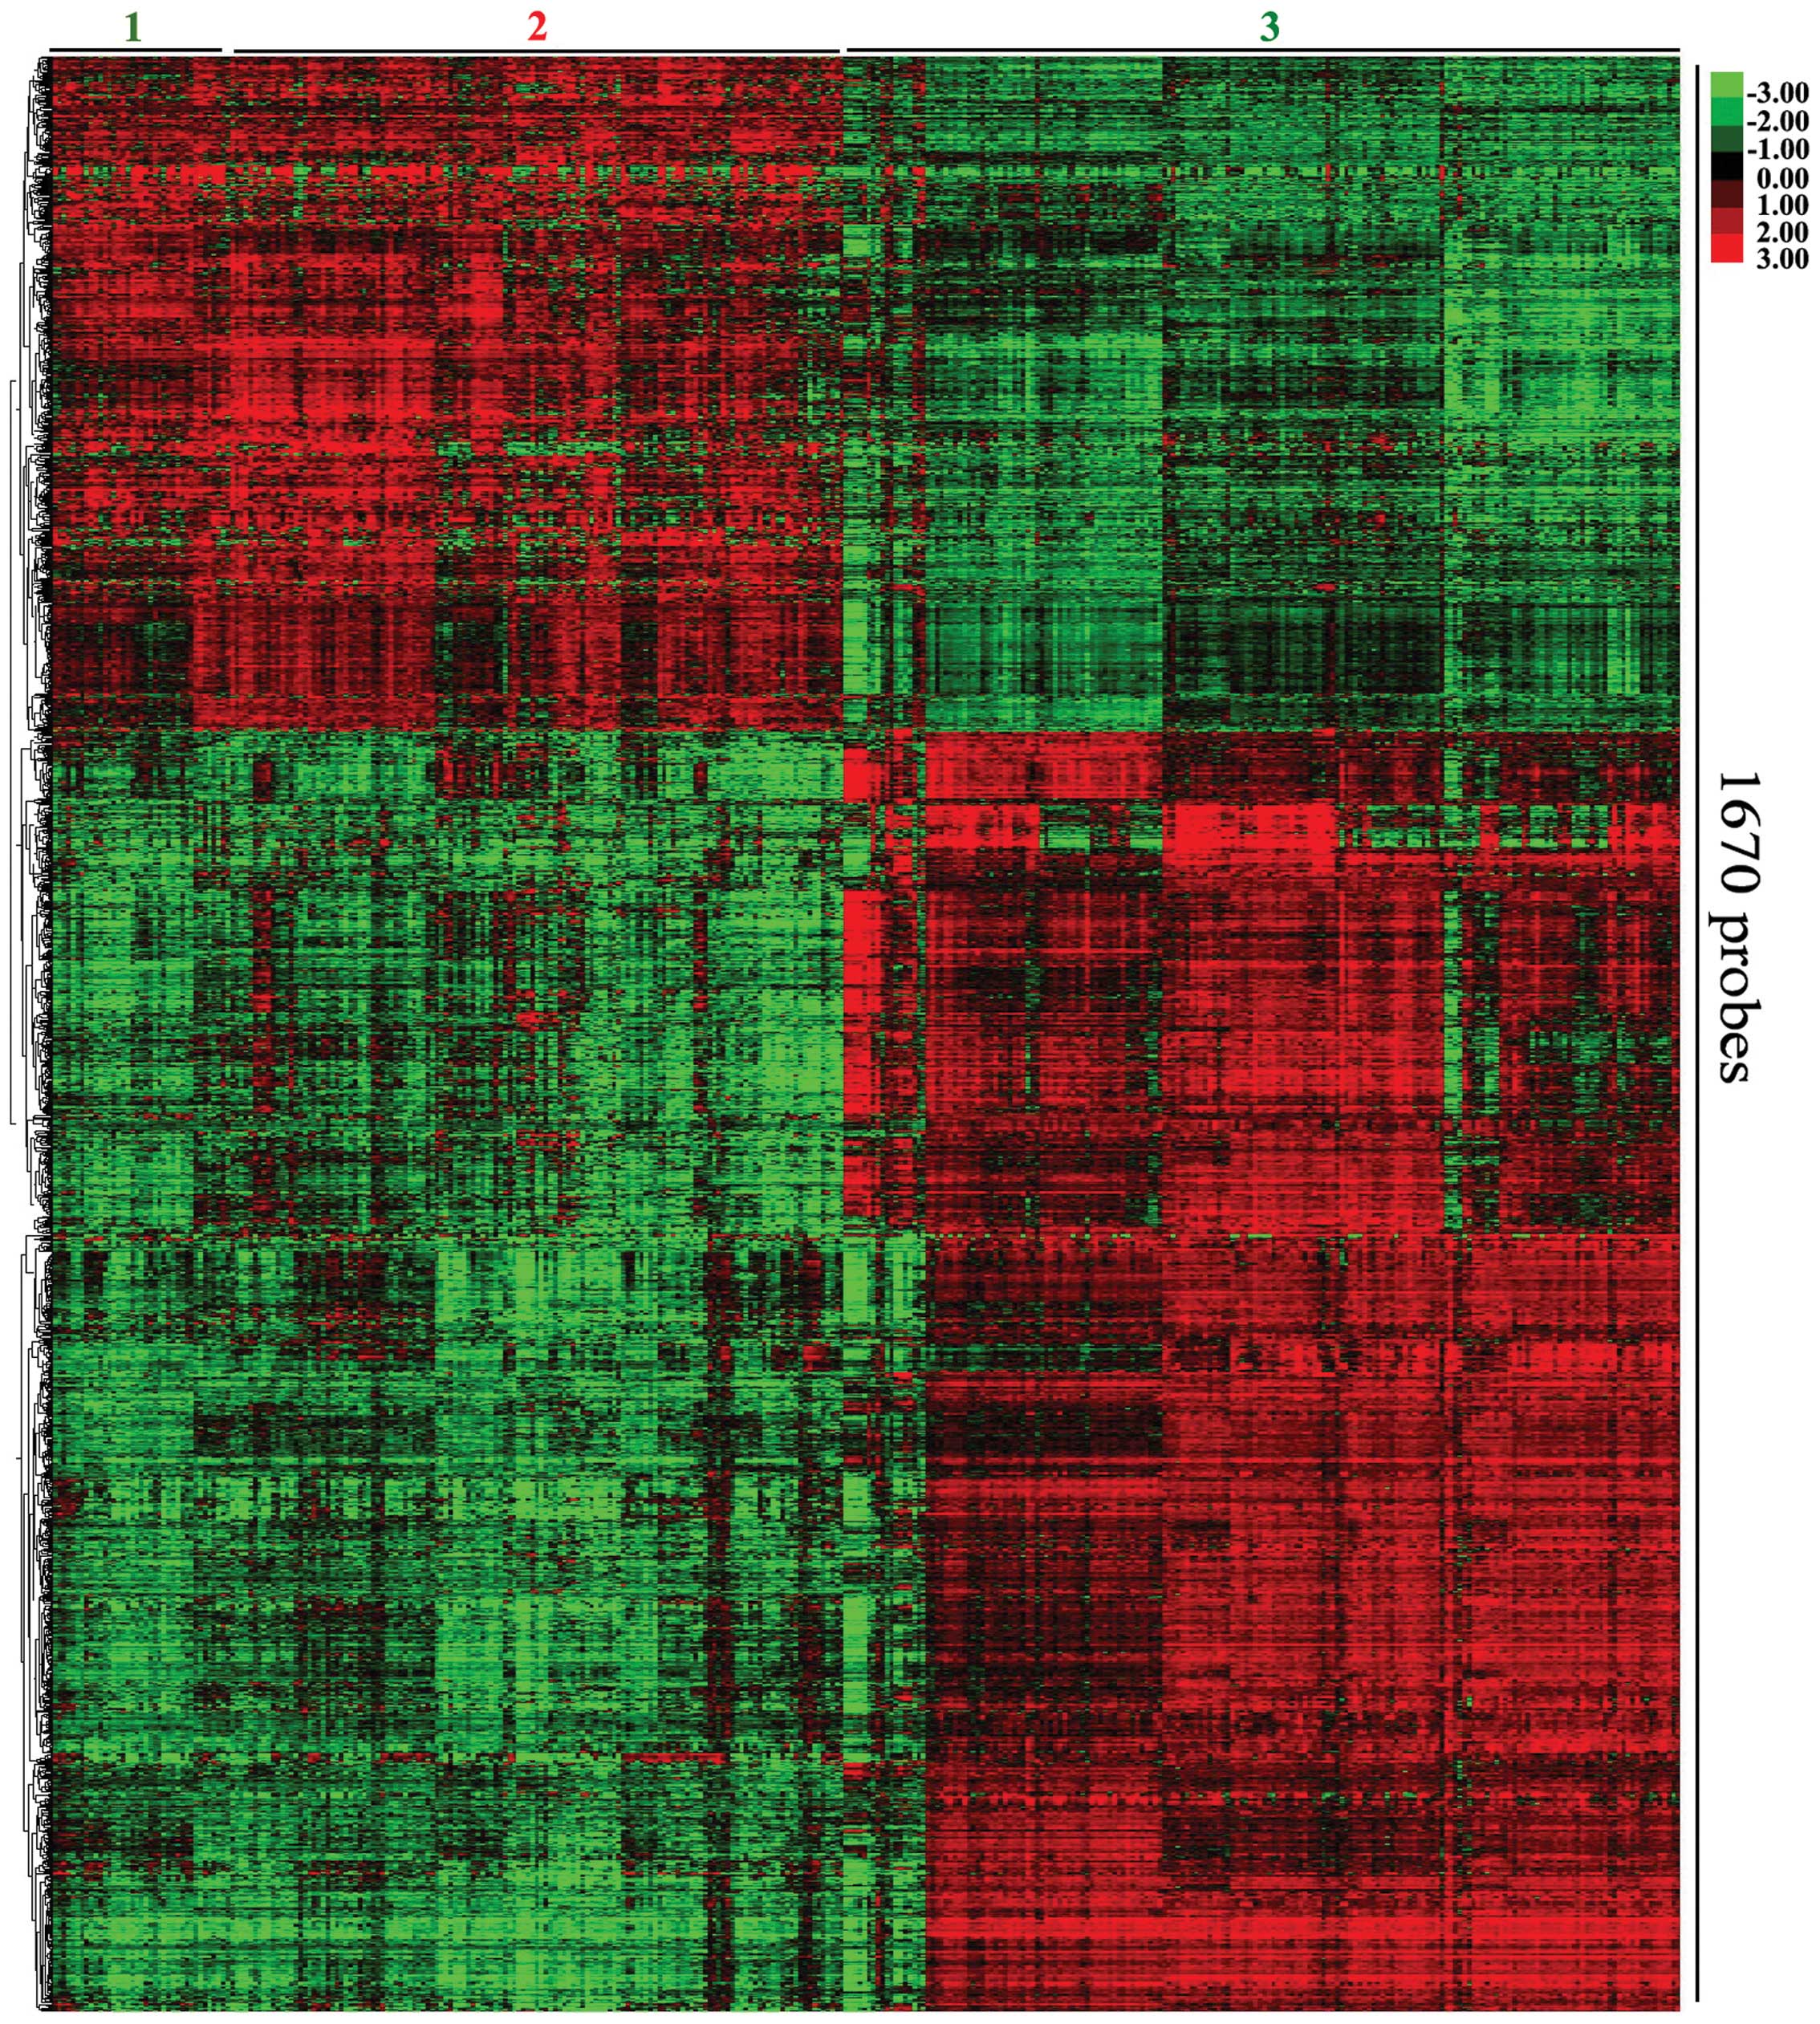
mRNA expression patterns were then evaluated by hierarchical
clustering. The most variably expressed mRNAs revealed two major
clusters, which correlated with the differentiation state of the
tumor (Fig. 1). Expression cluster
2 contained all the ESCC samples, while the normal control groups
were divided into sub clusters 1 and 3. COL1A1 was the most
significantly upregulated mRNA, and EMP1 was the most significantly
downregulated mRNA (Table III).
In the ESCC group, a higher number of downregulated mRNAs were
observed compared with upregulated mRNAs.
| Table IIIMost markedly dysregulated genes,
sorted by FDR, in ESCC tissue compared with normal tissue. |
Table III
Most markedly dysregulated genes,
sorted by FDR, in ESCC tissue compared with normal tissue.
A, Upregulated in
ESCC
|
|---|
| mRNA | P-value | FDR | Fold change |
|---|
| COL1A1 |
7.07×10−154 |
1.27×10−149 | 13.06 |
| COL10A1 |
1.35×10−147 |
1.61×10−143 | 38.33 |
| MMP1 |
8.01×10−134 |
4.41×10−130 | 30.41 |
| POSTN |
3.21×10−132 |
1.35×10−128 | 16.70 |
| SPP1 |
6.29×10−127 |
2.05×10−123 | 31.89 |
| AURKA |
1.52×10−125 |
4.18×10−122 | 5.36 |
| FSCN1 |
1.84×10−122 |
4.26×10−119 | 5.17 |
| ADAMTS12 |
5.51×10−122 |
1.19×10−118 | 17.63 |
| LAMC2 |
2.96×10−121 |
6.06×10−118 | 11.52 |
| MFAP2 |
1.66×10−120 |
3.12×10−117 | 12.31 |
B, Downregulated in
ESCC
|
|---|
| mRNA | P−value | FDR | Fold change |
|---|
| EMP1 |
6.05×10−148 |
8.66×10−144 | 0.08 |
| GCOM1 |
4.37×10−147 |
4.47×10−143 | 0.05 |
| PPP1R3C |
2.21×10−144 |
1.58×10−140 | 0.06 |
| ELN |
3.60×10−142 |
2.35×10−138 | 0.13 |
| MAL |
2.08×10−132 |
9.30×10−129 | 0.04 |
| MGLL |
1.77×10−128 |
6.66×10−125 | 0.18 |
| CRISP2 |
3.21×10−127 |
1.15×10−123 | 0.01 |
| SH3BGRL2 |
6.31×10−127 |
2.05×10−123 | 0.07 |
| SASH1 |
1.55×10−126 |
4.62×10−123 | 0.11 |
| CAB39L |
1.07×10−125 |
3.07×10−122 | 0.16 |
Microarray-based GO analysis
The target mRNAs for differentially expressed miRNAs
were predicted using TargetScan (http://www.targetscan.org/), which revealed 5,532
associations between the two. The intersection set for the
predicted target mRNAs and differentially expressed mRNAs from
GSE53625, mentioned above, was selected. Following negative
correlation, the eligible mRNAs were then used for GO analysis. The
threshold of GO terms, which were significantly regulated by miRNAs
was P<0.05. The GO terms with the highest levels of enrichment,
targeted by miRNAs, included collagen fibril organization and
phosphate metabolic process (Tables
IV and V).
| Table IVGene Ontology terms significantly
upregulated by microRNAs. |
Table IV
Gene Ontology terms significantly
upregulated by microRNAs.
| Gene Ontology
term | P−value | Fold
enrichment |
|---|
| Collagen fibril
organization |
1.88×10⁻⁹ | 56.30 |
| Extracellular
matrix organization |
2.50×10⁻⁷ | 17.94 |
| Extracellular
structure organization |
5.17×10⁻⁶ | 11.45 |
| Collagen metabolic
process |
2.16×10⁻⁴ | 33.32 |
| Multicellular
organismal macromolecule metabolic process |
2.93×10⁻⁴ | 30.10 |
| Multicellular
organismal metabolic process |
4.98×10⁻⁴ | 25.22 |
| Cell motion |
3.65×10⁻³ | 3.93 |
| Cell migration |
6.01×10⁻³ | 5.07 |
| Cell adhesion |
8.64×10⁻³ | 3.00 |
| Biological
adhesion |
8.71×10⁻³ | 3.00 |
| Cell motility |
9.31×10⁻³ | 4.56 |
| Localization of
cell |
9.31×10⁻³ | 4.56 |
| Cell
proliferation |
9.81×10⁻³ | 3.74 |
| Sensory organ
development |
1.57×10⁻² | 5.09 |
| Collagen
biosynthetic process |
2.09×10⁻² | 93.30 |
| Fibril
organization |
2.91×10⁻² | 66.64 |
| Regeneration |
3.42×10⁻² | 10.14 |
| Regulation of
cytokine biosynthetic process |
3.88×10⁻² | 9.46 |
| Response to
reactive oxygen species |
3.98×10⁻² | 9.33 |
| Table VGene Ontology terms significantly
downregulated by microRNAs. |
Table V
Gene Ontology terms significantly
downregulated by microRNAs.
| Gene Ontology
term | P−value | Fold
enrichment |
|---|
| Phosphate metabolic
process |
7.05×10⁻⁴ | 2.78 |
| Phosphorus
metabolic process |
7.05×10⁻⁷ | 2.78 |
| Enzyme linked
receptor protein signaling pathway |
2.62×10⁻³ | 4.22 |
| Protein amino acid
phosphorylation |
3.29×10⁻³ | 2.97 |
| Regulation of cell
development |
5.26×10⁻³ | 5.28 |
| Response to
endogenous stimulus |
6.57×10⁻³ | 3.56 |
| Regulation of
epithelial cell proliferation |
6.88×10⁻³ | 10.16 |
| Cell fate
commitment |
7.05×10⁻³ | 6.49 |
| Transmembrane
receptor protein tyrosine kinase signaling pathway |
7.60×10⁻³ | 4.83 |
| Cell morphogenesis
involved in differentiation |
1.08×10⁻² | 4.44 |
| Cell projection
morphogenesis |
1.09×10⁻² | 4.42 |
|
Phosphorylation |
1.14×10⁻² | 2.48 |
| Cell part
morphogenesis |
1.30×10⁻² | 4.23 |
| Cell
morphogenesis |
1.31×10⁻² | 3.55 |
| Response to hormone
stimulus |
1.51×10⁻² | 3.44 |
| Cell projection
organization |
1.53×10⁻² | 3.43 |
| Response to organic
substance |
1.64×10⁻² | 2.50 |
| Cellular component
morphogenesis |
2.13×10⁻² | 3.18 |
| Peptidyl−tyrosine
phosphorylation |
2.62×10⁻² | 11.76 |
| Regulation of
system process |
2.70×10⁻² | 3.50 |
| Peptidyl−tyrosine
modification |
2.83×10⁻² | 11.27 |
| Positive regulation
of programmed cell death |
3.09×10⁻² | 2.92 |
| Positive regulation
of cell death |
3.15×10⁻² | 2.90 |
| Cell adhesion |
3.69×10⁻² | 2.32 |
| Biological
adhesion |
3.71×10⁻² | 2.32 |
| Regulation of
synaptic transmission |
3.84×10⁻² | 5.31 |
| Negative regulation
of transcription, DNA−dependent |
4.52×10⁻² | 3.04 |
| Cell−cell
signaling |
4.53×10⁻² | 2.40 |
| Regulation of
transmission of nerve impulse |
4.66×10⁻² | 4.91 |
| Negative regulation
of RNA metabolic process |
4.80×10⁻² | 2.99 |
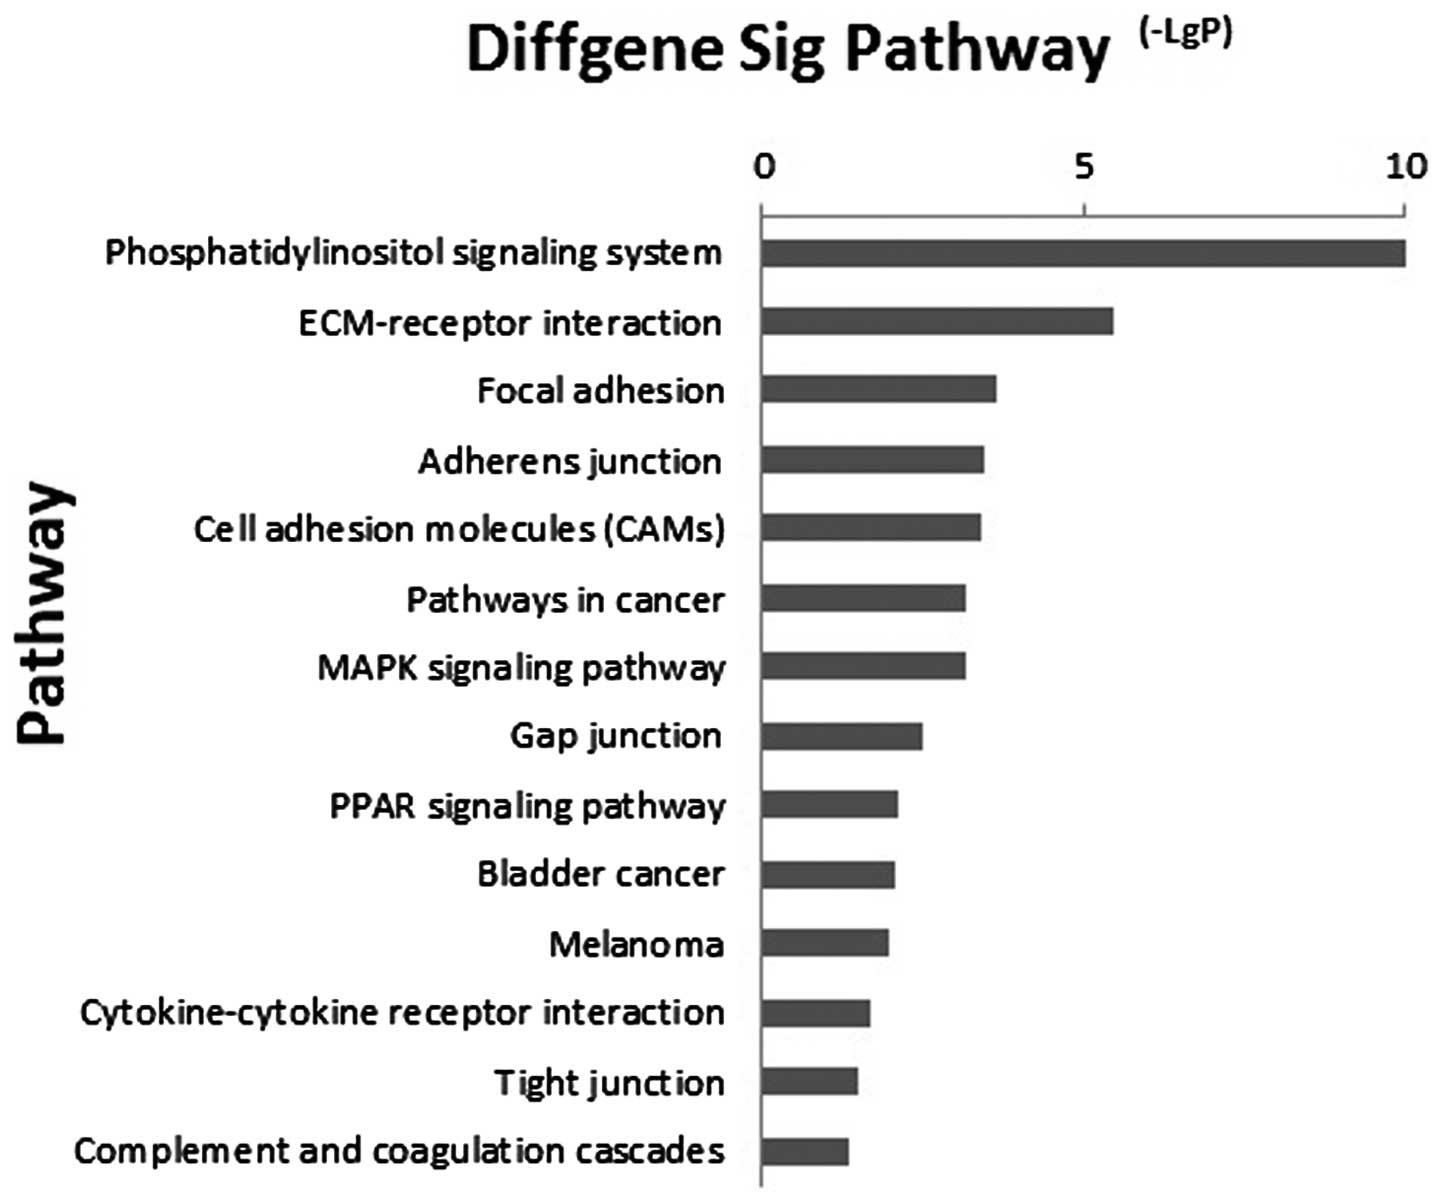
Microarray-based pathway analysis
As signal transduction may be involved in ESCC, the
associated pathways were analyzed, according to the functions and
interactions of the differential genes. By using Pathway analysis,
which considered the relative change direction and fold change and
had a the threshold of significance of P<0.05, 14 significant
pathways were found (Fig. 2). The
most enriched pathways targeted by dysregulated mRNAs included the
phosphatidylinositol signaling system, ECM-receptor interaction and
focal adhesion pathways and the peroxisome proliferator activated
receptor signaling pathway. This suggested that miRNA regulated
oncogenesis of ESCC through these pathways.
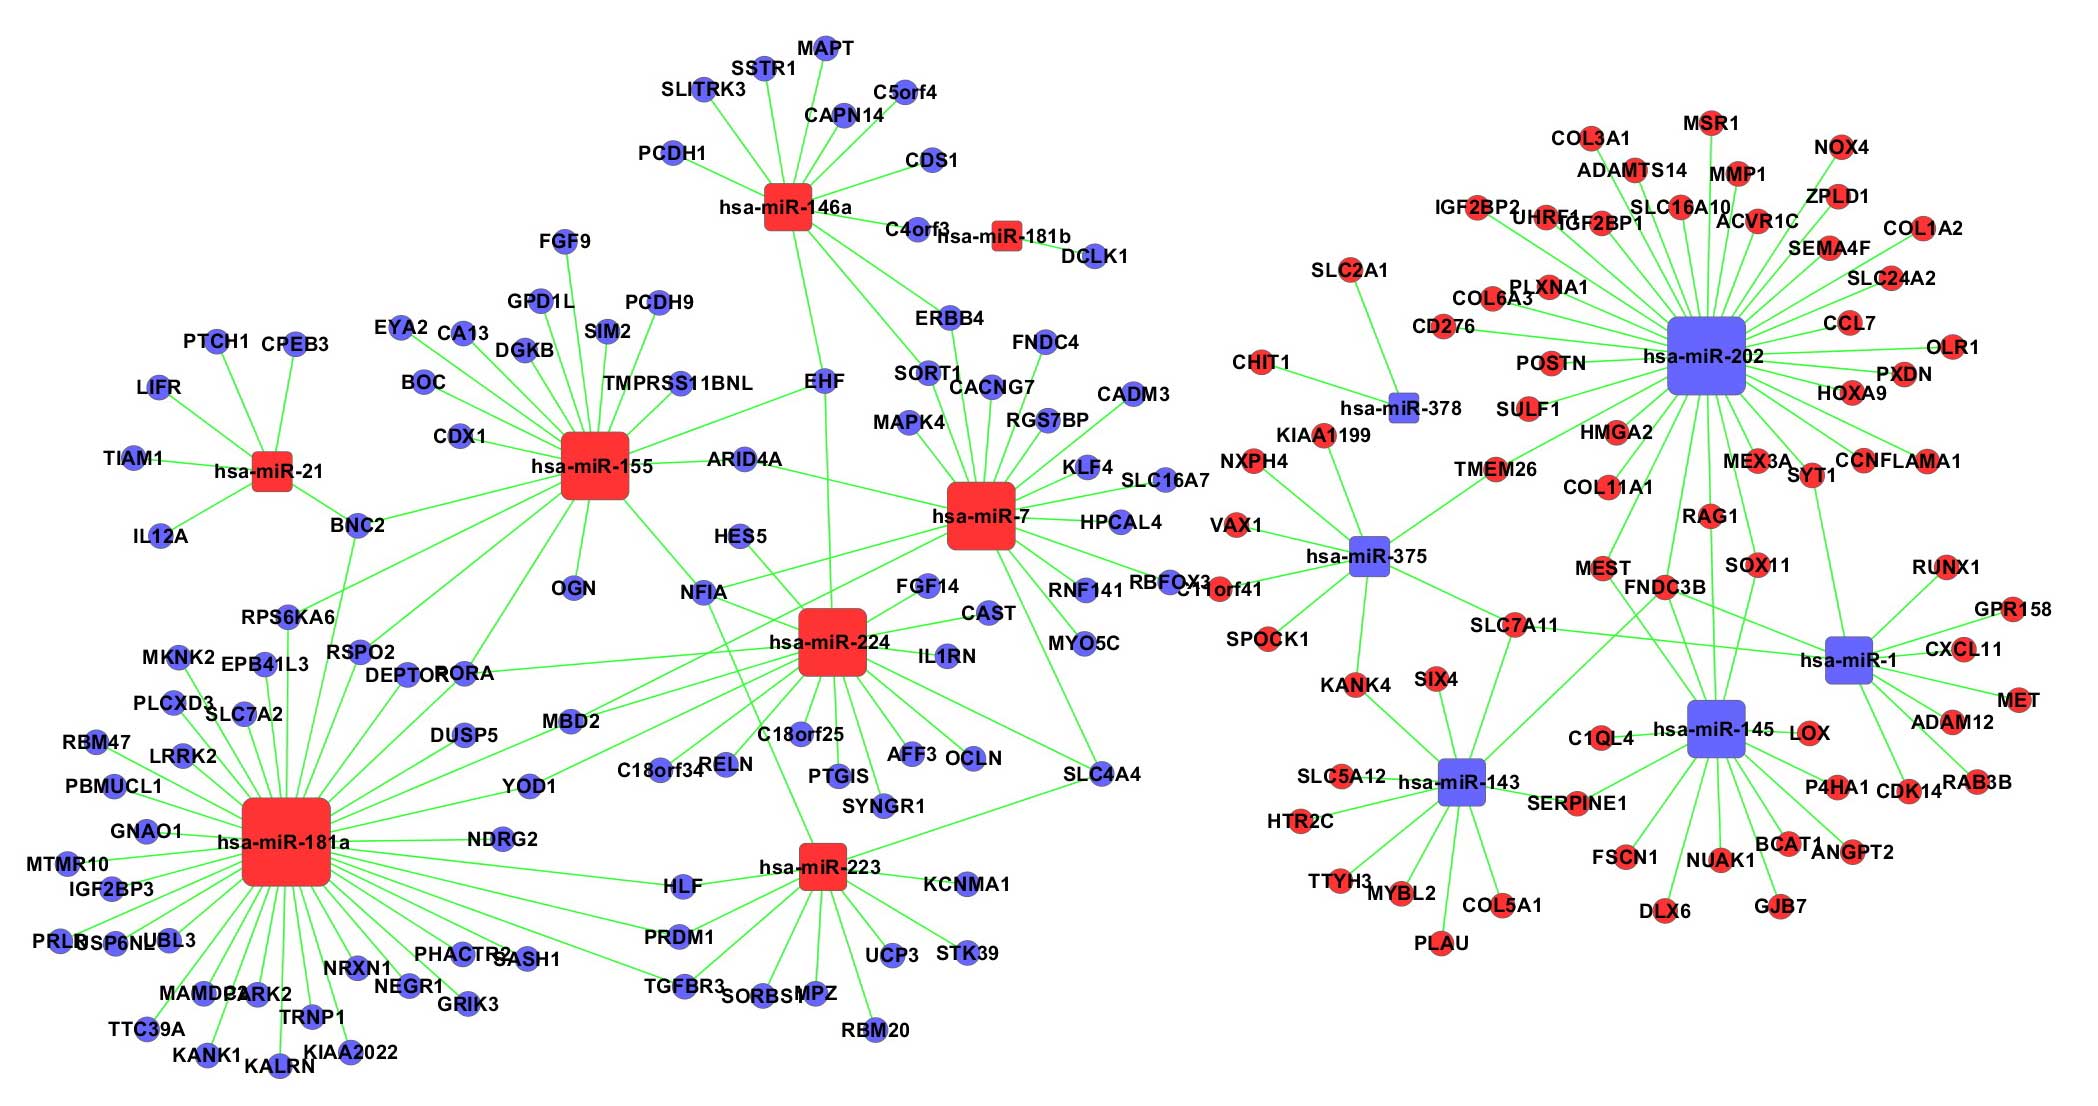
miRNA-mRNA network
As the pathways identified did not appear to be
closely relevant to ESCC, the intersection set of significantly
differentially expressed mRNAs, identified by GO and pathway
analysis, were screened out. The miRNA-mRNA regulatory networks
based on these mRNAs (Fig. 3),
distinguished the putative target mRNAs between the overexpressed
and underexpressed miRNAs. The total numbers of mRNAs and miRNAs in
the network were 164 and 14, respectively. The particular
associations between them are listed in Table IV. In the network, the circular
nodes represent mRNAs, square nodes represent miRNAs, and lines
between two nodes represent interactions between the miRNA and
mRNA. The degree represents the number of target genes regulated by
particular miRNAs, and the higher the degree, the more central the
miRNAs is within the network. miR-181a, miR-202 and miR-155 were
identified as the three dysregulated miRNAs with the most target
mRNAs, whereas FNDC3B, NFIA and BNC2 were targeted by the most
miRNAs.
Effects of miRNAs on patients
As miRNAs may be important in regulating the
formation and development of ESCC from different aspects, the
present study examined the core miRNAs in the miRNA-mRNA network of
the tumor sample group alone. Clinical characteristics, including
alcohol consumption, smoking status, TNM staging and nodal
involvement were included in the analysis. miR-181a was expressed
more markedly in the late stage (Stage III and IV; P=0.01), while
smoking patients were more likely to exhibit overexpression of
miR-155 (P=0.01). Notably, no significant differences were observed
between the core downregulated miRNAs, including miR-202, miR-145
and miR-143 and the above-mentioned clinical characteristics.
Discussion
Understanding the clinical relevance of miRNA
expression patterns in ESCCs is a necessary to better classify
these heterogeneous types of tumor and to circumvent the
therapeutic challenges faced upon their clinical management.
However, for miRNAs indirectly regulating the pathophysiological
process of ESCC, the possible target mRNAs remain to be fully
elucidated. The difficulties in using miRNA micro-arrays to predict
patients with ESCC arise predominantly due to the challenge in
interpreting the numerous complex data produced by the microarray
(26) and determining the
responsible genes. The present study used bioinformatics methods to
analyze the functions and pathways of the differentially expressed
miRNAs and mRNAs in ESCC, further clarified their biological
significance, and defined the key miRNAs and possible target mRNAs
affecting the formation of ESCC.
In the present study, a total of 17 aberrantly
expressed miRNAs were identified in the ESCC samples, compared to
adjacent normal tissues. As the expression of miRNA is known to be
tissue- and tumor-specific (27),
using the appropriate tumor subset with the corresponding control
subset is important to reduce the potential complexities associated
with analyzing heterogeneous tumor tissues. The present study aimed
to investigate miRNA-mRNA regulation in ESCCs, one of the largest
gene expression microarray datasets was used to identify the miRNA
targets. Following assessment of the GSE53625 microarray series,
1,670 differently expressed probes were found. The negatively
correlated mRNAs with previous differential miRNAs were then used
as the base for further investigation of the role of the miRNAs in
ESCC.
GO is widely recognized as a premier tool for the
organization and functional annotation of molecular aspects
(28). By using the criteria of
P<0.05, significant GO terms, and the genes involved in them,
were obtained. GO terms associated with transcription regulation
response are important in ESCC through miRNAs, and this is
correlated with the predominant biological function of the miRNAs
in humans. Several upregulated GO terms account for cell motility
and migration, Matsushima et al reported that miRNA-205
modulated ESCC invasion and migration via regulating zinc finger
E-box binding homeobox 2 (29). In
addition, the cell proliferation term was also observed in this
group, revealing increased growth ability in ESCC. By contrast, GO
terms in the dowregulated group belonged to the negative behavior
of the cell proliferation. Transcriptional regulation is the major
function of miRNAs (30), and
significant changes in this term observed in the present study
further confirmed the results of the present study. Furthermore,
previous reports have investigated the role of miRNA in regulating
ESCC cell death and revealed promising results (31–33).
For example, Wang et al (31) demonstrated that miR-22 induces ESCC
cell sensitivity to irradiation (34). However, other biological processes
may also have effects in ESCC tumorigenesis.
Pathway analysis can reveal distinct biological
processes and identify the significant pathways that dysregulated
mRNAs are involved in, which can provide a comprehensive
understanding of the interactions of genes, their functions and the
association between up- and down-stream genes, and can identify
genes, which may be regulated by miRNAs. The appearance of the
pathways in focal adhesion, gap junctions and cancer pathways
confirm their concordance with GO terms and their critical role in
ESCC. Focal adhesion has been found to be involved in esophageal
cancer migration and invasion (35), however, its molecular mechanism
remains to be fully elucidated, and miRNA regulation may be
involved. A previous study revealed that cytokines are also
involved in the esophageal cancer process, particularly via the
mitogen-activated protein kinase (MAPK) pathway (36). LTBP-2, a type of extracellular
matrix (ECM) protein, decreases the colony-forming abilities of
ESCC and induces tumor suppression (37). The role of miRNAs in ESCC remains
to be fully elucidated, and less is understood regarding the
associated signaling pathway information regulated by miRNAs. The
present study suggested that other, seemingly irrelevant, pathways
are controlled by miRNAs and have their functions in ESCC, which
requires further investigation. In the present study, the results
of the pathway analysis on important roles and functions of miRNAs
were similar to those of the GO analysis.
In the present study, the investigation of genes
involved in significant GO terms and pathways revealed 164 genes in
common that may be regulated by miRNAs in ESCC. miRNA-181a
functions as an oncomir in gastric cancer (38), however its role in ESCC remains to
be fully elucidated. miRNA-202 is a novel tumor suppressor and is a
potential tumor suppressive miRNA involved in the carcinogenesis of
human hepatocellular carcinoma (39). It has been demonstrated that
miRNA-155 acts as an oncogene by targeting TP53INP1 in ESCC
(40). FNDC3B has also been
identified in an oncogenomic screen for amplified oncogenes, and
over-expression of FNDC3B induces epithelial-to-mesenchymal
transition and activates several cancer pathways (41). BNC2 has been identified as a tumor
suppressor in esophageal cancer, based on single nucleotide
polymorphism microarrays, and transfection and stable expression of
BNC2 causes growth arrest of esophageal cancer cells (42). MBD2 is a member of the MBD protein
family, the expression of which is reduced in esophageal cancer
(43). MBD2 binds to methylated
promoter CpG islands and acts as a methylation-dependent
transcriptional repressor (44).
It has been found to be a target gene of miRNA-224 and
miRNA-221* (45).
Although their functions have received less investigation, several
miRNAs may regulate ESCC. In addition, the differential expression
of these miRNAs associated with other clinical characteristics,
including smoking and TNM stage, indicated their important role in
ESCC. Based on these data, further investigation of the expression
and target functions of the identified miRNAs is required, in more
samples. In addition, the regulation of the identified miRNAs and
pathway functions require investigation, which may assist in
improving the clinical diagnosis and treatment of patients with
ESCC.
In conclusion, the results of the present study
indicated that, by correlating the mRNA and miRNA expression data
from two platforms, putative miRNA-mRNA interactions in ESCC were
identified. GO and pathway analysis identified pathways controlling
the MAPK and peroxisome proliferator-activated receptor signaling
pathways, as well as focal adhesion and ECM-receptor interaction
pathways. Network analysis also revealed important miRNAs and
mRNAs, including miRNA-181a, miRNA-202, miRNA-155, FNDC3B, BNC2 and
MBD2, which may be involved in ESCC. Based on the integrated
analysis of transcriptome features, these results may provide an
important contribution to future investigations aimed at
characterizing the role of specific miRNAs in the pathogenesis of
ESCC, and contribute to improving diagnosis and treatment.
Acknowledgments
This study was supported, in part, by grants from
the projects of the Science and Technology Commission of Shanghai
Municipality (no’s. shdc12012111 and 13411950100) and the key
project of Shanghai Municipal Commission of Health and Family
Planning (no. 2013zyjb0401).
References
|
1
|
Siegel R, Ma J, Zou Z and Jemal A: Cancer
statistics, 2014. CA Cancer J Clin. 64:9–29. 2014. View Article : Google Scholar : PubMed/NCBI
|
|
2
|
Yang L, Parkin DM, Ferlay J, Li L and Chen
Y: Estimates of cancer incidence in China for 2000 and projections
for 2005. Cancer Epidemiol Biomarkers Prev. 14:243–250.
2005.PubMed/NCBI
|
|
3
|
Chon HS and Lancaster JM: Microarray-based
gene expression studies in ovarian cancer. Cancer Control. 18:8–15.
2011.PubMed/NCBI
|
|
4
|
Vitucci M, Hayes DN and Miller CR: Gene
expression profiling of gliomas: merging genomic and
histopathological classification for personalised therapy. Br J
Cancer. 104:545–553. 2011. View Article : Google Scholar :
|
|
5
|
Nannini M, Pantaleo MA, Maleddu A, Astolfi
A, Formica S and Biasco G: Gene expression profiling in colorectal
cancer using microarray technologies: results and perspectives.
Cancer Treat Rev. 35:201–209. 2009. View Article : Google Scholar
|
|
6
|
Bartel DP: MicroRNAs: genomics,
biogenesis, mechanism and function. Cell. 116:281–297. 2004.
View Article : Google Scholar : PubMed/NCBI
|
|
7
|
Lewis BP, Burge CB and Bartel DP:
Conserved seed pairing, often flanked by adenosines, indicates that
thousands of human genes are microRNA targets. Cell. 120:15–20.
2005. View Article : Google Scholar : PubMed/NCBI
|
|
8
|
Kozomara A and Griffiths-Jones S: miRBase:
integrating microRNA annotation and deep-sequencing data. Nucleic
Acids Res. 39(Database Issue): 152–157. 2011. View Article : Google Scholar
|
|
9
|
Li X, Zhang J, Gao L, et al: MiR-181
mediates cell differentiation by interrupting the Lin28 and let-7
feedback circuit. Cell Death Differ. 19:378–386. 2012. View Article : Google Scholar :
|
|
10
|
Krützfeldt J, Rajewsky N, Braich R, et al:
Silencing of microRNAs in vivo with ‘antagomirs’. Nature.
438:685–689. 2005. View Article : Google Scholar
|
|
11
|
Elmén J, Lindow M, Schütz S, et al:
LNA-mediated microRNA silencing in non-human primates. Nature.
452:896–899. 2008. View Article : Google Scholar : PubMed/NCBI
|
|
12
|
Lee YS and Dutta A: MicroRNAs: small but
potent oncogenes or tumor suppressors. Curr Opin Investig Drugs.
7:560–564. 2006.PubMed/NCBI
|
|
13
|
Caldas C and Brenton JD: Sizing up miRNAs
as cancer genes. Nat Med. 11:712–714. 2005. View Article : Google Scholar : PubMed/NCBI
|
|
14
|
Mathé EA, Nguyen GH, Bowman ED, Zhao Y, et
al: MicroRNA expression in squamous cell carcinoma and
adenocarcinoma of the esophagus: associations with survival. Clin
Cancer Res. 15:6192–6200. 2009. View Article : Google Scholar : PubMed/NCBI
|
|
15
|
Li J, Chen Z, Tian L, Zhou C, et al:
LncRNA profile study reveals a three-lncRNA signature associated
with the survival of patients with oesophageal squamous cell
carcinoma. Gut. 63:1700–1710. PubMed/NCBI
|
|
16
|
Diboun I, Wernisch L, Orengo CA and
Koltzenburg M: Microarray analysis after RNA amplification can
detect pronounced differences in gene expression using limma. BMC
Genomics. 7:2522006. View Article : Google Scholar : PubMed/NCBI
|
|
17
|
Eisen MB, Spellman PT, Brown PO and
Botstein D: Cluster analysis and display of genome-wide expression
patterns. Proc Natl Acad Sci USA. 95:14863–14868. 1998. View Article : Google Scholar : PubMed/NCBI
|
|
18
|
Dennis G Jr, Sherman BT, Hosack DA, et al:
DAVID: Database for Annotation, Visualization and Integrated
Discovery. Genome Biol. 4:P32003. View Article : Google Scholar
|
|
19
|
Kanehisa M, Goto S, Kawashima S, Okuno Y
and Hattori M: The KEGG resource for deciphering the genome.
Nucleic Acids Res. 32(Database Issue): 277–280. 2004. View Article : Google Scholar
|
|
20
|
Yi M, Horton JD, Cohen JC, Hobbs HH and
Stephens RM: WholePathwayScope: a comprehensive pathway-based
analysis tool for high-throughput data. BMC Bioinformatics.
7:302006. View Article : Google Scholar : PubMed/NCBI
|
|
21
|
Draghici S, Khatri P, Tarca AL, et al: A
systems biology approach for pathway level analysis. Genome Res.
17:1537–1545. 2007. View Article : Google Scholar : PubMed/NCBI
|
|
22
|
Friedman RC, Farh KK, Burge CB and Bartel
DP: Most mammalian mRNAs are conserved targets of microRNAs. Genome
Res. 19:92–105. 2009. View Article : Google Scholar :
|
|
23
|
Grimson A, Farh KK, Johnston WK,
Garrett-Engele P, Lim LP and Bartel DP: MicroRNA targeting
specificity in mammals: determinants beyond seed pairing. Mol Cell.
27:91–105. 2007. View Article : Google Scholar : PubMed/NCBI
|
|
24
|
Garcia DM, Baek D, Shin C, Bell GW,
Grimson A and Bartel DP: Weak seed-pairing stability and high
target-site abundance decrease the proficiency of lsy-6 and other
microRNAs. Nat Struct Mol Biol. 18:1139–1146. 2011. View Article : Google Scholar : PubMed/NCBI
|
|
25
|
Kuhn RM, Haussler D and Kent WJ: The UCSC
genome browser and associated tools. Brief Bioinform. 14:144–161.
2013. View Article : Google Scholar :
|
|
26
|
Chen X and Wang L: Integrating biological
knowledge with gene expression profiles for survival prediction of
cancer. J Comput Biol. 16:265–278. 2009. View Article : Google Scholar : PubMed/NCBI
|
|
27
|
Lu J, Getz G, Miska EA, et al: MicroRNA
expression profiles classify human cancers. Nature. 435:834–838.
2005. View Article : Google Scholar : PubMed/NCBI
|
|
28
|
Lovering RC, Camon EB, Blake JA and Diehl
AD: Access to immunology through the Gene Ontology. Immunology.
125:154–160. 2008. View Article : Google Scholar : PubMed/NCBI
|
|
29
|
Matsushima K, Isomoto H, Yamaguchi N, et
al: MiRNA-205 modulates cellular invasion and migration via
regulating zinc finger E-box binding homeobox 2 expression in
esophageal squamous cell carcinoma cells. J Transl Med. 9:302011.
View Article : Google Scholar : PubMed/NCBI
|
|
30
|
Omoto S and Fujii YR: Regulation of human
immunodeficiency virus 1 transcription by nef microRNA. J Gen
Virol. 86:751–755. 2005. View Article : Google Scholar : PubMed/NCBI
|
|
31
|
Wang N, Li Y, Zhou RM, et al:
Hsa-miR-196a2 functional SNP is associated with the risk of ESCC in
individuals under 60 years old. Biomarkers. 19:43–48. 2014.
View Article : Google Scholar
|
|
32
|
Yang M, Liu R, Li X, et al: miRNA-183
suppresses apoptosis and promotes proliferation in esophageal
cancer by targeting PDCD4. Mol Cells. 37:873–880. 2014. View Article : Google Scholar : PubMed/NCBI
|
|
33
|
Yuan JM, Mao WM, Luo J, Peng BF, Zheng ZG
and Ling ZQ: Effect of miRNA-106a expression on the prognosis of
patients with esophageal squamous cell carcinoma. Zhonghua Zhong
Liu Za Zhi. 35:590–594. 2013.In Chinese. PubMed/NCBI
|
|
34
|
Wang XC, Zhang ZB, Wang YY, et al:
Increased miRNA-22 expression sensitizes esophageal squamous cell
carcinoma to irradiation. J Radiat Res. 54:401–408. 2013.
View Article : Google Scholar :
|
|
35
|
Watanabe N, Takaoka M, Sakurama K, et al:
Dual tyrosine kinase inhibitor for focal adhesion kinase and
insulin-like growth factor-I receptor exhibits anticancer effect in
esophageal adeno-carcinoma in vitro and in vivo. Clin Cancer Res.
14:4631–4639. 2008. View Article : Google Scholar : PubMed/NCBI
|
|
36
|
Ying GX, Wen Sheng LI, Xia ZL and Tao WH:
CagA+H. pylori filtrate induces cytokine IL-8 secretion by
esophageal squamous carcinoma EC 109 cells via a p38 pathway.
Indian J Pathol Microbiol. 57:13–18. 2014. View Article : Google Scholar : PubMed/NCBI
|
|
37
|
Chan SH, Yee Ko JM, Chan KW, et al: The
ECM protein LTBP-2 is a suppressor of esophageal squamous cell
carcinoma tumor formation but higher tumor expression associates
with poor patient outcome. Int J Cancer. 129:565–573. 2011.
View Article : Google Scholar
|
|
38
|
Zhang X, Nie Y, Li X, et al: MicroRNA-181a
Functions as an Oncomir in Gastric Cancer by Targeting the Tumour
Suppressor Gene ATM. Pathol Oncol Res. 2014. View Article : Google Scholar
|
|
39
|
Zhang Y, Zheng D, Xiong Y, et al: miR-202
suppresses cell proliferation in human hepatocellular carcinoma by
downregu-lating LRP6 post-transcriptionally. FEBS Lett.
588:1913–1920. 2014. View Article : Google Scholar : PubMed/NCBI
|
|
40
|
Zhang J, Cheng C, Yuan X, He JT, Pan QH
and Sun FY: microRNA-155 acts as an oncogene by targeting the tumor
protein 53-induced nuclear protein 1 in esophageal squamous cell
carcinoma. Int J Clin Exp Pathol. 7:602–610. 2014.PubMed/NCBI
|
|
41
|
Cai C, Rajaram M, Zhou X, et al:
Activation of multiple cancer pathways and tumor maintenance
function of the 3q amplified oncogene FNDC3B. Cell Cycle.
11:1773–1781. 2012. View
Article : Google Scholar : PubMed/NCBI
|
|
42
|
Akagi T, Ito T, Kato M, et al: Chromosomal
abnormalities and novel disease-related regions in progression from
Barrett’s esophagus to esophageal adenocarcinoma. Int J Cancer.
125:2349–2359. 2009. View Article : Google Scholar : PubMed/NCBI
|
|
43
|
Kasap E, Boyacioglu SO, Korkmaz M, et al:
Aurora kinase A (AURKA) and never in mitosis gene A-related kinase
6 (NEK6) genes are upregulated in erosive esophagitis and
esophageal adenocarcinoma. Exp Ther Med. 4:33–42. 2012.PubMed/NCBI
|
|
44
|
Berger J and Bird A: Role of MBD2 in gene
regulation and tumorigenesis. Biochem Soc Trans. 33:1537–1540.
2005. View Article : Google Scholar : PubMed/NCBI
|
|
45
|
Yuan K, Xie K, Fox J, et al: Decreased
levels of miR-224 and the passenger strand of miR-221 increase
MBD2, suppressing maspin and promoting colorectal tumor growth and
metastasis in mice. Gastroenterology. 145:853–864. e8592013.
View Article : Google Scholar : PubMed/NCBI
|