Introduction
The overall age-adjusted incidence rates for all
gliomas and glioblastoma range from 4.67 to 5.73 and 0.59 to 3.69
per 100,000 individuals, respectively across the United States,
Georgia, Australia, Korea, England, Greece and Finland (1–7). The
overall survival of patients with malignant glioma has slightly
improved with the aid of radiotherapy, chemotherapy (8), tumor-treating fields (9) and advanced surgical techniques,
including fluorescence-guided surgery with 5-aminolevulinic acid
(10). However, the prognosis
remains very poor, and the median overall survival time of patients
with glioblastoma (GBM) is ~20 months (9). A more extensive surgical resection has
been suggested to be associated with longer life expectancy in
patients with malignant gliomas (11,12).
However, malignant glioma presents with highly invasive
characteristics, including subpial spread, perineural satellitosis,
perivascular satellitosis and invasion along the white matter
tracts (13), which prevent precise
determination of the extent of tumor cell infiltration by magnetic
resonance imaging (MRI) and therefore potentially contributes to
poor local control of the lesion (14,15). The
precise determination of the tumor cell infiltration extend has
therefore become crucial.
Current strategies for treatment of glioma rely
mostly on neuroimaging techniques, including MRI and computed
tomography, in patients undergoing surgery and radiotherapy, and
are used to identify regions where tumor cells exist. Sites of
blood-brain barrier disruption on contrast-enhanced T1-weighted
(T1w) images are used as surrogate markers for active tumor
regions; however, tumor cells can exist beyond the identified
regions (16). Furthermore, it has
been demonstrated that T2-weighted (T2w) hyperintense regions can
contain tumors (17,18), whereas Susheela et al
(19) reported a case of a high
grade glioma which was present beyond the MRI defined edema region,
and was demonstrated using 11C-methionine positron
emission tomography (MET-PET) (19).
A single MRI sequence may therefore be insufficient to identify
tumor regions.
Porz et al (20) evaluated the reliability of a fully
automated segmentation tool dedicated to brain tumors known as
Brain Tumor Image Analysis (BraTumIA) (20). The results demonstrated that the user
only has to load the original stacks from the Digital Imaging and
Communications in Medicine (DICOM) of the four relevant MRI
modalities, including T1w, contrast-enhanced T1w, T2w and
fluid-attenuated inversion recovery (FLAIR) images. The software
subsequently classifies GBM into seven sub-compartments, including
cerebrospinal fluid (CSF), gray matter, white matter, necrosis,
edema, non-enhancing tumor and enhancing tumor. This tool,
validated by the ‘SmartBrush’ semi-automatic user-guided and
FDA-approved segmentation technique and human experts, has been
reported to provide accurate, cross-sectional, diameter-based
assessments of tumor extent and automated volume measurement of GBM
(20). BraTumIA could also detect
additional non-enhancing tumor regions that had been obscured by
the semi-automatic segmentation tool in 16 out of 19 cases
(21), which suggests the capability
of BraTumIA to outperform semi-automatic segmentation tools.
However, validating the presence of tumor cells in BraTumIA-labeled
non-enhancing tumor regions remains necessary.
When attempting to understand the extent of brain
tumor cells invading into the brain parenchyma, MET-PET is more
effective than MRI (22–24). Kracht (23) reported an 87% sensitivity and 89%
specificity for detecting tumor tissue at a threshold of 1.3-fold
MET-PET uptake relative to normal brain tissue. Kinoshita et
al (24) also demonstrated that
MET-PET is positively correlated with glioma cell density (Fig. S1) (24). The present study aimed to validate
the quality of tumor segmentation using BraTumIA compared with that
using MET-PET.
Materials and methods
Patient selection
Data from 45 consecutive patients with newly
diagnosed and histologically confirmed grade III and IV gliomas
[according to the World Health Organization (WHO) 2007
Classification of Tumors of the Central Nervous System (25) were collected. Patients >18 years
old, underwent MRI and MET-PET as preoperative examinations between
May 2010 and March 2017 at the Osaka University Hospital and Osaka
International Cancer Institution (Osaka, Japan). The exclusion
criteria was incomplete image acquisition or previous cranial
neurosurgery. Patients included in the present study underwent
standard imaging protocols. No additional new procedures were
applied for the purpose of this study. Written informed consent was
obtained from each patient or their guardian prior to enrollment.
This study was approved by the Clinical Research Committees of
Osaka University Hospital and Osaka International Cancer
Institution. Patient characteristics are provided in Table I.
 | Table I.Clinical characteristics of
patients. |
Table I.
Clinical characteristics of
patients.
|
| WHO grade III | WHO grade IV |
|
|---|
|
|
|
|
|
|---|
|
Characteristics | Anaplastic
astrocytoma | Anaplastic
oligoastrocytoma | Anaplastic
oligodendroglioma | Glioblastoma | Total |
|---|
| Patients, n | 11 | 7 | 1 | 26 | 45 |
| Sex, n (%) |
|
|
|
|
|
|
Male | 8 (72.7) | 5 (71.4) | 1 (100) | 14 (53.8) | 28 (62.2) |
|
Female | 3 (27.3) | 2 (28.6) | 0 (0) | 12 (46.2) | 17 (37.8) |
| Mean age ± SD,
years | 58.9±16.6 | 59.4±21.3 | 35 | 59±14.4 | 58.5±15.9 |
| Scanning technique,
n |
|
|
|
|
|
| Scanned
in 3T | 10 | 5 | 1 | 24 | 40 |
| Scanned
in 1.5T | 1 | 2 | 0 | 2 | 5 |
MRI
All patients underwent T1w imaging with and without
gadolinium enhancement, (undiluted and slowly injected into the
vein of the arm). T2w and FLAIR imaging. A total of 5 cases were
scanned using a 1.5-T MR scanner, whereas 40 cases were scanned
using a 3.0-T scanner dependent on which hospital the scan was
performed at.
PET
PET studies were performed using an Eminence-G
system (Shimadzu Corporation). MET was synthesized according to the
method described by Hatakeyama et al (26) and injected intravenously in patients
at a dose of 3 MBq/kg body weight. Tracer accumulation was recorded
for 12 min in 59 or 99 transaxial sections over the entire brain.
Summed activity from 20 to 32 min following tracer injection was
used for image reconstruction. Images were stored in 256×256×59 or
99 anisotropic voxels, with each voxel being 1×1×2.6 mm.
Automated segmentation
Automatic segmentations were performed using
BraTumIA software version 2.0 (http://www.istb.unibe.ch/content/research/medical_image_analysis/software/index_eng.html)
(20). Once the original DICOM
stacks of the four MRI sequences (T1w with and without gadolinium
enhancement, T2w and FLAIR images) were loaded, the software
automatically distinguished the seven types of brain tissue, namely
CSF, gray matter, white matter, necrosis, edema, non-enhancing
tumor and enhancing tumor (Fig.
1).
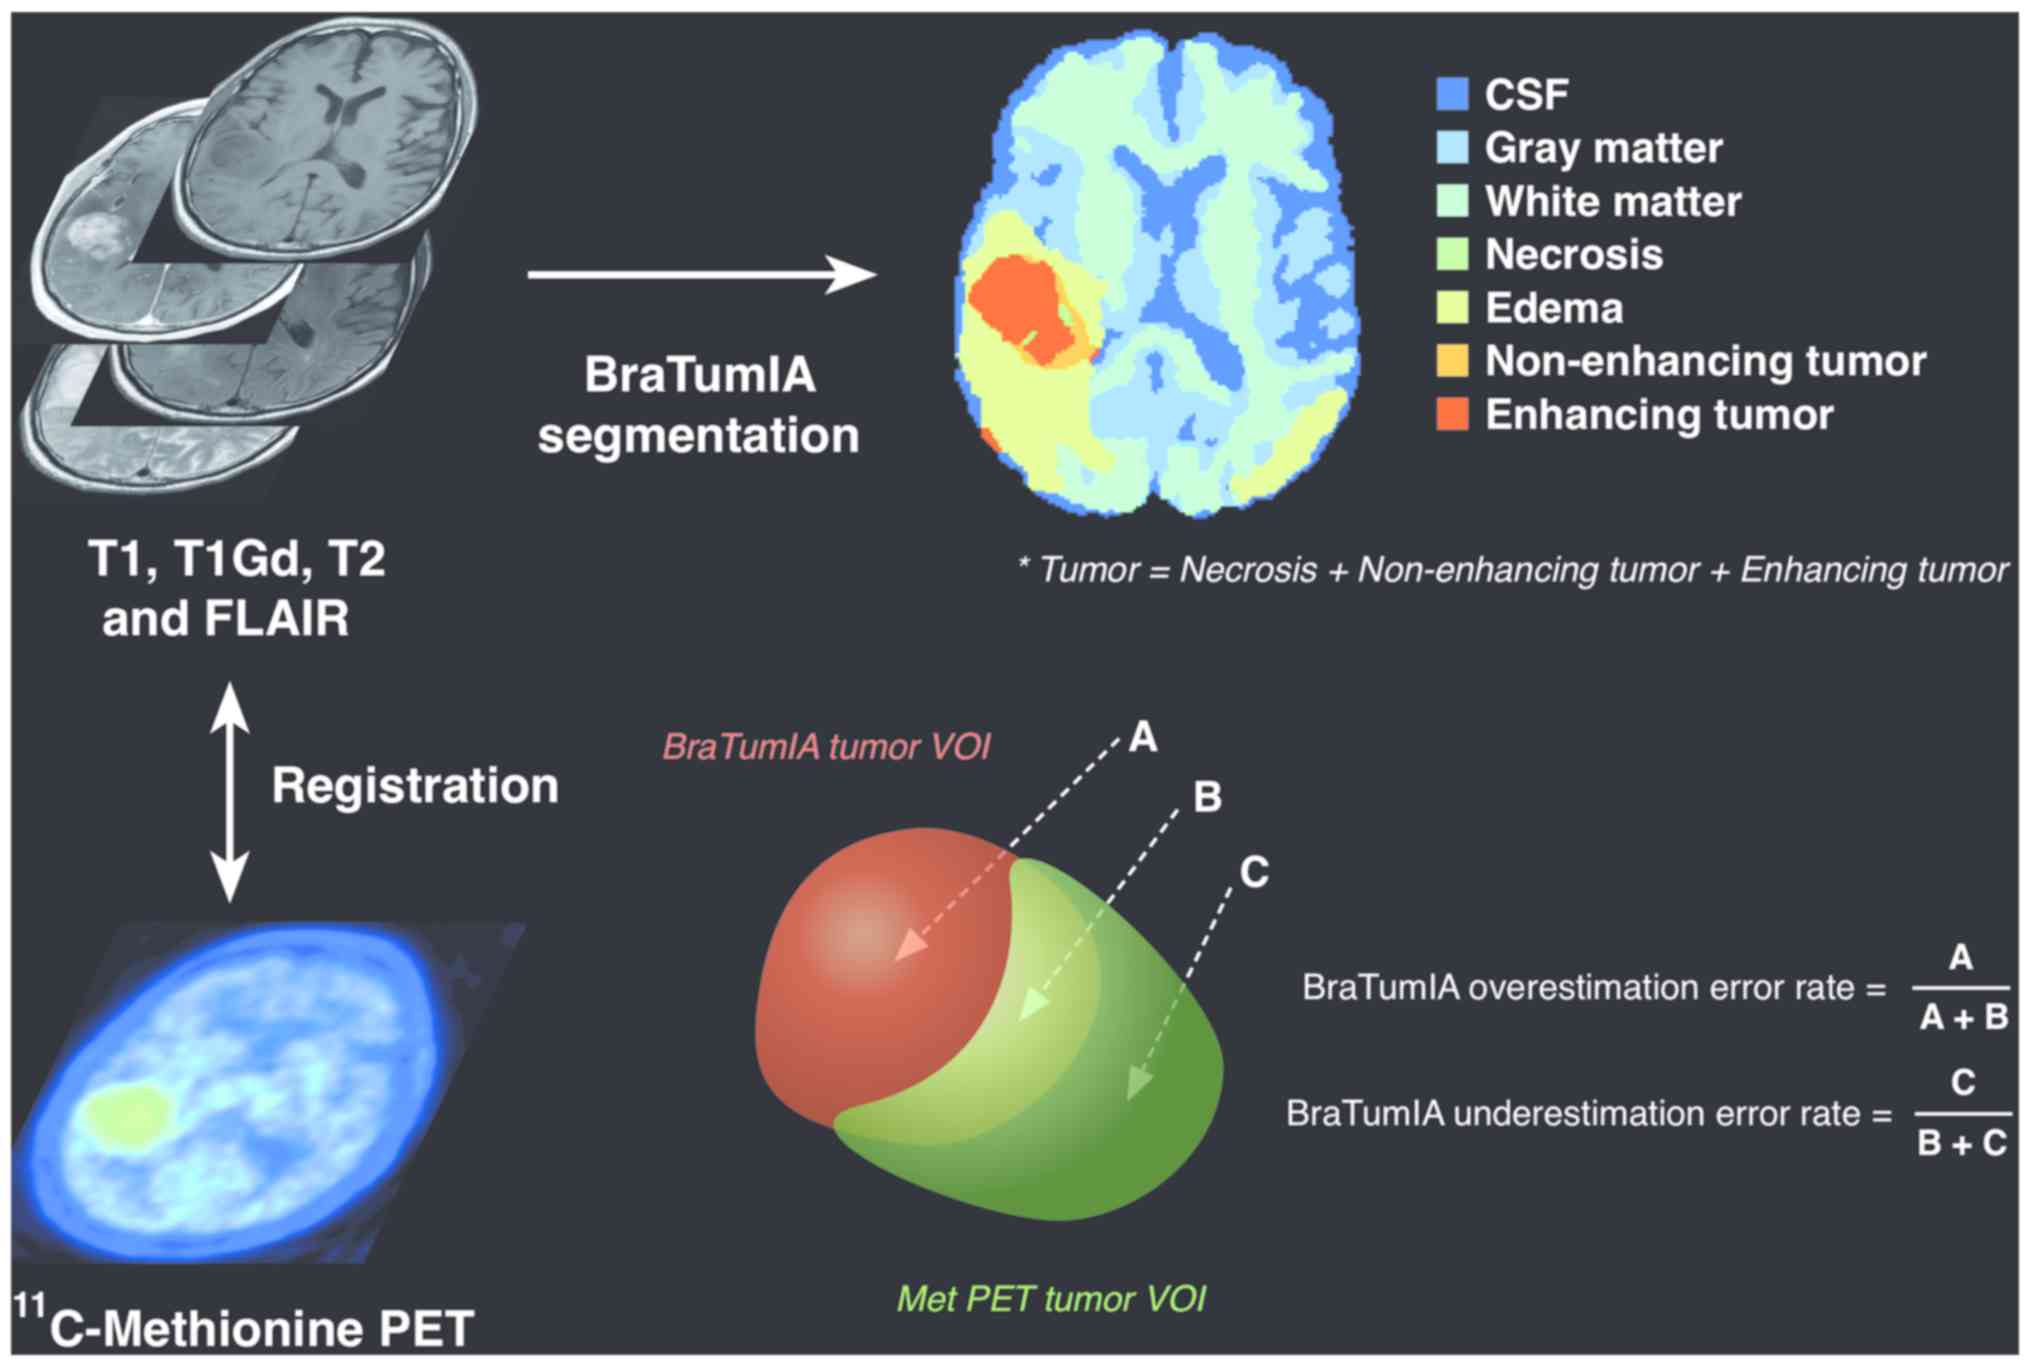 | Figure 1.Analytical workflow of the present
study. All images including 4 MR imaging sequences and
11C-methionine PET were co-registered into a common
space using a normalized mutual information algorithm to enable
voxel-by-voxel analysis. Subsequently, all MR images were sent to
BraTumIA for automatic region segmentation. Tumor regions were
separately segmented in the common space by MET-PET using various
cut-off thresholds. Region segmentation accuracy of BraTumIA was
calculated considering MET-PET based segmentation as the gold
standard. The BraTumIA false-positive fraction was defined as A/(A
+ B), and the BraTumIA false-negative fraction was defined as C/(B
+ C), where A represents the volume of the region segmented by
BraTumIA but outside the MET-PET segmented region, B represents the
volume of the region segmented by both BraTumIA and MET-PET, and C
represents the volume of the region segmented by MET-PET but
outside the BraTumIA segmented region. Values are reported as
ratios of either A/(A + B) or C/(B + C), referred to as the
false-positive and false-negative fractions, respectively.
BraTumIA, Brain Tumor Image Analysis; CSF, cerebrospinal fluid;
FLAIR, fluid-attenuated inversion recovery; Gd, gadolinium; MET,
11C-methionine; MR, magnetic resonance; PET, positron
emission tomography; VOI, voxel of interest. |
Image fusion and registration
MET-PET and classification of MRI results by
BraTumIA were obtained, and images were registered using the Vinci
image-analyzing version 4 (Max-Planck Institute for Neurological
Research; http://www.nf.mpg.de/vinci/). A
normalized mutual information algorithm was used for image
registration, and MET-PET was resliced into MR images, which
enabled voxel-by-voxel analysis of different imaging
modalities.
Data processing and region
segmentation accuracy measures
Data sets were exported to in-house software written
in MATLAB R2016b (MathWorks, Inc.) for further analysis. For the
tumor-to-normal tissue ratio (T/Nr) of MET-PET, the standardized
uptake value of the contralateral tumor-unaffected gray matter in
the axial plane of the cortex was averaged, and the derived value
was used to normalize the standardized uptake value in a voxel-wise
manner, enabling calculation of T/Nr within the voxel-of-interest.
Regions detected by BraTumIA exhibiting the presence of tumor were
labeled as A + B, where A is the area identified as tumor
exclusively by BraTumIA and B is the area identified as tumor by
BraTumIA and MET-PET (Fig. 1). In
addition, regions of high accumulation on MET-PET were labeled as B
+ C, where C is the area identified as tumor exclusively by MET-PET
and B is the area identified as tumor by BraTumIA and MET-PET. The
BraTumIA false-positive fraction was defined as A/(A + B) and the
BraTumIA false-negative fraction was defined as C/(B + C).
Cell density
Kinoshita et al (24) reported that T/Nr from MET-PET is
positively correlated with cell density in high-grade glioma as
determined by liner regression analysis using Pearson's correlation
analysis (Fig. S1). Cell density
data in Figs. 2–4 were obtained from Fig. S1.
Statistical analysis
Statistical analysis was performed using JMP version
11 software (SAS Institute, Inc.). Data are presented as the mean ±
standard deviation (SD). The significance of differences between
groups was examined using Student's t-test or one-way analysis of
variance followed by the Tukey-Kramer post hoc test. Liner
regression analysis using Pearson's correlation analysis was used
to assess tumor cell density and MET-PET uptake. P<0.05 was
considered to indicate a statistically significant difference.
Results
Patient population
The mean age of the patients at the time of
pre-operative imaging was 58.5±15.9 years (range, 29–88 years). The
45 patients were comprised of 28 males and 17 females. GBM was
identified in 26 patients. All patients were histopathologically
diagnosed according to the WHO 2007 Classification of Tumors of the
Central Nervous System.
Brain segmentation by BraTumIA
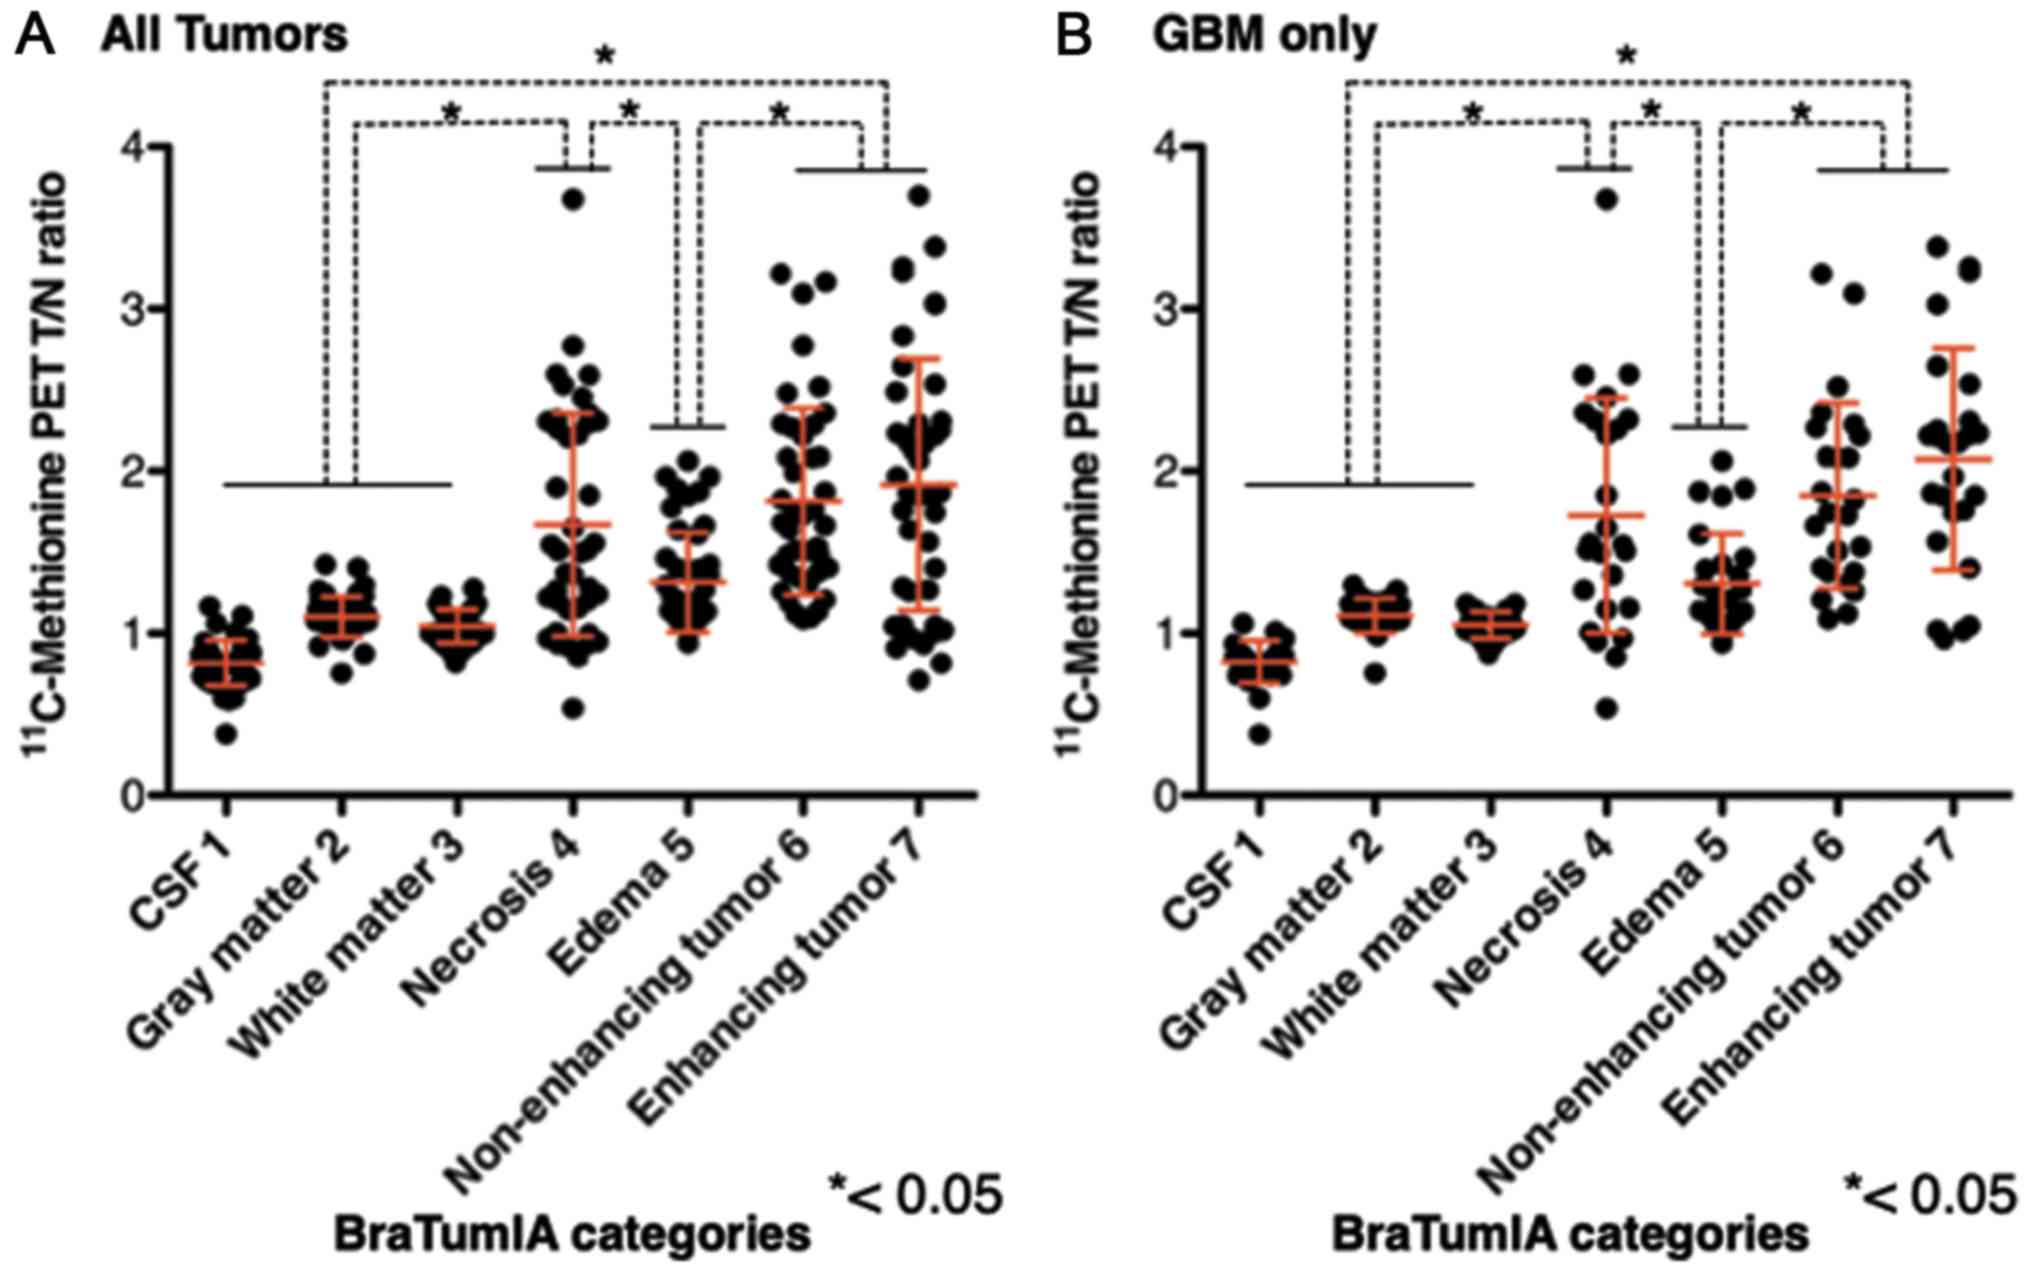
T/Nr values for necrosis, non-enhancing tumor and
enhancing tumor were significantly higher compared with those for
other segments (P<0.001). No significant differences in T/Nr
were identified between necrosis, non-enhancing tumor and enhancing
tumor (Fig. 5). These observations
were true for analyses of Grade III glioma and GBM and when
confined to only GBM. Notably, significant overlaps were observed
between segments 4–7 (necrosis, edema, non-enhancing tumor and
enhancing tumor) with respect to MET-PET T/Nr.
Tumor distributions with BraTumIA and
MET-PET
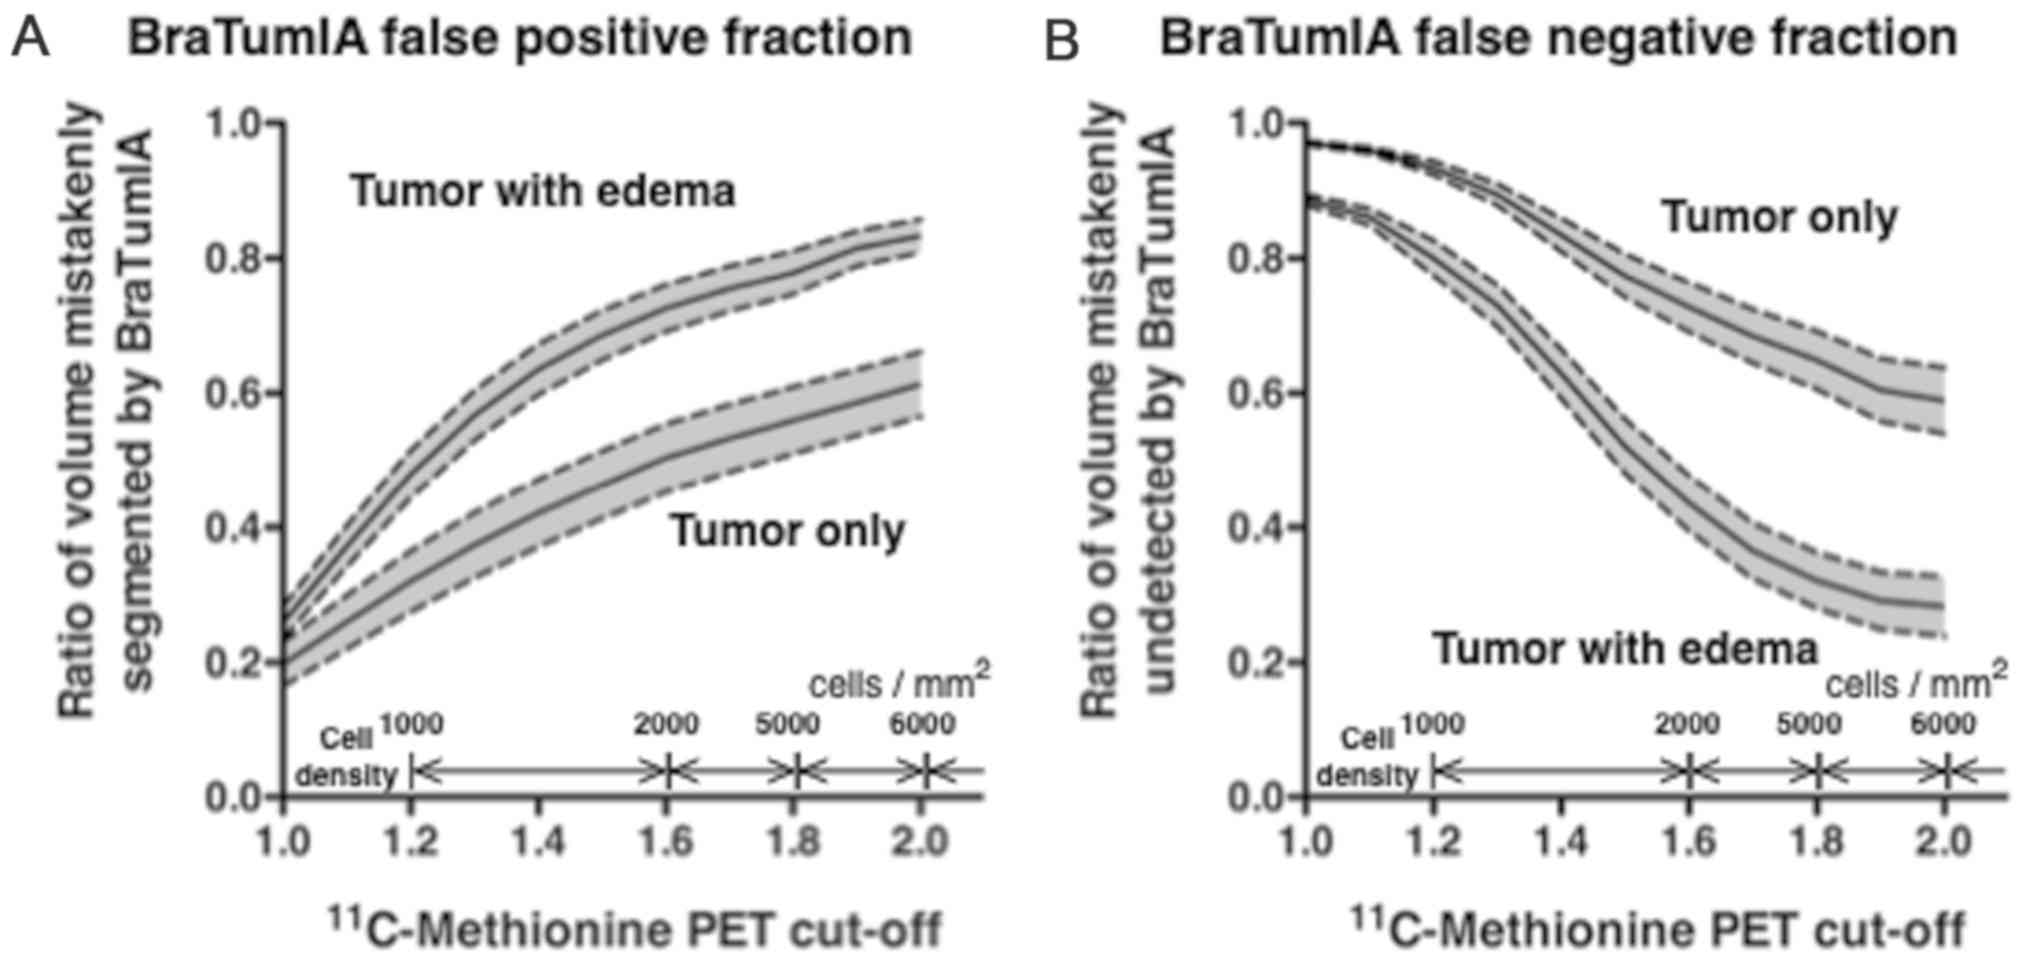
Porz et al (20) defined complete tumor volume as areas
encompassing necrosis (segment 4), non-enhancing tumor (segment 6)
and enhancing tumor (segment 7). Segments 4+6+7 were therefore
initially defined as the region of tumor presence on BraTumIA
(region A + B). When T/Nr threshold was set at 1.3, the BraTumIA
false-positive fraction was ~0.4 and the false-negative fraction
was 0.9. This threshold was close to the threshold proposed by
Kracht (23) that discriminates
glioma tissues from normal brain tissues. When a T/Nr threshold of
2.0 was used, the false-positive fraction with BraTumIA increased
to 0.6, whereas the false-negative fraction with BraTumIA decreased
to 0.6 (Fig. 2).
Subsequently, the effect of the edema region on
BraTumIA was investigated. Segments 4+5+6+7 were defined as the
region of tumor existence for this purpose (region A + B). When the
T/Nr threshold was set to 1.3, the false-positive fraction with
BraTumIA was ~0.6 and the false-negative fraction was 0.7. When a
T/Nr threshold of 2.0 was used, the false-positive fraction with
BraTumIA increased to 0.8, whereas the false-negative fraction
decreased to 0.3 (Fig. 2).
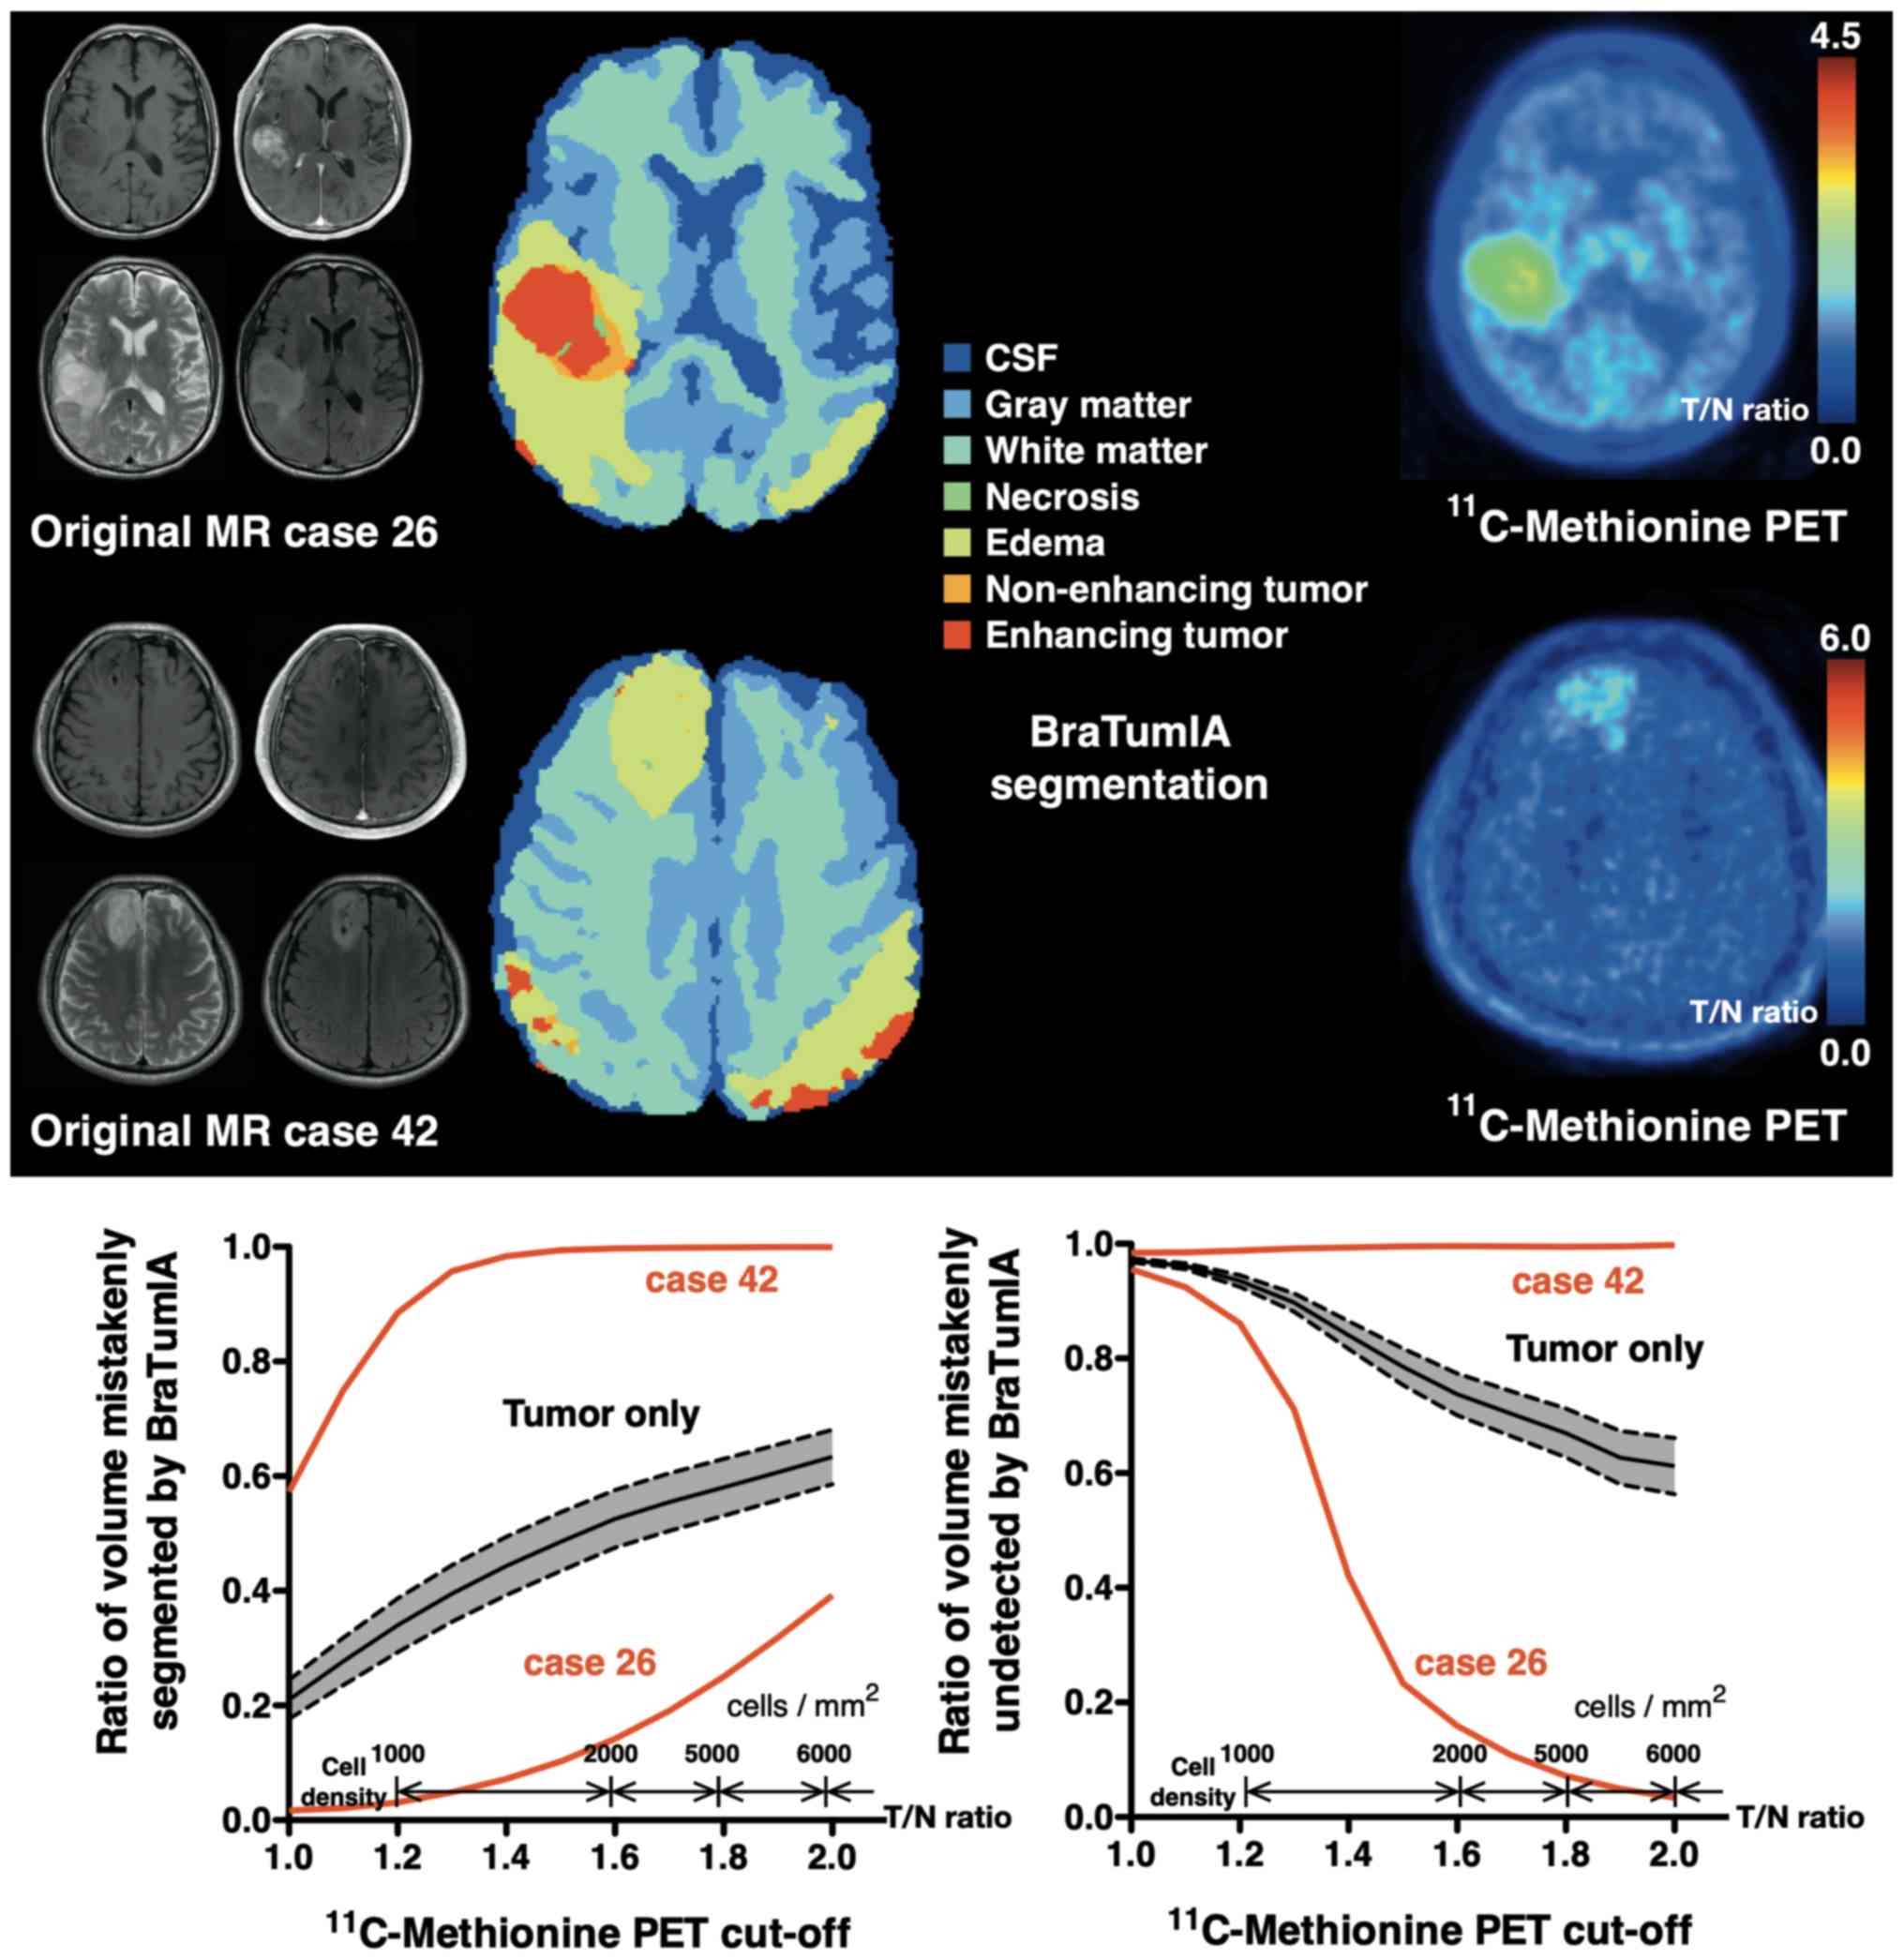
Fig. 3 illustrates a
patient case (original MR case no. 26) in which the region of tumor
existence on BraTumIA (segment 4+6+7) and the high accumulation
region on MET-PET matched well. The BraTumIA false-positive
fraction was <0.1 when the T/Nr threshold was 1.3, and was still
~0.4 even with a T/Nr threshold of 2.0. Furthermore, the BraTumIA
false-negative fraction was ~0.6 when the T/Nr threshold was 1.3
and decreased to <0.1 when the T/Nr threshold was increased to
2.0. Conversely, Fig. 3 illustrates
a patient case (original MR case no. 42) in which the region of
tumor existence on BraTumIA (segment 4+6+7) and the
high-accumulation region on MET-PET showed a large discrepancy.
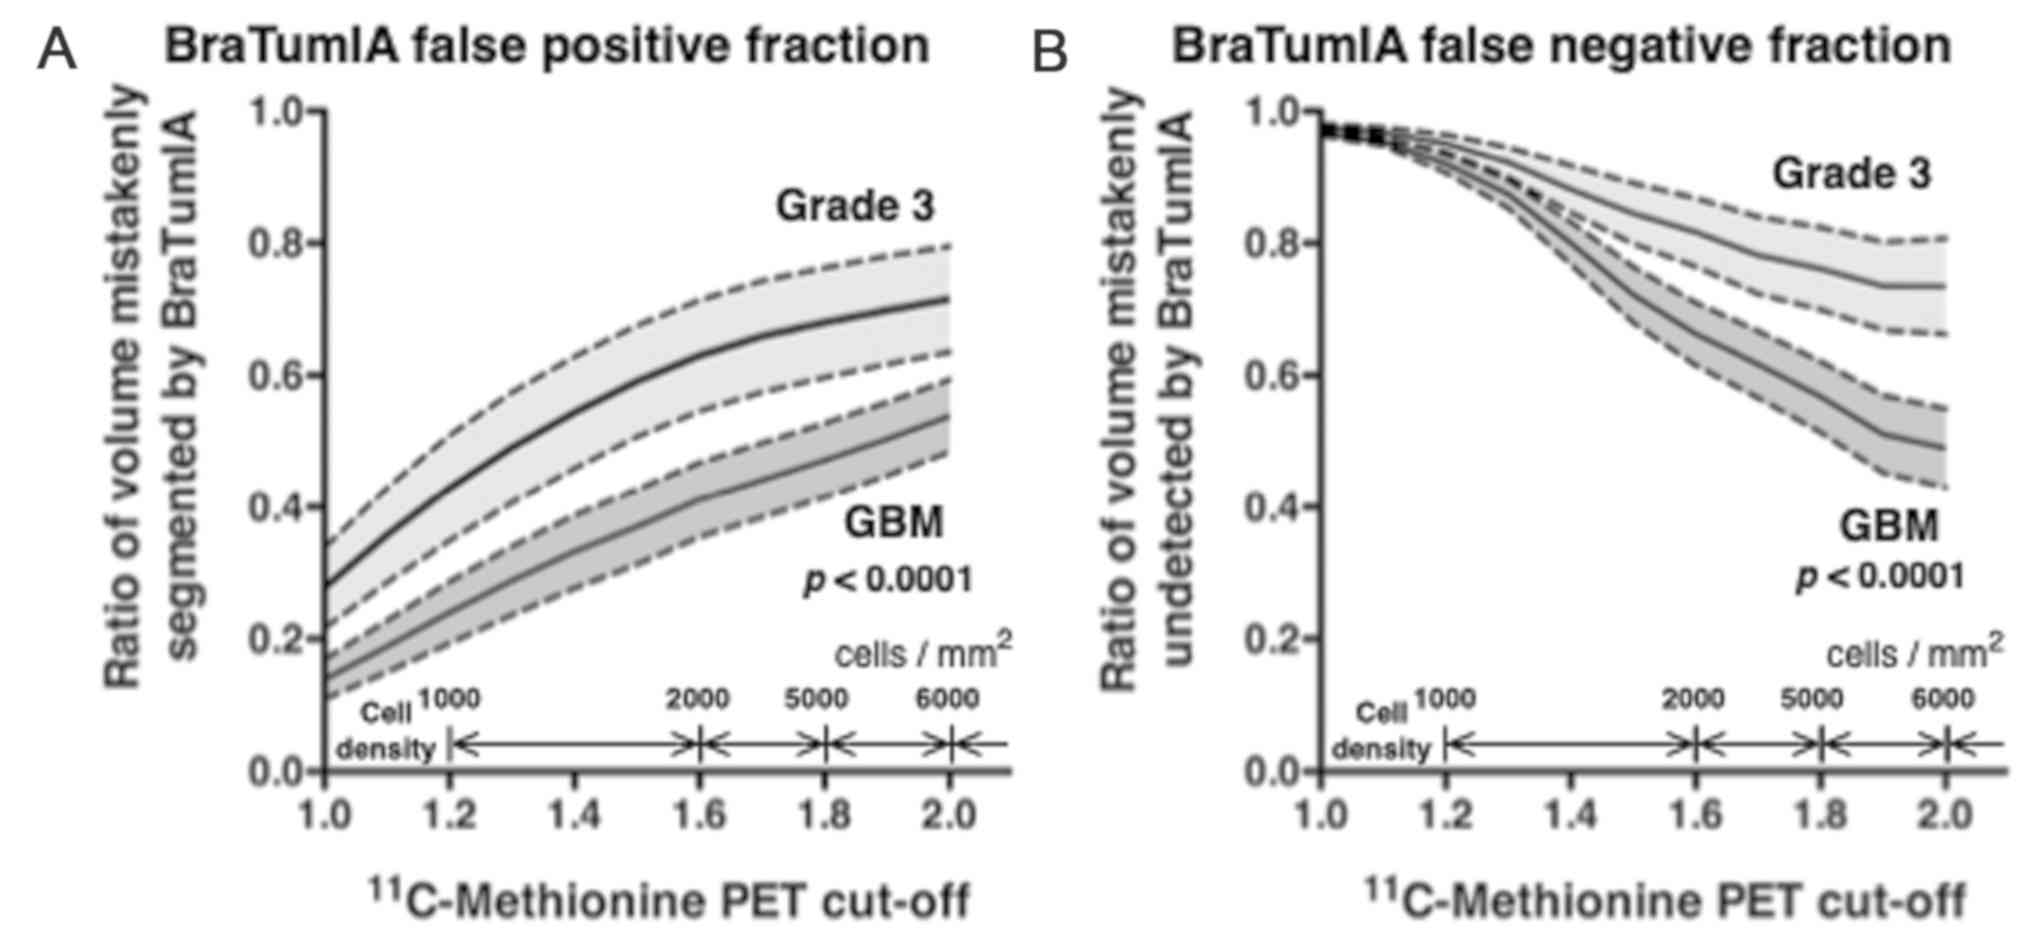
With regards to GBM, when the T/Nr threshold was set
to 1.3, the BraTumIA false-positive fraction was ~0.3 and the
false-negative fraction was ~0.9. When a T/Nr threshold of 2.0 was
used, these errors were both ~0.5 (Fig.
4). For grade III glioma, when the T/Nr threshold was 1.3, the
BraTumIA false-positive fraction was ~0.5 and the false-negative
fraction was ~0.95. When a T/Nr threshold of 2.0 was used, these
errors were both ~0.7 (Fig. 4).
Discussion
The present study attempted to validate BraTumIA as
a method for GBM diagnosis by comparing it to the gold standard
MET-PET. To the best of our knowledge, this type of validation has
not yet been performed. The results demonstrated that BraTumIA
presented a significantly higher T/Nr in the enhancing tumor
region, non-enhancing tumor region and necrosis region compared
with other regions. These regions were defined as ‘the complete
tumor volume’ by Porz et al (20) and the results from this study
confirmed that BraTumIA could recognize regions of tumor existence
within the brain. In particular, T/Nr values in necrotic lesions
were significantly high, suggesting limitations to the tumor
segmentation capability of BraTumIA. Kracht (23) described a mean ± SD threshold of
relative MET uptake of 1.96±0.47 for solid regions and 1.74±0.52
for tumor-infiltrated regions in GBM (23). When considering enhancing tumor
regions on BraTumIA as solid regions and non-enhancing tumor
regions as infiltrated regions, the results from the present study
were comparable to those described by Kracht (23). Regions of necrosis exhibited lower
T/Nr values compared with enhancing and non-enhancing tumor
regions. Goldman et al (27)
described anaplastic regions in high-grade gliomas as having higher
MET uptake compared with regions without histological signs of
anaplasia, and further reported that the presence of necrosis in
anaplastic samples caused decreased MET uptake. In addition,
Goldman et al (27) reported
that the mean ± SD T/Nr of anaplastic samples with no necrosis was
2.72±0.90, whereas it was 1.84±1.10 and 1.20±0.36 for regions of
focal necrosis and extensive necrosis, respectively. These results
are comparable to the results obtained in the present study. T/Nr
in regions of edema tended to be higher than in CSF, gray matter or
white matter, although the difference was not significant.
Kinoshita et al (24)
reported a positive correlation of MET-PET with glioma cell
density. Subsequently, regions of edema segmented by BraTumIA may
have contained active tumor cells detected by MET-PET. Furthermore,
a significant overlap was observed between segments 4–7 (necrosis,
edema, non-enhancing tumor and enhancing tumor) with respect to the
MET-PET T/Nr. Although BraTumIA could identify four out of the
seven segments or brain regions (CSF, gray matter, white matter,
enhancing tumor), identification of the remaining three segments
(necrosis, edema and non-enhancing tumor) was more problematic. For
example, the MET-PET T/Nr of the necrosis region significantly
overlapped with that of the enhancing tumor, suggesting that the
algorithm over-segmented regions of necrosis.
In the present study, the complete tumor region was
defined as regions encompassing necrosis, non-enhancing tumor and
enhancing tumor on BraTumIA, similarly to the method described by
Porz et al (20). Adding
edema regions to regions of tumor existence decreased the
false-negative fraction for BraTumIA, but increased the
false-positive fraction, as predicted. Overall, although BraTumIA
may be able to distinguish tumor and other regions, including
regions of edema, the spatial concordance rate with MET-PET
remained unsatisfactory. Miwa et al (28) reported that only 58.6% of MET uptake
area is included within the gadolinium-enhanced area in GBM.
Similarly, Grosu et al (29)
reported that only 31.6% of the MET uptake area is included within
the gadolinium-enhanced area, and that 56.5% of the MET uptake area
is included within the area of T2 hyperintensity in high-grade
gliomas. Furthermore, a recent study demonstrated that the
diagnostic accuracy of MET-PET is better than that of conventional
anatomical MR in high-grade glioma, which is similar to the results
from the current study (30) and
suggests that reliance on MRI alone for glioma segmentation may
require caution. Furthermore, BraTumIA had limited
lesion-segmentation capability for non-enhancing lesions. In
addition, the results demonstrated that a visually well-recognized
non-enhancing lesion in the right frontal lobe was mis-segmented as
‘edema’, which was likely caused by the fact that no information on
tumor enhancement by contrast agents is available for BraTumIA.
When comparing GBM and WHO grade III gliomas,
BraTumIA performed significantly better in accuracy for GBM than
for grade III tumors. One possible reason for this result may be
associated with the gadolinium-enhancing characteristics of the
tumor, since contrast enhancement of the tumor is known to be
associated with glioma grade (19,31).
Porz et al (20) demonstrated
that BraTumIA could detect the contrast-enhancing tumor region with
high accuracy. This result raised some concerns regarding the use
of BraTumIA in non-GBM gliomas, as the segmentation accuracy may be
lower than that expected by researchers.
BraTumIA has been used to estimate the extent of
resection and residual tumor volume in patients with GBM (32), and has been reported to be suitable
for the follow-up of GBM progression (33). Dextraze et al (34) reported that MRI imaging analyzed by
BraTumIA were associated with signaling pathway activities and
survival in GBM (34). Although
these examples show the potential of BraTumIA to analyze clinical
data from patients with gliomas, the results from the present study
indicated that caution is warranted when fully relying on this
technique, and that the results obtained using this novel
technology should be carefully interpreted.
Some limitations should be addressed for the current
study. MET-PET was considered as the gold standard when assessing
the accuracy of lesion extraction using BraTumIA. Although MET-PET
has frequently been described as a useful tool to detect tumor cell
infiltration beyond the primary enhancing lesion (23,24,35–37), the
lesion presentation is not mechanistically or functionally linked
with MRI. As a result, the accuracy of lesion segmentation with
BraTumIA presented in the current study depended greatly on the
cut-off values adopted from MET-PET.
In conclusion, BraTumIA brain tumor
auto-segmentation software has been validated by MET-PET. Although
the results from the present study indicated that BraTumIA may be
able to detect enhancing tumors, non-enhancing tumors and necrosis,
the rate of spatial concordance with MET-PET was relatively low.
Careful interpretation is therefore required when using this
technique.
Supplementary Material
Supporting Data
Acknowledgements
The authors would like to thank Ms. Ai Takada
(Institute for Clinical Research, Osaka National Hospital, National
Hospital Organizatio) and Ms. Mariko Kakinoki (Department of
Neurosurgery, Osaka International Cancer Institute) for their
support in conducting this research.
Funding
The present study was supported by JSPS KAKENHI
(grants nos. 16K10778 and 17H05308), the Osaka Medical Research
Foundation for Intractable Diseases (funding information not
applicable), the Uehara Memorial Foundation (funding information
not applicable) and the MSD Life Science Foundation (funding
information not applicable).
Availability of data and materials
The datasets used and/or analyzed during the present
study are available from the corresponding author on reasonable
request.
Authors' contributions
TO and MK wrote the manuscript and collected the
data. TO, MK and HK designed the study and analyzed the data. HA,
NK, YF, YK collected the tumor samples. MS, YW, KN collected the
MRI images. ES and JH collected the MET-PET images. All authors
read and approved the final manuscript.
Ethics approval and consent to
participate
The present study was approved by the Clinical
Research Committees of Osaka University Hospital and Osaka
International Cancer Institution (Osaka, Japan). Signed informed
consent was obtained from the patients or their guardians for
participation in the present study.
Patient consent for publication
Not applicable.
Competing interests
The authors declare that they have no competing
interests.
References
|
1
|
Ostrom QT, Gittleman H, Farah P, Ondracek
A, Chen Y, Wolinsky Y, Stroup NE, Kruchko C and Barnholtz-Sloan JS:
CBTRUS statistical report: Primary brain and central nervous system
tumors diagnosed in the United States in 2006–2010. Neuro Oncol. 15
(Suppl 2):ii1–ii56. 2013. View Article : Google Scholar : PubMed/NCBI
|
|
2
|
Gigineishvili D, Shengelia N, Shalashvili
G, Rohrmann S, Tsiskaridze A and Shakarishvili R: Primary brain
tumour epidemiology in Georgia: First-year results of a
population-based study. J Neurooncol. 112:241–246. 2013. View Article : Google Scholar : PubMed/NCBI
|
|
3
|
Dobes M, Khurana VG, Shadbolt B, Jain S,
Smith SF, Smee R, Dexter M and Cook R: Increasing incidence of
glioblastoma multiforme and meningioma, and decreasing incidence of
Schwannoma (2000–2008): Findings of a multicenter Australian study.
Surg Neurol Int. 2:1762011. View Article : Google Scholar : PubMed/NCBI
|
|
4
|
Gousias K, Markou M, Voulgaris S, Goussia
A, Voulgari P, Bai M, Polyzoidis K, Kyritsis A and Alamanos Y:
Descriptive epidemiology of cerebral gliomas in northwest Greece
and study of potential predisposing factors, 2005–2007.
Neuroepidemiology. 33:89–95. 2009. View Article : Google Scholar : PubMed/NCBI
|
|
5
|
Larjavaara S, Mäntylä R, Salminen T,
Haapasalo H, Raitanen J, Jääskeläinen J and Auvinen A: Incidence of
gliomas by anatomic location. Neuro Oncol. 9:319–325. 2007.
View Article : Google Scholar : PubMed/NCBI
|
|
6
|
Arora RS, Alston RD, Eden TO, Estlin EJ,
Moran A and Birch JM: Age-incidence patterns of primary CNS tumors
in children, adolescents, and adults in England. Neuro Oncol.
11:403–413. 2009. View Article : Google Scholar : PubMed/NCBI
|
|
7
|
Lee CH, Jung KW, Yoo H, Park S and Lee SH:
Epidemiology of primary brain and central nervous system tumors in
Korea. J Korean Neurosurg Soc. 48:145–152. 2010. View Article : Google Scholar : PubMed/NCBI
|
|
8
|
Stupp R, Mason WP, van den Bent MJ, Weller
M, Fisher B, Taphoorn MJ, Belanger K, Brandes AA, Marosi C, Bogdahn
U, et al: Radiotherapy plus concomitant and adjuvant temozolomide
for glioblastoma. N Engl J Med. 352:987–996. 2005. View Article : Google Scholar : PubMed/NCBI
|
|
9
|
Stupp R, Taillibert S, Kanner AA, Kesari
S, Steinberg DM, Toms SA, Taylor LP, Lieberman F, Silvani A, Fink
KL, et al: Maintenance therapy with tumor-treating fields plus
temozolomide vs temozolomide alone for glioblastoma: A randomized
clinical trial. JAMA. 314:2535–2543. 2015. View Article : Google Scholar : PubMed/NCBI
|
|
10
|
Stummer W, Pichlmeier U, Meinel T,
Wiestler OD, Zanella F and Reulen HJ; ALA-Glioma Study Group, :
Fluorescence-guided surgery with 5-aminolevulinic acid for
resection of malignant glioma: A randomised controlled multicentre
phase III trial. Lancet Oncol. 7:392–401. 2006. View Article : Google Scholar : PubMed/NCBI
|
|
11
|
Sanai N and Berger MS: Glioma extent of
resection and its impact on patient outcome. Neurosurgery.
62:753–764. 2008. View Article : Google Scholar : PubMed/NCBI
|
|
12
|
Devaux BC, O'Fallon JR and Kelly PJ:
Resection, biopsy, and survival in malignant glial neoplasms: A
retrospective study of clinical parameters, therapy, and outcome. J
Neurosurg. 78:767–775. 1993. View Article : Google Scholar : PubMed/NCBI
|
|
13
|
Zagzag D, Esencay M, Mendez O, Yee H,
Smirnova I, Huang Y, Chiriboga L, Lukyanov E, Liu M and Newcomb EW:
Hypoxia- and vascular endothelial growth factor-induced stromal
cell-derived factor-1alpha/CXCR4 expression in glioblastomas: One
plausible explanation of Scherer's structures. Am J Pathol.
173:545–560. 2008. View Article : Google Scholar : PubMed/NCBI
|
|
14
|
Kotrotsou A, Elakkad A, Sun J, Thomas GA,
Yang D, Abrol S, Wei W, Weinberg JS, Bakhtiari AS, Kircher MF, et
al: Multi-center study finds postoperative residual non-enhancing
component of glioblastoma as a new determinant of patient outcome.
J Neurooncol. 139:125–133. 2018. View Article : Google Scholar : PubMed/NCBI
|
|
15
|
Ellingson BM, Abrey LE, Nelson SJ,
Kaufmann TJ, Garcia J, Chinot O, Saran F, Nishikawa R, Henriksson
R, Mason WP, et al: Validation of postoperative residual
contrast-enhancing tumor volume as an independent prognostic factor
for overall survival in newly diagnosed glioblastoma. Neuro Oncol.
20:1240–1250. 2018. View Article : Google Scholar : PubMed/NCBI
|
|
16
|
Pirzkall A, McKnight TR, Graves EE, Carol
MP, Sneed PK, Wara WW, Nelson SJ, Verhey LJ and Larson DA:
MR-spectroscopy guided target delineation for high-grade gliomas.
Int J Radiat Oncol Biol Phys. 50:915–928. 2001. View Article : Google Scholar : PubMed/NCBI
|
|
17
|
Daumas-Duport C, Monsaigneon V, Blond S,
Munari C, Musolino A, Chodkiewicz JP and Missir O: Serial
stereotactic biopsies and CT scan in gliomas: Correlative study in
100 astrocytomas, oligo-astrocytomas and oligodendrocytomas. J
Neurooncol. 4:317–328. 1987. View Article : Google Scholar : PubMed/NCBI
|
|
18
|
Kelly PJ, Daumas-Duport C, Kispert DB,
Kall BA, Scheithauer BW and Illig JJ: Imaging-based stereotaxic
serial biopsies in untreated intracranial glial neoplasms. J
Neurosurg. 66:865–874. 1987. View Article : Google Scholar : PubMed/NCBI
|
|
19
|
Susheela SP, Revannasiddaiah S,
Madhusudhan N and Bijjawara M: The demonstration of extension of
high-grade glioma beyond magnetic resonance imaging defined edema
by the use of (11) C-methionine positron emission tomography. J
Cancer Res Ther. 9:715–717. 2013. View Article : Google Scholar : PubMed/NCBI
|
|
20
|
Porz N, Bauer S, Pica A, Schucht P, Beck
J, Verma RK, Slotboom J, Reyes M and Wiest R: Multi-modal
glioblastoma segmentation: Man versus machine. PLoS One.
9:e968732014. View Article : Google Scholar : PubMed/NCBI
|
|
21
|
Porz N, Habegger S, Meier R, Verma R,
Jilch A, Fichtner J, Knecht U, Radina C, Schucht P, Beck J, et al:
Fully automated enhanced tumor compartmentalization: Man vs.
machine reloaded. PLoS One. 11:e01653022016. View Article : Google Scholar : PubMed/NCBI
|
|
22
|
Herholz K, Hölzer T, Bauer B, Schröder R,
Voges J, Ernestus RI, Mendoza G, Weber-Luxenburger G, Löttgen J,
Thiel A, et al: 11C-methionine PET for differential diagnosis of
low-grade gliomas. Neurology. 50:1316–1322. 1998. View Article : Google Scholar : PubMed/NCBI
|
|
23
|
Kracht LW, Miletic H, Busch S, Jacobs AH,
Voges J, Hoevels M, Klein JC, Herholz K and Heiss WD: Delineation
of brain tumor extent with [11C]L-methionine positron emission
tomography: Local comparison with stereotactic histopathology. Clin
Cancer Res. 10:7163–7170. 2004. View Article : Google Scholar : PubMed/NCBI
|
|
24
|
Kinoshita M, Arita H, Okita Y, Kagawa N,
Kishima H, Hashimoto N, Tanaka H, Watanabe Y, Shimosegawa E,
Hatazawa J, et al: Comparison of diffusion tensor imaging and
11C-methionine positron emission tomography for reliable
prediction of tumor cell density in gliomas. J Neurosurg.
125:1136–1142. 2016. View Article : Google Scholar : PubMed/NCBI
|
|
25
|
Louis DN, Ohgaki H, Wiestler OD, Cavenee
WK, Burger PC, Jouvet A, Scheithauer BW and Kleihues P: The 2007
WHO classification of tumours of the central nervous system. Acta
Neuropathol. 114:97–109. 2007. View Article : Google Scholar : PubMed/NCBI
|
|
26
|
Hatakeyama T, Kawai N, Nishiyama Y,
Yamamoto Y, Sasakawa Y, Ichikawa T and Tamiya T: 11C-methionine
(MET) and 18F-fluorothymidine (FLT) PET in patients with newly
diagnosed glioma. Eur J Nucl Med Mol Imaging. 35:2009–2017. 2008.
View Article : Google Scholar : PubMed/NCBI
|
|
27
|
Goldman S, Levivier M, Pirotte B, Brucher
JM, Wikler D, Damhaut P, Dethy S, Brotchi J and Hildebrand J:
Regional methionine and glucose uptake in high-grade gliomas: A
comparative study on PET-guided stereotactic biopsy. J Nucl Med.
38:1459–1462. 1997.PubMed/NCBI
|
|
28
|
Miwa K, Shinoda J, Yano H, Okumura A,
Iwama T, Nakashima T and Sakai N: Discrepancy between lesion
distributions on methionine PET and MR images in patients with
glioblastoma multiforme: Insight from a PET and MR fusion image
study. J Neurol Neurosurg Psychiatry. 75:1457–1462. 2004.
View Article : Google Scholar : PubMed/NCBI
|
|
29
|
Grosu AL, Weber WA, Riedel E, Jeremic B,
Nieder C, Franz M, Gumprecht H, Jaeger R, Schwaiger M and Molls M:
L-(methyl-11C) methionine positron emission tomography for target
delineation in resected high-grade gliomas before radiotherapy. Int
J Radiat Oncol Biol Phys. 63:64–74. 2005. View Article : Google Scholar : PubMed/NCBI
|
|
30
|
Verburg N, Hoefnagels FWA, Barkhof F,
Boellaard R, Goldman S, Guo J, Heimans JJ, Hoekstra OS, Jain R,
Kinoshita M, et al: Diagnostic accuracy of neuroimaging to
delineate diffuse gliomas within the brain: A meta-analysis. AJNR
Am J Neuroradiol. 38:1884–1891. 2017. View Article : Google Scholar : PubMed/NCBI
|
|
31
|
Tynninen O, Aronen HJ, Ruhala M, Paetau A,
Von Boguslawski K, Salonen O, Jääskeläinen J and Paavonen T: MRI
enhancement and microvascular density in gliomas. Correlation with
tumor cell proliferation. Invest Radiol. 34:427–434. 1999.
View Article : Google Scholar : PubMed/NCBI
|
|
32
|
Meier R, Porz N, Knecht U, Loosli T,
Schucht P, Beck J, Slotboom J, Wiest R and Reyes M: Automatic
estimation of extent of resection and residual tumor volume of
patients with glioblastoma. J Neurosurg. 127:798–806. 2017.
View Article : Google Scholar : PubMed/NCBI
|
|
33
|
Meier R, Knecht U, Loosli T, Bauer S,
Slotboom J, Wiest R and Reyes M: Clinical evaluation of a
fully-automatic segmentation method for longitudinal brain tumor
volumetry. Sci Rep. 6:233762016. View Article : Google Scholar : PubMed/NCBI
|
|
34
|
Dextraze K, Saha A, Kim D, Narang S,
Lehrer M, Rao A, Narang S, Rao D, Ahmed S, Madhugiri V, et al:
Spatial habitats from multiparametric MR imaging are associated
with signaling pathway activities and survival in glioblastoma.
Oncotarget. 8:112992–113001. 2017. View Article : Google Scholar : PubMed/NCBI
|
|
35
|
Ullrich RT, Kracht L, Brunn A, Herholz K,
Frommolt P, Miletic H, Deckert M, Heiss WD and Jacobs AH:
Methyl-L-11C-methionine PET as a diagnostic marker for malignant
progression in patients with glioma. J Nucl Med. 50:1962–1968.
2009. View Article : Google Scholar : PubMed/NCBI
|
|
36
|
Kinoshita M, Arita H, Goto T, Okita Y,
Isohashi K, Watabe T, Kagawa N, Fujimoto Y, Kishima H, Shimosegawa
E, et al: A novel PET index, 18F-FDG-11C-methionine uptake
decoupling score, reflects glioma cell infiltration. J Nucl Med.
53:1701–1708. 2012. View Article : Google Scholar : PubMed/NCBI
|
|
37
|
Wu R, Watanabe Y, Arisawa A, Takahashi H,
Tanaka H, Fujimoto Y, Watabe T, Isohashi K, Hatazawa J and Tomiyama
N: Whole-tumor histogram analysis of the cerebral blood volume map:
Tumor volume defined by 11C-methionine positron emission tomography
image improves the diagnostic accuracy of cerebral glioma grading.
Jpn J Radiol. 35:613–621. 2017. View Article : Google Scholar : PubMed/NCBI
|